
Abstract
Background:
Radiologic justification for endovascular treatment of a dialysis arteriovenous fistula circuit stenosis is currently based on ⩾50% severity. However, the clinical significance of any given stenosis is not always clear. The minimum luminal diameter of any stenotic lesion in the arteriovenous fistula circuit might exert a more predictive effect on the arteriovenous fistula blood flow rate (Qa).
Methods:
To investigate relationships between anatomic parameters of stenosis and Qa, this study was conducted in a cohort of patients with a variety of arteriovenous fistula stenotic lesions. The goals were to determine (1) the degree of correlation between arteriovenous fistula stenosis estimated during the procedure, and that which is measured, and (2) the correlations between two anatomic stenosis parameters (percent stenosis and stenosis minimum luminal diameter) and Qa.
Results:
The cohort comprised 113 patients. Only a moderate correlation between estimated and measured stenosis was seen. A correlation between measured stenosis and Qa for the whole cohort was not seen, but a weak correlation between estimated stenosis and Qa was seen. Correlations between stenosis minimum luminal diameter and Qa were superior. The superiority of stenosis minimum luminal diameter to percent stenosis in correlating with a Qa of <500 mL/h was also demonstrated by receiver operating characteristics curve analysis. Stenosis minimum luminal diameter cutoffs of ⩽2.5 mm or >4 mm seemed to have a good predictive value of Qa.
Conclusions:
Percent stenosis determination is fraught with uncertainty and exhibits a weak correlation with Qa. Compared with percent stenosis, the minimum luminal diameter of the stenosis demonstrates a superior correlation with Qa.
Introduction
Current practice guidelines recommend that, in order for a stenosis of the dialysis arteriovenous fistula (AVF) circuit to qualify for treatment, it should represent greater than 50% decrease in the luminal diameter, and be associated with clinical and/or physiological abnormalities. 1 However, during angiographic evaluation of an AVF triggered by a medical indication, a single stenotic lesion or multiple lesions may be encountered. Stenoses may be present at various locations in the AVF circuit and may or may not correlate with the clinical abnormalities. Thus, keen clinical judgments is required to determine which angiographic lesions warrant intervention. 2 Total reliance on the 50% stenosis criterion may not be sufficiently indicative of the hemodynamic and functional relevance of a particular stenosis. Furthermore, determining percent stenosis of a lesion is fraught with measurement challenges that further reduce its usefulness as a reliable anatomic criterion.
The significance of a stenotic lesion would be better characterized by determining its minimum luminal diameter (MLD), that is, the narrowest point within the lesion. 2 This is the parameter that exerts the most restrictive effect on access blood flow rate (Qa) and it is this metric that is most likely to have hemodynamic and functional implications for the access. Even though its value has been advocated in determining the significance of a stenotic lesion,3,4 its use has not gained widespread acceptance and is not included in the National Kidney Foundation Kidney Disease Outcomes Quality Initiative (NKF KDOQI) recommendations for recognizing a clinically significant stenotic lesion.
To further investigate these issues, this study was conducted in a cohort of patients who had different types of AVFs with a variety of stenotic lesions. This cohort of patients is representative of dialysis patients with AVF derangements who are evaluated in an outpatient freestanding dialysis access management center. The goals of this study were as follows: (1) to determine the degree of correlation between percent AVF stenosis estimated by an experienced interventionalist at the time of intervention and percent stenosis which is actually measured, (2) to determine correlations between the two anatomic stenosis parameters (percent stenosis and MLD) and AVF hemodynamics as represented by Qa, and (3) to attempt to provide the practicing interventionalist with additional insight into the hemodynamic correlates of AVF stenotic lesions that are encountered during standard common practice angiography.
Material and methods
This was an institutional review board–approved observational study based upon prospectively collected data. The study cohort was derived from hemodialysis patients with an AVF who were referred to an outpatient dialysis access management center for treatment of AVF dysfunction. Patients were included in the study only if they had a single significant stenosis of their AVF circuit based on angiographic evaluation. Significance was defined as an estimated narrowing of ⩾50%, and associated with clinical or physiological abnormalities. Insistence on the presence of only one single stenosis was to simplify the characterization of relationships between anatomic stenosis parameters and Qa. Patient exclusion criteria included a stenosis greater than 4 cm in length, the presence of a large accessory or collateral vein (greater than one third of the adjacent AVF diameter), and hemodynamic instability.
The stenosis location defined the subgroups: (1) inflow—feeding artery, arterial anastomosis, and juxta-anastomotic region of AVF (within the first 5 cm adjacent to the anastomosis), (2) body—the cannulation zone of the AVF, (3) outflow—the draining veins proximal to the cannulation zone and up to the junction of the central vein, and (4) central vein—venous drainage from subclavian centrally.
Imaging was performed using a portable fluoroscopy machine equipped with a conventional image intensifier. The percent stenosis was initially estimated at the time of the procedure by the operating interventionalist (estimated stenosis) and later independently measured based upon recorded images (measured stenosis). These measurements were derived from a 4×-magnified image using the angioplasty balloon length as the reference metric. Orthogonal views were not available. Percent stenosis was determined by comparing the target lesion with the average of the distal and proximal “normal” vein. In instances in which an aneurysmal dilatation was adjacent to the stenotic lesion, the normal vein lying immediately beyond the aneurysm was used as the reference. In the case of juxta-anastomotic venous lesions, only the normal vein immediately proximal (downstream) was used as the reference. With cephalic arch lesions, only the normal vein lying immediately distal (upstream) was used as the reference vessel. In the case of anastomotic lesions, the normal feeding artery immediately adjacent to the lesion was used as a reference. The MLD within the stenotic segment was also obtained using angioplasty balloon length as the reference metric.
The Qa of the AVF was determined by Doppler ultrasound performed by a certified ultrasound technologist using a Terason uSmart 3300 (Teratech Corporation) equipped with an 8 MHz linear array probe. Measurements were made from the brachial artery regardless of whether the AVF was radial or brachial artery based. 3 All measurements were made at least 5 cm above the anastomosis in the case of upper arm AVFs. Three consecutive measurements were performed immediately before the interventional procedure. The average of the three was taken as the Qa value. The ultrasound measurements and the angiographic procedures were done on non-dialysis days.
The data were maintained prospectively in an electronic database and served as the source for all statistical calculations. All data sets were tested using the D’Agostinio-Pearson test and found to be nonparametric. For this reason, the Spearman rank correlation test was used to determine the strength and direction of association between the variables being tested. The correlations of interest were between (1) percent estimated stenosis and measured stenosis, (2) percent stenosis and Qa, and (3) MLD and Qa. The correlations were evaluated for the total group and each of the subgroups.
Receiver operating characteristics (ROC) curve analysis was used to determine the discriminatory ability of the three metrics used to express degree of stenosis (measured stenosis, estimated stenosis and MLD) to predict a Qa of 500 mL/min or less. In addition, the sensitivity, specificity, positive predictive value (PPV) and negative predictive value (NPV) of various MLD thresholds were determined for three different Qa levels.
All tests of significance were two-sided, and differences were considered significant when pwas ⩽0.05. MedCalc Statistical Software version 16.8 (MedCalc Software bvba, Ostend, Belgium; see https://www.medcalc.org; 2016) was used for all statistical analyses.
Results
Patient population
The study cohort consisted of 113 patients, the demographics for which are shown in Table 1. Subgroups included 59 patients with outflow stenosis (outflow subgroup), 33 patients with inflow stenosis (inflow subgroup), 14 patients with stenosis in the cannulation zone (body subgroup), and 7 patients with central veins stenosis (central subgroup). The latter two subgroups were relatively small, so caution should be exercised in their interpretation.
Patient demographics.
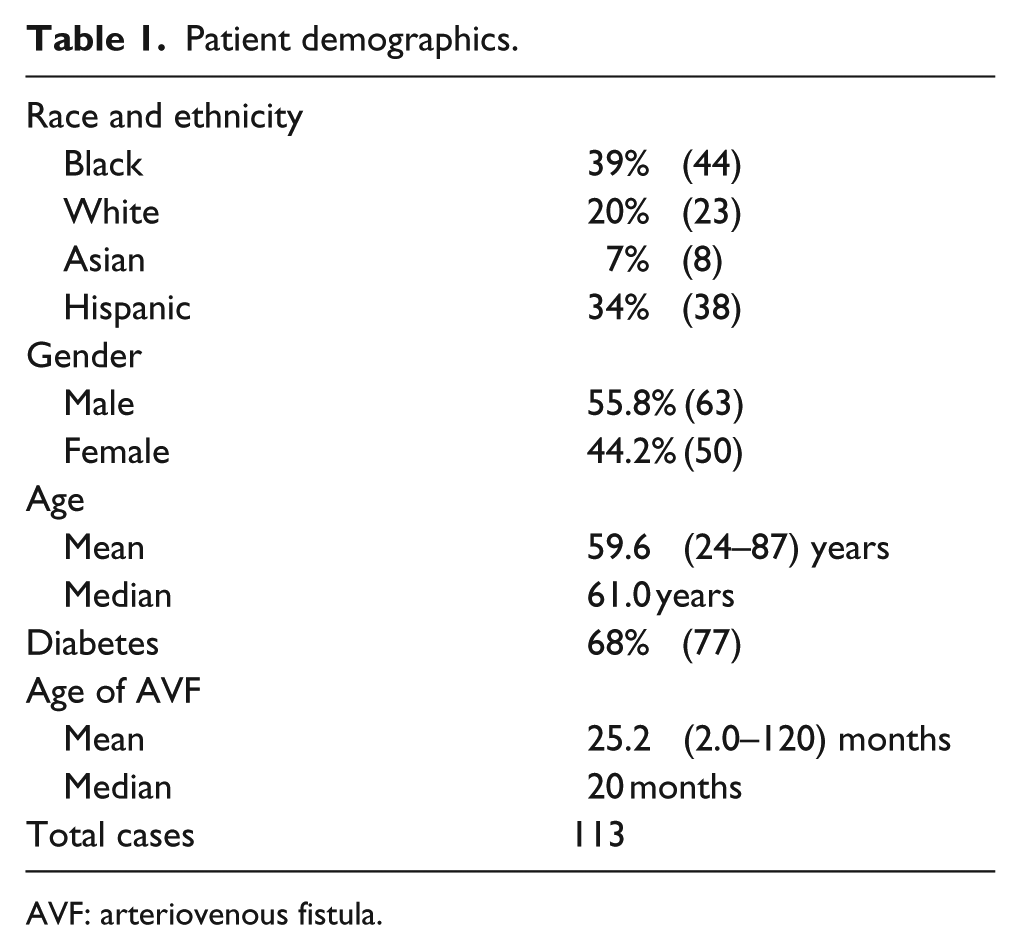
AVF: arteriovenous fistula.
Estimated stenosis versus measured stenosis
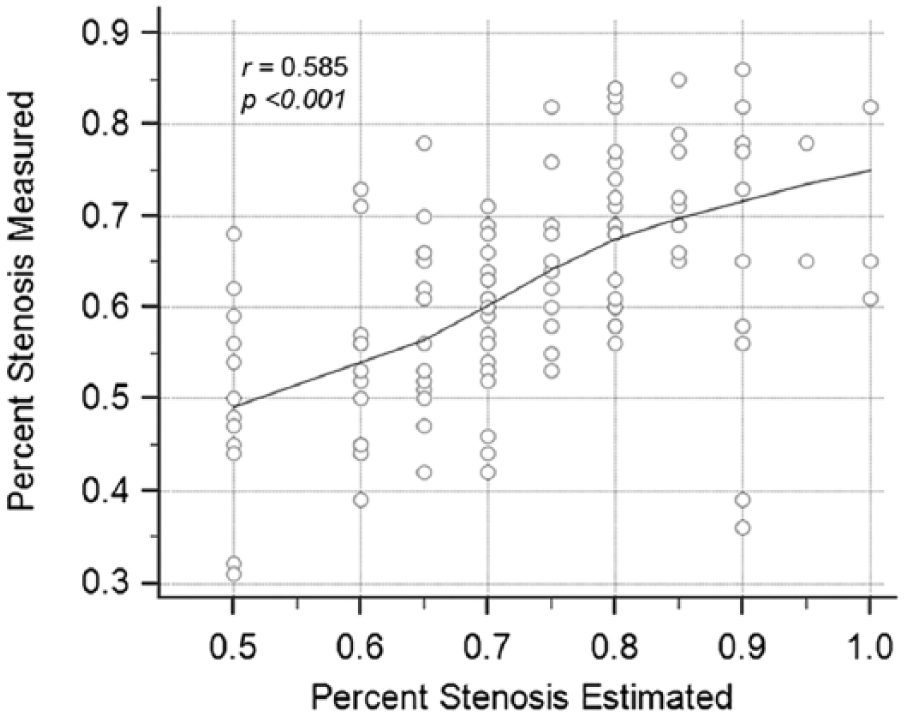
Comparisons of estimated and measured percent stenosis are presented in Table 2. The results showed a moderate degree of correlation for the total group and the outflow subgroup. However, the percent stenosis results obtained with these two methods exhibited significant discordance for the inflow, body and central subgroups. The correlation for the total group is shown in Figure 1.
Estimated versus measured stenosis.
Correlations.
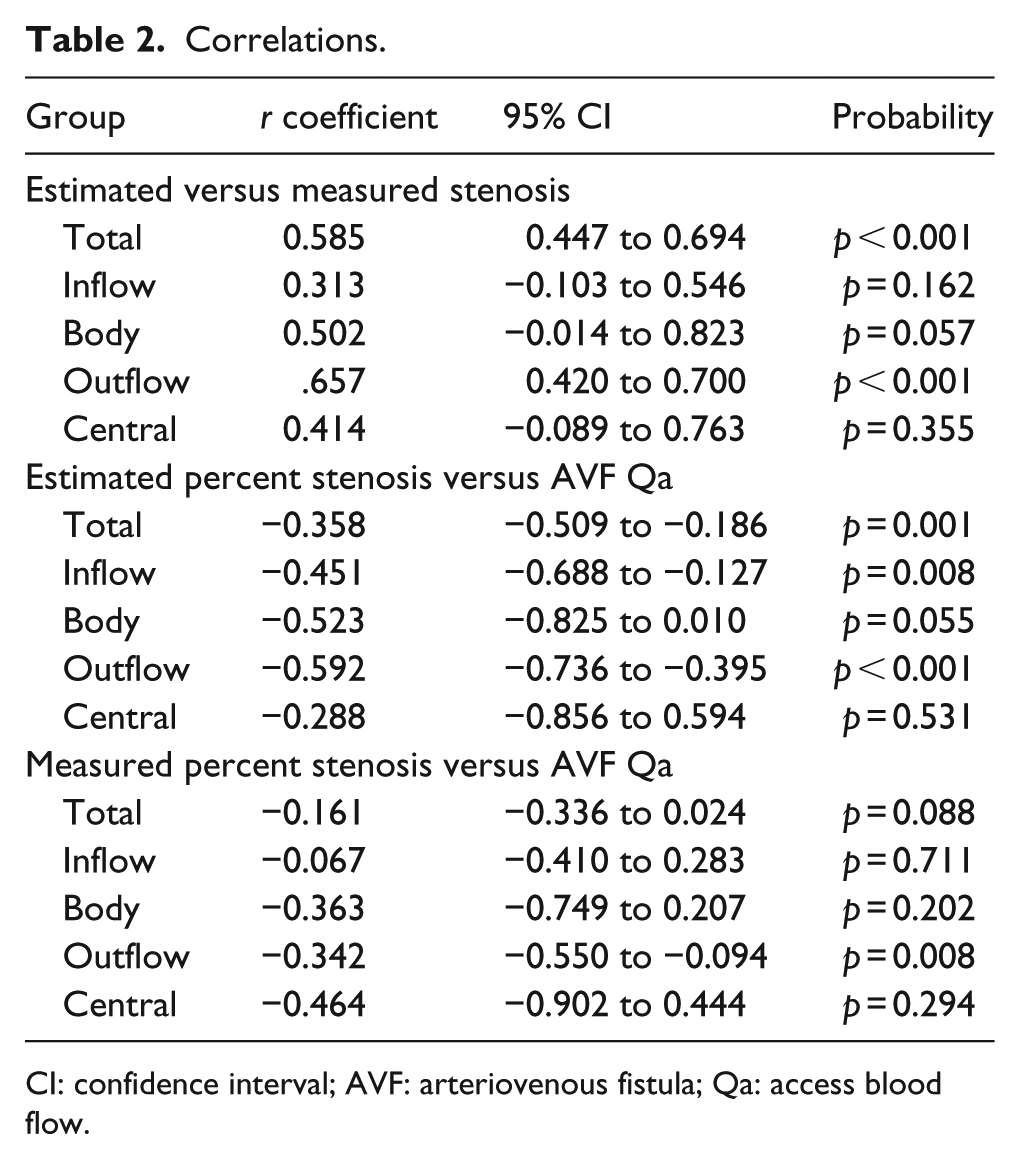
CI: confidence interval; AVF: arteriovenous fistula; Qa: access blood flow.
Percent stenosis versus Qa
Correlations between AVF percent stenosis and Qa are presented in Table 2. A correlation between measured stenosis and Qa for the total group was not seen, but a weak correlation was observed for the outflow subgroup. A weak correlation between estimated stenosis and Qa was seen for the total group (Figure 2(a)), and a moderate correlation was also seen for the outflow subgroup.
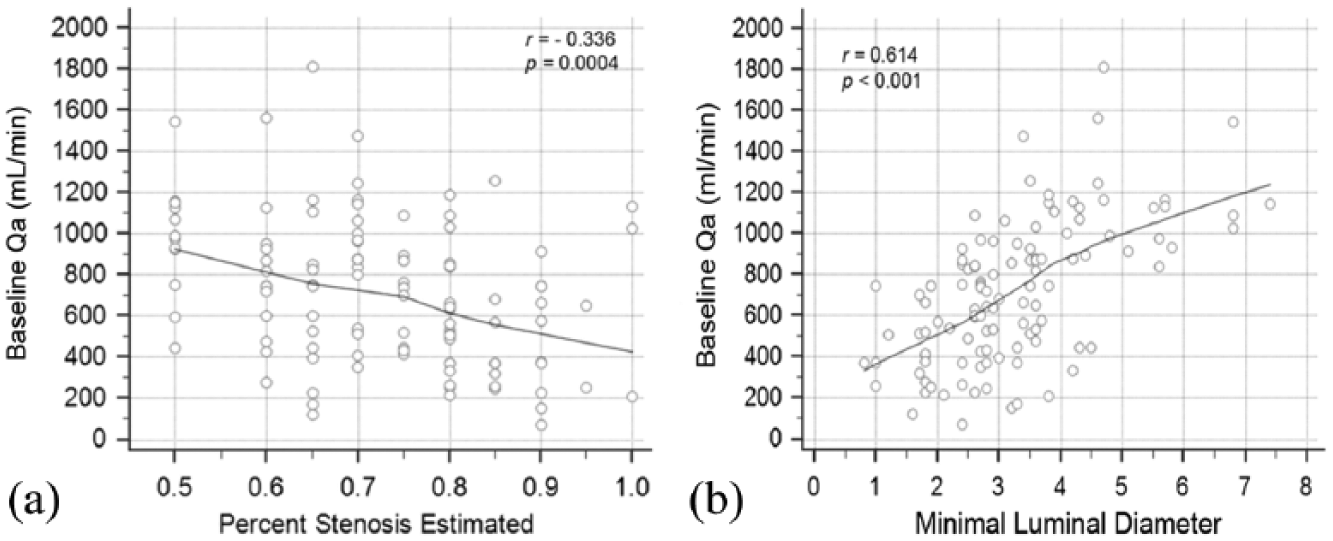
AVF anatomic—hemodynamic correlations: (a) estimated stenosis versus Qa and (b) minimal luminal diameter (MLD) versus Qa.
Stenosis MLD versus Qa
Stenosis MLD showed a moderate degree of correlation with Qa for the total group (r = 0.614, 95% confidence interval (CI) = 0.484 to 0.717, p < 0.001), and for the outflow stenosis subgroup (r = 0.607, 95% CI = 0.415 to 0.747, p < 0.0001). A moderate correlation was also seen for the body subgroup (r = 0.609, 95% CI = 0.115 to 0.861, p = 0.021); however, no significant correlations were found for the inflow and the central subgroups. The correlation for the total group between MLD and Qa are shown in Figure 2(b). The sensitivity, specificity, PPV and NPV of various MLD levels between 2.0 mm and 4.5 mm for a Qa of <500, <600, and <800 mL/min are shown in Table 3.
Sensitivity, specificity, and predictive values of stenosis MLD in detecting various AVF Qa cutoffs.
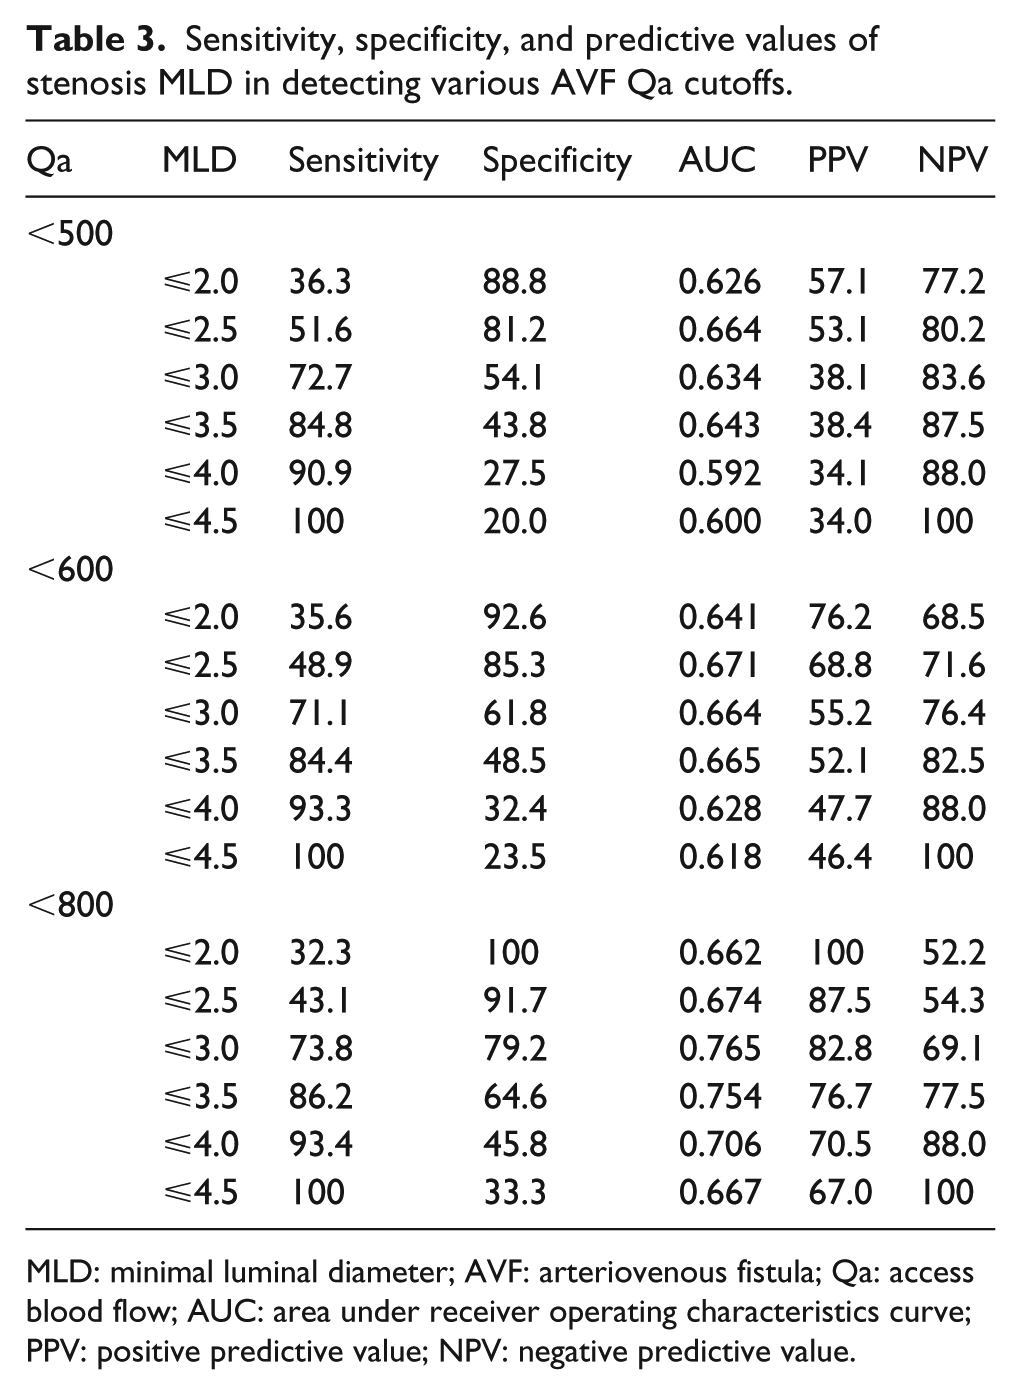
MLD: minimal luminal diameter; AVF: arteriovenous fistula; Qa: access blood flow; AUC: area under receiver operating characteristics curve; PPV: positive predictive value; NPV: negative predictive value.
ROC curve analysis comparisons
ROC curve analysis of measured stenosis, estimated stenosis and MLD, using a Qa of 500 mL/min, were compared (Figure 3). The area under the ROC curve (AUC) calculation for measured stenosis was not statistically significant (p = 0.526). For estimated stenosis, the AUC was 0.637 and was statistically significant (p = 0.009). MLD showed the strongest predictive value with an AUC of 0.746, which was statistically significant (p < 0.001).
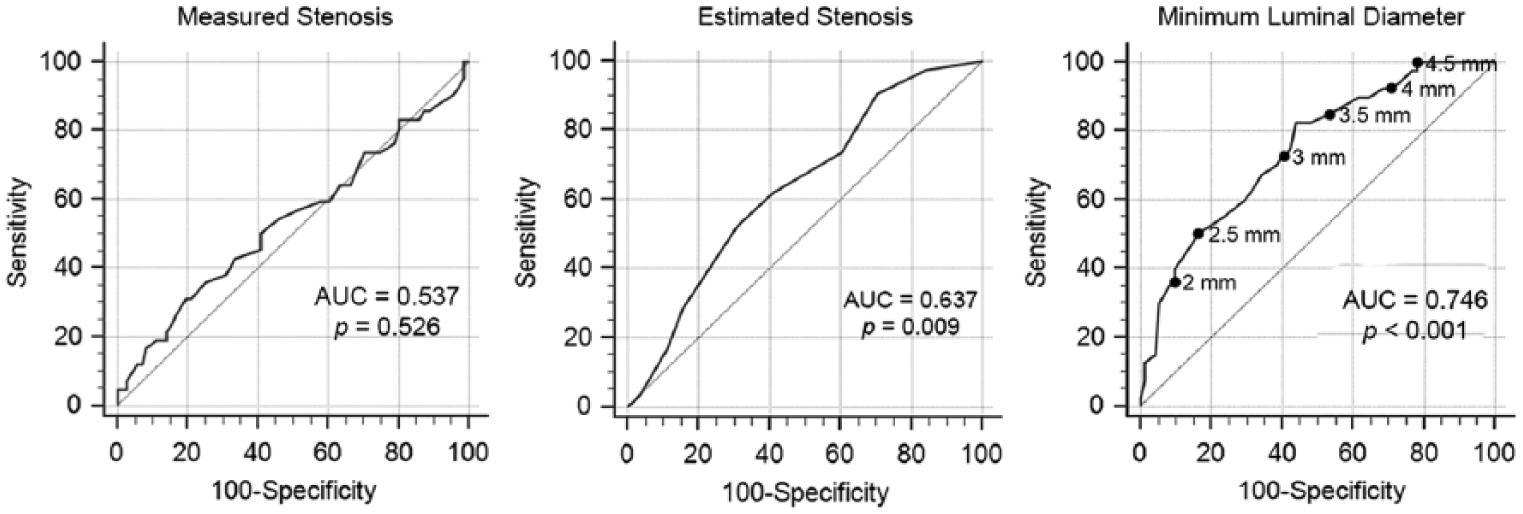
Comparisons of ROC curves for prediction of Qa of 500 ml/min using measured stenosis, estimated stenosis, and MLD.
Discussion
NKF KDOQI practice guidelines recommend prospective treatment of significant stenosis. 1 The emphasis is on the recognition of a significant lesion. Thus, the mere presence of an anatomical lesion is not a sufficient indication for treatment.4–6 Although its validity has been questioned, 7 the recommended definition of significant stenosis not only includes an anatomical criterion, equal to or greater than 50%, but also requires the demonstration of clinical or physiological abnormalities. 1 This latter element is actually the more defining aspect of the definition.
Conceptually, determining percent stenosis for a lesion is a simple process; however, in practice it is very challenging. Measuring the degree of stenosis requires the identification of a “normal” comparator vessel. 2 The task is confounded by the marked variations, both normal and pathological, in the immediately adjacent venous anatomy. These variations are the result of lesions that occur where the vessel curves, at bifurcations, in association with venous valves, and close to aneurysmal dilatations. A significant discrepancy in the diameter of the vessel immediately proximal and immediately distal to the lesion complicates the problem. As a result, the measurements are inevitably questionable. The failure to use orthogonal views in this study also creates the possibility of a degree of inaccuracy in estimating the percentage of stenosis; however, this effect is considered to be minimal in comparison to that introduced by a lack of a normal comparator vessel. In clinical practice, the degree of stenosis is rarely measured; the interventionalist estimates it during the course of the procedure.
In this study, a comparison was made between estimated stenosis and measured stenosis to determine the degree of correlation between the two (Table 2). Only a moderately positive correlation between estimated and measured stenosis was seen when the total group (r = 0.585) and the outflow stenosis subgroup (r = 0.657) were analyzed (Figure 1); however, no correlations were found with the other subgroups. These findings indicate significant discrepancy between these two methods of stenosis determination due to challenges in determining percent stenosis, as stated above.
As anticipated, all correlations between stenosis and Qa were negative (Table 2). For the central stenosis and body stenosis subgroups, neither method of stenosis determination showed a correlation with Qa. Estimated stenosis showed a weak correlation with Qa for the total group (r = –0.358) and the inflow stenosis subgroup (r = –0.451), and a moderate correlation with Qa for the outflow stenosis subgroup (r = –0.592). However, the only significant correlation observed for measured stenosis and Qa was in the outflow stenosis subgroup, which was a weak correlation (r = –0.342).
The superiority of the estimated stenosis over measured stenosis as a correlate of Qa was an unexpected finding. The explanation for this is not totally clear; however, we propose that when the stenosis is estimated by an experienced interventionalist, it is a composite of objective and subjective components that may have the indirect advantage of leveraging on the certain clinical factors such as the indications for the study, physical exam of the dialysis AVF, and the visual speed of blood flow while obtaining the angiographic images. In contradistinction, while the measured stenosis is more objective, it suffers from the difficulties involved in the identification of a comparator vessel, and is blinded to matters related to AVF performance. These factors may explain why estimated stenosis outperformed measured stenosis as a correlate of Qa. Despite its superiority over measured stenosis, estimated stenosis remains a weak correlate of Qa for the total group, and performs best in the outflow subgroup.
Computational studies, based upon an arterial blood flow model,8,9 and both clinical and computational studies, based upon an AVF model,2,8 have produced evidence to indicate that the hemodynamic changes associated with stenosis are not related to percent decrease in luminal diameter but rather the absolute luminal diameter, that is, the MLD. A 50% stenosis in an AVF with a diameter of 12 mm is not comparable to a 50% stenosis in an AVF with a diameter of 8 mm, but the effect of any given MLD would be comparable regardless of adjacent vessel diameter. In addition, the determination of MLD can be more accurately accomplished because a comparator vessel is not involved. These factors favor this metric as a more reliable indicator for determining the significance of a stenotic lesion.
In this study, the stenosis MLD demonstrated a higher level of correlation with Qa (Figure 2(b)) than did percent estimated stenosis (Figure 2(a)) (r = 0.614 vs −0.336). The NKF KDOQI practice guidelines state that an AVF blood flow rate less than 400 to 500 mL/min should prompt a referral for evaluation and possible treatment. Using a value of <500 ml/min as a threshold, ROC curve analysis for measured stenosis, estimated stenosis, and stenosis MLD were performed (Figure 3). Among these, MLD analysis gave the best results with an AUC of 0.746, yet this value indicates only a fair predictive value. Sensitivity, specificity, PPV, and NPV of a range of MLD values for detecting three Qa cutoffs (<500, <600, and <800 mL/min) were calculated using this data (Table 3). It was found that MLDs ⩽2.0 and ⩽2.5 mm have high specificity for all three Qa cutoffs but lack sensitivity; whereas, MLDs of ⩽4.0 and ⩽4.5 mm have high sensitivity for detecting all three Qa cutoffs, but lack specificity. Taken together, this would suggest that in clinical practice, a MLD of >4.0–4.5 mm, based on angiographic images, could be used as a reliable indicator to nearly exclude low Qa (defined as <500 mL/min) with a high degree of certainty (Figure 2(b)). On the other end, a MLDs of ⩽2.0–2.5 mm do not have enough predictive value to render a statement pertaining to Qa cutoffs of <500 or <600 mL/min, but their importance would be to nearly exclude AVF with high flow (defined as Qa of ⩾800 mL/min; Figure 2(b)). MLD values between 2.5 and 4.0 mm were not sufficiently discriminatory to allow for greater granularity in clinical judgment.
The superiority of MLD as a metric for defining a clinically significant stenotic lesion is consistent with a previous study by Fahrtash et al. 2 In that study, designed to evaluate the definition of a significant stenosis, it was found that a MLD of 2.7 mm, measured using duplex ultrasound, had greater than 90% sensitivity and 80% specificity in identifying a dysfunctional radiocephalic AVF. The same group of investigators, in a more recent follow up study, 10 acknowledged that such degree of accuracy may not be generalizable, but concluded that a MLD of >3.2 mm, measured by ultrasound, would nearly exclude AVFs with low Qa (defined as <600 mL/min). We consider this conclusion in line with our findings. We attribute the difference in MLD cutoff (3.2 in their study vs 4.0 in our study) to be due to differences in methodology (ultrasound vs angiographic assessment of MLD), as well as differences in AVF types and lesion selection (they studied only radiocephalic AVFs and inflow lesions, whereas we studied all types of AVFs and all lesion locations).
We acknowledge that our study has several limitations. We did not use orthogonal views to evaluate stenosis, and we did not factor in the length of lesion. A longer stenosis would influence Qa more than a shorter stenosis. However, to minimize this effect, we avoided including stenoses that are longer than 4 cm. The Qa values in our study were not standardized based upon systemic factors such as mean arterial blood pressure (MAP). Since Qa varies in proportion to changes in MAP,11–13 variations in MAP can exert an independent change in Qa. Finally, this study included a variety of AVF types and a variety of types of stenotic lesions. A greater degree of uniformity in results might be possible by limiting these variables. Nevertheless, we believe that the value of our current study resides in the following: (1) it highlights the complexity of determining percent stenosis, (2) it shows that percent stenosis is a weak correlate of Qa, and (3) it supports the contention that a dialysis circuit stenosis MLD has important implications for Qa.
Footnotes
Acknowledgements
Christopher Gaulden, RT, and Armando Soria, RT, for technical assistance, Luis Rivera for ultrasound measurements, and Cyndie Rodriguez for assistance in data collection.
Declaration of conflicting interests
The author(s) declared no potential conflicts of interest with respect to the research, authorship, and/or publication of this article.
Funding
The author(s) disclosed receipt of the following financial support for the research, authorship, and/or publication of this article: This work was supported by Renal Research, Inc., Houston, Texas.