
Abstract
Objectives
Glioma tumors, especially glioblastoma (GBM), are among the most heterogeneous brain cancers, and this characteristic is considered the main cause of treatment resistance and disease recurrence. The aim of this study was to investigate the cellular dynamics and transcriptional pathways dependent on the GFAP gene in three clinical conditions, including grade III glioma, primary glioblastoma, and recurrent glioma.
Methods
Single-cell RNA sequencing (scRNA-seq) data from the GSE103224 collection were merged and clustered using the Seurat and Harmony software packages. Then, the Monocle3 tool was used to model cellular developmental pathways, and the Metascape database was used for functional enrichment of genes.
Results
The results showed that malignant cells, microglia, immune cells, and glial progenitors formed distinct clusters in all conditions, and the transition of radial glial cells to cancer cells was observed in all three conditions. Differential gene expression analysis identified six genes, APOE, AQP4, CLU, GFAP, ID3, and ID4 as stable and common genes between all tumor stages, whose expression was directly related to tumor persistence and recurrence. Functional enrichment also identified steroid hormone response pathways, NGF signaling, and the VEGF pathway as common processes in glioma progression.
Conclusion
Overall, these results indicate that GFAP and its associated co-expression network play an important role in tumor persistence and cellular rearrangement in glioma and can be used as molecular markers and novel therapeutic targets for precise and personalized treatment of patients.
Introduction
Glioblastoma (GBM) is the most common and lethal brain tumor in adults, known for its high resistance to treatments and rapid proliferation. 1 These tumors exhibit significant cellular heterogeneity, comprising various cell types with differing molecular and phenotypic characteristics. This diversity contributes to medication resistance and tumor recurrence, affecting patient treatment responses. 2 Meanwhile, radial glial cells, which play an important role in the growth and differentiation of nerve cells under normal conditions, have shown evidence of their ability to transform into aggressive cancer cells. These cells could play a key role in tumor progression, increased invasion, and resistance to treatment. 3 Radial glial cells and glial precursors play a key role in neuronal development and differentiation, and recent studies have shown that these cell lines can be the source of malignant cells in glioma. 4 With the advent of single-cell RNA sequencing (scRNA-seq), it has become possible to examine gene expression at the single-cell level. This technology allows for the identification of different cell types, developmental pathways, and complex cell-cell interactions in brain tumors. The use of advanced tools such as Seurat and Harmony for quality control and data integration, and Monocle3 software for trajectory modeling, allows for in-depth and precise analysis of cell dynamics and developmental pathways between glial radical cells and cancer cells. 5 Recent investigation shows that examining the cellular characteristics of gliomas primary, recurrent, and grade 3 can reveal key molecular pathways linked to invasion, treatment resistance, and disease progression. This may enhance personalized treatment approaches, improve patient outcomes, and foster new diagnostic methods. 6 During brain development, astrocytes and specific glial radical cells express the GFAP (Glial Fibrillary Acidic Protein) gene, which is crucial for maintaining the stability of glial cell structure, shaping, connections, and signal transduction in the brain. In the context of brain cancers, GFAP is known as a classic marker of astrocytic cells and is expressed in astrocytic gliomas and GBM. The level of GFAP expression in grade 3 and 4 gliomas is correlated with the degree of cellular differentiation and the degree of invasion; cells with higher expression of GFAP usually have more differentiated characteristics, but in some tumor subtypes, this gene can also be associated with invasive pathways and resistance to treatment.7,8 GFAP It also plays an important role in the evolutionary pathways of radical glial cells to cancer cells, and trajectory studies have shown that this gene is shared among three different tumor conditions, including primary GBM, recurrent GBM, and grade 3 glioma, highlighting its importance in maintaining cancer cell persistence and tumor progression.9,10 Increased GFAP expression in tumor cells is linked to stem-like characteristics and treatment resistance, potentially facilitating tumor resurgence post-treatment by sustaining cellular networks and intercellular interactions, which contribute to tumor recurrence and drug resistance. Given the high importance of cellular heterogeneity and developmental pathways in GBM and grade 3 gliomas, this study was designed to investigate the cellular dynamics and communication between glial stem cells and cancer cells in three different tumor conditions (primary GBM, recurrent GBM, and grade 3 gliomas). The results of this study may offer new visions into the molecular mechanisms of tumor progression and guide the improvement of novel and targeted therapies for patients.
Methods
Single-Cell RNA-Seq Data Analysis
This single-cell analysis was performed to cluster and identify distinct cell types in high-grade glioma. To achieve this, single-cell RNA-seq (scRNA-Seq) data from high-grade glioma tissue samples with three diagnoses, including GBM, anaplastic astrocytoma, grade III, and recurrent samples (obtained from GSE103224), were integrated and analyzed using R packages Seurat (v5) and Harmony.11,12 After filtering out low-quality cells, the gene expression of core cells was normalized by a linear regression model. The most variable genes were selected and reduced to 30 principal components by PCA. The cells were then clustered by UMAP methods based on their gene expression profiles. The clusters were annotated by scType, and a specific cell type was assigned for each cluster. 13
Single-Cell Trajectory Analysis
Trajectory inference is a widely used downstream technique for studying cell differentiation and the evolution of cell types, crucial for understanding cellular dynamics. Monocle3 is a well-regarded package tool utilized in the scientific community for trajectory analysis. This technique provides important insights into the temporal dynamics of cell differentiation by using patterns of gene expression changes to predict trajectories and arrange cells along a developmental trajectory to establish their respective pseudotime. 14 Monocle3 was used to analyze pseudotime trajectory at the single-cell level, with a particular focus on cells inside control and tumor clusters independently.
Correlation and Validation Analysis
Based on the results of cell annotation, differential expression, and pseudotime trajectory analyses, shared and condition-associated genes were selected for downstream correlation and validation analyses. To provide supportive computational validation, independent TCGA-derived glioma cohorts were analyzed using normalized bulk RNA-seq expression matrices, including grade 3 glioma (gIII) samples extracted from the TCGA-LGG cohort, GBM samples, and recurrent glioma samples. Pearson correlation analyses were performed among the selected genes within each glioma condition. Correlation coefficients were calculated separately for grade 3 glioma, GBM, and recurrent glioma cohorts and visualized using heatmap-based representations.
Metascape Enrichment Analysis
Based on the functional annotation of the differentially expressed genes (DEGs), enrichment analysis is a helpful method for analyzing gene expression data. Metascape (https://metascape.org/gp/index.html#/main/step1), an online program designed to provide experimental biologists with a thorough gene list annotation and analysis resource, was utilized for DEG annotation. Metascape uses a bar graph colored by p-values to simplify and summarize some results. 15
This study was reported in accordance with the STROBE guidelines. The completed STROBE checklist is provided as a supplementary file.
Results
scRNA Seq
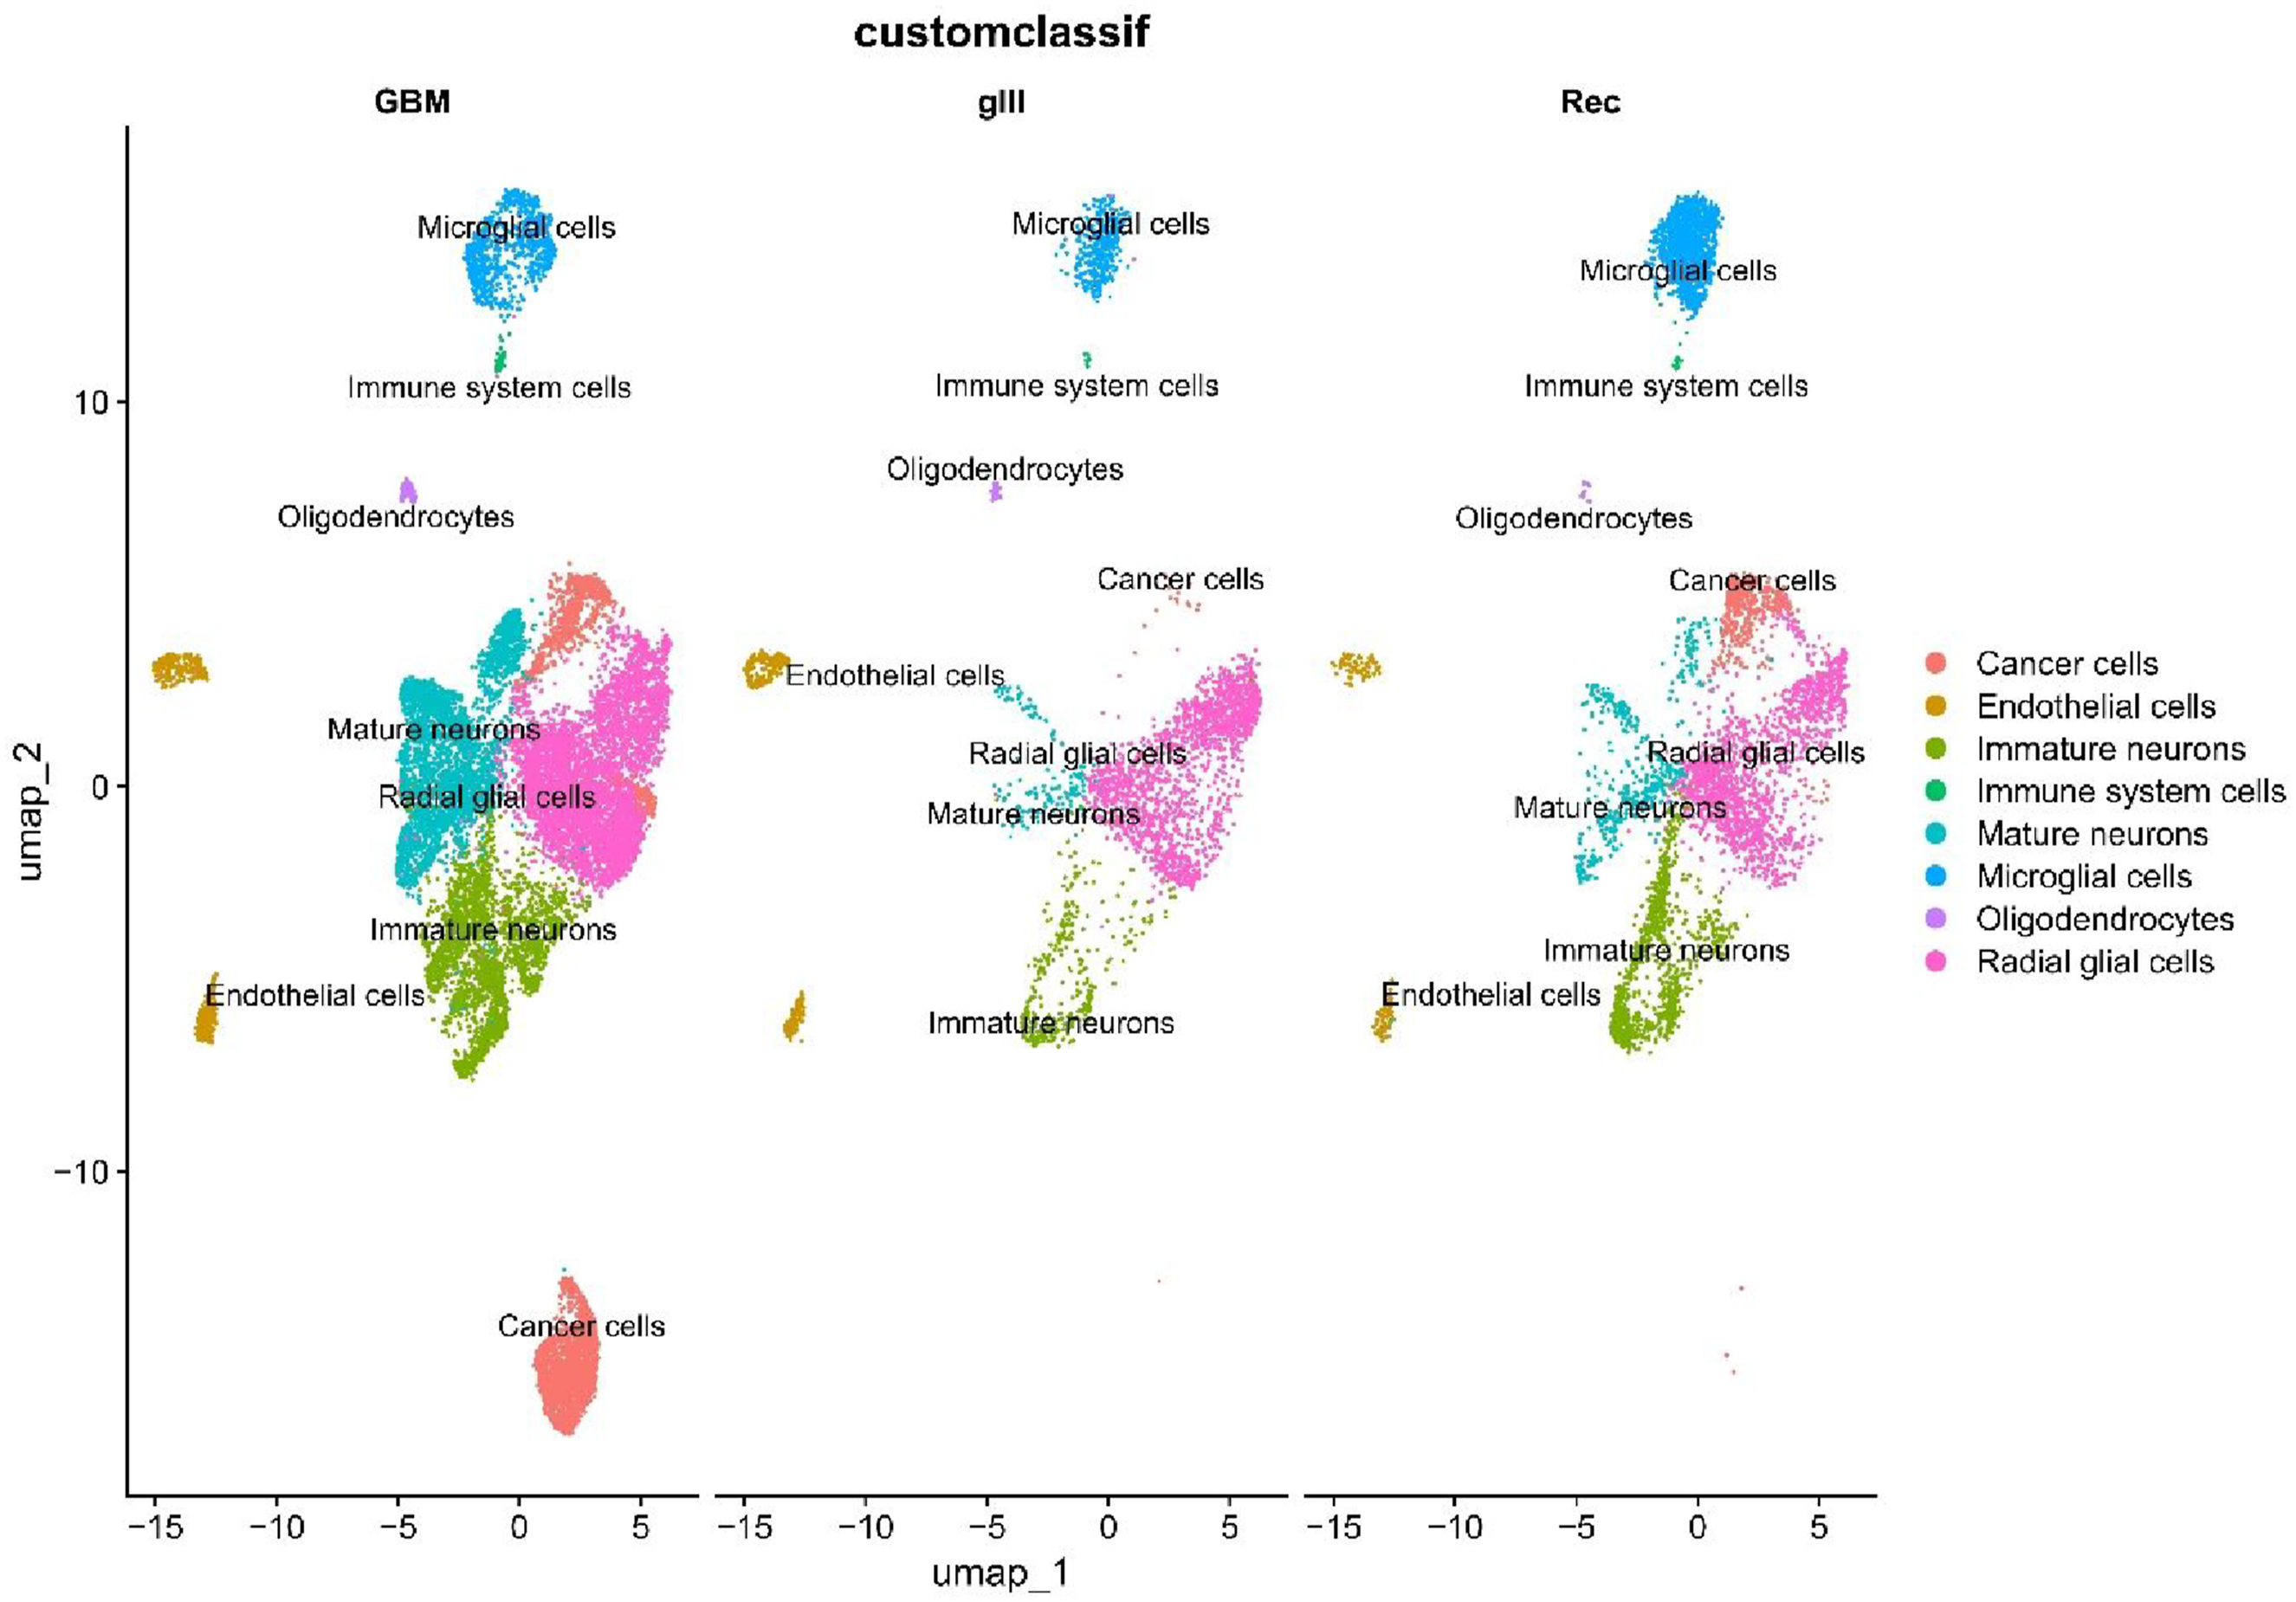
We have summarized the analytical workflow in Figure 1. Single-cell analysis was performed across three distinct conditions: one glioma sample (grade III), five glioblastoma (GBM) samples, and two recurrence (Rec) samples, using the UMAP algorithm. In all three conditions, clear and distinct cellular clustering was observed, reflecting the cellular heterogeneity present within the samples. The identified cell types included cancer or malignant cells, endothelial cells, immune cells, microglia, oligodendrocytes, immature and mature neurons, and radial glial. In the GBM condition, malignant cells formed a well-defined and isolated cluster in the lower region of the plot, indicating a distinct cancer cell population with unique characteristics. Additionally, microglia and immune cells were located in the upper region of the plot, separate from other clusters, highlighting the significance of these cells in the tumor microenvironment. In gIII and Rec samples, the clustering patterns of various cell types were largely similar, with distinguishable clusters of malignant cells, radial glia, and both immature and mature neurons. A notable difference was observed in the recurrence condition, where malignant cells appeared more frequently around glial and neuronal clusters. This spatial distribution may reflect microenvironmental alterations and more complex cellular interactions during disease relapse (Figure 2). Schematic overview of the study workflow, including scRNA-seq processing, cell annotation, trajectory analysis, differential expression, and downstream functional analyses across glioma conditions UMAP is used to visualize single-cell transcriptome profiles from grade III glioma, primary GBM, and recurrent glioma samples. The eight primary cell categories identified and characterized were malignant cells, endothelial cells, immune cells, microglia, oligodendrocytes, immature neurons, mature neurons, and radial glial cells.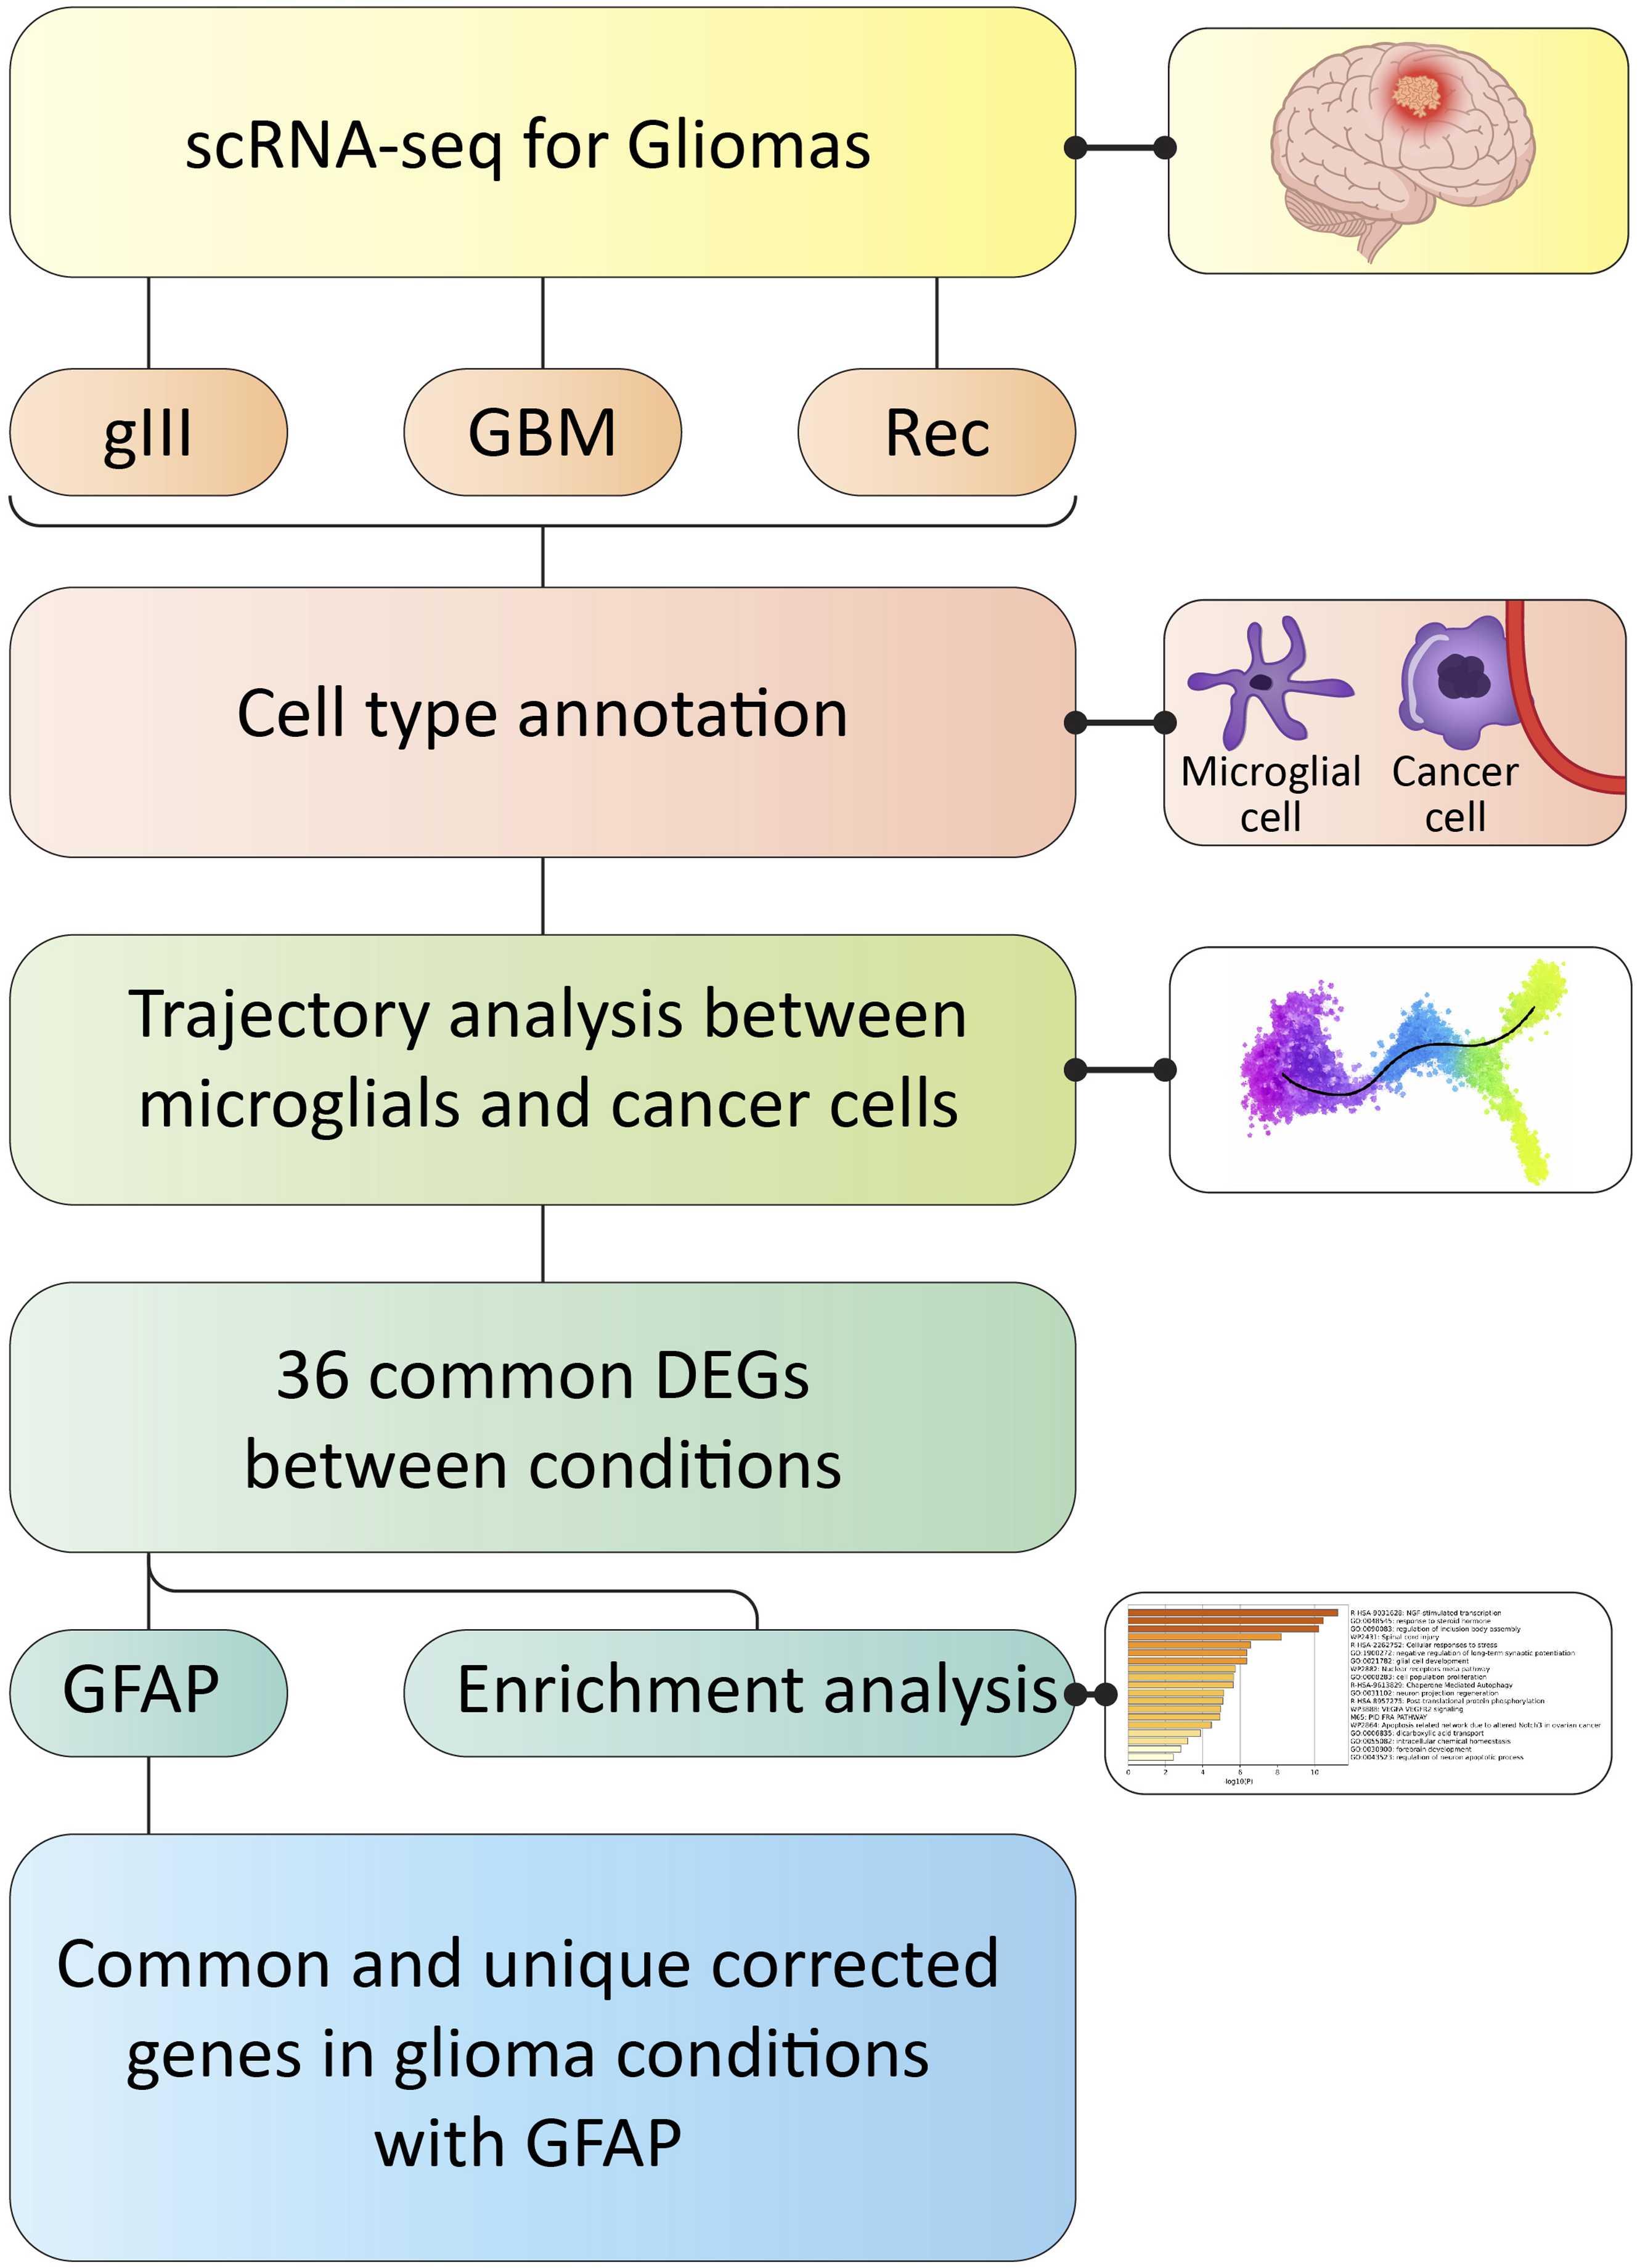
Trajectory Analysis
In this trajectory analysis, radial glial cells and cancer cells were selected as the terminal and biologically relevant cell types. To investigate the molecular dynamics and cellular developmental pathways, radial glial cells were designated as the root (starting point), enabling the assessment of cellular transitions from radial glia to malignant cells across all three conditions: gIII, GBM, and Rec. UMAP plots colored by pseudotime values illustrate the gradual transition and molecular changes occurring throughout this dynamic process (Figure 3). Following DEGs analysis, 67 significant genes were identified in Grade 3, 801 in GBM, and 265 in recurrent samples. Trajectory inference is a widely used downstream technique for studying cell differentiation and the evolution of cell types, crucial for understanding cellular dynamics. Trajectory analysis showing the change from radial glial cells to malignant cells in three different glioma circumstances (grade III, GBM, and recurrent). The root for pseudotime inference was identified as radial glial cells.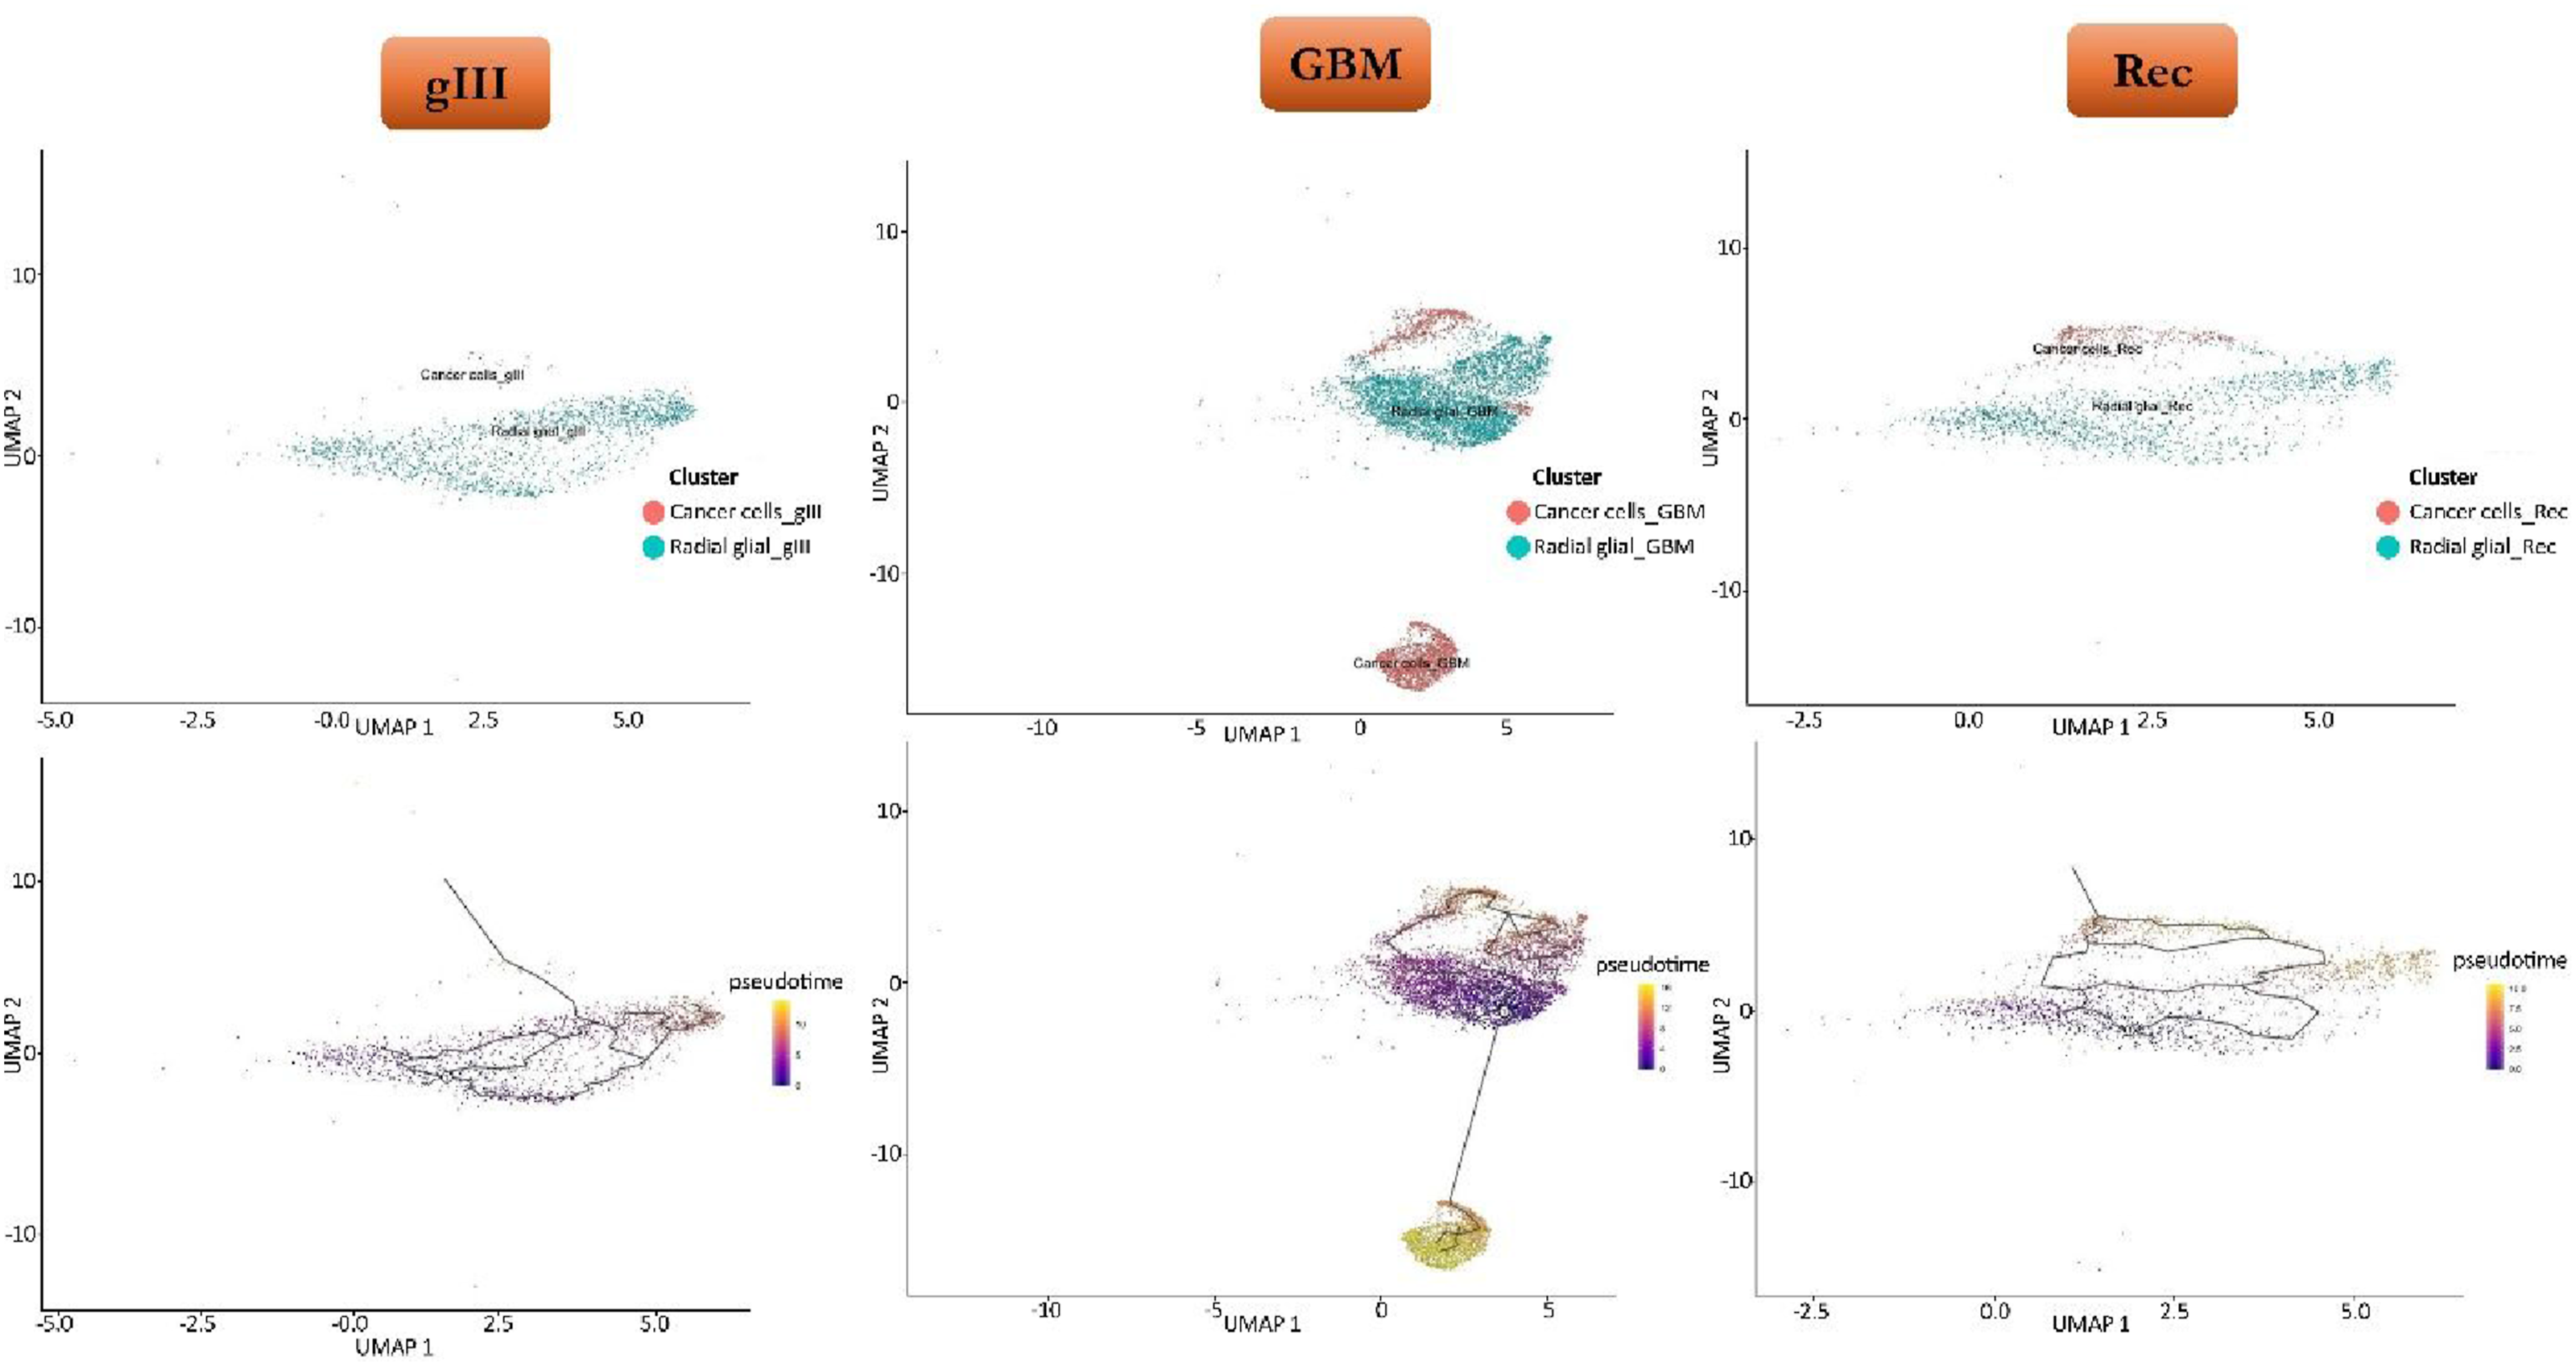
A cross-condition comparison of differentially expressed genes revealed 36 shared genes across all three trajectories, highlighting potential conserved regulators of cellular progression (Supplementary file 1). GFAP was selected as one of the key markers of glioblastoma.
Pearson Correlation Analysis
Pearson correlation coefficients between GFAP and the remaining DEGs were calculated across three clinical conditions—grade III glioma, GBM, and recurrent tumors—within two distinct cell types: radial glial cells and cancer cells. Subsequently, genes that showed consistent correlation with GFAP across all three conditions were intersected with the 36 shared genes identified from the trajectory analysis, resulting in the identification of six overlapping genes. These genes—APOE, AQP4, CLU, ITM2C, ID3, and ID4—were both trajectory-associated and significantly correlated with GFAP in all conditions (Figure 4). As illustrated in Figure 4, these six genes exhibit stable and relatively linear expression patterns along the pseudotime axis, spanning from radial glial cells (designated as the root) to malignant cells. Blue lines represent gene expression in radial glial cells, while red lines depict expression in monoclonal tumor cells, indicating sustained expression of these genes throughout the cellular transition. Minor variations in the slope of the curves may reflect dynamic molecular regulation during tumor progression. In the following section, we provide a detailed examination of the expression trajectories of these six genes across pseudotime. APOE, AQP4, CLU, ID3, ID4, and ITM2C expression dynamics across the pseudotime trajectory. Radial glial cells are represented by blue lines, whereas malignant cells are represented by red lines. These lines show consistent expression patterns during the change from radial glial to tumor cell states.
In addition, Pearson correlation analysis revealed that certain genes exhibited condition-specific significant correlations with GFAP across the clinical states. In gIII, genes such as NTRK2, SLC1A3, AGT, ADCYAP1R1, NDRG4, EDNRB, LIX1, MYBPC1, OGFRL1, and CSRP1 showed strong positive correlations with GFAP, potentially reflecting their roles in the early stages of tumor development. In the GBM condition, genes including JUNB, MRPS17, CHCHD2, NIPSNAP2 (also known as GBAS), CHCHD2P6, CHCHD2P9, CCT6A, and SEC61G were specifically correlated with GFAP, likely associated with mitochondrial network regulation and cellular stress responses. Finally, in Rec, genes such as FADS2, HSPB8, and CNN3 demonstrated exclusive correlations with GFAP, suggesting metabolic and structural alterations during the tumor’s resistant phase. Together, these condition-specific genes, alongside the six commonly identified genes, constitute a comprehensive set of potential therapeutic targets for tailored interventions across different stages of glioma progression.
Validation Analysis
To further assess the robustness of the identified GFAP-associated transcriptional programs, correlation-based validation analyses were performed using independent TCGA-derived glioma cohorts, including gIII, GBM, and recurrent glioma samples.
Among the six shared genes identified across glioma conditions, several genes demonstrated consistent positive co-expression with GFAP across cohorts. In particular, CLU exhibited strong positive correlations with GFAP in gIII (r = 0.66), GBM (r = 0.72), and recurrent glioma samples (r = 0.59). Similarly, AQP4 showed progressively stronger GFAP-associated correlations across gIII (r = 0.42), GBM (r = 0.64), and recurrent glioma cohorts (r = 0.83). ITM2C also demonstrated consistent positive correlations with GFAP across gIII (r = 0.37), GBM (r = 0.58), and recurrent glioma samples (r = 0.76). ID4 also demonstrated moderate-to-strong positive correlations across all glioma states (Figure 5). These findings support the presence of a conserved GFAP-associated transcriptional signature across distinct glioma conditions. Heatmap showing Pearson correlation coefficients between GFAP and shared glioma-associated genes across gIII, GBM, and recurrent glioma cohorts. Conserved positive correlations were observed particularly for AQP4, CLU, ITM2C, and ID4, supporting the robustness of the identified GFAP-associated transcriptional signature across multiple glioma states
Additional analyses of condition-associated unique genes revealed heterogeneous GFAP co-expression patterns within individual glioma states. In gIII samples, AGT (r = 0.62), OGFRL1 (r = 0.55), and LIX1 (r = 0.54) demonstrated relatively strong positive correlations with GFAP. In recurrent glioma samples, FADS2 (r = 0.65) and HSPB8 (r = 0.69) also exhibited notable positive correlations. In contrast, most GBM-specific unique genes showed weak or minimal correlations with GFAP, suggesting greater transcriptional heterogeneity within this condition (Supplementary file 2). Pearson correlation coefficients between GFAP and condition-associated unique genes identified in lower-grade glioma (LGG), glioblastoma (GBM), and recurrent glioma cohorts.
Enrichment Analysis
For each analyzed condition, a list of DEGs was extracted. Subsequently, gene overlap among these lists was assessed using the online Venn diagram tool, resulting in the identification of 36 shared genes. This set of common genes was subjected to functional enrichment analysis using the Metascape database to uncover associated biological pathways and processes (Figure 6). Each line in the resulting plot represents a biological pathway or gene ontology term that is significantly enriched among these genes. Notable enriched pathways include NGF-stimulated transcription, response to steroid hormones, regulation of protein aggregation, cellular stress response, glial cell development, and VEGF-related signaling pathways. This analysis effectively highlights key biological processes that are likely shared across all three conditions and may serve as a foundation for future investigations into the molecular mechanisms underlying glioma progression and recurrence. Functional enrichment analysis by Metascape. Bar chart of clustered enrichment ontology categories and biological pathway terms
Discussion
Six important genes—APOE, AQP4, CLU, GFAP, ID3, ITM2C, and ID4—were detect in this study by single-cell data. These genes had an expression pattern in all tumor condition (grade III glioma, primary and recurrent GBM) and were central to the process of glioma progression. Due to variations in gene expression and other genetic alterations that encourage tumor cell proliferation and contribute to malignant transformation, gliomas exhibit notable heterogeneity. 16 A better understanding of glioma heterogeneity is essential, as it affects therapeutic responses and recurrence patterns, underscoring the need for enhanced biomarkers and personalized medicine. 17 Significant cellular heterogeneity and molecular dynamics in different glioma types, are revealed by single-cell transcriptome analysis. The study identifies both conserved and divergent cellular patterns, trajectories, and gene expressions in these types, with UMAP clustering supporting the intratumoral heterogeneity typical of gliomas. 18 In GBM, cancerous cells are found in a distinct cluster at the lower region of the UMAP plot, indicating a unique cancer cell population with specific molecular appearances. However, microglial and immune cells are located in the upper area, so their essential roles in influencing the tumor microenvironment and facilitating tumor progression in gliomas.19,20 In grade III and Rec types, clustering patterns were like to those in GBM, but malignant cells were closer to microglia and neuronal clusters in the Rec group. This proximity recommends that microglia may be involved in glioma tumor progression through oncogenic synapses between neurons and glioma cells. 21 The increased intermingling of malignant cells with glial and neuronal clusters in the Rec condition is a critical observation. This suggests an important remodeling of the tumor microenvironment (TME) upon recurrence may be driven by therapeutic pressure. 22 These annotations suggest the dynamic restructuring of cellular partitions in glioma development that may lead to therapy resistance and aggressive tumor behavior. Trajectory analysis drawn lineage changes from radial glial cells to malignant cells, revealing complex hierarchies and intermediates. This framework proposes visions into the molecular programs of cancer evolution, suggesting that radial glia-derived lineages may initiate malignant transformation. The characterization of common DEGs shows their roles in some biological processes such as NGF-mediated transcription, steroid hormone response, and cellular stress response, supporting the influence of growth factor signaling on glioma aggressiveness.23,24 The enrichment of transcriptome profiles shows their potential as predictors of treatment resistance and cancer progression. These six genes with steady expression trajectories from radial glia to tumor cells across all disease states were found using correlation profiling, indicating their potential as biomarkers for glioma monitoring and relapse prediction. Notably, APOE plays a crucial role in the immune response and glioma progression; its loss results in increased immune suppression and faster tumor proliferation. 25 AQP4 is upregulated in GBM samples, implicating it in malignant brain tumor biology processes. 26 CLU downregulation halts cell proliferation and induces senescence in astrocytes, while its association with pro-inflammatory cytokines like IL-1β promotes cellular senescence in glioma cells. 27 The ID gene family (ID1–ID4), especially ID3 and ID4, plays a crucial role in regulating stemness. Gliomas exhibit elevated expression of ID1-3, while ID4 is important for the development of cancer stem cells and it is associated with patient survival because of its inverse relationship with MMP2 expression in GBM.28,29 In GBM, GFAP has emerged as a key diagnostic marker that elevated levels are closely associated with tumor volume and histological characteristics.30,31 Because of their consistent correlation with malignant transition, these six genes represent a suitable panel for risk classification and surveillance. Molecular stratification is improved by analyzing gene modules across glioma subtypes, especially in grade III gliomas where multiple genes have substantial relationships with GFAP, indicating new regulators in the early stages of tumor growth. For patients who are more likely to experience rapid progression, subtype-specific modules such as those found may enhance risk classification and guide treatment plans. Notably, SLC1A3 and NTRK2 highlight the possibility of targeted therapy and drug resistance prediction. 32 Increased AGT levels, which are commonly seen in malignant gliomas, may allow tumor cells to avoid the lethal effects of methylating or chloroethylating drugs employed in antiglioma therapy. 33 EDNRB mediates glioma cell plasticity by activating key intracellular signaling pathways such as ERK and STAT3 and by promoting proneural-to-mesenchymal transition. 34 In GBM, the GFAP co-expression network included JUNB, MRPS17, CHCHD2, GBAS, CHCHD2P6, CHCHD2P9, CCT6A, and SEC61G. As shown in GBM models, CRISPR-Cas9-mediated knockout of CHCHD2 reduced cell growth, invasion, and therapy resistance. While its nuclear accumulation suggested involvement in mitonuclear retrograde signaling pathways.35,36 CCT6A overexpression promotes epithelial–mesenchymal transition (EMT) and enhances invasive properties of GBM cells. 37 In recurrent gliomas, GFAP-associated genes, including FADS2, HSPB8, and CNN3, indicated a shift toward metabolic adaptability and therapy resistance. HSPB8 modulates genes linked to cancer proliferation and genomic stability, and its dysregulation disturbs intergenic regulatory networks. 38 Abnormal phosphorylation of ERK1/2 (p-ERK1/2) is a hallmark of GBM signaling dysregulation. The E3 ligase FBXL16 interacts with CNN3 and induces non-degradative polyubiquitination at lysine 17, disrupting CNN3’s protection of p-ERK1/2 and facilitating dephosphorylation by PPP1R9A and PPP1CC. Conversely, the deubiquitinase USP5 restores CNN3’s protective function, maintaining elevated p-ERK1/2 levels. Aberrant ERK1/2 signaling, maintained through the CNN3–FBXL16–USP5 axis, points to a potential therapeutic vulnerability within the recurrent tumor setting. 39 This study presents a comprehensive framework combining single cell clustering, trajectory analysis, and correlation-based DEG profiling to investigate glioma tumor evolution and recurrence. It identifies subtype-specific gene modules and pinpoints six conserved DEG candidates relevant to progression. Key regulators, like GFAP, are suggested as targets for personalized therapy. Although pseudo time analysis suggested dynamic transcriptional relationships among glioma-associated cellular states, these findings should be interpreted cautiously. The inferred trajectories reflect computationally predicted transcriptional progression patterns rather than definitive evidence of cellular lineage transformation. Additional longitudinal and functional studies would be required to establish direct biological transition mechanisms. The findings underscore the need for validation through large patient cohorts and clinical trials to improve glioma care, highlighting the importance of functional studies and longitudinal sampling for developing clinical biomarkers and targeted interventions.
Limitations
This study has several limitations including small and unbalanced sample size, reliance on a single public dataset, and lack of experimental validation.
Conclusion
The results of this study showed that the GFAP gene and its co-expression network play a key role in tumor persistence and progression in three glioma states, including grade III glioma, primary glioblastoma, and recurrent glioma. Analysis of developmental pathways at the single-cell level showed that radial glial cells gradually transform into malignant cells, and six core genes, APOE, AQP4, CLU, GFAP, ID3, ITM2C, and ID4, are stably expressed at all stages of this transition. These genes can potentially be used as reliable markers to predict relapse and treatment resistance. Overall, the findings indicate that GFAP-related pathways have different molecular characteristics at each stage of the disease and are a suitable target for designing precise and personalized treatments in glioma.
Supplemental Material
Supplemental Material - GFAP-Dependent Transcriptional Dynamics and Cellular Heterogeneity in Primary, Recurrent, and Grade III Gliomas
Supplemental Material for GFAP-Dependent Transcriptional Dynamics and Cellular Heterogeneity in Primary, Recurrent, and Grade III Gliomas by Morteza Hadizadeh, Seyedeh Zahra Mousavi, and Sorayya Ghasemi in Cancer Informatics.
Footnotes
Acknowledgments
The authors would like to thank Shahrekord University of Medical of Sciences personals for their supports.
Ethical Considerations
The Shahrekord University of Medical Sciences granted ethical approval for the study; the ethical code is IR.SKUMS.REC.1403.135.
Consent for Publication
This study was conducted using public datasets and no human contributors were recruited.
Author Contributions
MH was responsible for software development. SZM contributed to writing the manuscript. SG contributed to study design and conception, grant acquisition, and finalization of the manuscript. All authors reviewed and approved the final version of the article.
Funding
The authors disclosed receipt of the following financial support for the research, authorship, and/or publication of this article: This research was supported by [7640 Grant Number] of Shahrekord University of medical Sciences.
Declaration of Conflicting Interests
The authors declared no potential conflicts of interest with respect to the research, authorship, and/or publication of this article.
Data Availability Statement
The data that support the findings of this study are available from the corresponding author upon reasonable request.
Supplemental Material
Supplemental material for this article is available online.
Appendix
References
Supplementary Material
Please find the following supplemental material available below.
For Open Access articles published under a Creative Commons License, all supplemental material carries the same license as the article it is associated with.
For non-Open Access articles published, all supplemental material carries a non-exclusive license, and permission requests for re-use of supplemental material or any part of supplemental material shall be sent directly to the copyright owner as specified in the copyright notice associated with the article.