
Abstract
Access to safe and clean water is essential for sustainable development, particularly in rural areas where infrastructural deficits and sanitation challenges are pronounced. This study evaluated groundwater quality in 32 rural communities across 10 local government areas (LGAs) of Osun State, Nigeria, in relation to Sustainable Development Goal (SDG) Target 6.3, which aims to improve water quality by reducing pollution and eliminating hazardous discharges. Water samples were analysed for physico-chemical parameters—pH, temperature, total alkalinity, total dissolved solids (TDS), electrical conductivity (EC), total hardness, nitrates, phosphates, sulphates, chlorides, and turbidity—and microbiological indicators, including total coliforms and Escherichia coli (E. coli). Results indicate that most physico-chemical parameters complied with World Health Organization (WHO) and Nigerian standards, suggesting minimal chemical degradation of groundwater. In contrast, widespread microbiological contamination was observed, with elevated coliform counts and E. coli presence in 14 communities, identifying faecal contamination as the primary factor undermining SDG 6.3 compliance. Water Quality Index (WQI) analysis further revealed substantial spatial variation: several villages scored “excellent” or “good,” whereas others, including Owu-Ile, Masifa, and Alaasan, were classified as “very poor” or “unsuitable” for drinking. Hotspots of microbial non-compliance were concentrated in Ejigbo and Ede North LGAs, while temperature and minor alkalinity deviations were observed in select communities.The findings highlight that failures in rural water quality are predominantly driven by inadequate sanitation and hygiene practices rather than chemical contamination. Achieving SDG 6.3 in Osun State therefore requires targeted interventions, including strengthened rural sanitation infrastructure, routine microbial monitoring, community-based water governance, and spatially prioritised resource allocation. The integration of WQI provides a practical tool for synthesising multi-parameter water quality data, enabling policymakers to identify high-risk communities and design evidence-based strategies for sustainable rural water management in Nigeria.
Keywords
Introduction
Access to clean and safe water remains one of the most pressing environmental and public health challenges globally.1,2 Despite improvements in water supply infrastructure in many regions, water pollution continues to undermine efforts to achieve universal access to safe drinking water.3,4 Across low- and middle-income countries, water resources are increasingly degraded by a combination of industrial effluents, agricultural runoff, domestic sewage, and poor solid waste management practices. 5 These pollution sources introduce a complex mix of pathogenic, chemical, and organic contaminants that threaten human health, degrade aquatic ecosystems, and constrain sustainable development. Rural communities are particularly vulnerable, as they often depend on untreated surface or groundwater sources and lack both the infrastructure and institutional capacity required for effective water quality monitoring and treatment. 6
In response to these global challenges, the United Nations adopted the Sustainable Development Goals (SDGs) in 2015, with Goal 6 aiming to “ensure availability and sustainable management of water and sanitation for all.” 7 Within this framework, Target 6.3 specifically prioritises improvements in water quality by reducing pollution, eliminating dumping, and minimising the release of hazardous chemicals and materials. The target further seeks to halve the proportion of untreated wastewater and substantially increase recycling and safe reuse by 2030. Achieving SDG 6.3 is particularly critical in rural contexts, where reliance on natural water sources is high and exposure to waterborne diseases remains widespread. 8
Access to clean water is fundamental to rural development, public health, and livelihood sustainability. Safe water supports agricultural productivity, underpins food security, and plays a vital role in hygiene and disease prevention. 9 Conversely, inadequate access to potable water is closely linked to higher incidences of waterborne diseases such as diarrhoea, cholera, and typhoid fever—ailments that disproportionately affect children, the elderly, and other vulnerable groups in rural communities. 10 Ensuring compliance with water quality standards in rural areas is therefore not only an environmental imperative but also a matter of social equity and public health justice.11,12.
Nigeria, like many developing countries, has formally committed to achieving the SDGs, including Target 6.3. While the country has undertaken water sector reforms and introduced environmental policies aimed at improving water governance, implementation has been uneven across regions. 13 Empirical data on water quality compliance—particularly in rural areas—remain limited and fragmented. Many rural communities continue to face persistent challenges related to inadequate water infrastructure, weak regulatory enforcement, poor sanitation practices, and low public awareness of water safety.14,15 These disparities between urban and rural water services pose a significant threat to Nigeria’s overall progress towards SDG 6.
Within southwestern Nigeria, Osun State exemplifies these broader rural water challenges. The state contains many rural settlements where households rely heavily on groundwater and surface water sources for domestic use. 16 Existing studies and preliminary assessments suggest considerable variability in water quality across rural communities, raising concerns about compliance with national and international water quality standards.17,18 Understanding these patterns is essential for identifying systemic weaknesses in rural water governance and informing targeted interventions.
Globally and regionally, rural water quality is shaped by a complex interplay of natural processes and anthropogenic pressures. Seasonal rainfall, for example, has been shown to drive fluctuations in turbidity as storm-water runoff transports sediments and organic matter into water sources. 19 Similarly, electrical conductivity (EC) and total dissolved solids (TDS) often increase following rainfall events, reflecting both mineral dissolution and agricultural inputs. 20 Variations in pH and alkalinity have also been widely documented, with values occasionally falling outside World Health Organization (WHO) guidelines due to rainfall intensity, evaporation, and underlying geology. 21
Nutrient contamination—particularly nitrates and phosphates—has emerged as a recurrent concern in rural settings adjacent to cultivated land, highlighting the impacts of fertiliser leaching and the absence of effective buffer zones. 20 Sulphate and chloride concentrations are similarly influenced by both geological weathering and human activities, including domestic waste disposal and agricultural practices. 22 In Nigeria, numerous studies across ecological zones consistently report that while many physico-chemical parameters remain within acceptable limits, microbial contamination—especially elevated total coliform and Escherichia coli (E. coli) counts—poses the most immediate and widespread public health risk.21,23
Beyond biophysical factors, governance and institutional capacity play a decisive role in water quality outcomes. Although Nigeria’s National Water Policy and drinking water standards specify acceptable thresholds for key physico-chemical and microbiological parameters, enforcement and routine monitoring remain weak, particularly in rural areas. 24 Limited funding, inadequate laboratory facilities, and insufficient technical personnel constrain effective surveillance. While recent community-based monitoring initiatives show promise, systematic spatial assessment of contamination hotspots and sustained regulatory oversight remain limited. 24
Against this backdrop, rigorous assessment of key physico-chemical and microbiological parameters is essential for evaluating progress towards SDG Target 6.3 and identifying priority areas for intervention. Accordingly, this study aims to: (i) evaluate key physico-chemical and microbiological parameters of water quality in selected rural communities of Osun State; (ii) determine the extent to which observed water quality conditions align with benchmarks set by the World Health Organization (WHO), the Nigerian Standard for Drinking Water Quality (NSDWQ), and other relevant regulatory frameworks; and (iii) identify spatial variations and potential hotspots of non-compliance that may undermine progress towards achieving SDG 6.3.
Method of Study
Study Area
This study was conducted in the 10 Local Government Areas (LGAs) that constitute the Osun West Senatorial District (OWSD) of Osun State, southwestern Nigeria (Figure 1). The LGAs include Ede North, Ede South, Egbedore, Ejigbo, Irewole, Isokan, Iwo, Ayedire, Ola-Oluwa, and Aiyedaade. Geographically, the district lies between latitudes 7°30′N and 8°00′N and longitudes 4°00′E and 4°30′E. The terrain is characterised by undulating plains interspersed with low-lying hills, with elevations ranging from approximately 200 to 500 m above sea level.

Map of Nigeria showing Osun State and Osun west senatorial district.
The climate of the area is tropical, marked by a distinct wet season extending from March to October and a dry season from November to February. Annual rainfall and seasonal variability play a significant role in shaping surface and groundwater dynamics. The district is drained by several rivers and perennial streams, including tributaries of the Osun River, which serve as important sources of water for domestic use and agriculture. However, stream discharge typically declines during the dry season, increasing reliance on groundwater sources. 3
Geologically, Osun West is predominantly underlain by Precambrian Basement Complex rocks, mainly granite, migmatite, and gneiss. These lithologies form fractured and weathered aquifers that constitute the primary groundwater reservoirs in the area, with groundwater availability largely dependent on the degree of rock weathering and fracturing. 25 The overlying soils are generally ferrallitic, moderately drained, and susceptible to leaching, a condition that significantly influences groundwater chemistry, particularly pH, nutrient concentrations, and mineral content.26,27
Ecologically, the district lies within the derived savanna–rainforest transition zone, characterised by secondary forest regrowth, savanna woodland, and extensive agricultural land. Land-use practices, vegetation cover, and seasonal rainfall strongly influence surface runoff patterns, sediment transport, turbidity levels, and microbial loading of water sources. 28 Farming constitutes the dominant livelihood activity, with major crops including cocoa, cassava, maize, yam, and oil palm. Trading, artisanal activities, animal husbandry, and small-scale fishing also contribute to household incomes. Access to improved water infrastructure varies across communities, and many rural settlements depend on streams, hand-dug wells, and boreholes for domestic water supply, often with concerns regarding water quality and seasonal availability. 29
Sampling Technique and Sample Size
A field-based, empirical research design was adopted to evaluate the compliance of rural water sources in Osun State, Nigeria, with Sustainable Development Goal (SDG) 6, Target 6.3. The study integrated direct field observations with laboratory-based analyses of water samples to generate empirical evidence on the physico-chemical and microbiological quality of water sources commonly used in rural communities.
A multi-stage sampling strategy was employed to ensure systematic coverage and reduce selection bias. In the first stage, Osun West Senatorial District was purposively selected due to its predominantly rural settlement structure and widespread dependence on natural and manually constructed water sources, including hand-dug wells, boreholes, rivers, and streams. All 10 Local Government Areas (LGAs) within the district were included to provide comprehensive spatial representation of rural water-use conditions.
In the second stage, rural communities were selected using a stratified random sampling approach, with LGAs treated as sampling strata. The selection of each rural community was determined by their respective of their accessibility. This procedure ensured that spatial variability in hydro-environmental conditions and water-use practices across LGAs was adequately captured. A total of 32 rural communities were randomly selected across the 10 LGAs, proportionate to the distribution of rural settlements within each LGA (Figure 2).
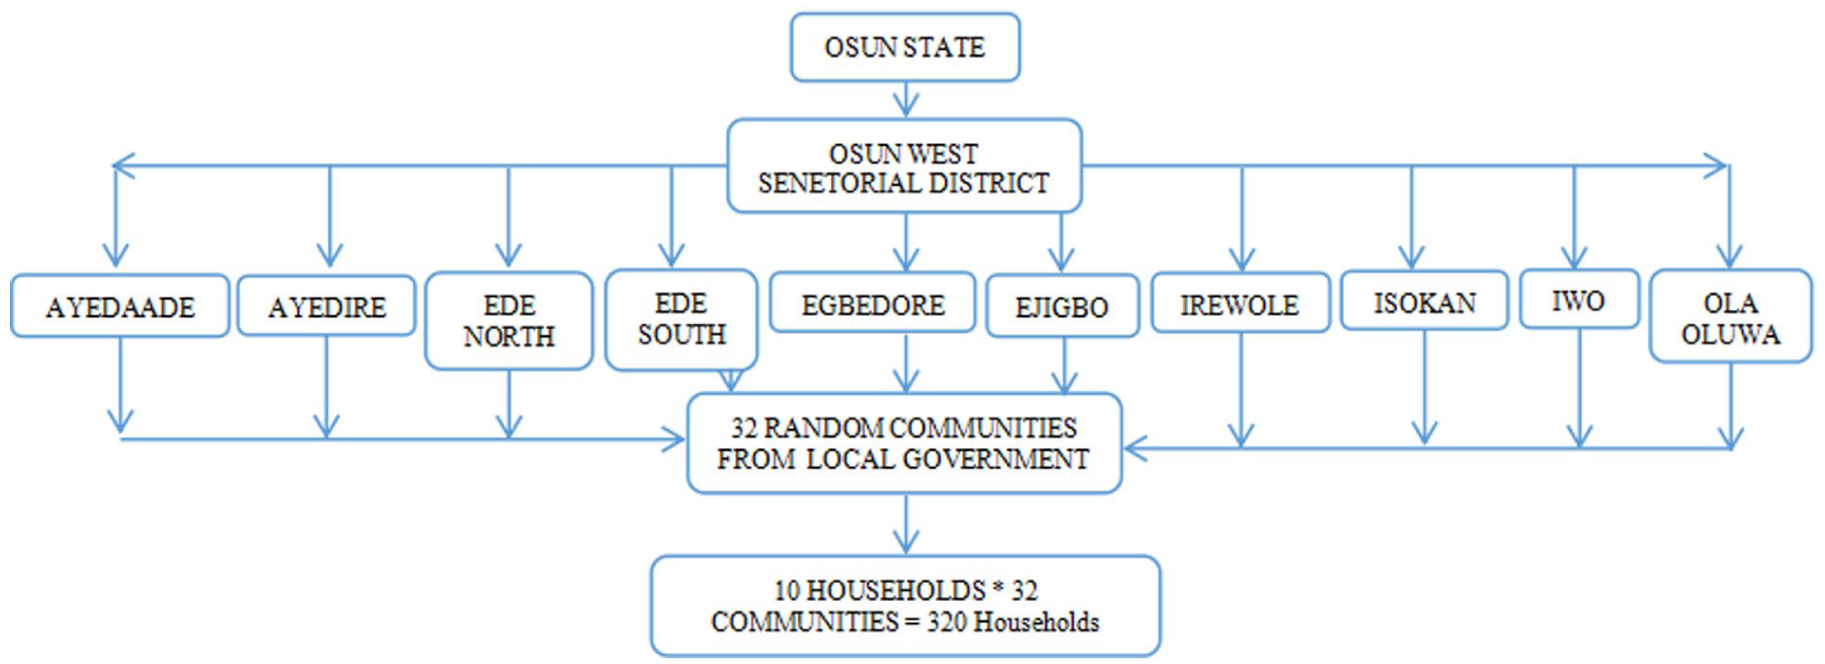
Flow chart showing step-by-step stages of sample selection.
In the final stage, 1 principal domestic water source was identified in each selected community for sampling. Water sources were purposively selected based on frequency of use, accessibility, and relevance to household water consumption. This approach ensured that the sampled sources reflected actual exposure pathways and provided a realistic basis for assessing compliance with national and international water quality standards. Although the purposive selection of water sources limits statistical generalisation beyond similar rural contexts, the stratified random selection of communities strengthens the internal validity and spatial representativeness of the findings within Osun West Senatorial District.
The sample size of 32 rural communities was considered adequate for an exploratory, district-wide assessment of groundwater and surface water quality in a predominantly rural setting. This sample provided meaningful spatial coverage across all 10 LGAs, capturing variability in hydrogeological conditions, land-use practices, and sanitation contexts. Consequently, the findings should be interpreted as indicative of prevailing exposure conditions and compliance patterns, offering robust baseline evidence to inform policy interventions, while recognising the need for larger and longitudinal studies to support broader generalisation beyond the study area.
Data Collection
Water sample collection was carried out with adherence to standard procedures to prevent contamination and ensure reliability of results. Clean, sterilised plastic bottles were used to collect samples directly from the identified sources. Each sample was properly labelled and stored in an icebox to maintain its integrity during transportation to the Chemistry and Microbiology Laboratories at Bowen University, Iwo.
Codes and Coordinates of Collection of Water Samples
The water samples were collected from the major water sources in the selected communities. The names of the LGAs and the randomly chosen communities are listed in Table 1. Additionally, the geographic coordinates of each water source were recorded using a GPS device at the exact points of sample collection (Figure 3). This ensured precise location mapping, facilitating spatial analysis of water accessibility and quality across the study area.
Code and Coordinate of Collection Point of Water Samples for Analysis.

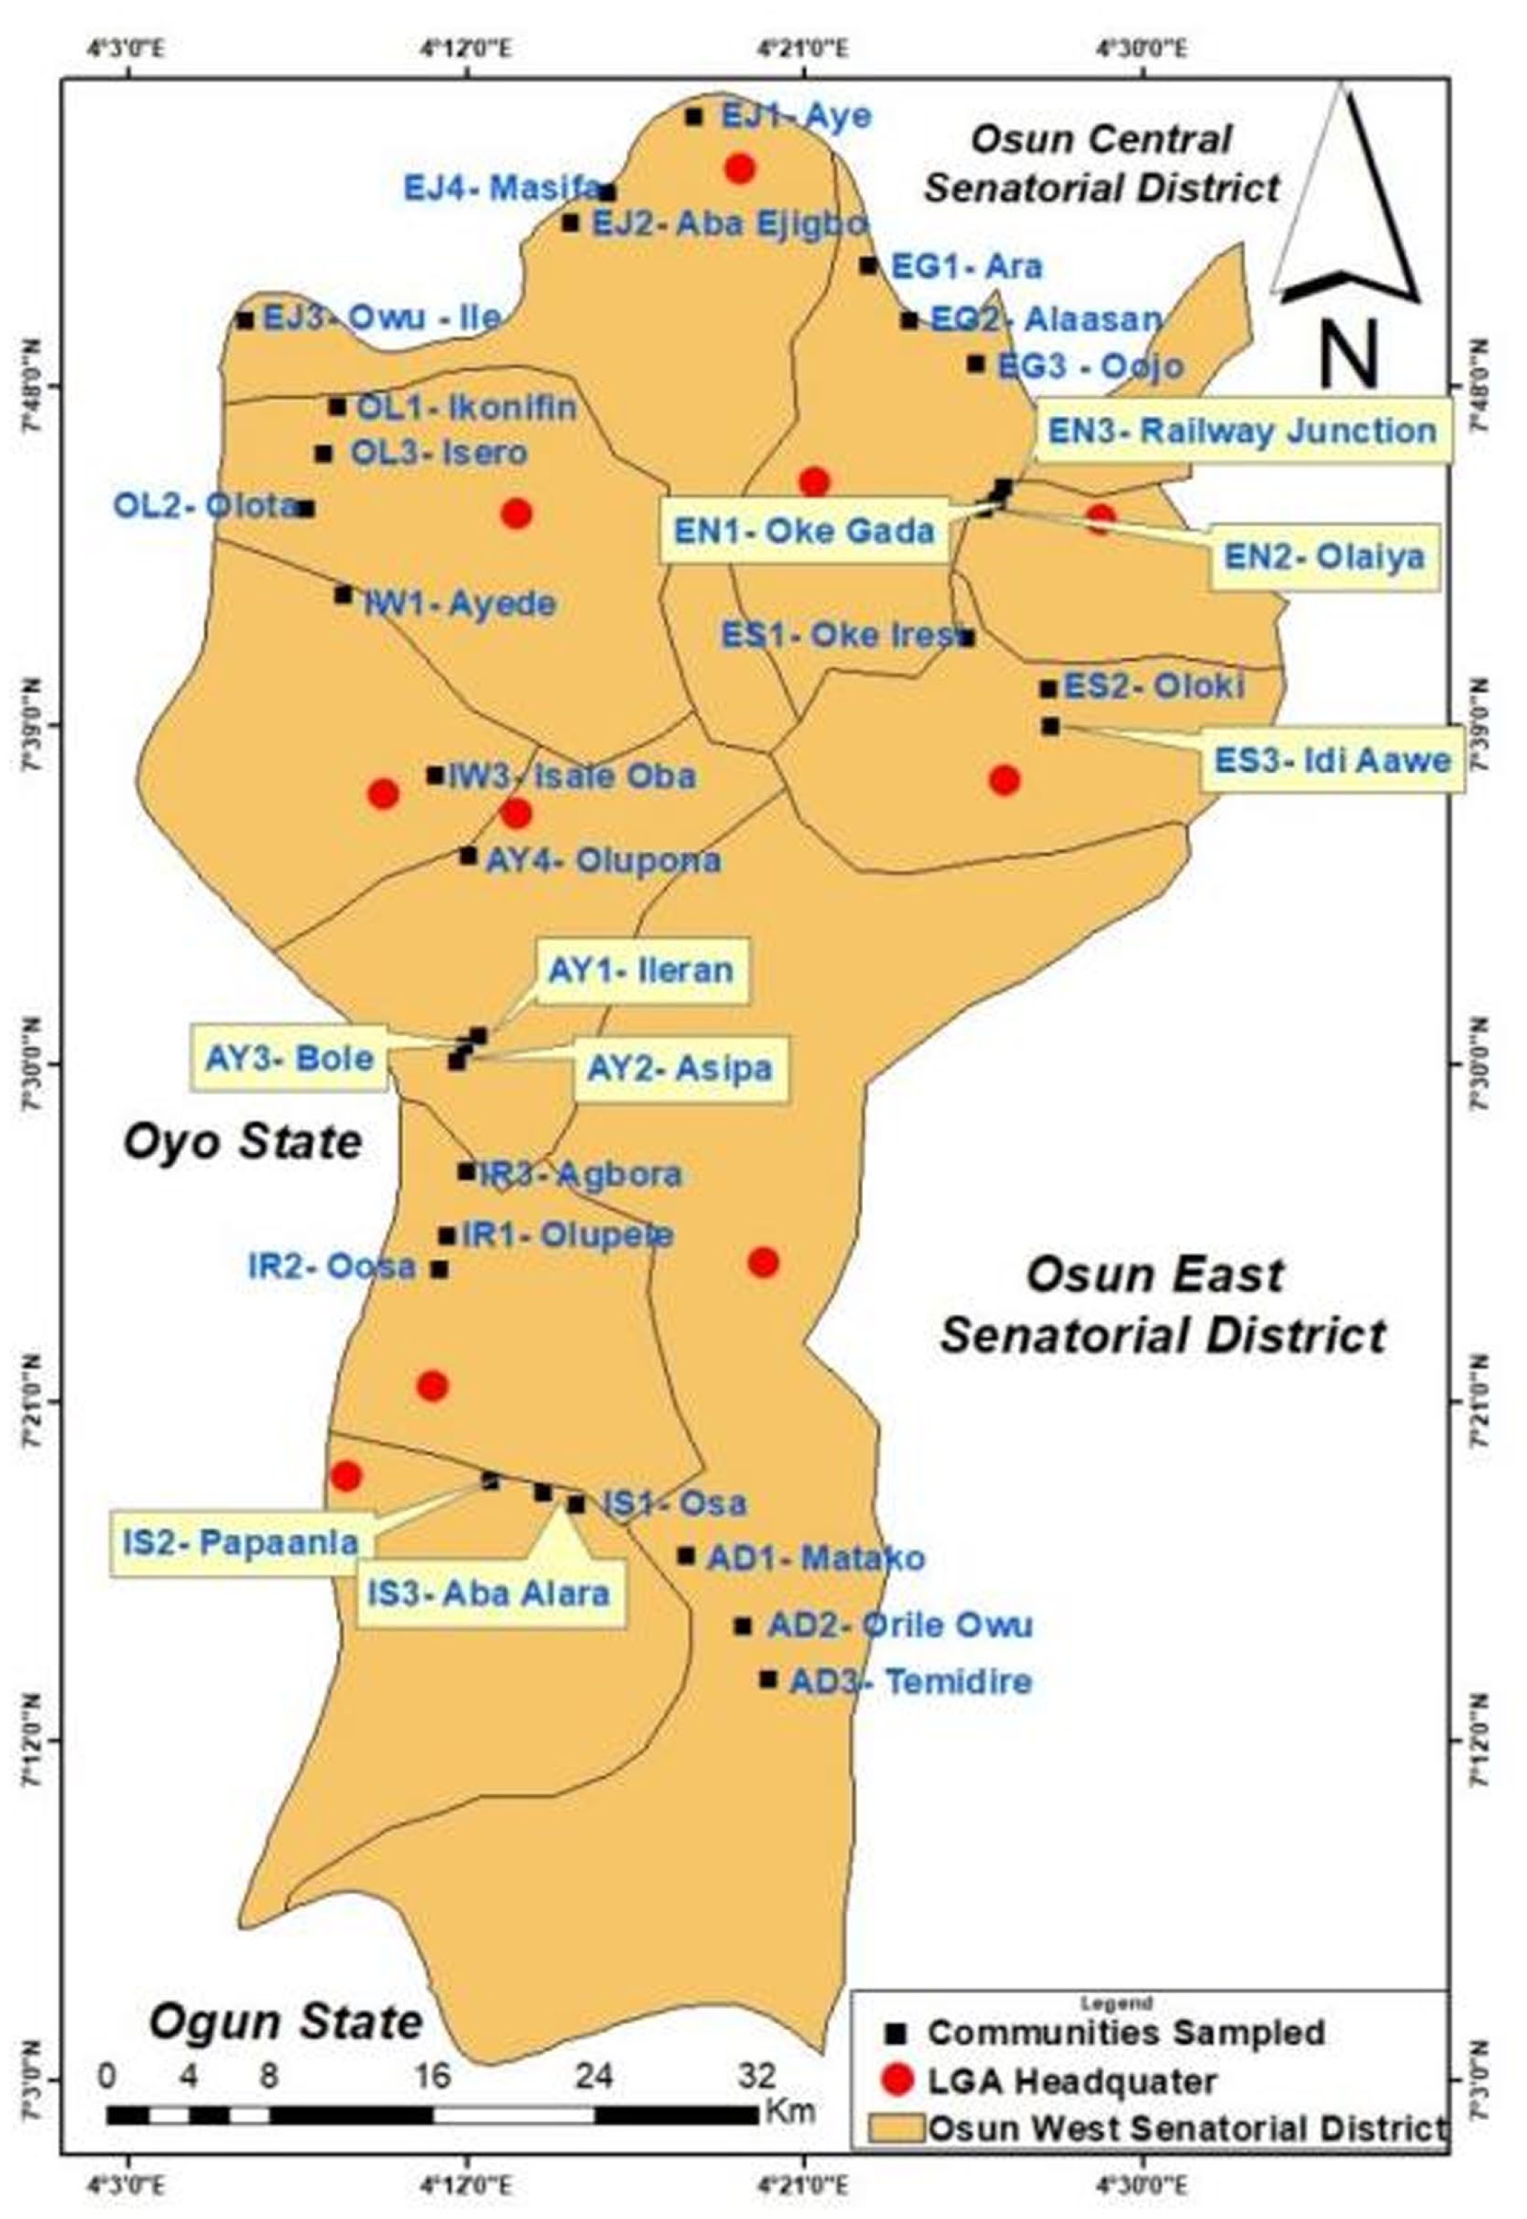
Osun west senatorial district map showing the rural communities investigated.
Quality Control and Replication
To ensure the reliability of results, all media, glassware, and sample containers were sterilised prior to use, and strict aseptic techniques were maintained throughout the analyses. Serial dilution and the use of both pour plate and MPN methods served as internal cross-checks for microbial counts. In addition, distilled water blanks were included as negative controls to verify sterility during culturing. Where possible, analyses were performed in duplicate, and results were compared across methods to minimise error and strengthen confidence in the data obtained.
Data Analysis and Laboratory Procedures
Laboratory Procedures and Data Analysis
Laboratory analyses were undertaken to assess key physico-chemical and microbiological parameters relevant to evaluating compliance with Sustainable Development Goal (SDG) 6, Target 6.3. The parameters analysed included pH, temperature, electrical conductivity (EC), total dissolved solids (TDS), turbidity, total alkalinity, total hardness, nitrates, phosphates, sulphates, chlorides, total coliforms, and Escherichia coli (E. coli), with particular emphasis on microbiological indicators due to their direct relevance to faecal contamination and public health risk.
Laboratory Analysis
Physico-chemical parameters were determined using standard analytical procedures consistent with World Health Organization (WHO) and Nigerian Standard for Drinking Water Quality (NSDWQ) guidelines. Water temperature, pH, EC, and TDS were measured in situ using a calibrated portable multiparameter water quality metre (Hanna Instruments HI 98194, USA). Calibration was conducted daily using standard buffer solutions (pH 4.0, 7.0, and 10.0) and conductivity standards to ensure accuracy. Turbidity was measured using a digital turbidity metre (HACH 2100Q, USA). Total alkalinity and total hardness were analysed in the laboratory using standard titrimetric methods, while nitrate and phosphate concentrations were determined using spectrophotometric techniques with a UV–visible spectrophotometer (HACH DR 3900, Germany), following protocols outlined in Standard Methods for the Examination of Water and Wastewater in American Public Health Association, American Water Works Association, & Water Environment Federation. 30 Sulphate and chloride concentrations were analysed using turbidimetric and argentometric methods, respectively.
Microbiological analysis focussed on total coliforms and E. coli as indicators of faecal contamination. These were determined using the membrane filtration technique in accordance with American Public Health Association, American Water Works Association, & Water Environment Federation 30 standards. Known volumes of water samples were filtered through sterile 0.45 µm membrane filters and incubated on selective media under prescribed conditions. Colony-forming units were enumerated and expressed as CFU per 100 mL of water. Strict aseptic procedures were maintained throughout sampling, transportation, and laboratory analysis.
Field Observations
In addition to laboratory measurements, structured field observations were conducted at each sampling location to document environmental and sanitary conditions likely to influence water quality. Observations included the proximity of sanitation facilities, refuse disposal sites, livestock activity, drainage patterns, and the presence or absence of protective infrastructure around water sources. Field notes and geo-referenced photographs were used to contextualise laboratory findings and support interpretation of contamination pathways.
Statistical Analysis
Data analysis involved both descriptive and inferential statistical techniques. Descriptive statistics, including means, ranges, and standard deviations, were computed to summarise water quality parameters and to compare observed values with WHO and NSDWQ guideline limits. Inferential analyses were employed to examine spatial variations in water quality across the study area. Independent samples t-tests and one-way analysis of variance (ANOVA) were used to compare physico-chemical parameters between LGAs and between groups of communities categorised by high and low levels of microbiological contamination (based on coliform counts). Where ANOVA results indicated statistically significant differences, appropriate post hoc tests were applied. Statistical significance was assessed at P < .05. All statistical analyses were performed using the Statistical Package for the Social Sciences (SPSS), version 26.0.
Water Quality Index (WQI) Computation
To synthesise the multi-parameter water quality data into a single, easy-to-interpret metric, a Water Quality Index (WQI) was calculated for each sampled community and aggregated at the LGA level. The WQI was computed using the weighted arithmetic index method, which integrates multiple water quality parameters relative to established drinking water standards.
Each parameter was assigned a unit weight (Wᵢ) based on its relative importance to human health, with higher weights allocated to parameters with greater health significance, particularly microbiological indicators. The quality rating scale (Qᵢ) for each parameter was calculated using the expression:
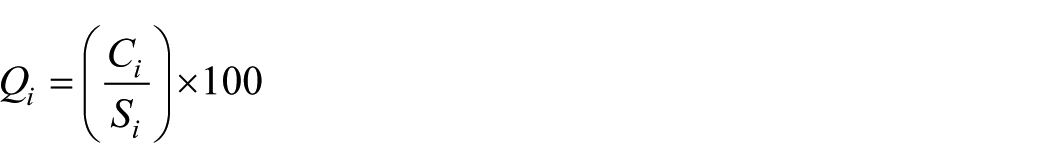
where Cᵢ is the measured concentration of the parameter and Sᵢ is the corresponding WHO or NSDWQ standard value. The overall WQI was then calculated as:

The resulting WQI values were classified to reflect overall water quality status as follows: WQI < 50 (excellent), 50 to 100 (good), 100 to 200 (poor), 200 to 300 (very poor), and >300 (unsuitable for drinking). This classification facilitated comparison of overall water quality across communities and LGAs, enabling the identification of spatial patterns and hotspots of non-compliance with SDG Target 6.3.
Ethical Considerations
Ethical approval for the study was obtained from the Bowen University Research Ethics Committee. Community leaders and residents were informed about the objectives of the study, and consent was obtained prior to sample collection. As the study involved environmental sampling without the collection of personal or health-related data, it posed minimal ethical risk.
Results and Discussion
Table 2 details the groundwater quality assessment for communities in Osun West Senatorial District (OWSD). Comparative analysis against the31 -33 guidelines reveals that a majority of samples meet safe drinking water criteria. However, specific parameters in certain locations exceed permissible limits (denoted by asterisks*), indicating contamination risks that render these sources unsuitable for consumption. The table explicitly lists regulatory thresholds and highlights non-compliant samples, pinpointing areas where urgent intervention is needed to safeguard water quality and public health.
Descriptive Pattern of Ground Water Quality in the Study Area.
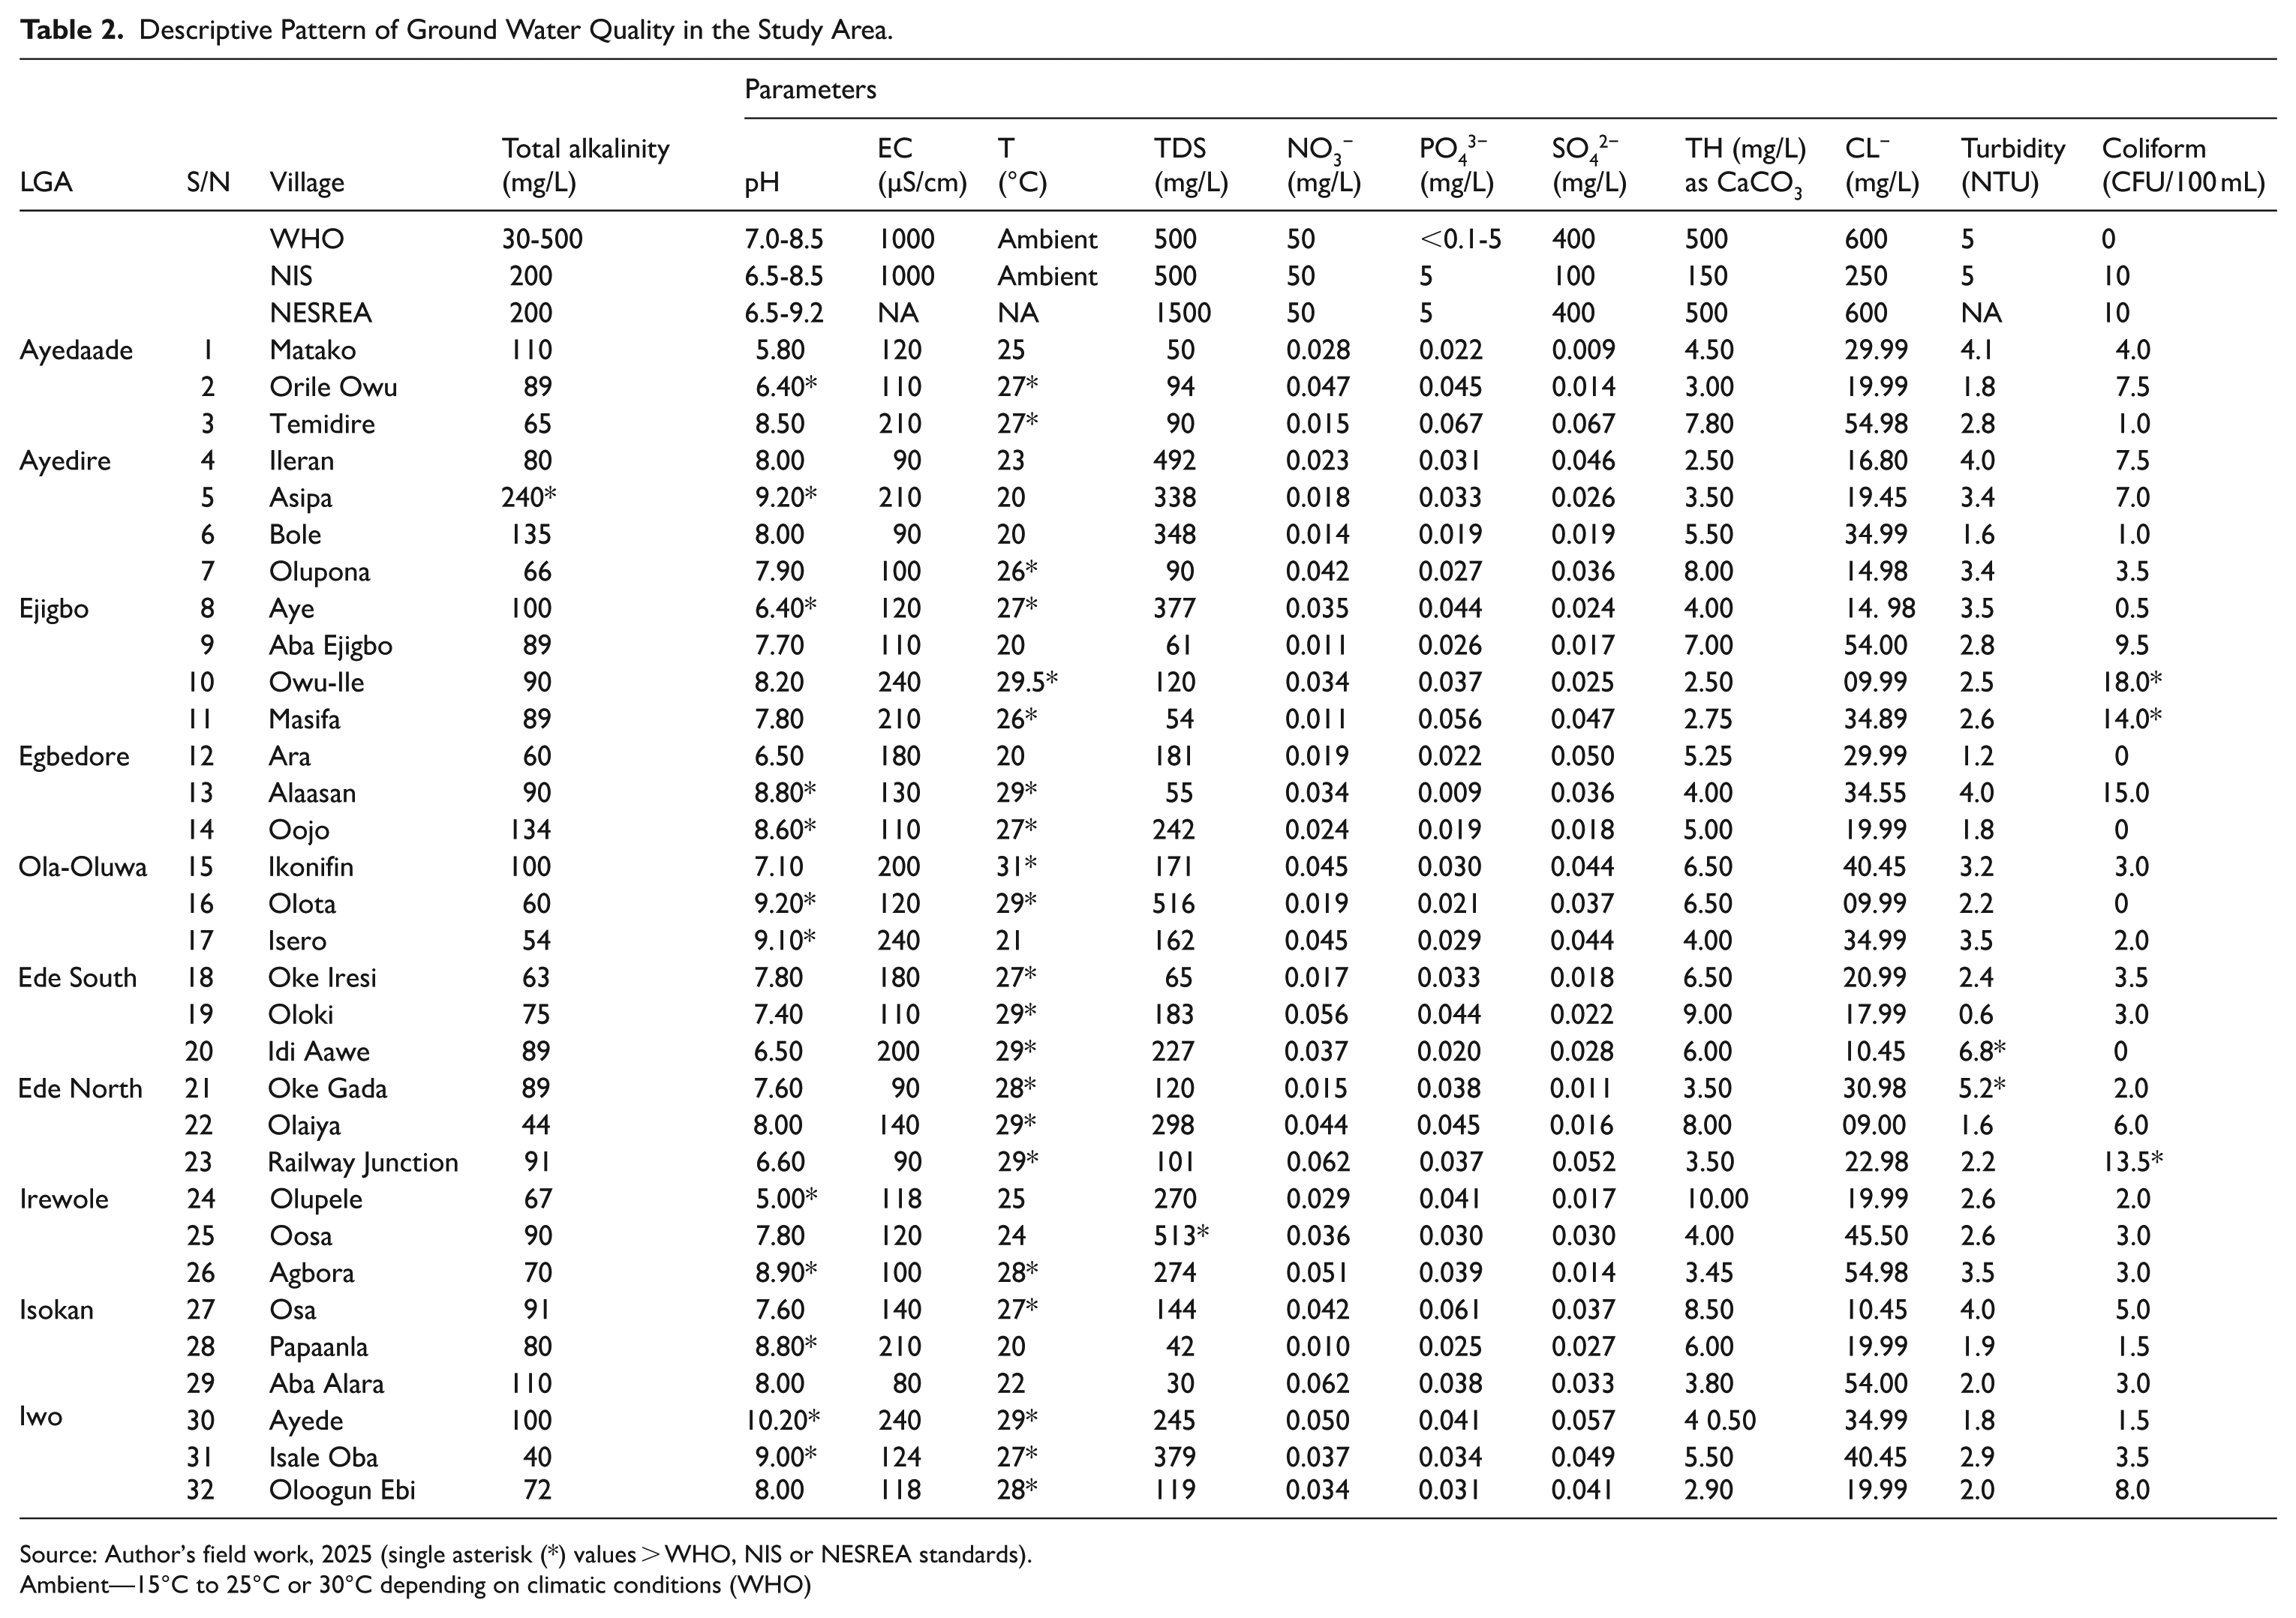
Source: Author’s field work, 2025 (single asterisk (*) values > WHO, NIS or NESREA standards).
Ambient—15°C to 25°C or 30°C depending on climatic conditions (WHO)
Total Alkalinity Levels
The study measured total alkalinity across multiple communities, with most samples falling within acceptable ranges, revealed in Figure 4. According to WHO guidelines (30-500 mg/L), all locations showed compliant alkalinity levels, though some exceeded Nigeria’s stricter NIS and NESREA standards of 200 mg/L. Communities like Matako (110 mg/L), Orile Owu (89 mg/L), and Temidire (65 mg/L) demonstrated ideal conditions, while others including Ileran (80 mg/L) and Bole (135 mg/L) remained below the national threshold. However, Asipa in Ayedire recorded concerning levels at 240 mg/L, surpassing Nigerian standards but still within WHO limits.

Pattern of total alkalinity in the water samples.
Elevated alkalinity in Asipa’s groundwater raises several practical concerns. High alkalinity can lead to pipe scaling that reduces water system efficiency and affects treatment processes. It also impacts water taste and may indicate underlying geochemical imbalances that could facilitate accumulation of other contaminants. While not an immediate health risk, these conditions warrant continued monitoring as they may compromise water quality over time and potentially affect consumer health through indirect pathways. The findings highlight the importance of context-specific water quality assessments that consider both international and national standards.
pH Levels
Figure 5 shows pH levels, measured on a 0 to 14 scale, serve as a fundamental indicator of water quality, reflecting its acidity or alkalinity. The WHO recommends an optimal pH range of 7.0 to 8.5 for drinking water, while Nigerian standards (NIS and NESREA) permit a slightly broader range of 6.5 to 8.5. Field measurements using calibrated instruments showed most communities, including Temidire (8.50), Ileran (8.00), and Owu-Ile (8.20), maintained pH values within these safe parameters. However, concerning exceptions emerged in Matako (5.80) and Orile Owu (6.40), where acidic conditions prevailed, and Asipa (9.20), where water was notably alkaline.
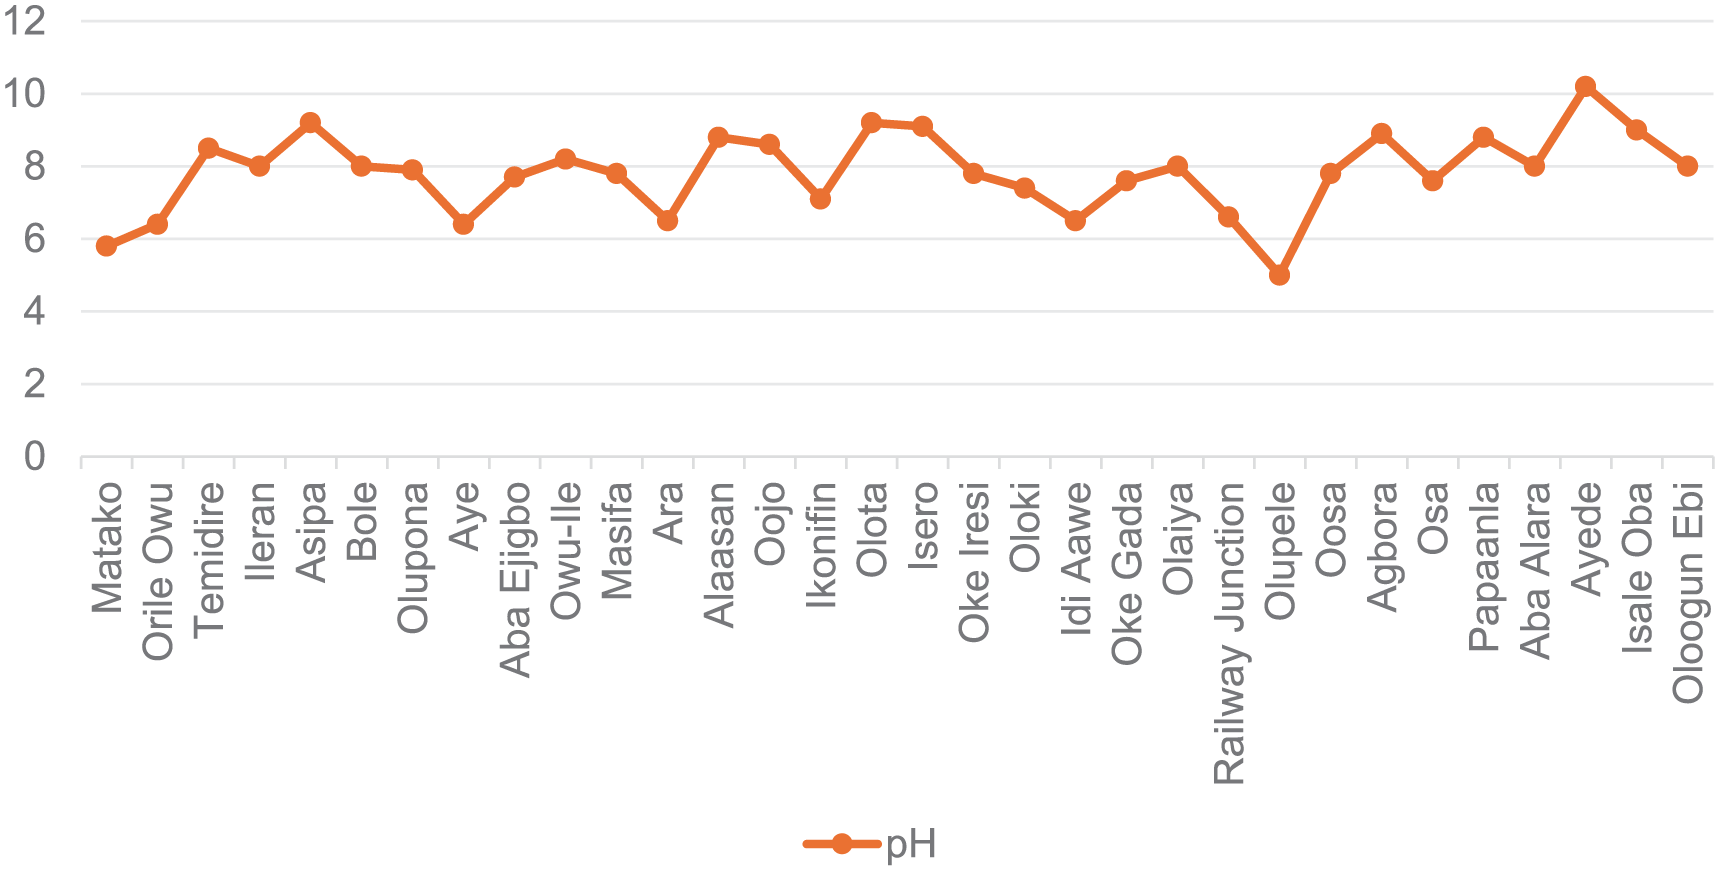
Pattern of pH in the water samples.
These pH deviations present distinct risks for water infrastructure and public health. Acidic water (pH < 6.5) accelerates pipe corrosion and heavy metal leaching, while alkaline water (pH > 8.5) promotes scale formation and reduces disinfectant efficacy. Such imbalances not only compromise water safety but may also indicate broader geochemical contamination. The findings underscore the necessity for targeted monitoring, particularly in outlier communities, where corrective measures like pH adjustment or alternative water sources may be required to ensure long-term water safety and system integrity.
Electrical Conductivity (EC)
Electrical conductivity (EC), measured in µS/cm, reflects dissolved ion concentrations in water (Figure 6). All tested samples remained below the WHO/NIS limit of 1000 µS/cm, indicating low salt content and good water quality. These results confirm the general suitability of groundwater sources for drinking purposes across the study area.

Pattern of electrical conductivity in the water samples.
Temperature (°C)
Figure 7 shows spatial variations in water temperature across the sampled communities. The World Health Organization (WHO) suggests a temperature range of approximately 15°C to 25°C for drinking water; however, it is important to clarify that this recommendation is based on aesthetic considerations (taste, palatability, and consumer acceptability) rather than direct health effects. Communities such as Ileran and Bole recorded temperatures of 23°C and 20°C, respectively, which fall within the suggested range and are generally considered acceptable for drinking. In contrast, Owu-Ile measured 29.5°C, while Alaasan and Idi Aawe recorded 29°C, slightly exceeding the recommended aesthetic range. Although these higher temperatures surpass the suggested guideline, they do not in themselves constitute a direct health violation. Rather, elevated water temperatures may indirectly influence water quality by enhancing microbial growth potential, reducing dissolved oxygen levels, and affecting taste. Such changes can compromise acceptability and may create conditions favourable for microbial proliferation if disinfection and storage are inadequate. The observed variations are likely attributable to environmental factors such as ambient climatic conditions, shallow well depth, exposure to solar radiation, or storage practices, rather than industrial contamination. Therefore, while the temperature exceedances do not represent a health-based regulatory breach, regular monitoring and improved storage practices are advisable to maintain water quality, palatability, and consumer confidence.

Pattern of temperature in the water samples.
Total Dissolved Solids (TDS)
Total Dissolved Solids (TDS) is an essential water quality indicator that reflects the concentration of dissolved minerals, salts, and organic compounds. The permissible limit for TDS in drinking water, according to WHO and NIS guidelines, is 500 mg/L. Many communities in the study displayed TDS levels well within the safe range, such as Matako (50 mg/L), Orile Owu (94 mg/L), Temidire (90 mg/L), and Olupona (90 mg/L), indicating good water quality with low levels of dissolved solids, as shown in Figure 8. These communities’ water sources are generally safe for consumption due to their low TDS concentrations.

Pattern of total dissolved solids in the water samples.
However, a few communities recorded TDS levels that approached or exceeded the standard, with Ileran measuring 492 mg/L and Olota and Oosa showing values of 516 and 513 mg/L, respectively. Elevated TDS levels can affect the taste of water, making it salty, bitter, or metallic, and may pose health risks, especially for individuals with kidney conditions, as it can lead to mineral buildup in the body. These higher values may result from natural geological formations, leaching from surrounding soils, or anthropogenic activities such as agricultural runoff and improper waste disposal. Regular monitoring and proper water treatment are essential to ensure that drinking water remains safe, palatable, and free from potential health risks.
Nitrates (NO3⁻)
Total nitrate (NO3⁻) concentrations in drinking water are measured in mg/L, with the World Health Organization (WHO) and Standards Organisation of Nigeria (SON) setting a permissible limit of 50 mg/L, while National Environmental Standards and Regulations Enforcement Agency (NESREA) prescribes a slightly stricter limit of 40 mg/L. As shown in Figure 9, nitrate concentrations across the sampled communities ranged from 0.015 to 0.062 mg/L. For instance, Matako recorded 0.028 mg/L, Orile Owu 0.047 mg/L, and Temidire 0.015 mg/L. The highest values were observed in Oloki (0.056 mg/L) and Railway Junction (0.062 mg/L). Importantly, all recorded concentrations are several orders of magnitude below the 40 to 50 mg/L regulatory thresholds. From a public health perspective, these concentrations pose no immediate risk. Methemoglobinaemia (“blue baby syndrome”), which is the principal health concern associated with nitrate in drinking water, is typically linked to concentrations approaching or exceeding 50 mg/L. The values observed in this study are less than 0.2% of that threshold, indicating that nitrate contamination is negligible in the study area at present. Although the detected levels are extremely low, slight spatial variations may reflect diffuse sources such as minor agricultural runoff or localised sewage infiltration. Nonetheless, given the substantial margin between observed concentrations and regulatory limits, nitrate does not currently constitute a health concern in the study communities. Routine monitoring should, however, be maintained to ensure levels remain within safe limits and to detect any future changes associated with land-use or population growth.

Pattern of nitrates in the water samples.
Phosphate (PO43⁻)
Phosphate levels, measured in mg/L, are a key indicator of water quality, with WHO, NIS, and NESREA standards setting a permissible limit of 5 mg/L for drinking water. In this study, phosphate concentrations in water samples from all examined communities were found to be significantly below this limit. For instance, Matako recorded 0.022 mg/L, Orile Owu 0.045 mg/L, and Temidire 0.067 mg/L (Figure 10), indicating that these water sources have low phosphate levels.
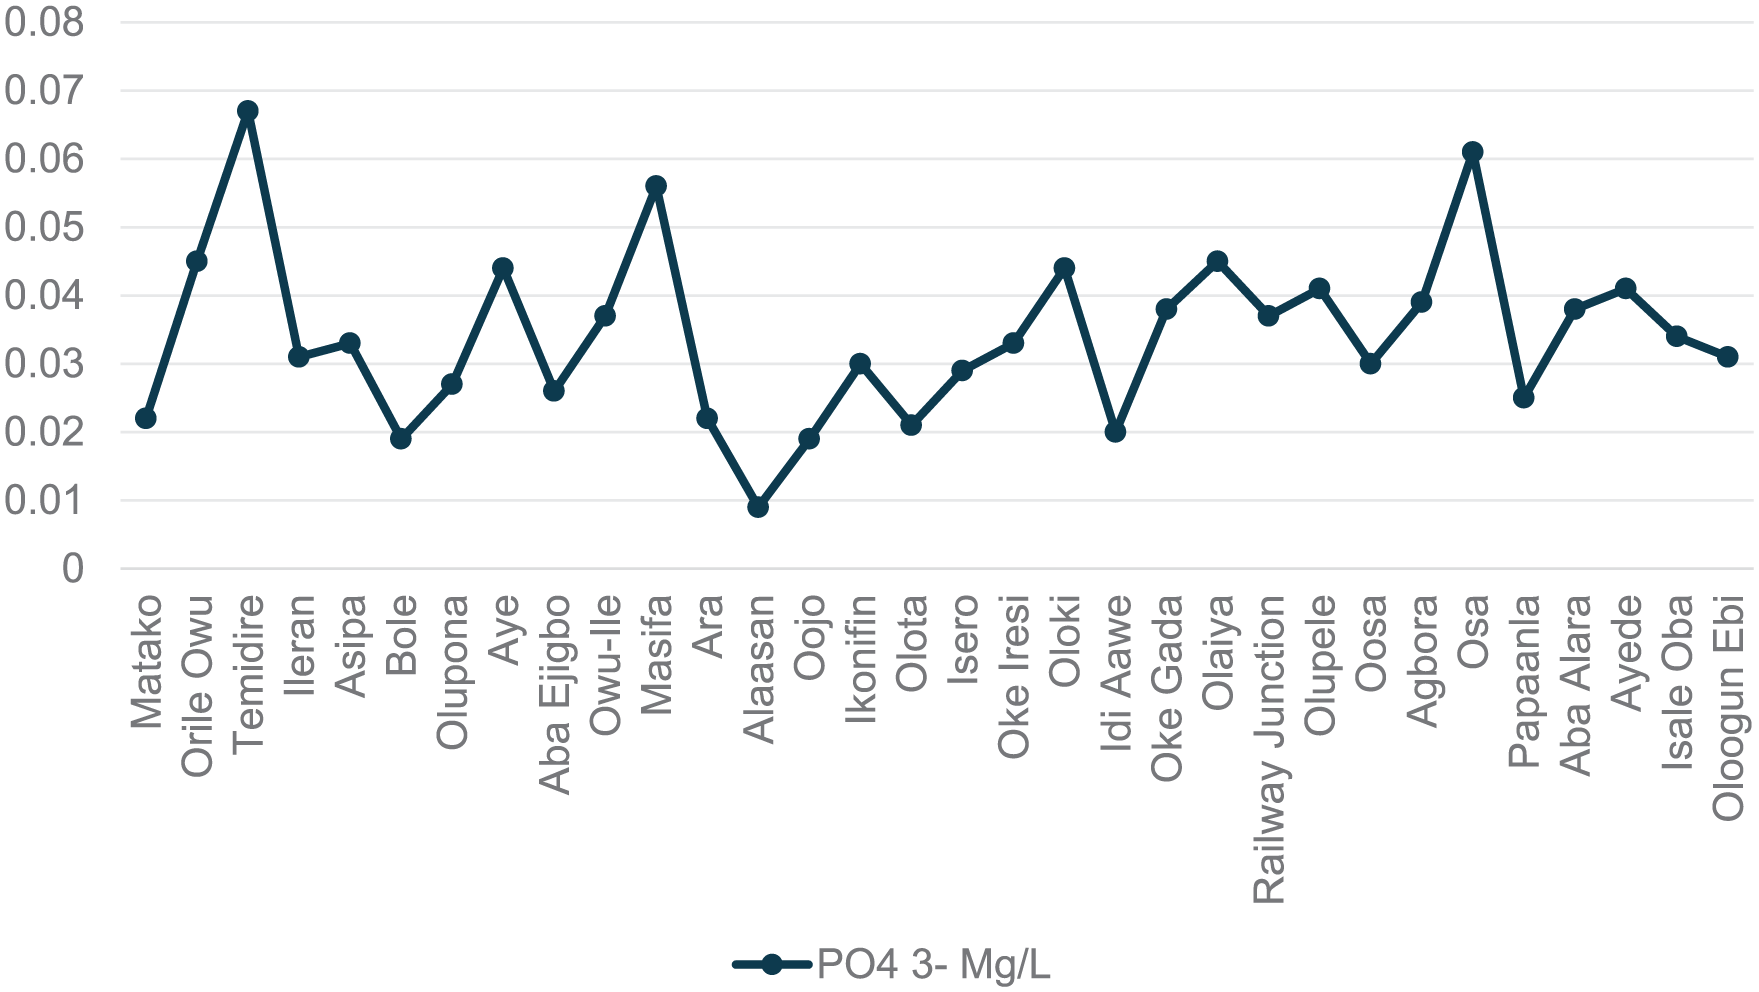
Pattern of phosphates in the water samples.
These low phosphate concentrations suggest minimal risks such as aesthetic degradation and the potential for eutrophication in connected surface water bodies, which can lead to the overgrowth of algae and other water quality issues. 21 Maintaining phosphate levels at these low concentrations is essential to ensure that water remains not only safe for consumption but also environmentally stable, preventing long-term ecological problems in surrounding water systems.
Sulphate (SO42⁻)
Sulphate (SO42⁻) levels, expressed in mg/L, have varying permissible limits based on different standards: WHO permits up to 250 mg/L, NIS specifies a limit of 100 mg/L, and NESREA allows up to 400 mg/L. The sulphate concentrations recorded in the study were very low, with values such as 0.009 mg/L in Alaasan, 0.02 mg/L in Idi Aawe, and 0.011 mg/L in Oke Gada. The highest recorded level was at Temidire, with 0.067 mg/L (Figure 11).
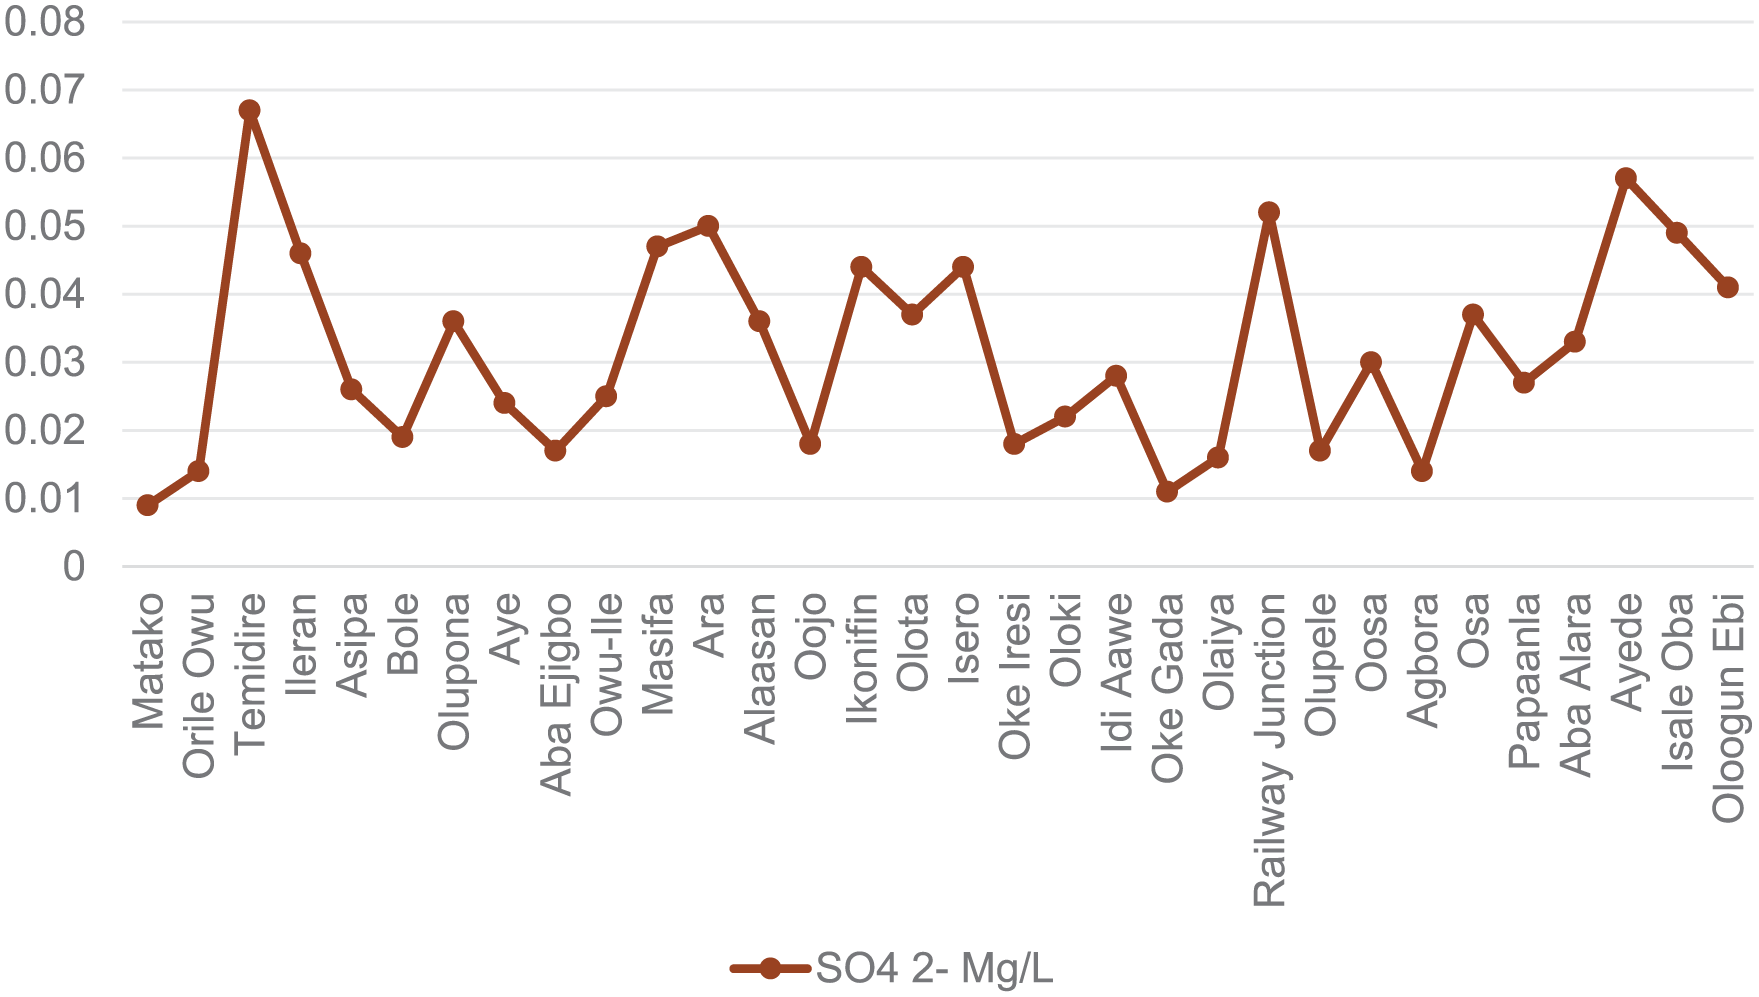
Pattern of sulphates in the water samples.
These low sulphate concentrations are advantageous for drinking water quality, as higher sulphate levels can lead to a bitter taste and, when ingested in excess, may cause laxative effects. 17 The observed values in this study suggest that the water sources are well within safe limits, ensuring that the water is not only palatable but also safe for human consumption.
Total Hardness (TH)
Total Hardness (TH), expressed in mg/L as CaCO3, reflects the concentration of dissolved calcium and magnesium in water. WHO and NESREA deem drinking water hardness of up to 500 mg/L as acceptable, while NIS sets a stricter limit of approximately 150 mg/L. In this study, most communities exhibited very low TH values, with Ileran recording 2.50 mg/L and Oloogun Ebi 2.90 mg/L as CaCO3 (Figure 12). These low levels indicate that the water is very soft, which is generally favourable for consumption and helps reduce the risk of scaling in pipes. 34
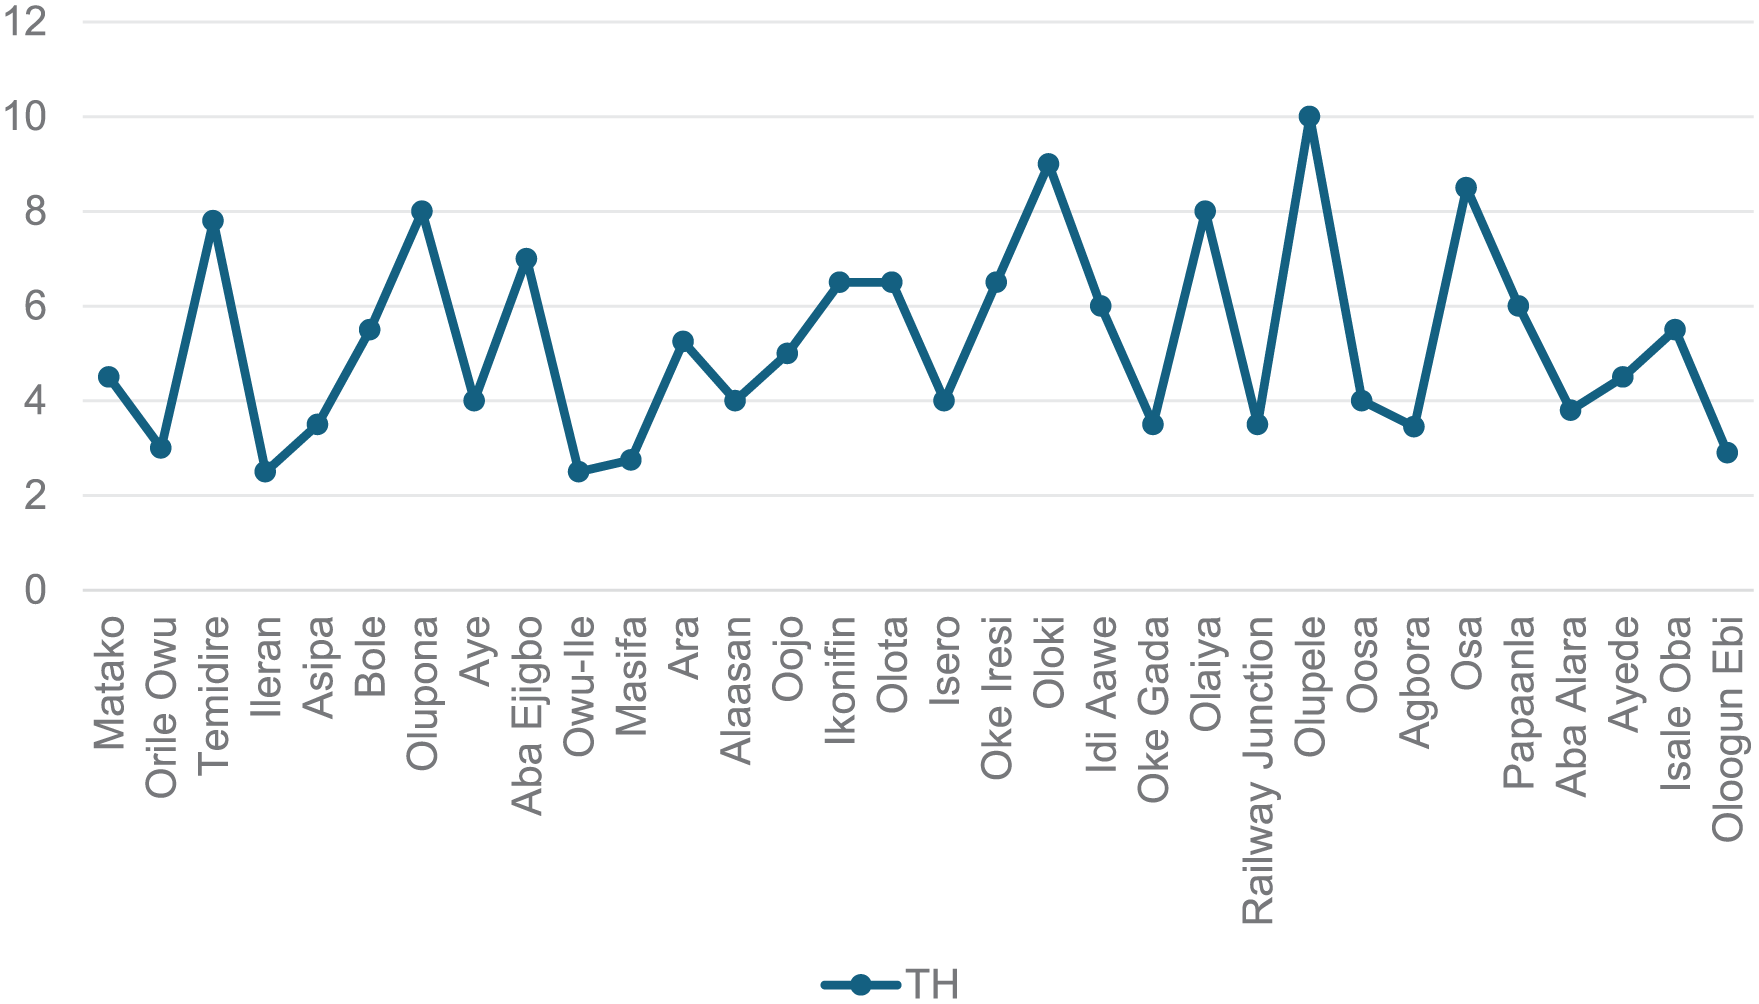
Pattern of total hardness in the water samples.
However, while soft water is beneficial for consumption, extremely low hardness levels can be problematic over time. 35 Very soft water may become corrosive to plumbing systems, leading to increased leaching of metals and the gradual deterioration of water infrastructure. It is important to balance water softness with considerations for long-term infrastructure integrity.
Chloride (Cl⁻)
Chloride, measured in mg/L, is an important water quality indicator, particularly in relation to taste and the potential corrosion of distribution systems. WHO guidelines set the permissible limit for chloride at 600 mg/L, while NIS enforces a stricter limit of 250 mg/L. In this study, the chloride levels in water samples from communities such as Olaiya (9 mg/L) and Osa (10.45 mg/L) were well within the permissible limits (Figure 13), indicating that the water quality in these areas is satisfactory in terms of chloride concentration.
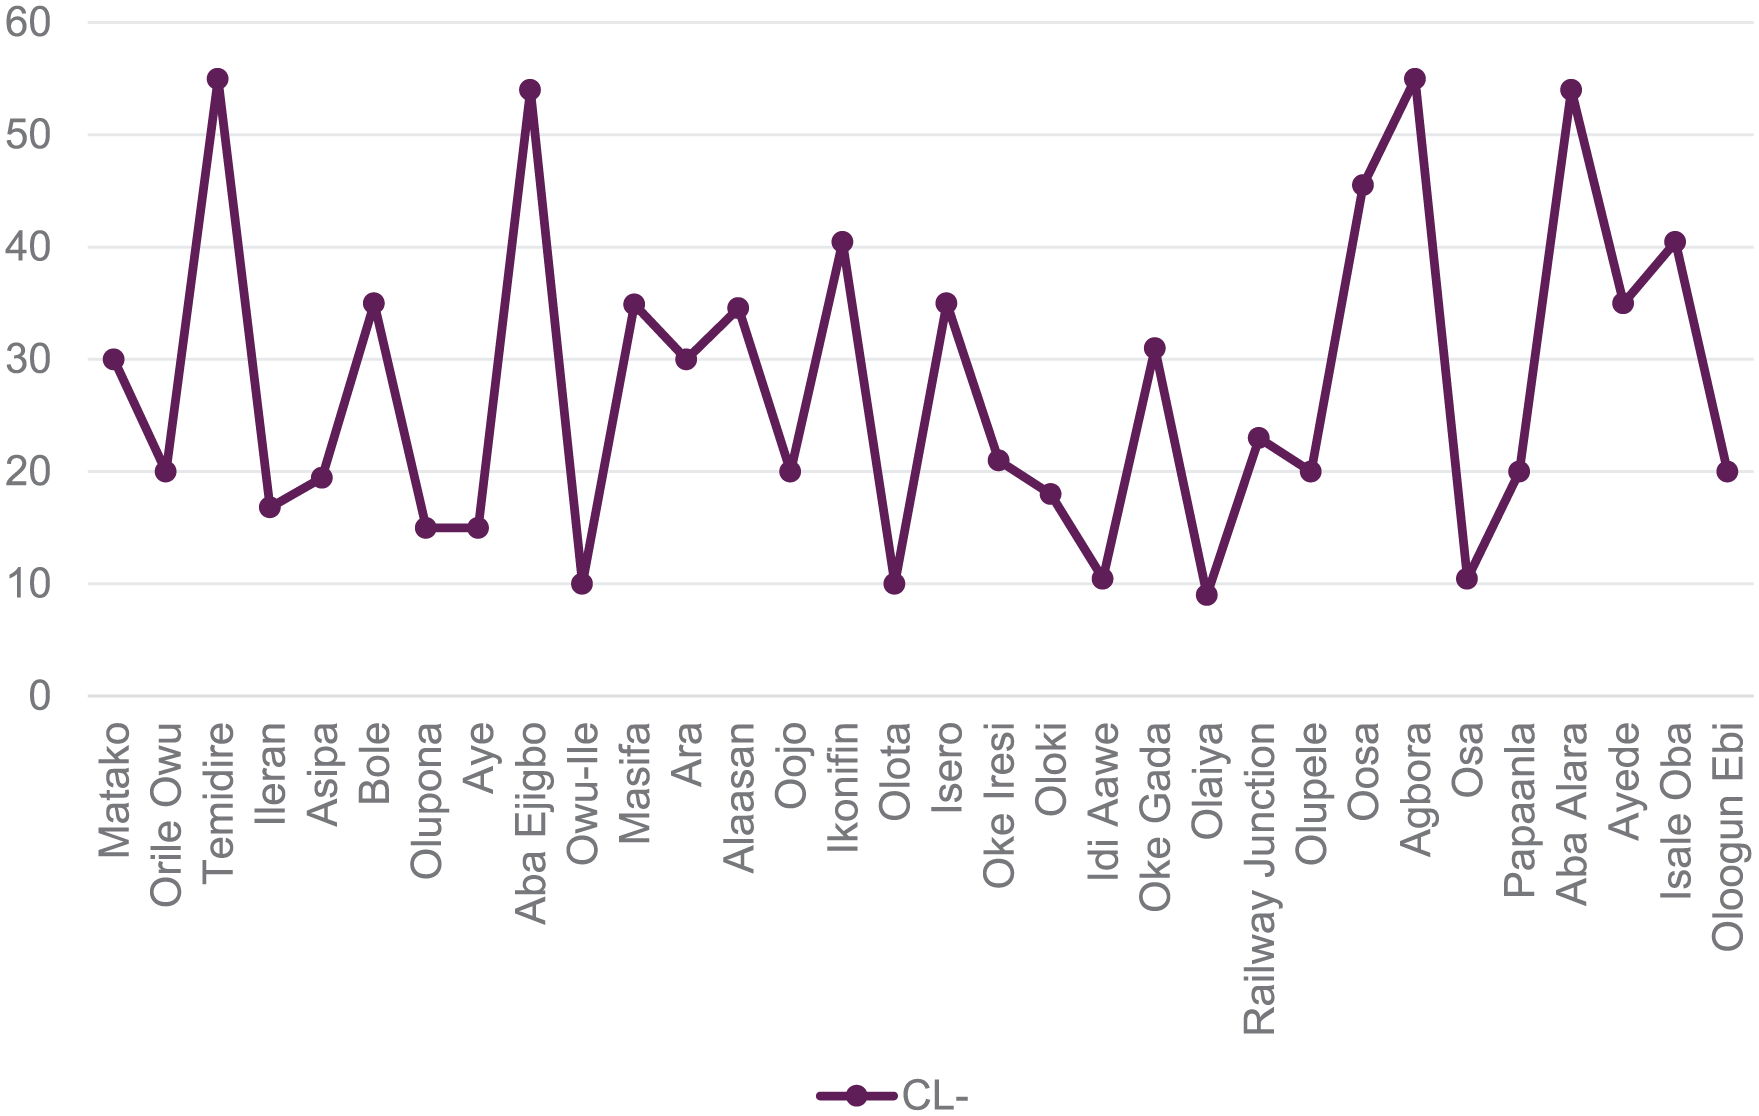
Pattern of chloride in the water samples.
If chloride levels were to rise, they could result in an unpleasant taste and increase the risk of corrosion in plumbing systems, potentially leading to the leaching of harmful metals into the water supply. Over time, such conditions could contribute to adverse health effects. Therefore, while current chloride levels are within acceptable limits, ongoing monitoring is crucial to ensure that they remain low and that water quality continues to meet safety standards.
Turbidity
Turbidity, measured in Nephelometric Turbidity Units (NTU), indicates the clarity of water and the presence of suspended particles. WHO and NIS guidelines recommend that turbidity should not exceed 5 NTU, while NESREA allows up to 10 NTU. In the study area, most communities recorded turbidity values within the acceptable range. For instance, Oloki had 0.6 NTU and Orile Owu recorded 1.8 NTU (Figure 14), both well below the recommended limits.
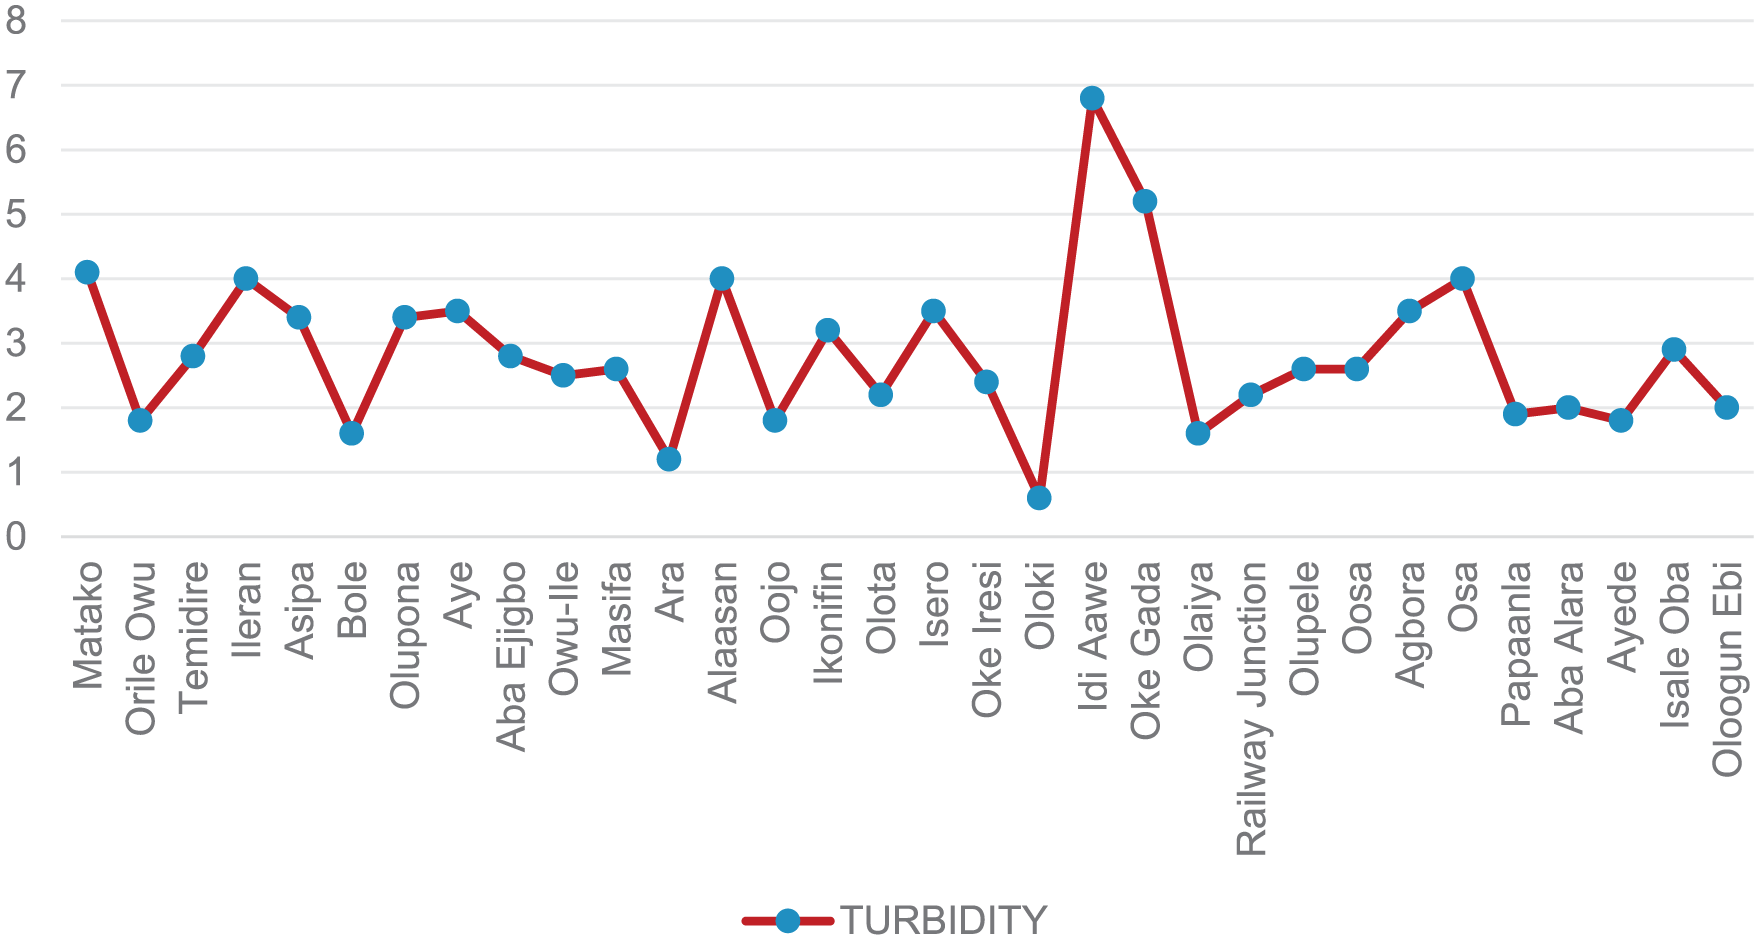
Pattern of turbidity in the water samples.
However, some communities exhibited elevated turbidity levels, with Idi Aawe registering 6.8 NTU and Oke Gada at 5.2 NTU, both exceeding the WHO and NIS limits. High turbidity can interfere with disinfection processes by shielding microorganisms from treatment, and it can also result in an unappealing appearance, which might affect consumer confidence. 23 The likely causes for these elevated levels include increased sediment runoff from nearby agricultural lands, erosion from unprotected surfaces, or insufficient treatment processes, all of which pose potential health risks by promoting biological growth and reducing water potability.
Total Coliform
Table 3 provides a detailed quantitative evaluation of biological contamination in water samples, focussing on coliform counts. Coliform counts, expressed as average CFU/mL × 10⁻2 with standard deviations, offer a comprehensive measure of water quality. Aye, Oke Gada, Bole, Olupele communities, among others recorded very low coliform count ranging between 1CFU/ml at Aye and 4CFU/ml at Olupele and Oke Gada, indicating potability of the water in the communities when compared with 10 CFU/mL which is the maximum permissible according to the NIS standard as presented in Figure 15. Only Idi aawe, Ara, Oojo and Olota communities meet the WHO coliform standards for drinking water with zero coliform count. On the other hand, communities like Masifa, Alaasan and Owu-Ile recorded higher coliform counts of 28, 30, and 36 CFU/mL respectively, exceeding universally acceptable standards. Thus, showing biological contamination of the water sources in those locations, making the water unfit for human consumption. The contamination may be attributed to the proximity of the affected wells to dumpsites, pit latrines, or household effluent discharge points. 36
Details of Coliform Counts in the Water Samples.

Abbreviations: Cfu/mL, Colony Forming unit per millilitre.

Pattern of average coliform counts in the water samples.
Comparative Analysis of Water Quality Parameters Across Different Locations
Figure 16 provides a composite line graph that visually compares multiple physico-chemical water quality parameters across various sampling locations. Unlike separate graphs for each parameter, this combined representation enables a direct comparison of trends and relationships between different water quality factors. The graph highlights variations in key parameters, including pH, electrical conductivity (EC), total dissolved solids (TDS), turbidity, temperature, and the presence of coliforms, allowing for a comprehensive overview of water quality across the studied areas.
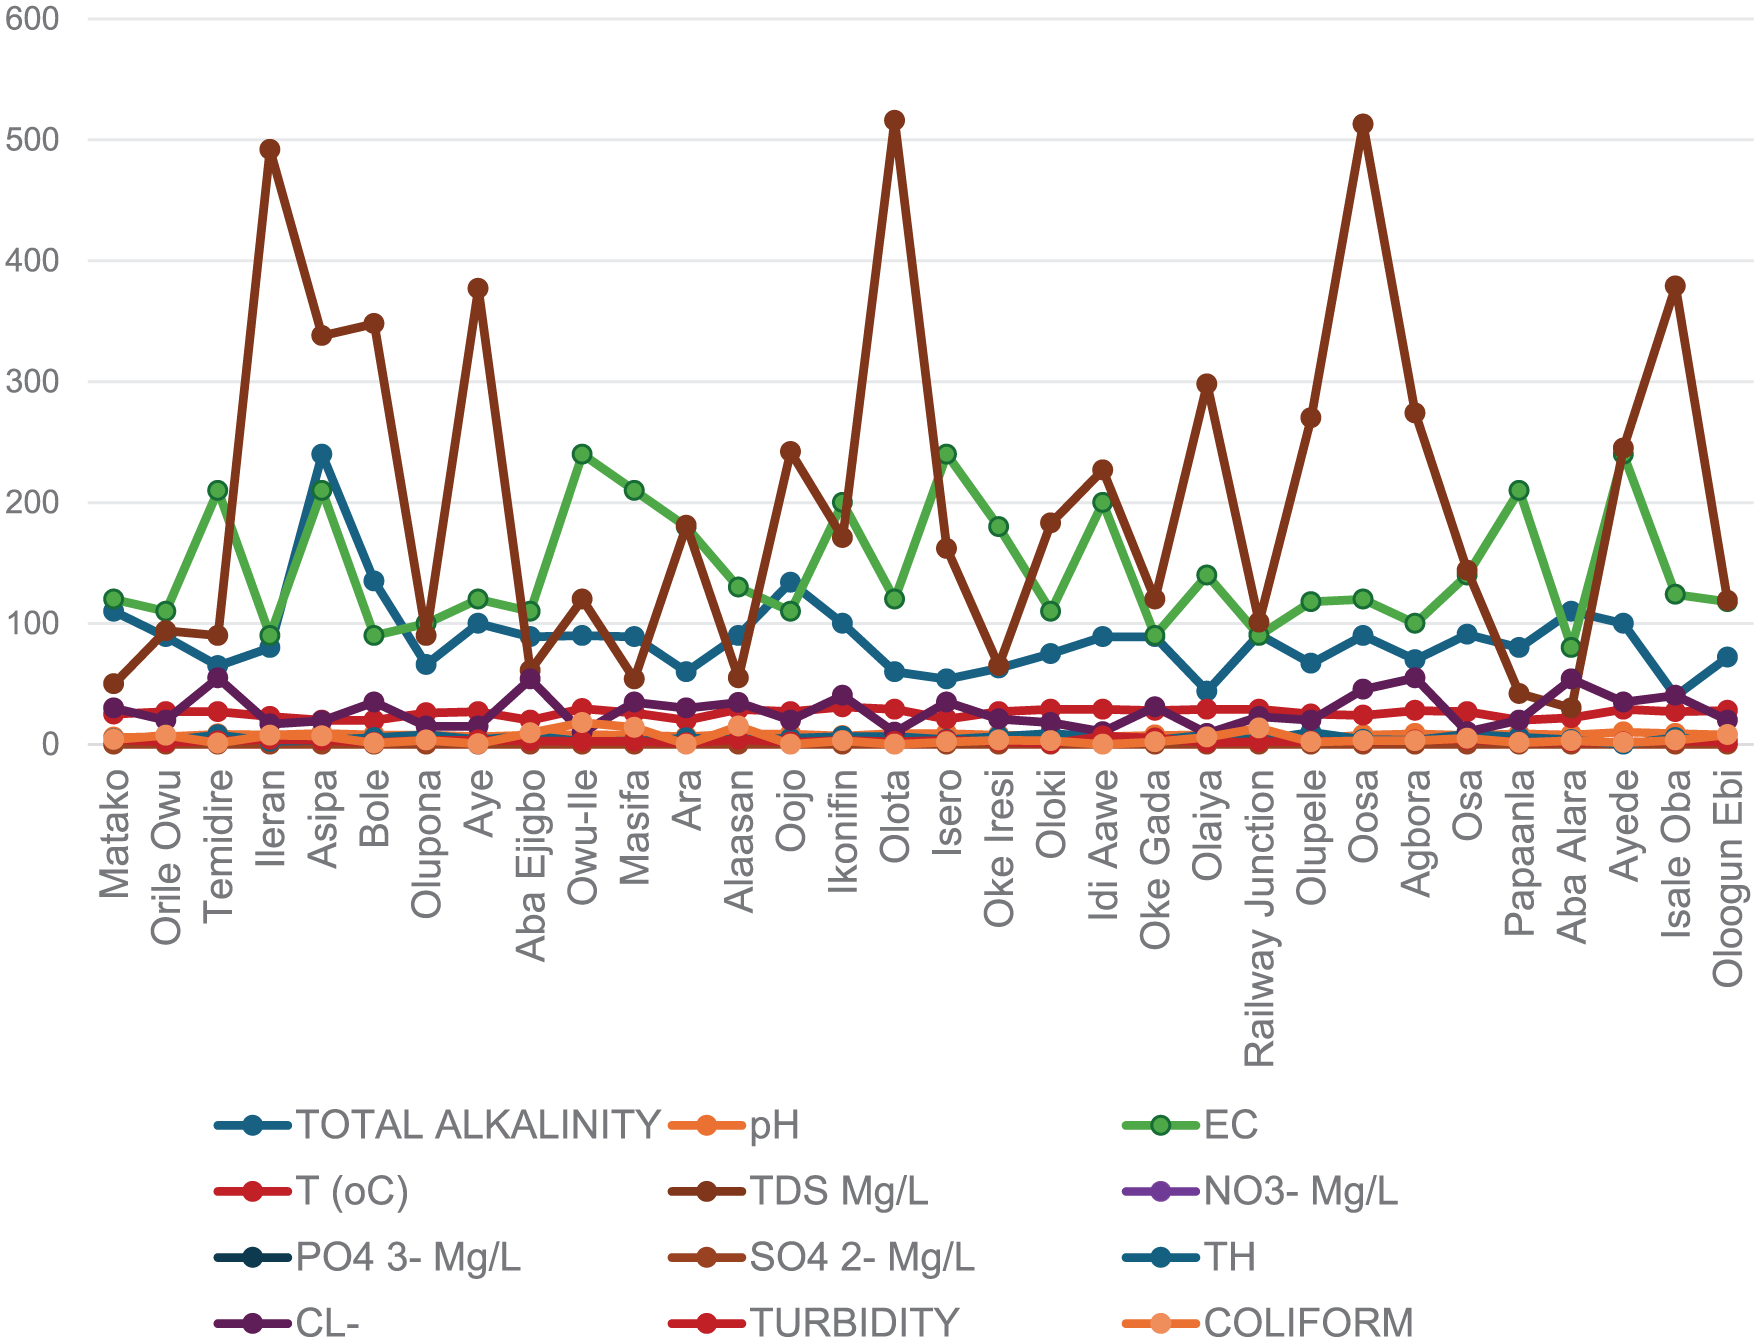
Details of water quality parameters in the study area.
Descriptive Pattern of Physico-Chemical and Biological Characteristics
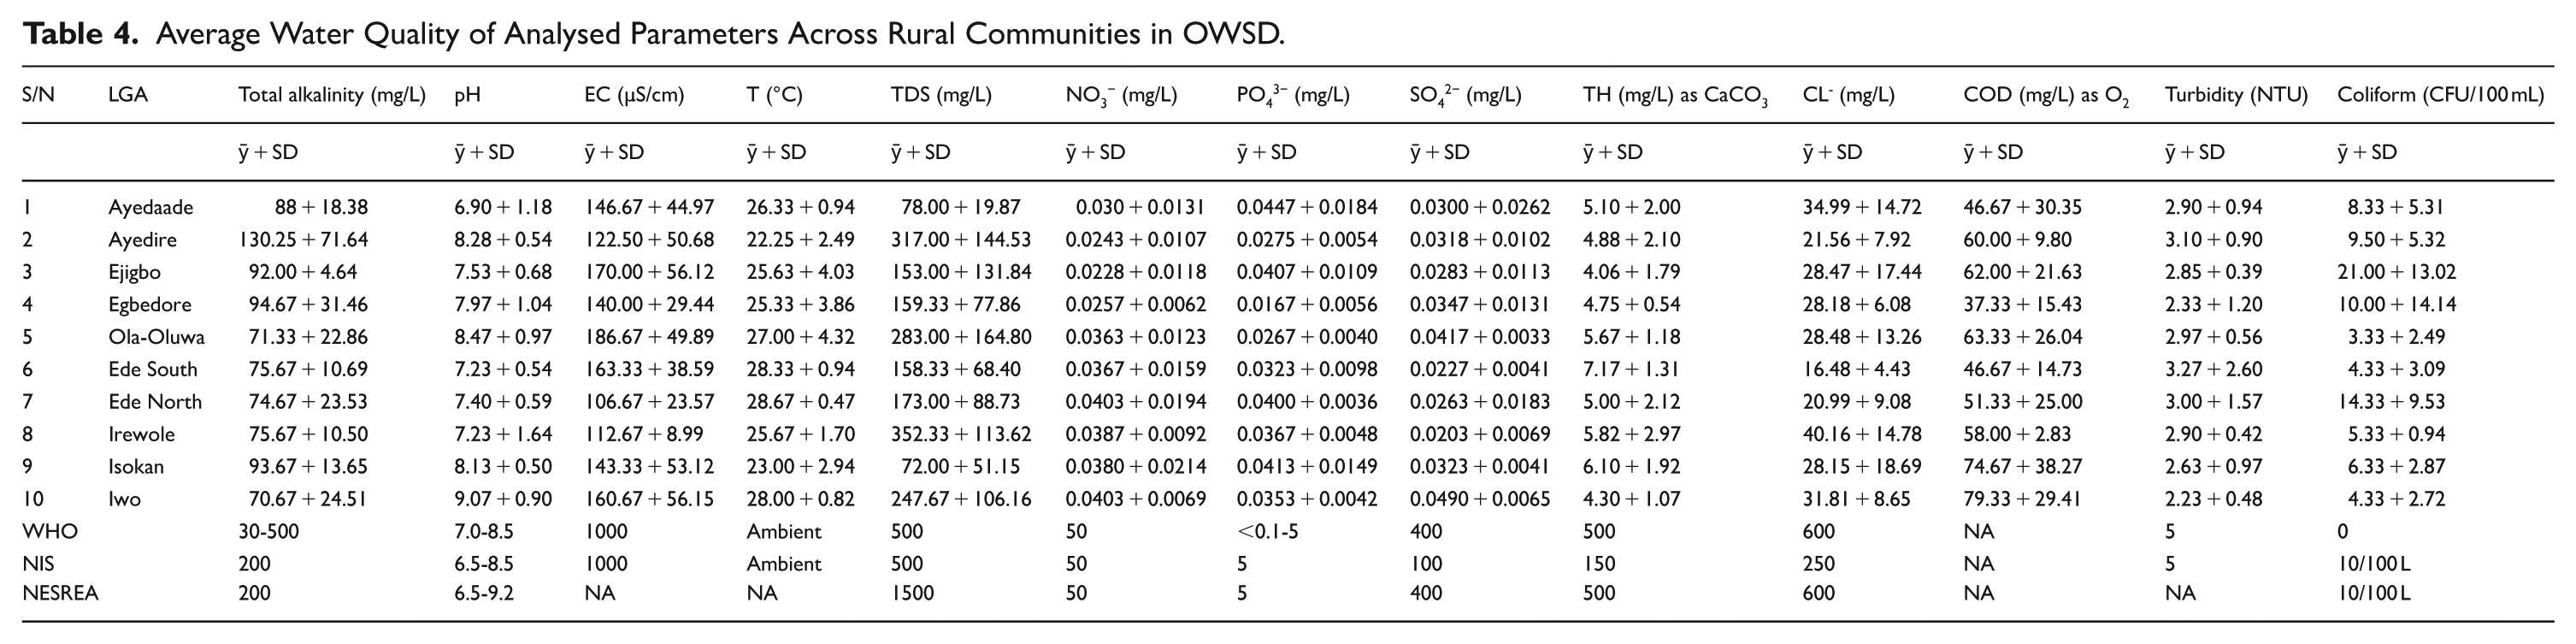
Table 4 presents the mean values and standard deviations of physico-chemical and biological parameters detected in water samples collected from communities within the study area. These statistics provide a clear overview of the variations in water quality characteristics across the sampled locations.
Average Water Quality of Analysed Parameters Across Rural Communities in OWSD.
Spatial Characteristics of Water Quality in Osun West Senatorial District (OWSD)
The spatial distribution of most water quality parameters in Osun West Senatorial District (OWSD) generally adheres to the acceptable standards set by regulatory bodies. However, 3 parameters were found to exceed the acceptable limits in specific Local Government Areas (LGAs), as illustrated in Figures 14 to 16.
Coliform Distribution
The presence of coliform bacteria in drinking water poses a significant public health risk, 17 particularly in rural areas where access to safe water is limited. In OWSD, the spatial distribution of coliform contamination, shown in Figure 17, reveals that Ejigbo and Ede North LGAs surpass the acceptable coliform limit of 10 coliform units per 100 mL, as established by the Nigerian Industrial Standards (NIS). In these areas, the mean coliform levels were 21.00/100 mL in Ejigbo and 14.33/100 mL in Ede North, both indicating a high risk of waterborne diseases.
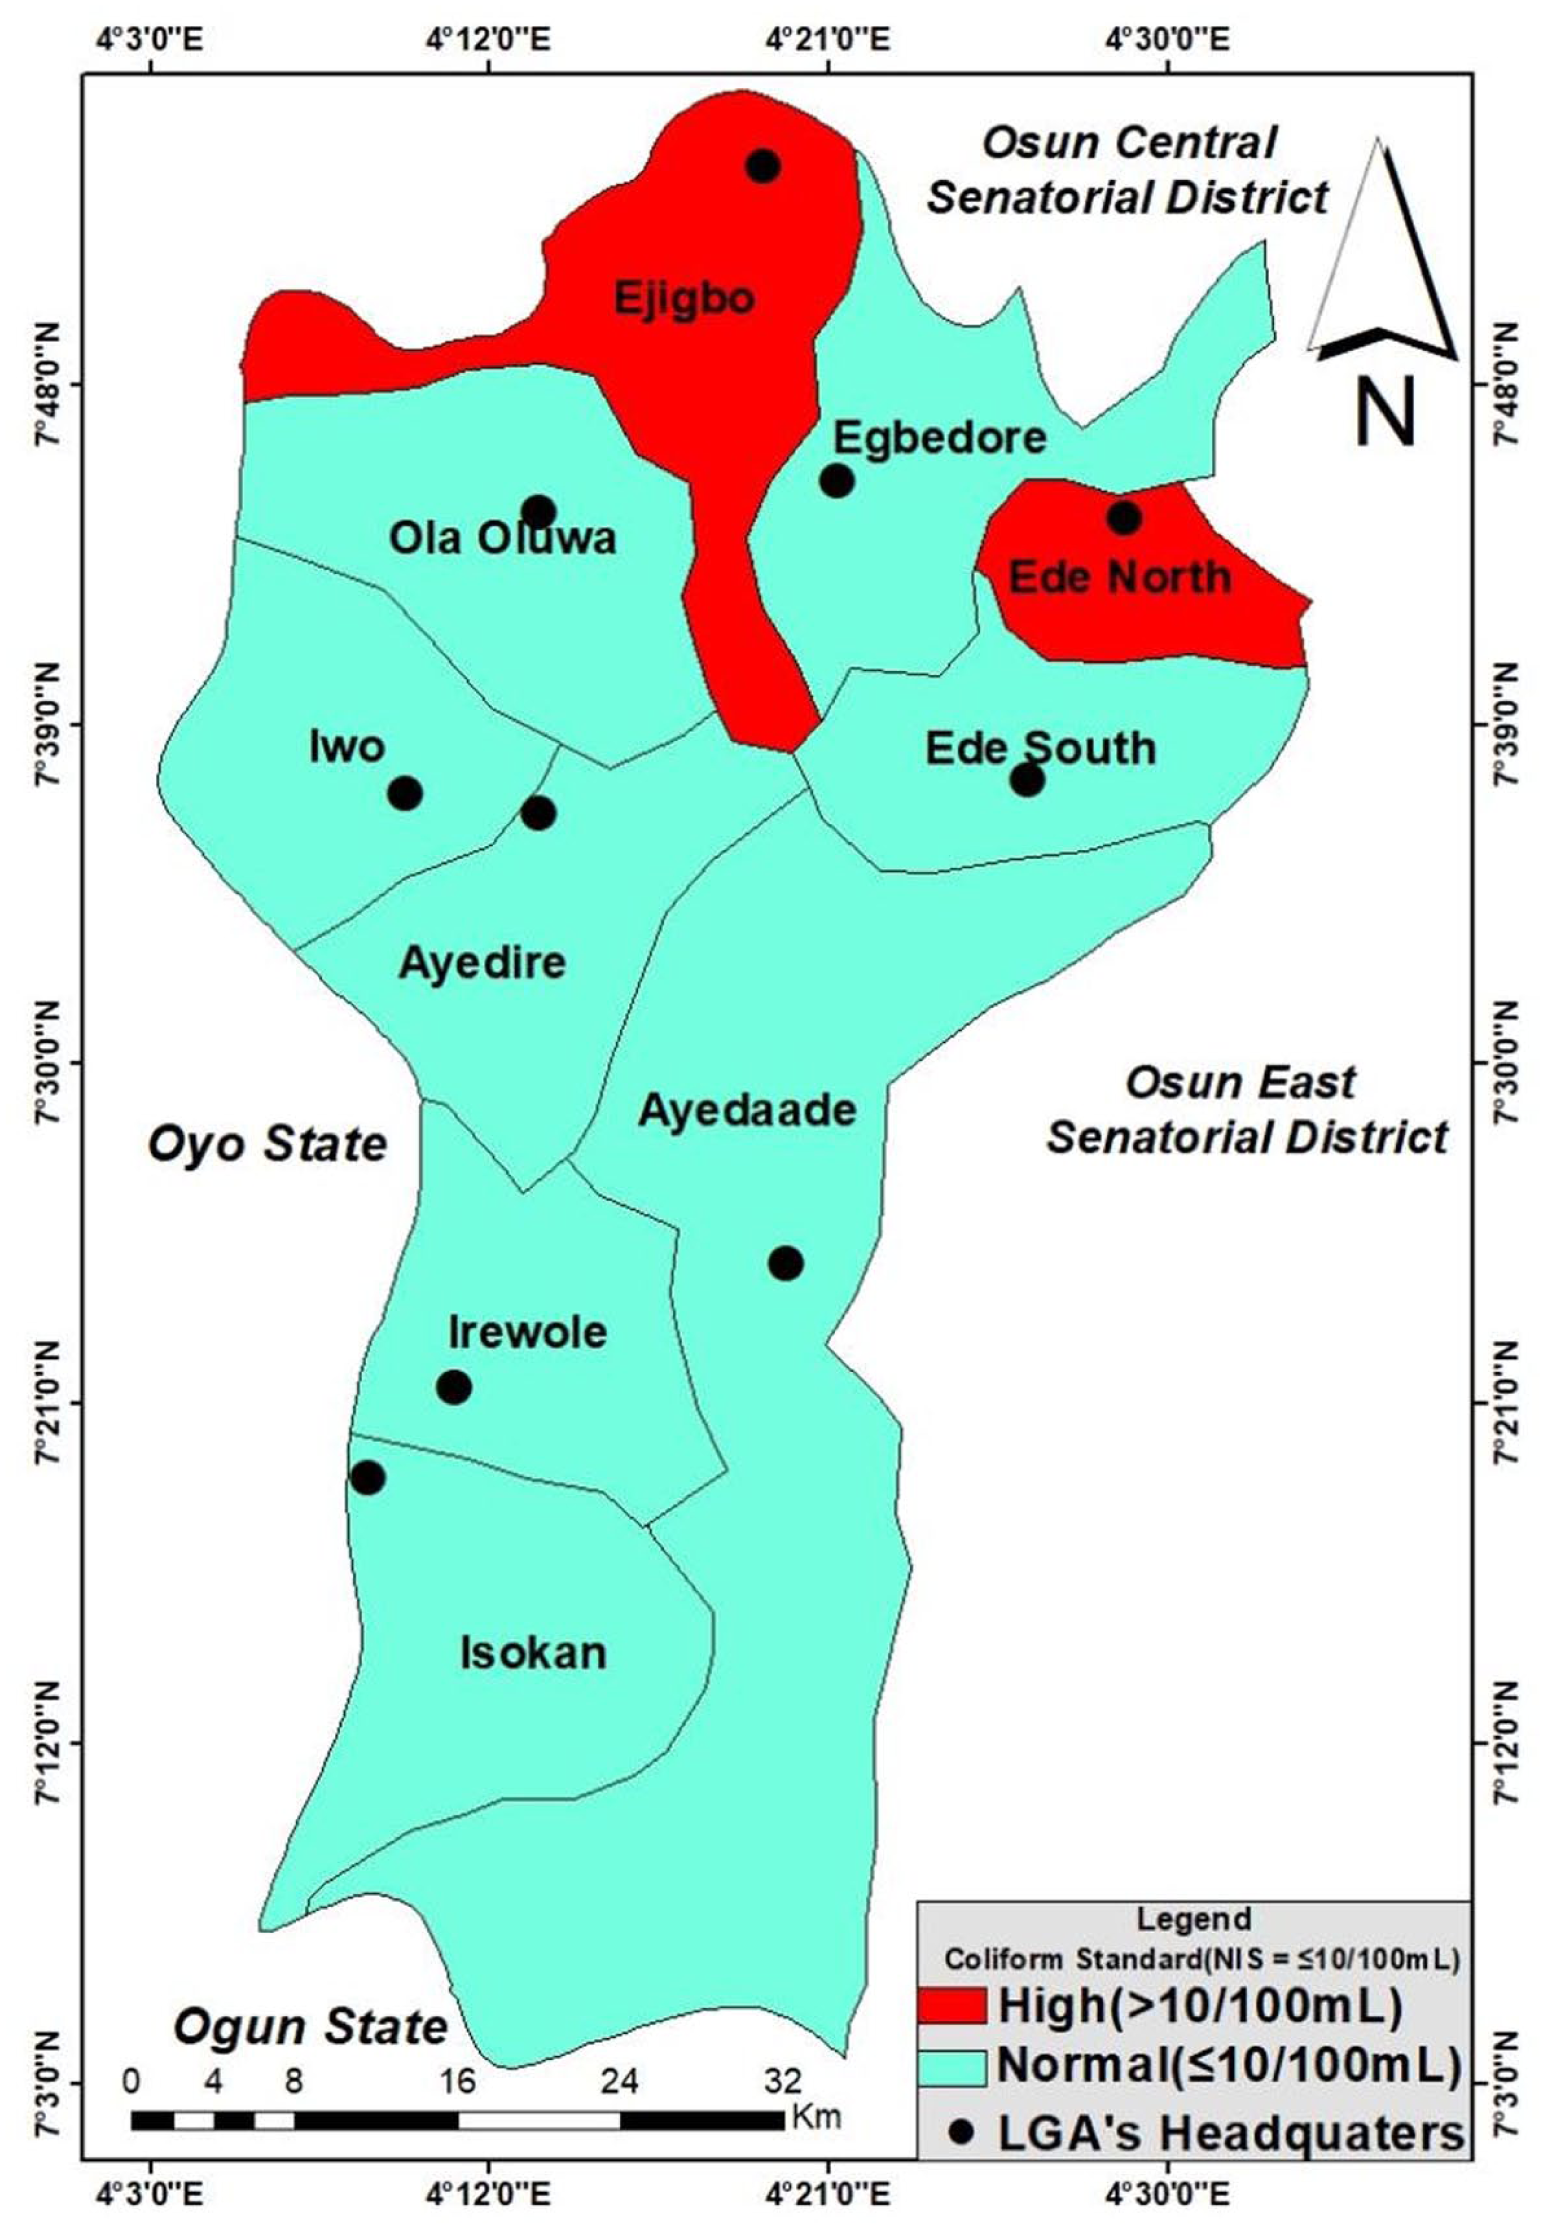
Regional pattern of coliform in the study area.
Specific villages in these LGAs contributed significantly to the elevated contamination levels. In Ejigbo, Owu-Ile, and Masifa showed exceptionally high coliform counts, with Owu-Ile being the most affected. Similarly, in Ede North, Railway Junction recorded the highest contamination levels, exceeding the permissible limit. These elevated coliform counts point to widespread contamination, likely due to factors such as unprotected water sources, poor sanitation and waste disposal practices, agricultural runoff, and inadequate water treatment infrastructure. Combined with high population density and poor drainage systems, these conditions increase the risk of waterborne diseases like diarrhoea, cholera, and typhoid fever, particularly among children and vulnerable populations.3,37
pH Distribution
The World Health Organization (WHO) recommends a pH range of 7.0 to 8.5 for drinking water. In Osun West Senatorial District (OWSD), most Local Government Areas (LGAs) fall within this acceptable range (Figure 18). However, 2 LGAs, Iwo and Ayedaade, show deviations from the standard. Iwo has an alkaline pH of 9.07, while Ayedaade exhibits a slightly acidic pH of 6.90.
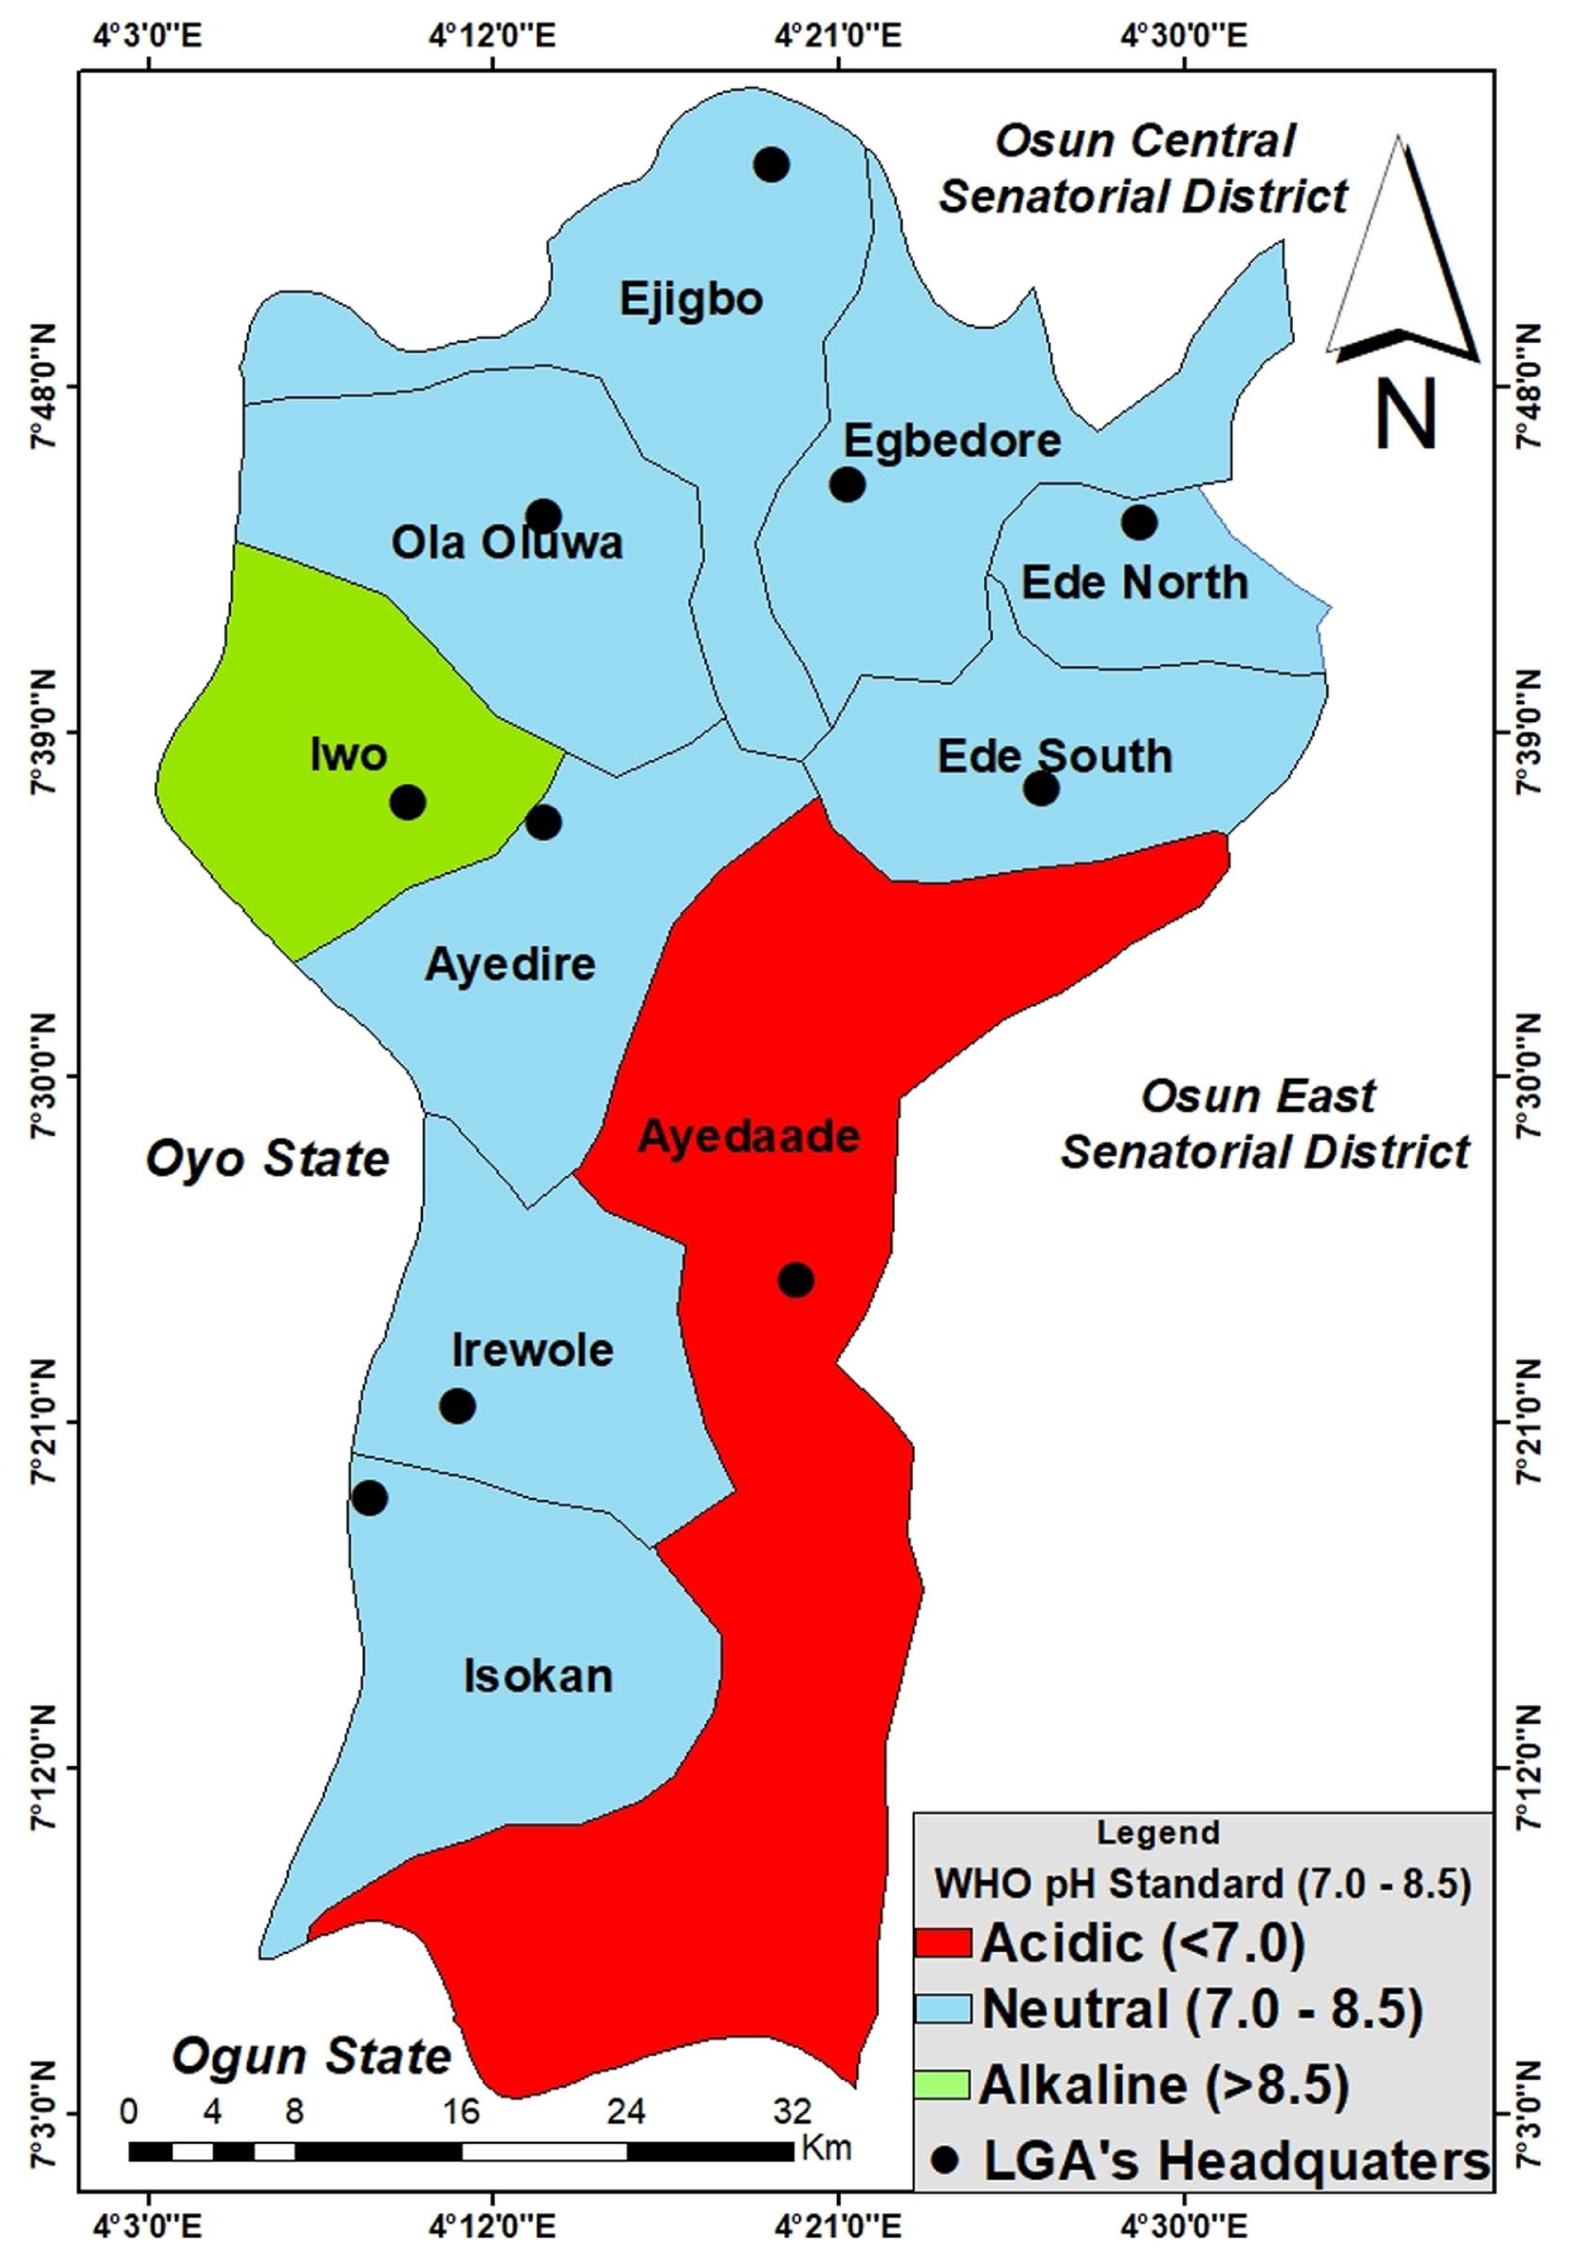
Regional pattern of pH in the study area.
In Ayedaade, certain villages recorded even lower pH values, such as Matako at 5.80 and Orile Owu at 6.40, indicating increased acidity. Acidic water can lead to the corrosion of pipes, leaching of heavy metals, and potential health risks such as digestive issues and skin or eye irritation. On the other hand, Iwo’s water is more alkaline, with areas like Ayede recording a pH of 10.20, Isale Oba at 9.00, and Oloogun Ebi at 8.00. This higher alkalinity suggests the presence of dissolved minerals like calcium, magnesium, and bicarbonates, likely due to underground limestone deposits or prolonged contact with alkaline rocks.38,39 Although alkaline water is typically not harmful, excessive alkalinity can affect water taste and lead to scaling in pipes and household appliances.38,39
Temperature Distribution
The World Health Organization (WHO) recommends that drinking water temperature should range between 15°C and 25°C, as water outside this range may negatively affect its quality. In the Osun West Senatorial District (OWSD), several Local Government Areas (LGAs) recorded temperatures above this threshold. For instance, Ejigbo (25.63°C), Ede North (28.67°C), Ede South (28.33°C), Iwo (28°C), Ayedaade (26.33°C), and Ola-Oluwa (27°C) all exhibited mean temperatures higher than the recommended range (Figure 19). The highest individual temperature was recorded in Ikonifin (Ola-Oluwa) at 31°C, with other locations like Railway Junction (Ede North) and Alaasan (Egbedore) approaching 29°C.
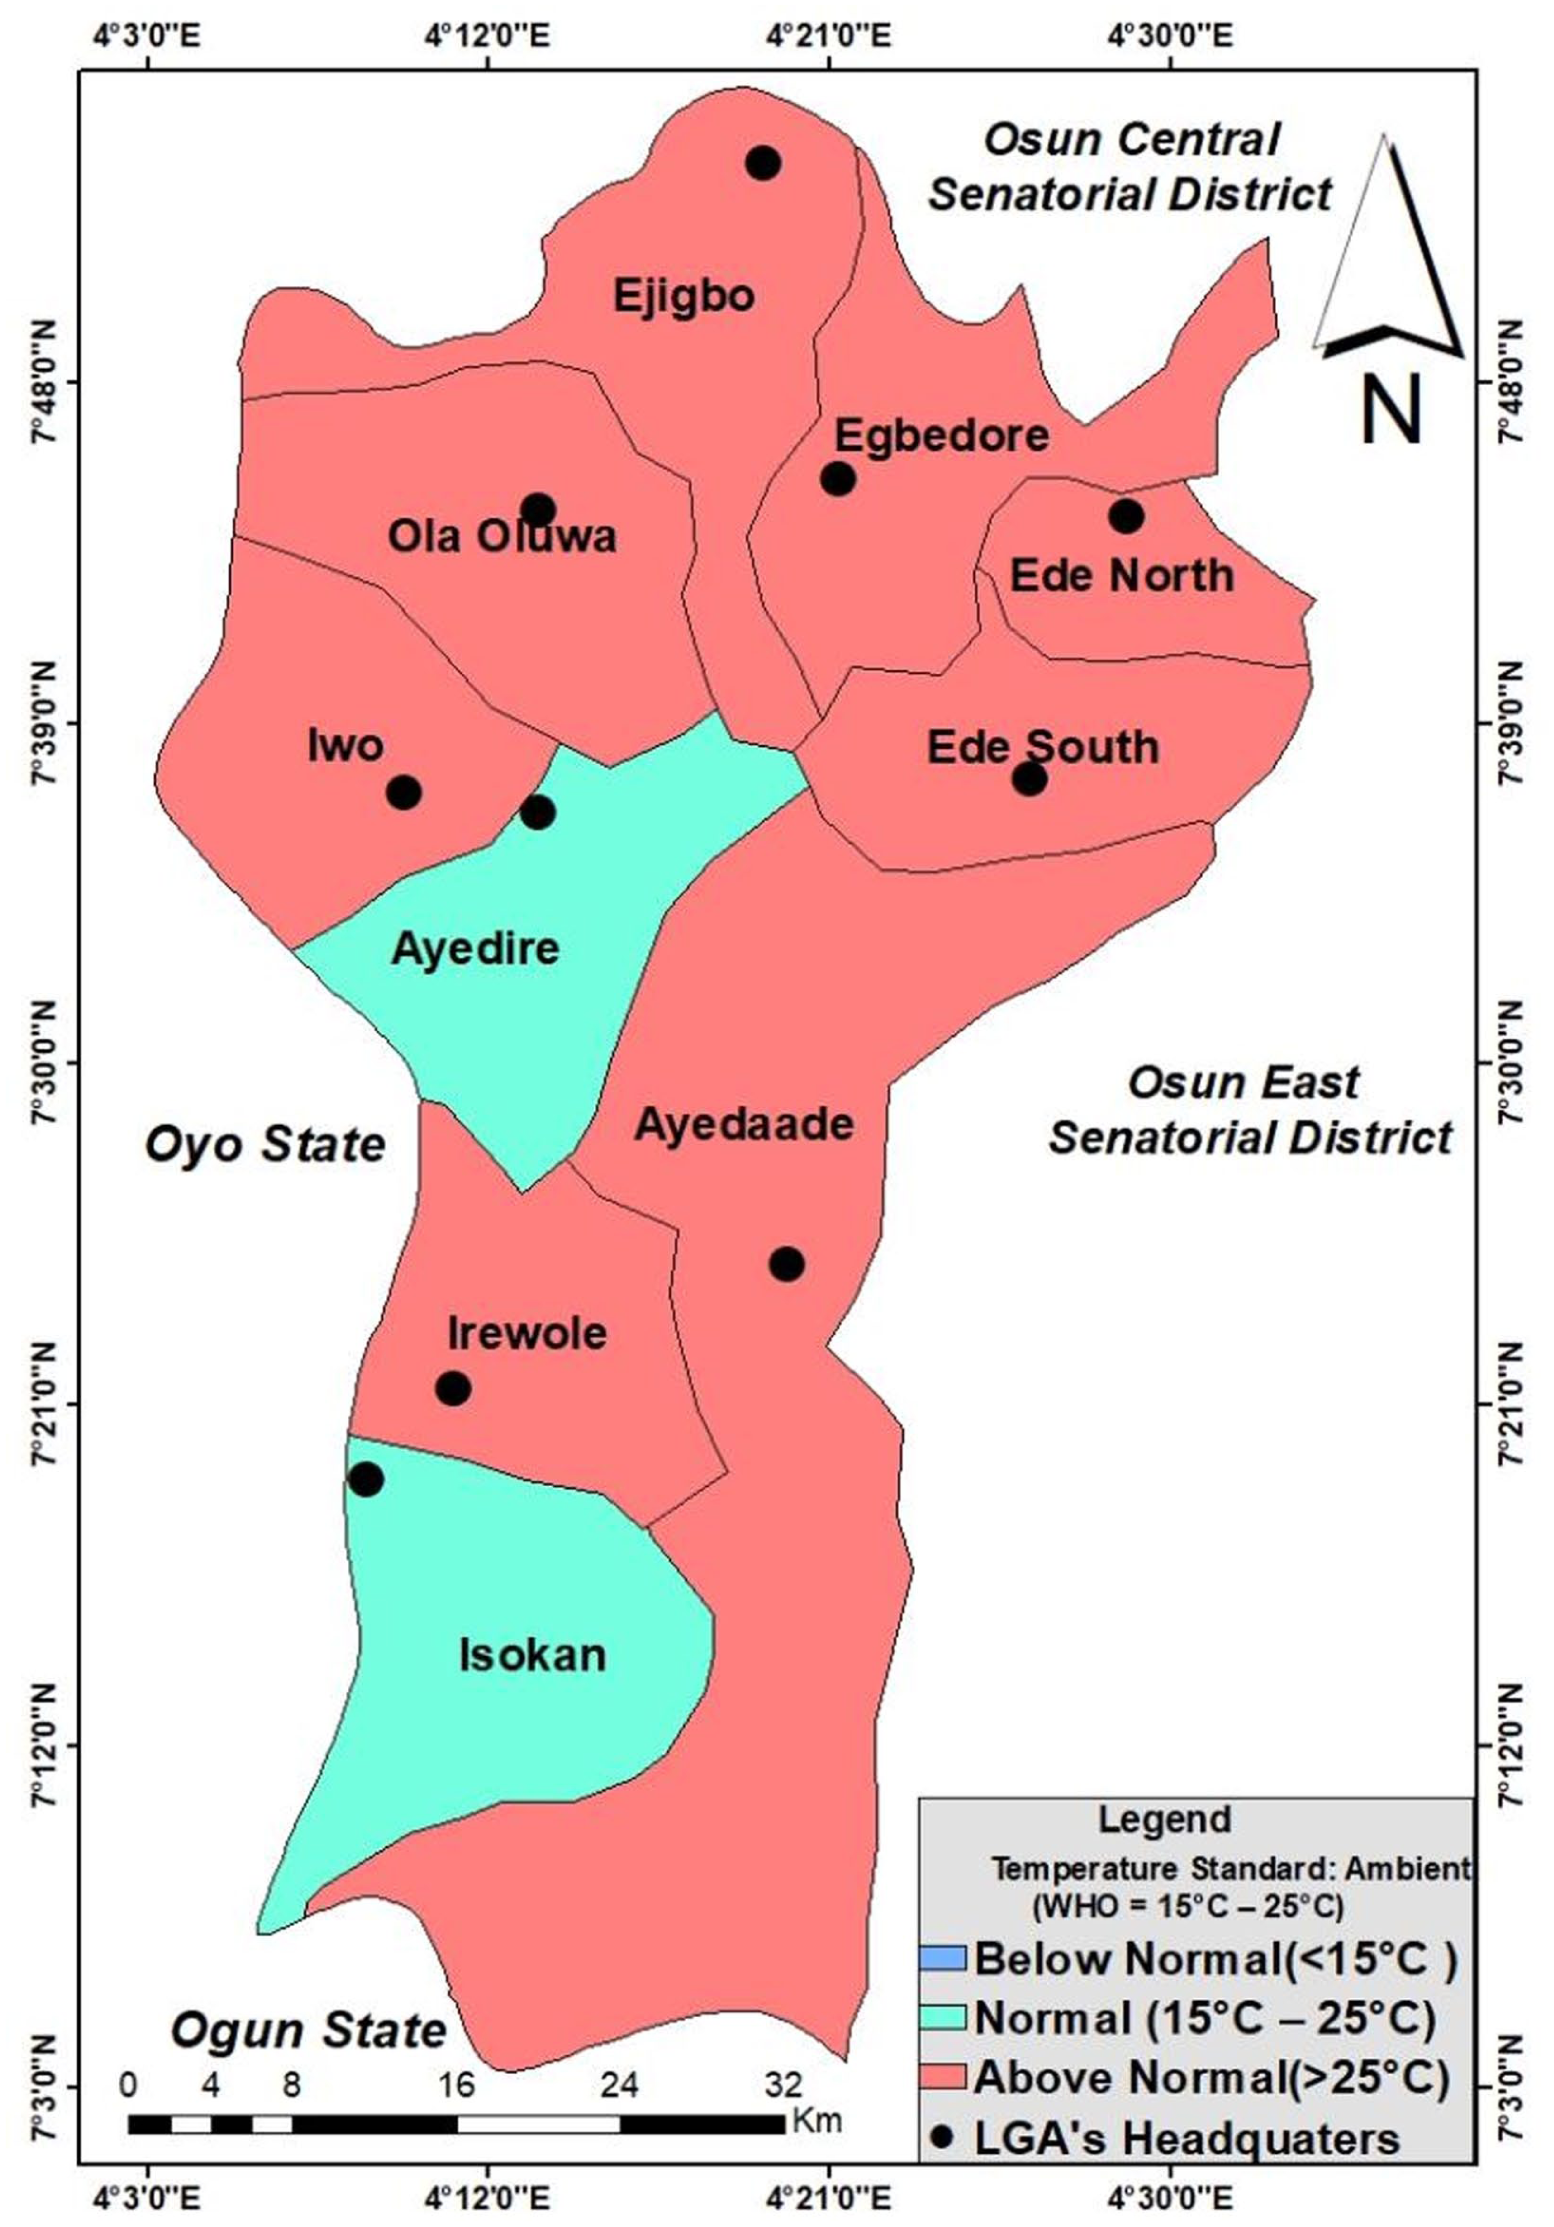
Regional pattern of temperature in the study area.
These elevated temperatures may be linked to various factors, including direct solar exposure, reduced vegetation cover, and human activities such as urbanisation and industrialisation. High water temperatures can enhance microbial growth, accelerate chemical reactions, and reduce dissolved oxygen levels in water. These changes could lead to a decline in water quality, making it less suitable for drinking and other domestic uses. In particular, warmer water can encourage the growth of harmful bacteria and pathogens, increasing the risk of waterborne diseases.
Potability of Rural Water by Their Respective WQI Status
The Water Quality Index (WQI) analysis across 32 rural communities in Osun West Senatorial District as presented in Table 5 revealed substantial spatial variability in water quality, with microbial contamination emerging as the primary factor limiting compliance with SDG 6.3. Villages such as Owu-Ile and Masifa (Ejigbo LGA) and Alaasan (Egbedore LGA) recorded WQI values exceeding 300, categorised as Unsuitable, driven largely by elevated coliform and E. coli counts. Conversely, communities including Ara and Oojo (Egbedore LGA) and Aye (Ejigbo LGA) exhibited Excellent water quality (WQI < 50), reflecting lower microbial loads and better source protection. At the LGA level, Ejigbo (Mean WQI = 309.13) and Ede North (Mean WQI = 216.77) represent critical hotspots of faecal contamination, while Ede South (Mean WQI = 78.78) demonstrates relatively safe water quality. These patterns highlight that faecal contamination, rather than chemical pollutants, is the dominant barrier to achieving SDG Target 6.3 in the study area. The findings underscore the need for targeted interventions—such as source protection, routine disinfection, and community-led sanitation programmes—focussing on high-risk LGAs, while WQI proves to be an effective integrative tool for monitoring water safety and guiding policy in rural settings.
Rural Water Portability by Their Respective WQI Status.

The Mean Water Quality Index (WQI) across the 10 LGAs shows significant variation as revealed in Table 6, ranging from 66.29 in Ola-Oluwa (Good) to 309.13 in Ejigbo (Unsuitable). LGAs such as Ola-Oluwa, Ede South, and Irewole recorded good water quality, indicating relatively safe groundwater for domestic use. Conversely, Ayedaade, Ayedire, Egbedore, Isokan, and Iwo exhibited poor water quality, suggesting moderate contamination that may pose health risks without treatment. Ede North and Ejigbo, classified as very poor and unsuitable, indicate severe contamination and unsafe water. These disparities highlight the urgent need for targeted interventions, including water treatment, infrastructure development, regular monitoring, and public awareness campaigns, to ensure safe and equitable access to groundwater across the study area.
Summary WQI by LGA in Osun West Senatorial District.

Conclusion and Recommendations
This study assessed the physico-chemical and microbiological quality of rural water sources across the 10 Local Government Areas (LGAs) of Osun West Senatorial District in relation to SDG Target 6.3. Although most sampled sources complied with WHO and Nigerian standards for physico-chemical parameters such as pH, electrical conductivity, turbidity, and temperature, the Water Quality Index (WQI) revealed marked spatial disparities in overall water quality. Mean WQI values ranged from 66.29 (good) in Ola-Oluwa to 309.13 (unsuitable) in Ejigbo, with Ola-Oluwa, Ede South, and Irewole exhibiting generally safe groundwater conditions, while Ayedaade, Ayedire, Egbedore, Isokan, and Iwo recorded poor water quality, and Ede North and Ejigbo fell within very poor to unsuitable categories. These poor ratings were driven primarily by elevated total coliform and Escherichia coli concentrations, indicating widespread faecal contamination and demonstrating that compliance with physico-chemical standards alone can mask critical microbiological risks. Consequently, achieving SDG 6.3 in Osun State will require interventions that prioritise microbiological water safety, including improved sanitation, protection of water sources, and appropriate treatment at community and household levels. The study further recommends the adoption of WQI as a routine monitoring tool by local water authorities to support integrated assessment, facilitate prioritisation of high-risk communities, and enhance evidence-based decision-making. In addition, a community-based water quality surveillance model involving trained local volunteers, environmental health officers, and primary health-care systems is proposed to ensure sustainable monitoring, early detection of contamination, and increased local ownership of water safety. Strengthening LGA-level water safety plans, investing in monitoring infrastructure and data management systems, and fostering partnerships with non-governmental and private sector actors will collectively improve accountability, resilience, and long-term progress towards safe and sustainable rural water supply in support of SDG 6.
Footnotes
Ethical Considerations
Not applicable.
Consent to Participate
Not applicable
Consent for Publication
Not applicable.
Author Contributions
TOO conceptualize, design, proofread and review; VOA carried out project implementation, data analysis, wrote and typed the manuscript; BOA, EAA, TOA & OTA: Data collection; and proofreading the work; MOO: Editing and Review.
Funding
The authors received no financial support for the research, authorship, and/or publication of this article.
Declaration of Conflicting Interests
The authors declared no potential conflicts of interest with respect to the research, authorship, and/or publication of this article.
Clinical Trial Number
Not applicable.