
Abstract
Microplastic pollution and microbial contamination are increasingly recognized as interconnected threats to freshwater quality and public health, yet their co-occurrence and interactions in coastal freshwater systems of developing regions remain poorly understood. To address this gap, microplastic characteristics, health risks, and microbial indicators including Escherichia coli, fecal coliforms, and total plate counts were assessed across industrial and urban sectors of a coastal freshwater canal in Bangladesh used for drinking, irrigation, and domestic purposes. Microplastic concentrations ranged from 0.45 to 0.93 items/L, with significantly higher levels in the industrial zone, where fibers (46%) predominated, and over 98% of MPs were <0.5 mm in size, indicating advanced degradation. Microbial loads exceeded WHO limits, with E. coli reaching 3,433 CFU/100 mL and fecal coliforms up to 4,033 CFU/100 mL, classifying the canal water as high-risk. Strong correlations between MP characteristics (type, color, size) and microbial loads, as revealed by correlation and PCA analyses, suggest that MPs serve as substrates for microbial growth. Pollution indices (PLI: 1.78 industrial vs. 1.19 urban) confirmed significant microplastic contamination. These elevated MP concentrations and microbial loads, exceeding WHO thresholds, significantly degrade water quality and pose severe human health risks, underscoring the compounded environmental and public health hazards associated with MP-microbial interactions. The results highlighted the urgent need for integrated wastewater management and pollution mitigation strategies in coastal Bangladesh.
Keywords
1. Introduction
Microplastics (MPs) have emerged as pervasive contaminants in aquatic environments, originating from both primary sources such as microbeads and synthetic fibers, and from the secondary fragmentation of larger plastic debris.1,2 Once introduced into freshwater ecosystems, these particles persist for long periods and function as vectors for chemical pollutants and microbial communities, including pathogenic and antibiotic-resistant bacteria3-5 Owing to their large surface area and hydrophobic properties, MPs exhibit a high sorption affinity for hydrophobic contaminants, trace metals, and nutrient-associated compounds, while simultaneously promoting microbial colonization. This leads to the formation of a complex “plastisphere” that can modify aquatic biogeochemistry and serve as a mobile microbial habitat.6-8
In rapidly urbanizing regions of coastal Bangladesh, with coastal areas such as Noakhali as a representative example, freshwater canal systems are increasingly exposed to untreated domestic sewage, industrial discharge, and plastic debris. These canals, which serve as vital infrastructures for drainage, irrigation, and sometimes domestic use, are vulnerable to pollutant accumulation due to low flow velocities and stagnation. Despite their importance, these systems remain understudied regarding MP and microbial pollution. Given the similarities to other developing regions, urban canals in Noakhali may serve as pollution hotspots, especially where stagnation, high organic loads, and poor waste management coexist, as in other similar areas.9-11
The co-occurrence of MPs and microbial contaminants can substantially degrade water quality by altering dissolved oxygen, pH, turbidity, and nutrient availability.12-14 By providing surfaces for microbial attachment and releasing dissolved organic compounds, MPs may promote microbial regrowth, increase assimilable organic carbon (AOC), and reduce disinfection efficiency.6,15-17 These changes can contribute to algal blooms, hypoxia, and shifts in microbial community structure.18,19
The combined presence of MPs and microbial contaminants also poses significant public health risks, especially where untreated surface water is used. MPs can harbor opportunistic pathogens such as Pseudomonas and Acinetobacter, increasing exposure risks.5,20 They may also facilitate the spread of antibiotic resistance genes in stagnant water systems.5,21 These risks can be further intensified by disinfectant decay and the formation of harmful disinfection by-products such as trihalomethanes (THMs) during chlorination.22-24 In densely populated urban and peri-urban areas of Bangladesh, such exposures may increase gastrointestinal illness and other long-term health risks.25,26
In coastal regions, freshwater canals are vital water sources for multiple essential uses, including drinking, irrigation, and domestic activities. 27 Due to the scarcity of treated piped water and the intrusion of salinity into groundwater, many communities heavily rely on canal water for daily consumption and agriculture.28,29 This dependency makes the quality of canal water a critical factor influencing public health and food security in the region. Moreover, canal water supports small-scale farming and aquaculture, which are vital for local livelihoods. 29 Therefore, contamination of these canals by MPs and microbial pollutants not only threatens ecological health but also poses direct risks to human wellbeing through exposure to polluted water used for drinking, washing, and irrigation. Understanding and mitigating these risks is essential for sustainable water management in coastal urbanizing zones.
Recent studies in Asia have reported increasing microplastic (MP) contamination and associated microbial risks in freshwater ecosystems.30-32 Work from India and China shows that MPs can support microbial colonization and biofilm formation, potentially enhancing the persistence of pathogenic and antibiotic-resistant bacteria.33-35 In India, such co-contamination has been documented in urban rivers, including Kolkata. 36
In Bangladesh, MPs have been reported in urban rivers and coastal systems, including the Rupsha River, mainly linked to domestic, industrial, and agricultural inputs.37-39 However, unlike India, no studies have yet assessed MP–microbial co-contamination in Bangladeshi freshwater systems, highlighting a clear research gap. Overall, research in the region remains fragmented, with most studies focusing separately on MPs in marine/estuarine environments40,41 or microbial pollution in rivers, 23 while small canals remain largely unstudied.
The absence of integrative research is especially significant in ecologically vulnerable coastal areas such as Noakhali, where freshwater canals serve various human purposes. Investigating the potential combined effects of microplastics and microbial contaminants on water quality and public health is crucial for developing effective, context-specific water quality management strategies in urbanizing, low-resource environments. To address these gaps, this study aims to: (i) characterize microplastics and microbial pollutants in industrial and urban canal zones along the Noakhali coast; (ii) examine spatial associations among microplastics, microbial contamination, and physicochemical water quality parameters; and (iii) assess the associated public health risks linked to degraded water quality in urbanizing freshwater systems.
2. Materials and Method
2.1. Study Area
This study was conducted along the Noakhali Canal in Noakhali District, Bangladesh, which serves as an important drainage and hydrological system in the coastal region. The canal was historically excavated in 1660 to divert the Dakatia River and has since played a key role in shaping regional hydrology and settlement development. The name “Noakhali” is derived from this early “new canal” system. Two ecologically contrasting sites of the canal system were selected to assess spatial variability in microplastic contamination (Figure 1). The first study site is located in Begumganj Upazila (22°55′23″N–22°57′15″N; 91°05′45″E–91°07′30″E), adjacent to the BSCIC Industrial Estate. This reach is highly influenced by industrial activities and receives untreated or partially treated effluents from textile, chemical, and manufacturing industries. It is further impacted by agricultural runoff, urban stormwater discharge, and domestic wastewater, representing a zone of intensive and mixed anthropogenic pressure. The second study site is located in Sonapur, Noakhali Sadar Upazila (22°48′10″N–22°50′30″N; 91°05′20″E–91°06′55″E). This area is comparatively less industrialized but experiences substantial urban influence, where the canal primarily receives domestic sewage, municipal drainage, and plastic waste inputs from surrounding residential areas and local markets. Study sites and sample collection stations at Noakhali Canal systems, Noakhali, Bangladesh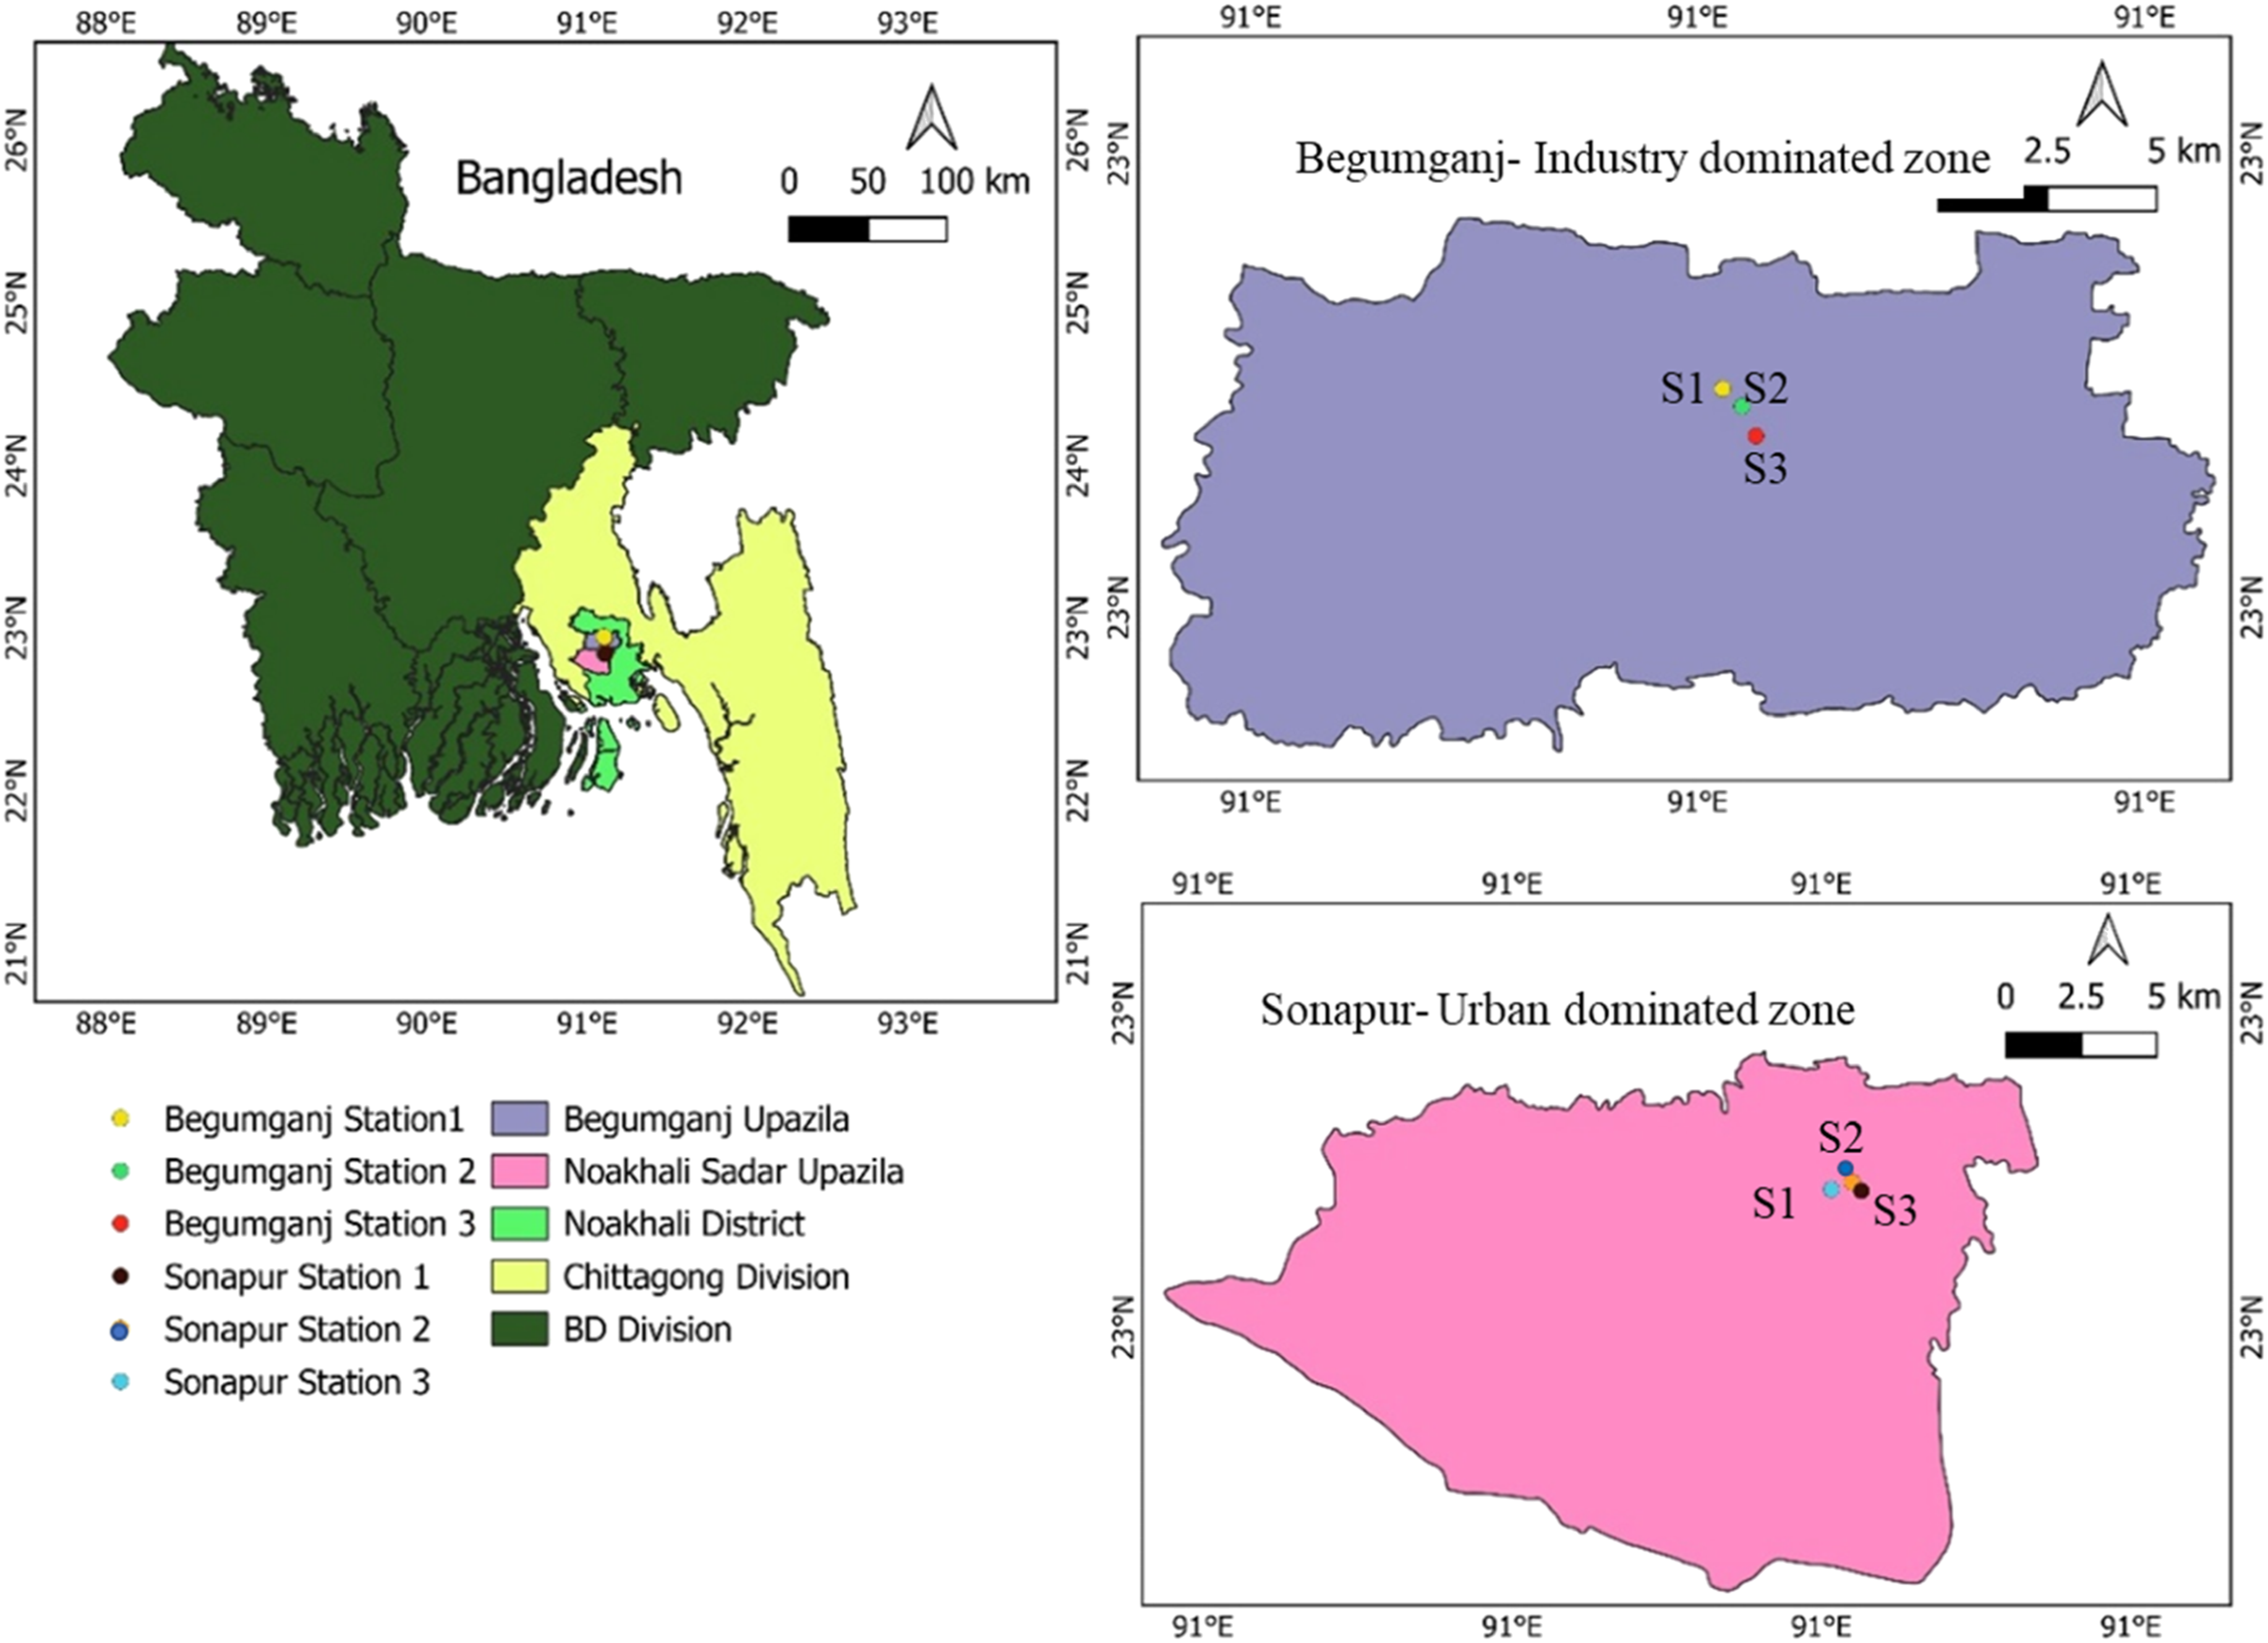
These two reaches were selected to represent contrasting environmental conditions: an industrially impacted system versus an urban–domestic influenced system. This design allows for robust comparison of spatial differences in microplastic contamination under varying anthropogenic pressure gradients. All sampling points were georeferenced and mapped using QGIS version 3.42.2 and Python version 3.x with the Basemap library tools for spatial visualization.
2.2. Nature of the Study, Design, Sample and Data Collection
In this study, a cross-sectional observational field- and laboratory-based approach was employed to investigate microplastic contamination, microbial load and associated risks of ecological and public health in the canal ecosystem. Systematic in situ sampling of environmental water and controlled laboratory analyses for microplastics and microbial contamination were carried out. This is a non-experimental, descriptive–comparative study that aims for the evaluation of spatial differences in pollutant distributions along an anthropogenic gradient. In addition to the assessment of contamination extent, different well-known risk characterization indices were employed to discuss the human and ecological risks posed by the detected pollutants.
Surface water samples were collected during the rainy season (August –September, 2024) from each station at a depth of 10 to 20 cm using sterile 500 mL bottles. This season was selected to capture peak surface runoff conditions and enhanced contaminant transport. Locations of sampling stations were selected based on four inclusion criteria: (i) a continuous presence of water during the study period, (ii) access in field conditions, (iii) representation of prevailing local pollution sources. Stations that were temporarily non-wet, physically inaccessible or unsafe for sampling due to flow instability or obstruction (e.g., trees) were excluded.
Each of the six stations was sampled in triplicate, generating 18 samples for microbial and physicochemical analyses. Field measurements of dissolved oxygen (DO), pH, electrical conductivity (EC), total dissolved solids (TDS), salinity, and temperature were performed using a portable HANNA multi-parameter meter (Model HL98194). Instruments were calibrated prior to field deployment.
2.3. Microbiological Analysis
2.3.1. Serial Dilution Procedure
Serial dilutions were performed following APHA protocols to achieve countable microbial concentrations. 42 Dilution series were prepared using 0.9% sterile saline solution and vortexed thoroughly. Serial dilutions up to 10-4 were prepared up to 10-4 were made for each sample.
2.3.2. Total Plate Count (TPC)
For TPC enumeration, nutrient agar was used.43,44 The medium was sterilized at 121°C for 15 minutes. 100 µL of 10-4 dilution was spread on solidified agar plates and incubated at 37°C for 24 hours. Plating was done in triplicates. Colonies were counted and expressed as CFU/mL42,45
2.3.3. Escherichia coli Enumeration (EMB Agar)
Selective enumeration of E. coli was conducted using Eosin Methylene Blue (EMB) agar, which differentiates colonies with a metallic green sheen. 100 mL of appropriately diluted sample (10-2) was filtered through 0.45 µm Millipore membranes and transferred to EMB plates. Plates were incubated at 37°C for 24 hours. 46
2.3.4. Fecal Coliform Count (M-FC Agar)
M-FC agar was used to enumerate thermotolerant fecal coliforms. 47 The membrane filtration method was employed. Membranes were incubated at 44°C for 24 hours, and blue colonies were counted. 48
2.3.5. Shigella spp. Detection (XLD Agar)
Xylose Lysine Deoxycholate (XLD) agar was used to detect Shigella spp. Via spread plating. 100 µL of 10-2 dilution was spread and incubated at 37°C for 18–24 hours. Colonies appearing red or colorless without black centers were presumptively identified as Shigella.49,50
2.3.6. Colony Enumeration and Calculation


Counts from three replicate plates were averaged. Plates with 30–300 colonies were deemed acceptable.42,51
3.3.7. Statistical Analysis of Microbial Data
Microbial data were cleaned and analyzed using Python (Google Colab). Descriptive statistics (mean, SD, log-transformed values) were computed. Two-way ANOVA and Tukey’s HSD test (p < 0.05) were used to assess spatial differences. Correlation matrices and heatmaps were developed using Seaborn and Matplotlib libraries. 52
2.4. Microplastic Analysis
2.4.1. Sampling
Microplastic samples were collected during the rainy season (August–September 2024) from each station at a depth of 10–20 cm using a 330 µm mesh net equipped with a cod-end for debris retention. 40 Smaller microplastics might not have been captured. Samples were transferred to labeled plastic vials and stored carefully. Time, GPS coordinates, weather, and sampling depth (0–30 cm) were recorded. Peroxide oxidation was used for organic matter digestion prior to analysis. 53
2.4.2. Laboratory Extraction and Separation Process
Microplastic extraction and analysis were conducted following the protocols outlined by Masura et al 54 and Banik et al. 40 Briefly, water samples were transferred into 500 mL glass beakers and dried overnight in a hot-air oven. Organic matter was digested via wet peroxide oxidation using 20 mL of 30% H2O2 and 20 mL of 0.05 M FeSO4 as catalysts. The reaction mixture was stirred and heated at 75°C until bubbling began, after which distilled water was added. Additional peroxide was added if organic matter persisted. The digested solution was separated by density using a NaCl solution (1.19 g/mL) and left to settle overnight. The supernatant was vacuum-filtered using 5 µm cellulose nitrate filter papers. Filters were air-dried in sterile Petri dishes for visual analysis. Filter papers were examined under a Leica EZ4E stereo microscope (8–35X) with a digital camera. Microplastics were identified based on size (0.3 mm to 5 mm), shape (fibers, fragments, films), and color, with ImageJ used for morphometric measurements. For accurate identification, standardized criteria were applied: (i) absence of visible cellular or organic structures, (ii) consistent color and texture across the particle surface, and (iii) uniform thickness along the length of fibers. All suspected particles were also subject to the hot needle test to avoid misidentifying organic matter or mineral grains as microplastics. Plastic was thus confirmed by melting or curling in response to the heat, while charring or otherwise unchanged were discarded from the count of particles.
2.4.3. Quality Assurance and Contamination Control
To minimize contamination, all glassware was rinsed with distilled water and 70% ethanol. FeSO4 and NaCl solutions were pre-filtered (5 µm). Blanks were run alongside samples and the use of procedural blanksshowed no microplastic contamination. Cotton clothing was worn during lab work, and airborne contamination was minimized. All steps followed QA/QC protocols described in previous literature.53,55
3. Results and Discussion
3.1. Environmental Parameters of the Two Canal Ecosystems
Physicochemical Parameters of Surface Water Samples From Noakhali Canal System Across Two Study Areas, With Comparison to Standard Water Quality Guidelines

*significant at (p<0.01), ns- not significant.
The urban area also exhibited markedly elevated total dissolved solids (TDS: 427 mg/L) and electrical conductivity (EC: 722 µS/cm) relative to the industrial zone (TDS: 246 mg/L; EC: 192 µS/cm), signaling a higher ionic burden likely arising from domestic sewage, fertilizer-laden runoff, or municipal discharges, all of which contribute essential nutrients (e.g., nitrates, phosphates) that facilitate microbial bloom formation.62,63 Although salinity remained low, the urban site showed slightly elevated values (0.38 ppt vs. 0.10 ppt), consistent with weak estuarine influence or saline intrusion. Together, these physicochemical dynamics—severe oxygen depletion, thermal enrichment, chemical alkalization, and elevated nutrient proxies—point to a eutrophic, microbially active environment shaped by untreated or poorly managed anthropogenic inputs. Such conditions have been widely associated with heightened risks of waterborne pathogens, including E. coli, Vibrio cholerae, Salmonella spp., and protozoan parasites, which pose serious public health threats, especially in settings lacking adequate water treatment and sanitation infrastructure.56,64
3.2. Characterization and Distribution of Microplastics and Microbial Pollutants
3.2.1. Characterization of Microplastics
Fibers were the dominant microplastic type, comprising 41–46% of total particles, followed by fragments (28–31%), foam (14–18%), and sheets (8–15%) (Figure 2). This pattern reflects strong inputs from textile sources, synthetic clothing, and wastewater, consistent with previous studies in Bangladesh.39,65 Globally, fibers are the most abundant form of microplastic pollution, accounting for up to 91% of particles in ocean surface waters.
66
Similar dominance is reported in urban river systems across Asia, driven by high population density and wastewater discharge.
67
Their persistence in freshwater environments is mainly linked to continuous release from household laundry and industrial effluents,68,69 highlighting their pervasive nature across scales. Morphological characteristics of MPs in industry-dominated and urban-dominated canal of Noakhali, a) Types of MPs, b) Color of MPs, and c) Size of MPs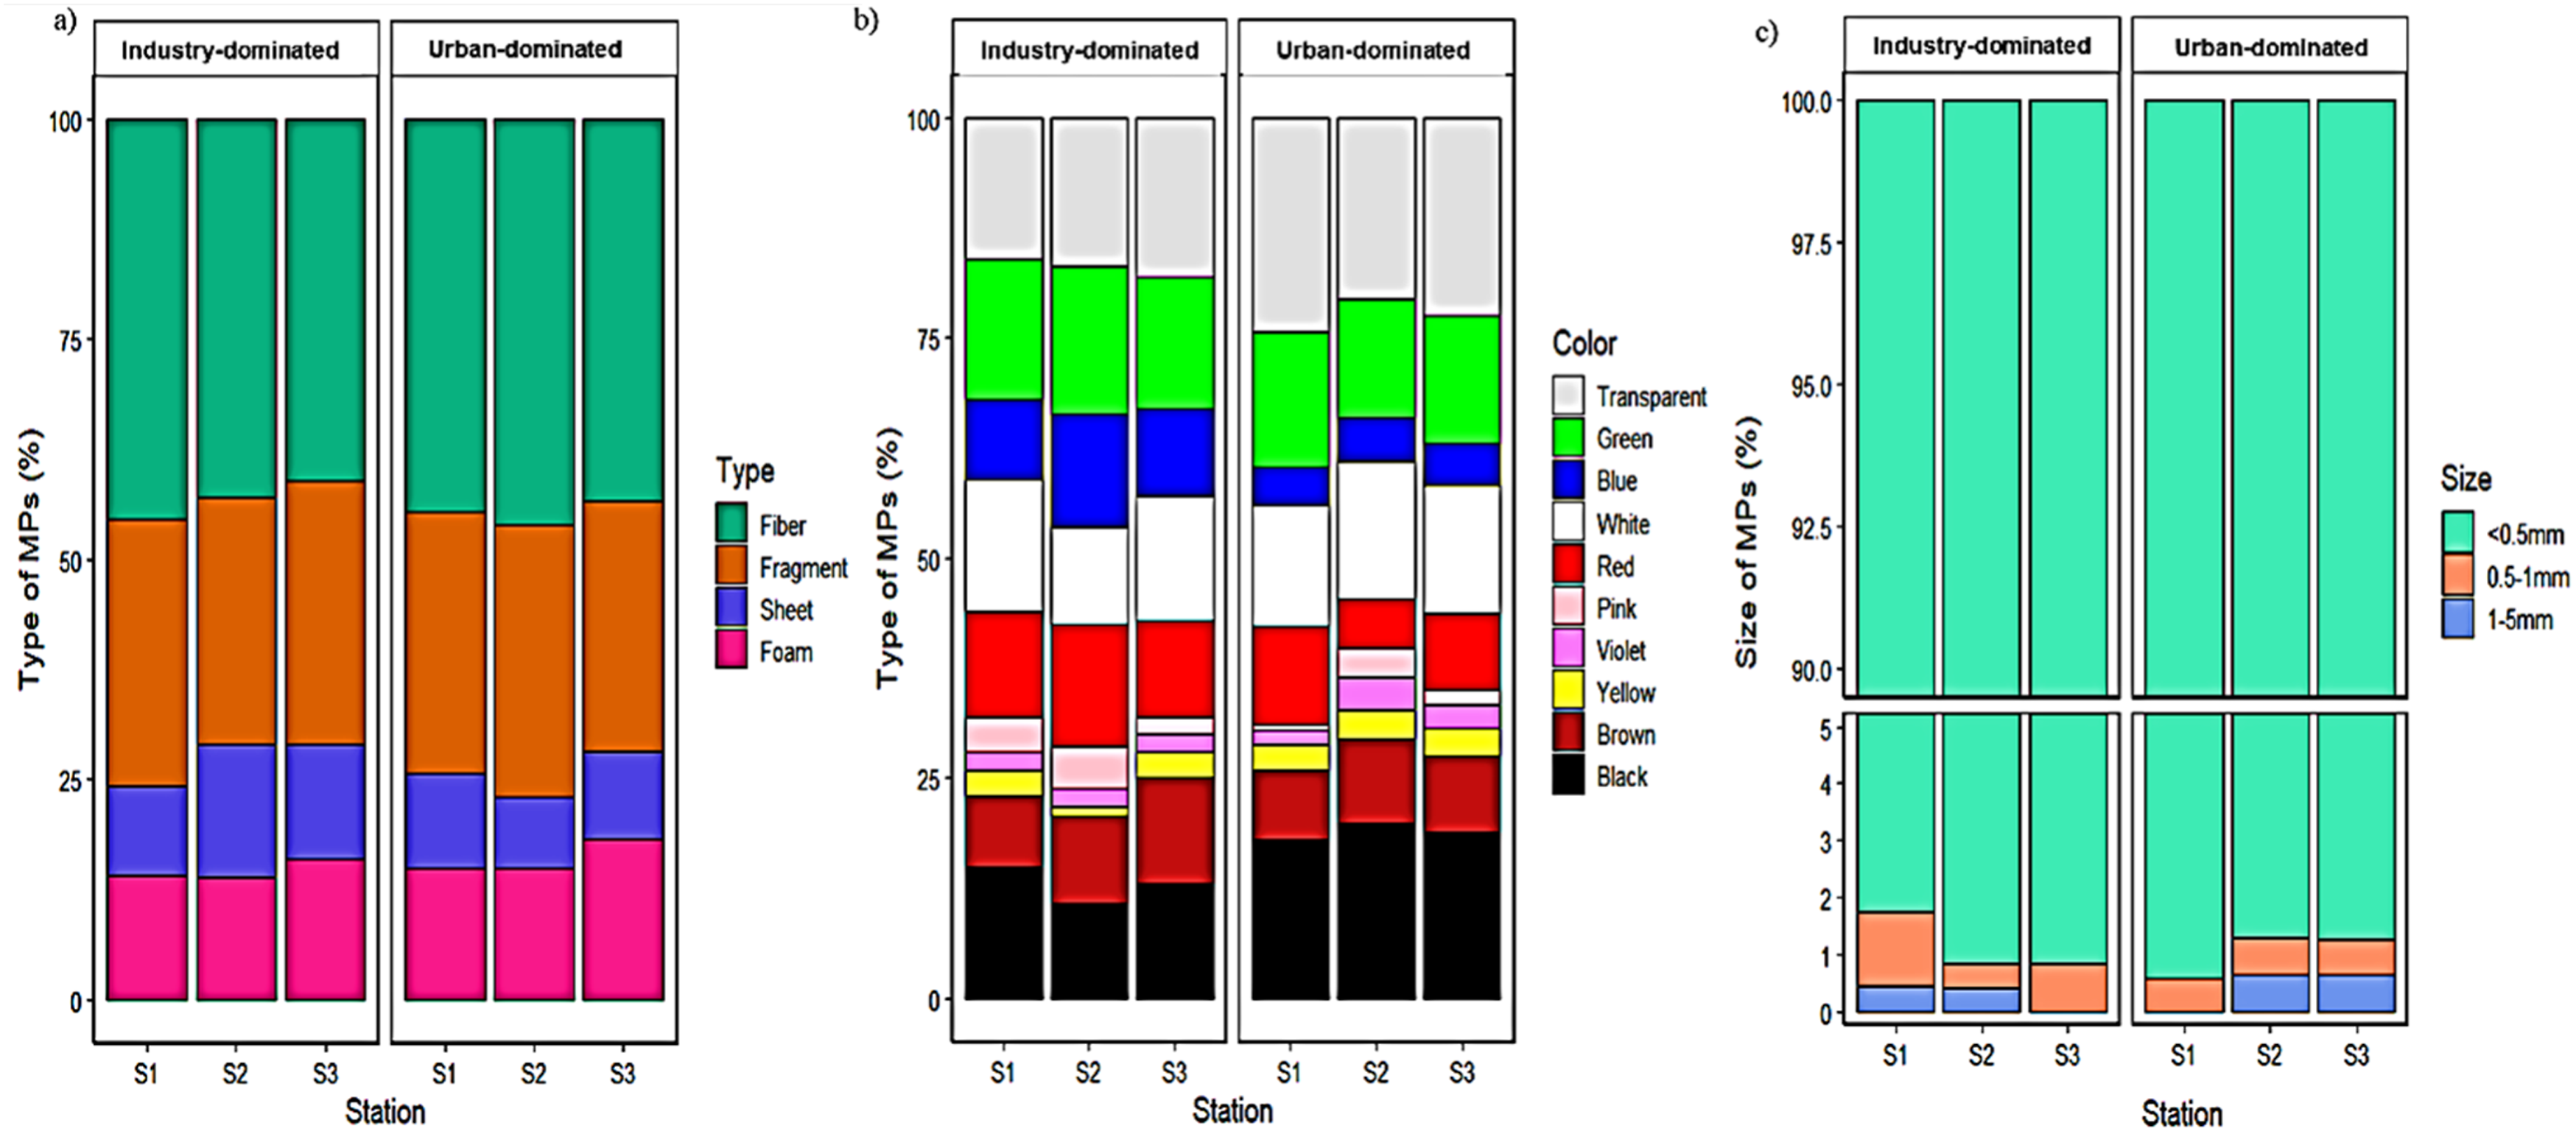
Regarding color distribution, transparent (15–25%) and green (13–17%) MPs were most abundant, while black MPs were notably higher in the urban-dominated zone (18–20%). This abundance is possibly associated with the degradation of common consumer products such as transparent polyethylene bags and green colored agricultural and industrial containers that are frequently released into the canal. Black MPs were more prevalent in the urban area (18-20%), most likely due to tyre abrasion and industrial pollution. Black particles are often associated with tire wear, road dust, industrial soot, and degraded plastic packaging, and their abundance suggests increased contributions from vehicular traffic and urban infrastructure. 5 The persistence of darker-colored MPs is attributed to their chemical stability and lower susceptibility to photodegradation.70,71
More than 98% of the microplastics were smaller than 0.5 mm, with only a small fraction in the 0.5–1 mm size class and negligible amounts in the 1–5 mm range. This pronounced dominance of fine particles indicates extensive environmental fragmentation, likely driven by prolonged UV exposure, mechanical abrasion, and microbial degradation. The prevalence of such small particles suggests high mobility within the aquatic system due to reduced settling velocity and increased residence time in the water column, enhancing transport potential and exposure to aquatic organisms. Their large surface area relative to volume further increases their capacity to adsorb pollutants and interact with microbial communities, thereby amplifying ecological risks.6,35,72
Collectively, the predominance of fiber-type, small-sized, and varied-color MPs indicates diverse pollution sources including industrial discharge, urban runoff, synthetic textiles, and degraded plastic debris. These characteristics highlight the environmental persistence and ecological risk posed by MPs in the canal ecosystem.
3.2.2. Characterization of Microbial Pollutants
The microbial biota of the Noakhali Canal system was characterized by a distinct assemblage of heterotrophic bacteria, aerobic decomposers, and fecal indicator organisms, shaped by a combination of natural processes and sustained anthropogenic inputs. Dominant groups included heterotrophic bacteria involved in the breakdown of organic matter, as well as fecal indicator organisms such as Escherichia coli and fecal coliforms, which are strongly linked to sewage and animal waste contamination. Average total plate count (TPC) values were notably high in both areas, with the industrially influenced zone (Area 1) averaging 5.01 × 10⁶ CFU/mL and the less impacted urban zone (Area 2) averaging 4.26 × 10⁶ CFU/mL, reflecting intense microbial activity and organic enrichment (Figure 3). Fecal contamination was pervasive across the system, with mean E. coli levels of 3.09 × 10⁴ CFU/mL in Area 1 and 3.19 × 10⁴ CFU/mL in Area 2, and fecal coliforms at 3.63 × 10⁴ CFU/mL and 3.72 × 10⁴ CFU/mL, respectively. These consistently high values indicate the presence of microbial populations originating from untreated domestic sewage, agricultural runoff, and potentially leaking sanitation infrastructure. The slightly higher TPC in the industrial zone also suggests additional microbial contributions from organic-laden industrial effluents. Although Salmonella spp. Were not detected in either area, the combined presence of diverse bacterial groups—ranging from aerobic decomposers to facultative anaerobes and fecal indicators—demonstrates a pollution-driven microbial community adapted to nutrient-rich, low-oxygen environments. The microbial contamination levels observed in the present study notably exceed WHO drinking water standards (0 CFU/100 mL) and the recommended limits for recreational waters (<250 CFU/100 mL for E. coli), situating the study area firmly within the high-risk category for microbial exposure. Spatial distribution of microplastics (A) and microbial pollutants—(B) total plate count (TPC), (c) Escherichia coli, and (D) fecal coliforms—in the industrial-dominated and urban-dominated zones of the Noakhali canal system. The Y-axis values were multiplied by 100 to express the data in CFU/100 mL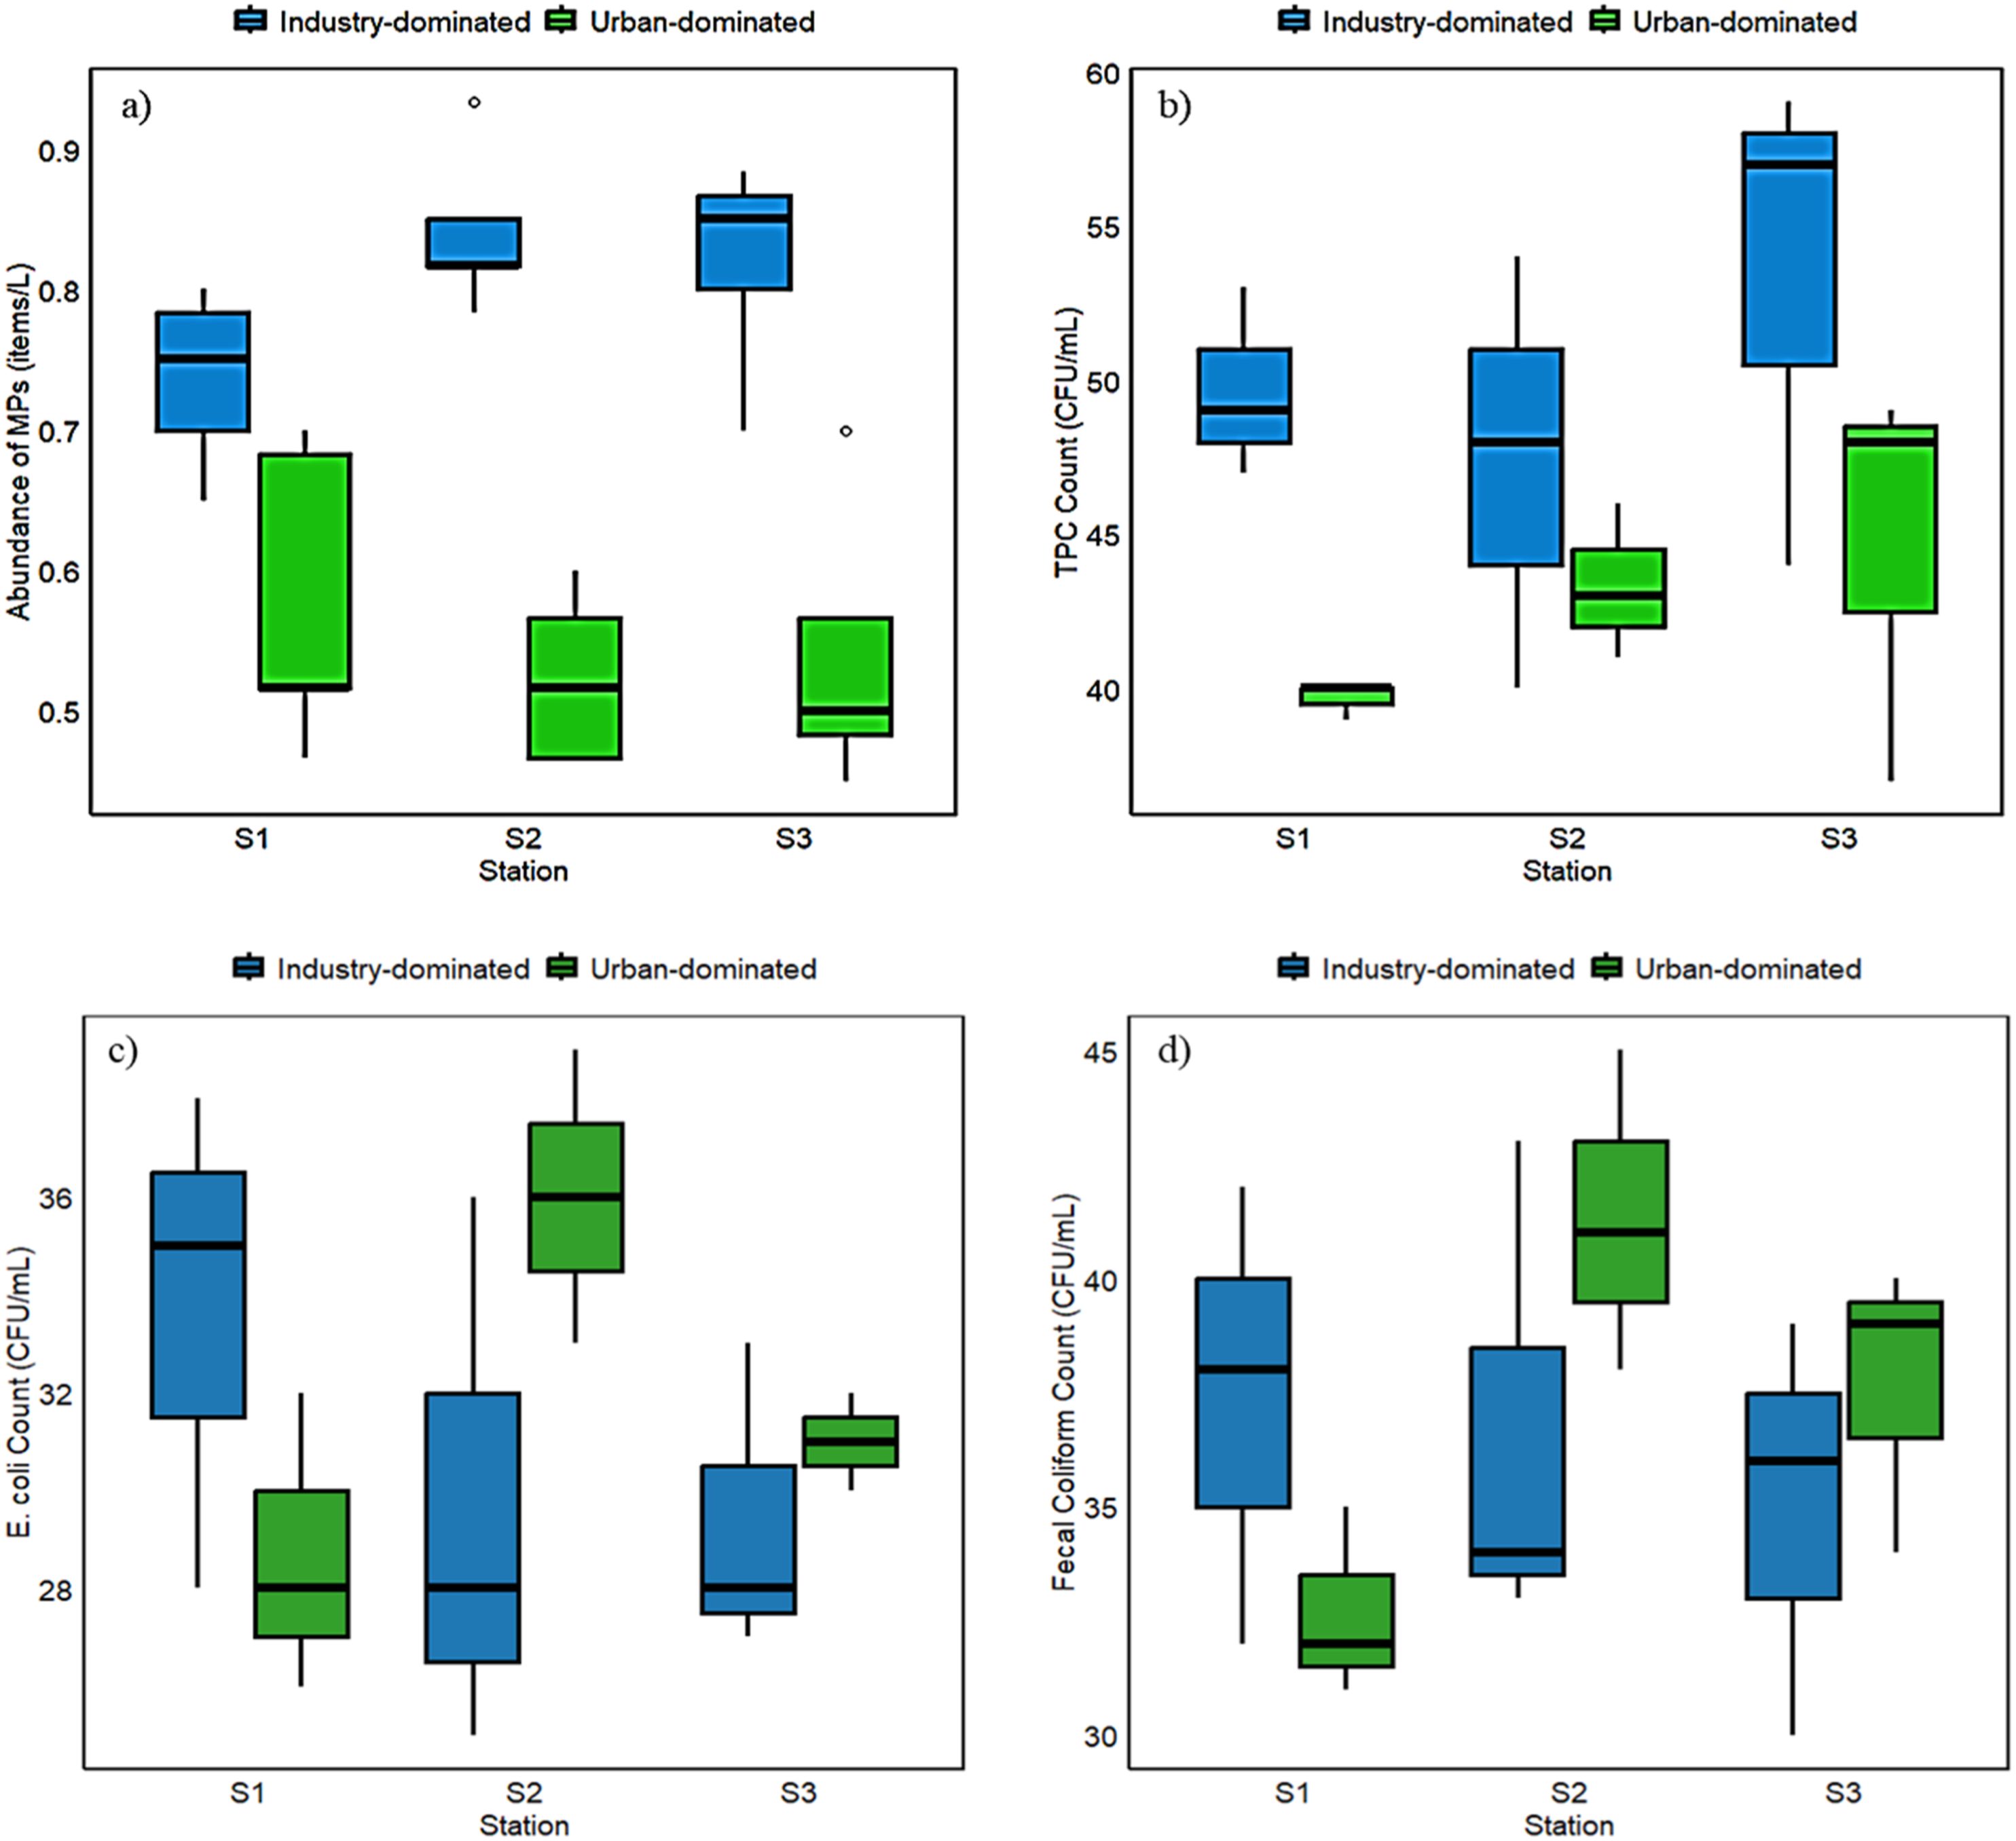
3.2. Distribution of MPs and Microbial Pollutants in the Canal Systems
The spatial distribution of MPs and microbial pollutants was assessed across two contrasting zones of the Noakhali canal systems, each comprising three sampling stations. MP concentrations in surface water ranged from 0.45 to 0.93 items L-1, with the industry-dominated zone showing elevated levels (mean: 0.77–0.82 items L-1) compared to the urban area (mean: 0.53–0.59 items L-1). This spatial disparity suggests that an industry-dominated zone may be more strongly influenced by local anthropogenic activities, possibly related to urban discharge or land-based runoff. Similar urban-rural contrasts in MP abundance have also been reported in riverine systems, where higher microplastic loads were linked to wastewater outfalls and urban storm water inputs. 11
The high MP concentrations in the industrial zone may be a result of point source pollution and hydrodynamic conditions. These areas of low flow velocity and stagnation zones decrease pollutant removal, leading to the accumulation of MPs and microbial contaminants. The presence of MPs and microbial contaminants together can significantly affect water quality. They change dissolved oxygen, pH and nutrients. MPs can act as surfaces for microbial colonisation and leach organic compounds. This can lead to microbial regrowth and impaired disinfection. Previous studies have highlighted that during periods of reduced flow, MPs tend to accumulate near emission sources due to limited dispersion, a pattern also observed in the urban stretches of the Xiangjiang River. 11 In contrast, urban dominated zone may experience relatively higher flushing or lower pollution input, leading to reduced MP accumulation.
The microbial analysis revealed substantial contamination across both study sites, with total plate count (TPC) values ranging from 3,900 to 5,333 CFU/100 mL (Figure 3). In the industrially influenced zone (Area 1), TPC values were significantly higher than those in the urban zone (Area 2) (p < 0.05), indicating enhanced microbial proliferation and organic enrichment in the industrial area. In contrast, fecal indicator bacteria showed no statistically significant spatial variation between the two zones (p > 0.05). E. coli concentrations averaged 3,090 CFU/100 mL in Area 1 and 3,190 CFU/100 mL in Area 2, while fecal coliform counts averaged 3,630 CFU/100 mL and 3,720 CFU/100 mL, respectively (Figure 3). The consistently high levels of these indicators across both sites suggest widespread fecal contamination irrespective of dominant land-use patterns. However, their consistent presence above threshold levels indicates persistent microbiological pollution.
The simultaneous occurrence of elevated microplastic (MP) concentrations and high microbial loads in the industry-dominated zone supports the hypothesis that MPs may act as carriers or attachment surfaces for microbial colonization, including potentially pathogenic taxa.11,35 Although the present study did not directly investigate plastisphere formation, the spatial overlap between MP hotspots and microbial contamination suggests the presence of synergistic pollution dynamics. Comparable findings were reported by Zhao et al, 11 who observed only weak direct relationships between overall MP abundance and microbial richness, whereas stronger associations emerged when particle characteristics such as size, color, and shape were considered, particularly for MPs within the 50–100 μm size range. Accordingly, future investigation of the morphological and polymer-specific characteristics of MPs in this canal system may provide deeper insight into their interactions with resident microbial communities.
The interaction between microplastics and microbial growth in the Noakhali canal system is multifaceted, with MPs serving as a microhabitat for the formation of specialized microbial communities known as the “plastisphere”.73,74 Beyond a simple association, the literature describes how the high surface-to-volume ratio and hydrophobicity of MPs, especially smaller than 0.5 mm, facilitate microbial attachment and biofilm development.6,35 The plastic surfaces offer an environment that protects bacteria from external stresses (e.g., UV radiation and turbulence) while potentially allowing the survival and transport of opportunistic pathogens and faecal indicator bacteria such as Escherichia coli.3,5,11 Additionally, the breakdown of MPs may produce assimilable organic carbon (AOC), further enhancing microbial growth and regrowth in the aquatic environment.15,17 This symbiotic relationship is especially pronounced in low-oxygen, nutrient-rich environments where MPs can serve as mobile habitats for bacteria, making it difficult to predict and manage natural attenuation processes and enhancing human health risks.6,75
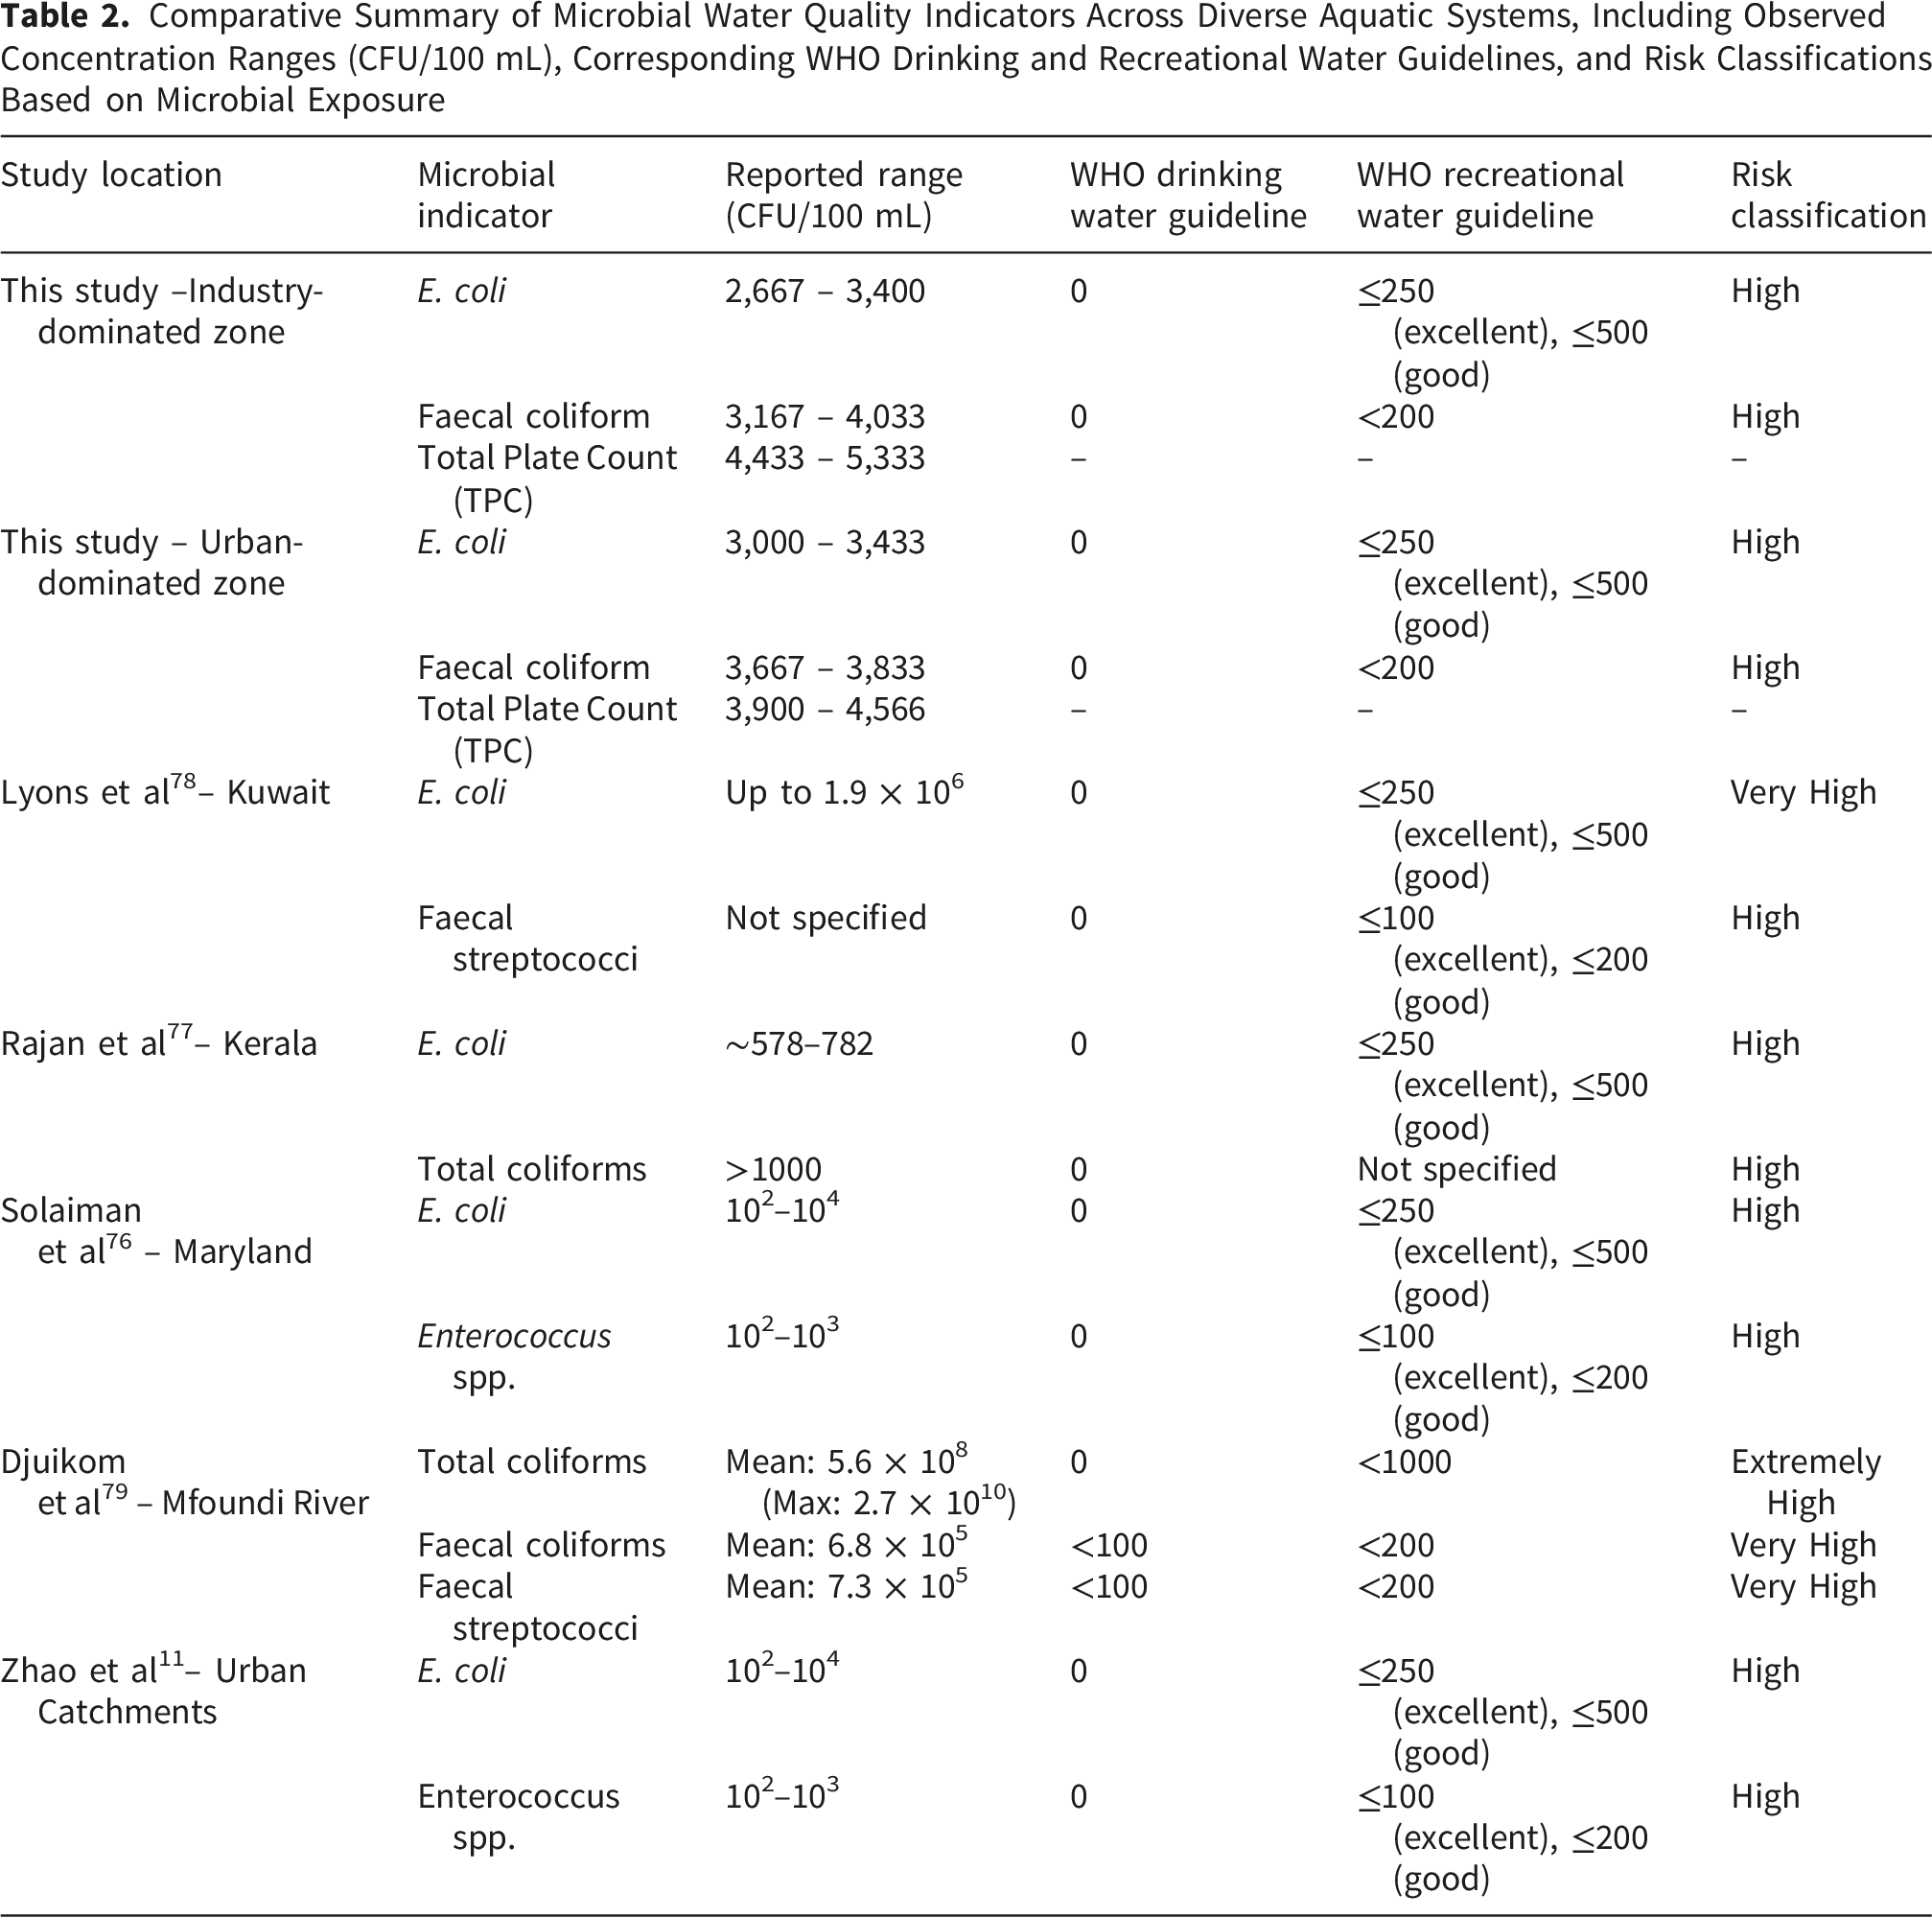
Comparative Summary of Microbial Water Quality Indicators Across Diverse Aquatic Systems, Including Observed Concentration Ranges (CFU/100 mL), Corresponding WHO Drinking and Recreational Water Guidelines, and Risk Classifications Based on Microbial Exposure
3.3. Combined Effects of Microplastic and Microbial Pollution on Water Quality Degradation
Microplastic contamination and microbial pollution in the Noakhali Canal system appear to act in concert, contributing to marked degradation of aquatic ecosystem quality. Microplastic concentrations ranged from 0.45 to 0.93 items/L, with the highest levels recorded in industrially influenced areas. These locations also exhibited elevated microbial contamination, where Escherichia coli and fecal coliforms exceeded 4,000 CFU/100 mL, substantially surpassing WHO guideline values for both drinking and recreational waters (Table 2). The co-occurrence of these pollutants was most evident in low-flow and stagnant sections of the canal, characterized by reduced dissolved oxygen levels as low as 2.44 mg/L, elevated conductivity, and comparatively higher pH. Together, these conditions indicate compounded environmental stress and deteriorating water quality within the system. Morphologically, MPs were predominantly fibrous and small, with over 98% measuring less than 0.5 mm—an attribute that significantly enhances microbial adhesion and biofilm formation due to their high surface-area-to-volume ratio.6,35
Pearson correlation analysis revealed key relationships between MP properties and microbial indicators (Figure 4). MP abundance was moderately positively correlated with total plate count (TPC; r ≈ 0.51), suggesting that higher concentrations of MPs may support more extensive bacterial growth. Foam and sheet-type MPs showed positive correlations with E. coli (r = 0.47) and fecal coliforms (r = 0.44), likely due to their rough surface textures and hydrophobicity, which facilitate microbial colonization.74,80 Pearson correlation matrices showing relationships between microplastics and microbial indicators. (A) MP abundance vs. microbial indicators; (B) MP type vs. microbial indicators; (C) MP color vs. microbial indicators; (D) MP size vs. microbial indicators. Circle size and color indicate correlation strength and direction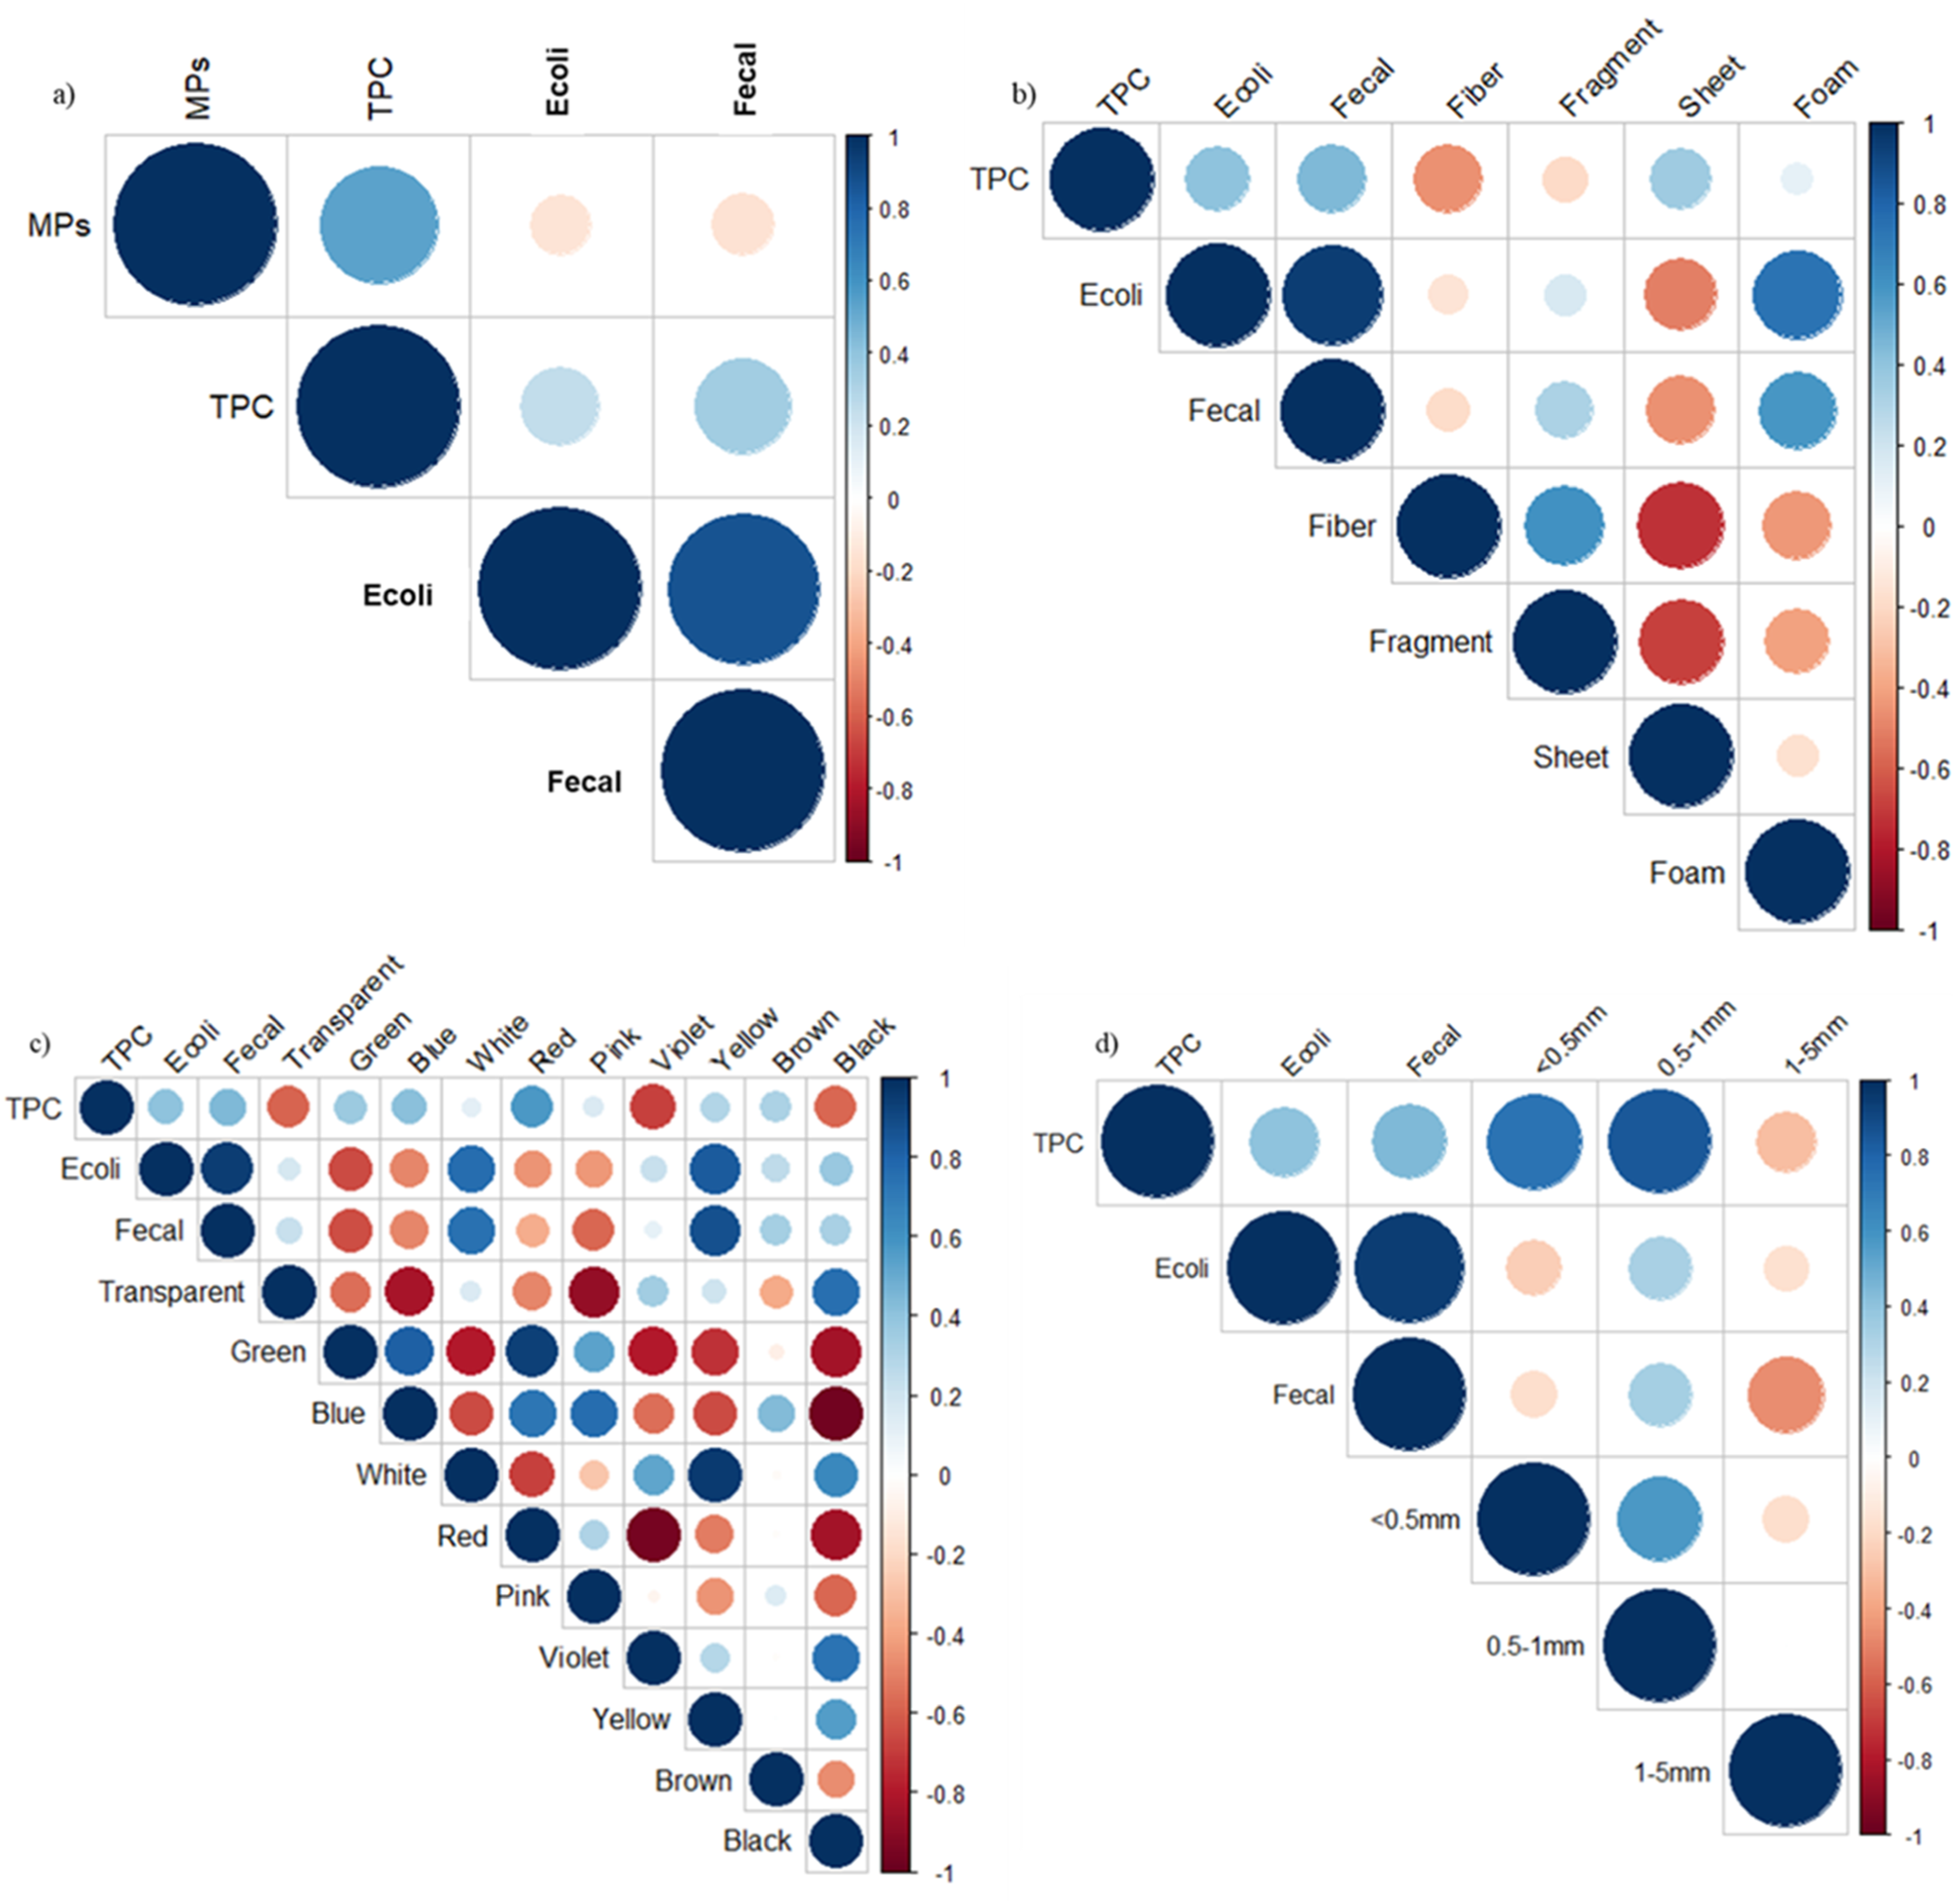
Color also influenced microbial associations. MPs with white, pink, and violet hues exhibited stronger correlations with microbial loads (r values ranging from 0.48 to 0.61), possibly due to differential surface chemistry, aging, or UV absorption, which are known to alter microbial affinity.11,71 In contrast, darker or transparent MPs were weakly or negatively correlated with microbial indicators. The size of MPs was another critical factor: particles smaller than 0.5 mm were moderately to strongly correlated with all microbial indicators (r values ranging from 0.53 to 0.66), whereas larger MPs (>1 mm) showed weak or inverse relationships, reaffirming the role of particle size in promoting microbial colonization and transport.35,74
Principal Component Analysis (PCA) was used to explore relationships among variables and explained 86.98% of the total variance through the first two components (PC1 = 63.12%, PC2 = 23.86%) (Figure 5). The analysis showed a clear separation between industrial and urban sampling zones. Urban samples were primarily associated with PC1 and aligned with elevated physicochemical parameters, including electrical conductivity, total dissolved solids, salinity, pH, and temperature, reflecting influences from domestic discharges and urban runoff.11,75,81 In contrast, industrial sites such as Ind_R2 and Ind_R5 were strongly associated with PC2 and clustered with microbial indicators, particularly Escherichia coli and fecal coliforms, indicating a dominant signal of biological contamination likely driven by untreated industrial effluents and sewage leakage.27,71 Principal Component Analysis (PCA) biplot illustrating the relationships among microplastic (MP) characteristics, microbial indicators, and physicochemical parameters in canal water. Urban samples are denoted as Urb_R3 and Urb_R4, while industrial samples are represented by Ind_R2 and Ind_R5, reflecting distinct clustering patterns associated with different pollution sources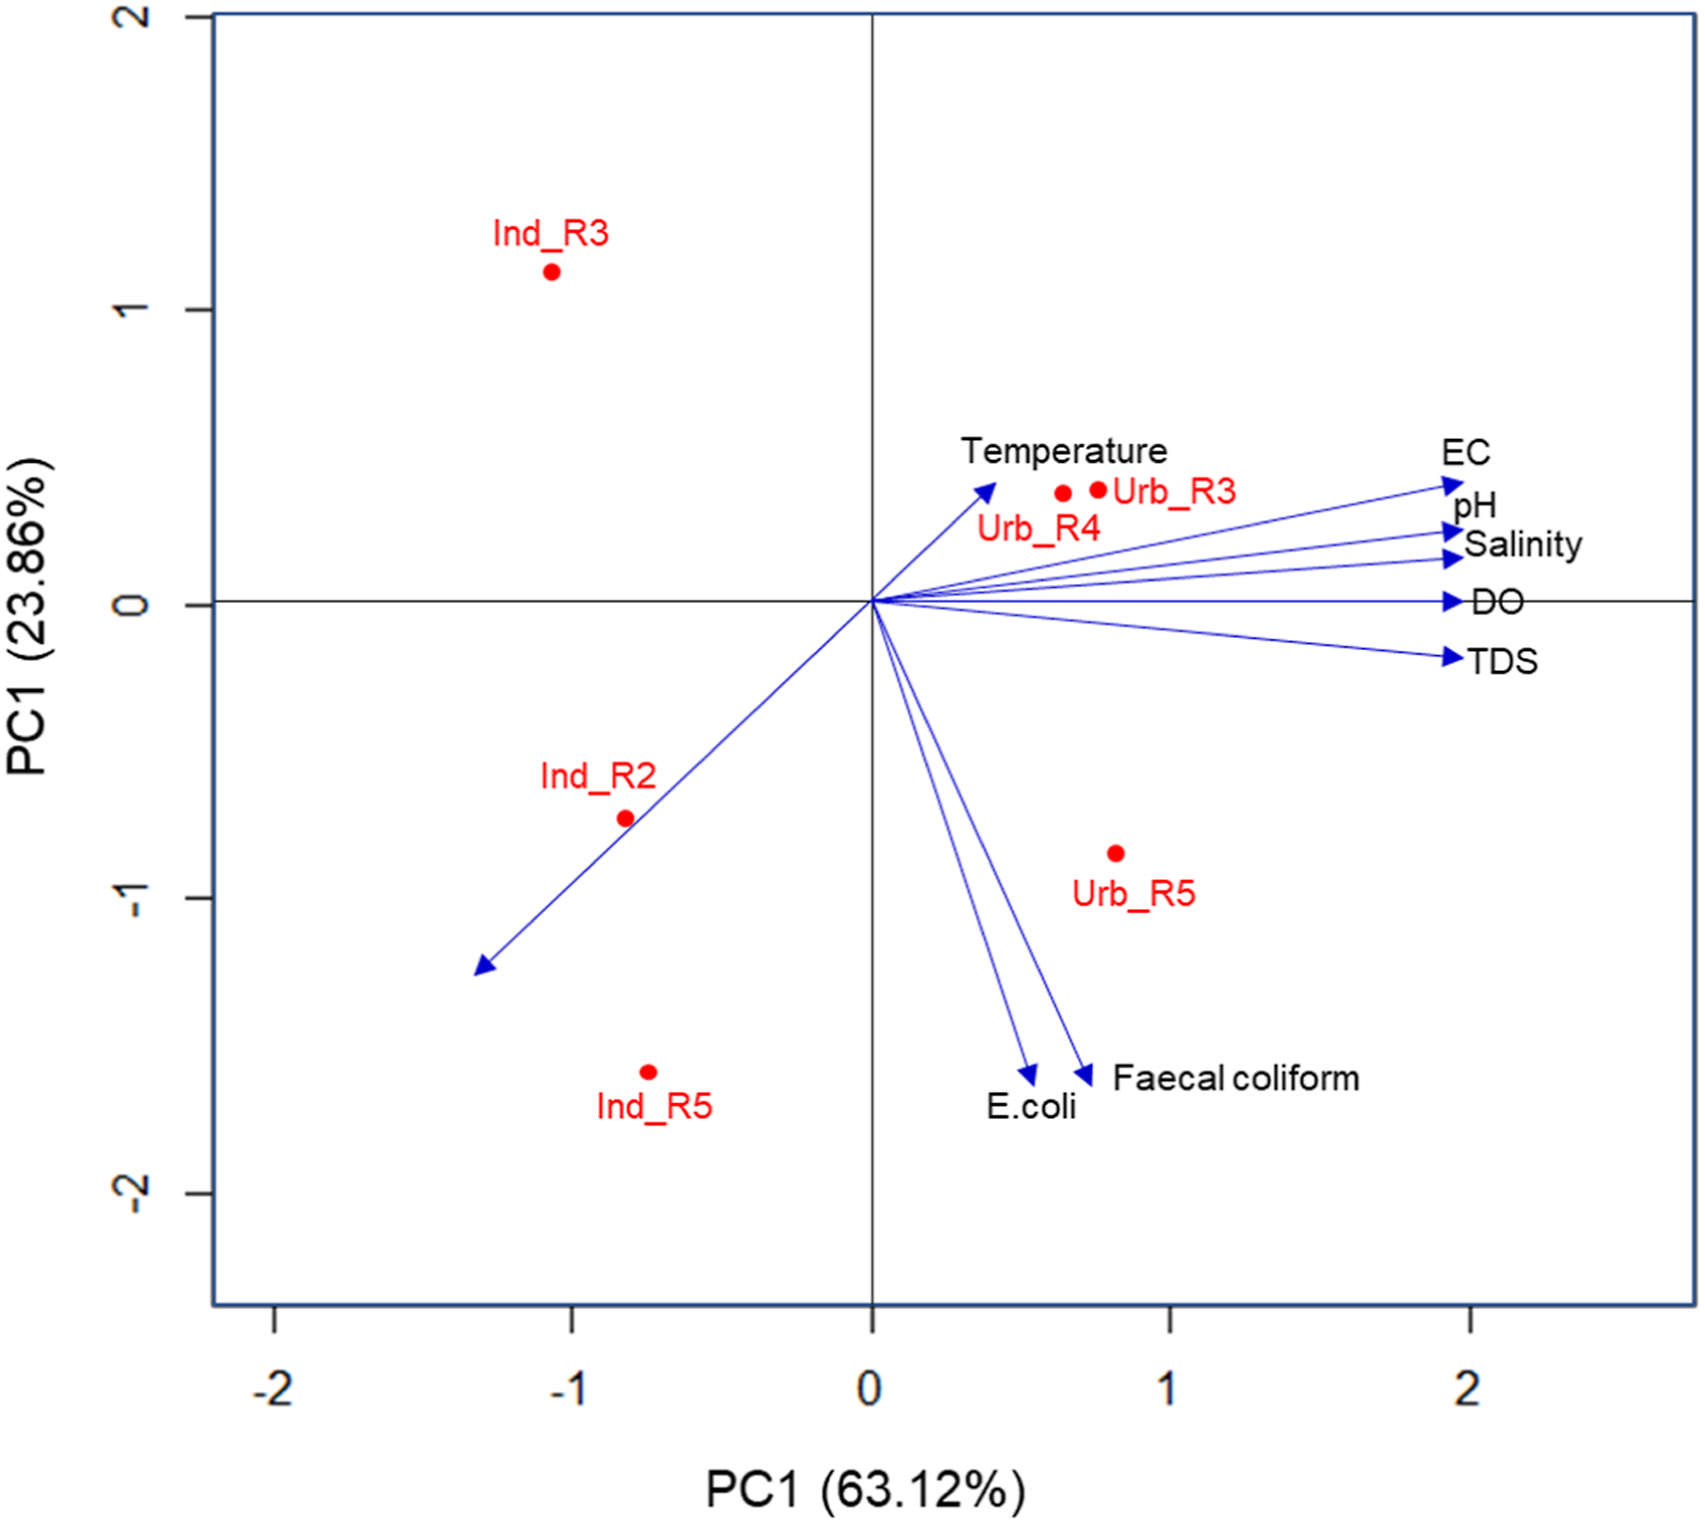
Importantly, the PCA biplot (Figure 5) also highlighted that MP abundance, TPC, and fecal indicators spatially aligned with the most degraded water quality parameters, including low DO and elevated nutrient indicators, reinforcing the notion of synergistic pollutant effects. Transitional sites such as Ind_R1 and Urb_R1, located near the origin of the PCA biplot, demonstrated weaker loadings across all variables, suggesting moderate or mixed pollution influences. 82
Together, the correlation and multivariate analyses support the interpretation that MPs—especially small, colored, and certain morphologies—are not only passive pollutants but active facilitators of microbial persistence in contaminated freshwater systems. These plastisphere-like interactions may exacerbate microbial pollution by offering refuge and transport mechanisms for pathogens,73,74 complicating disinfection and natural attenuation processes.
3.3. Microplastic and Microbial Pollution Impact on Water Quality and Public Health
3.3.1. Microplastic Pollution and Water Quality Degradation
The results of Contamination Factor (CF) and Pollution Load Index (PLI) analyses clearly reveal the effects of microplastic pollution on water quality degradation in the Noakhali Canal system. We used a reference baseline value of 0.45, which is the lowest concentration found in regional freshwater bodies of comparable hydro-morphological properties, to determine the anthropogenic enrichment of microplastics. CF values in all stations were significantly higher, with higher levels in the industrial zone (1.72 to 1.81) than the urban zone (1.16 to 1.31) (Figure 6). This shift from the baseline suggests substantial microplastic buildup, especially in the industrial zone, revealing that the current microplastic concentration has exceeded the system’s natural carrying capacity. The PLI values, which integrate overall pollution burden, further support this pattern, showing significant contamination in both zones, but with a higher load in the industrial area (PLI = 1.81) than in the urban area (PLI = 1.19). Since PLI values above 1 signify pollution, the results confirm that MP accumulation is a persistent and widespread issue across the canal system. Contamination Factor (CF) and Pollution Load Index (PLI) illustrating microplastic pollution levels in industrial and urban zones of the Noakhali Canal. Values above the red dashed line (reference value = 1) indicate significant contamination relative to baseline conditions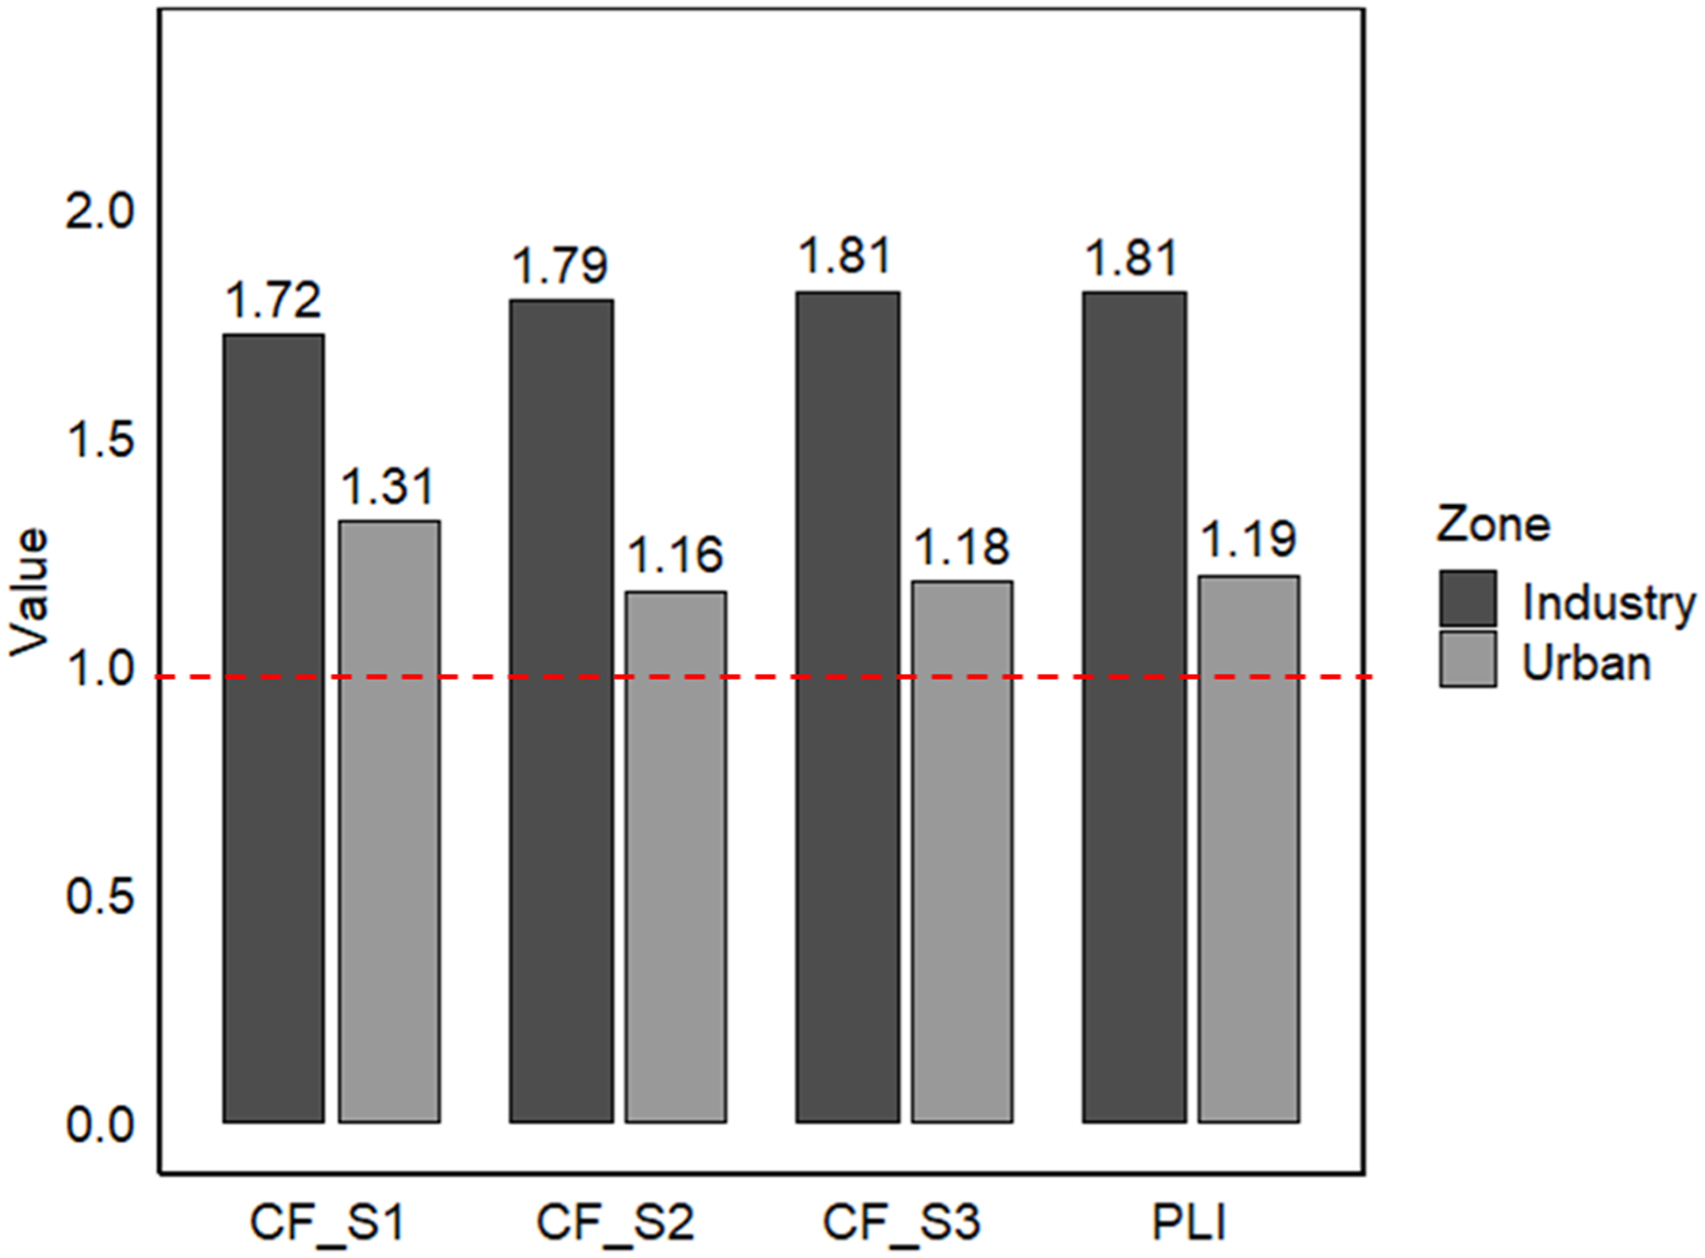
The increase in microplastic levels in industrial regions may be a result from effluent releases that include plastic waste, synthetic fibers, and particulate matter from industrial activity such as the production, packaging, and transport of products. Microplastics have hydrophobic (water-repelling) surfaces, as well as a large surface area to volume ratio, which defines their importance as vectors for widespread adsorption (the process of matter collecting on a surface) of persistent organic pollutants (POPs) and heavy metals.15,83 In addition, microplastics act as specialized substrates for the development of “plastispheres,” which refers to the formation of unique biofilms composed of microorganisms (primarily bacteria) that allow for colonization and accumulation of pathogenic populations. With the provision of these advantageous habitats, microplastics enhance the spread of pathogens through the canal system by providing the connection between the physical debris and biological contamination, resulting in the potential for bioaccumulation in organisms, movement through the food web, and ultimately the risk of human exposure through trophic transfer 84.
3.3.2. Microbial Water Quality Degradation
Microbial contamination in the Noakhali Canal system is primarily driven by anthropogenic inputs, including untreated sewage, agricultural runoff, and industrial effluents. Dominant microbial groups, such as heterotrophic bacteria, and fecal indicator organisms, such as Escherichia coli and fecal coliforms, reflect significant contamination from human and animal waste. The industrially influenced zone (Area 1) showed higher average total plate counts (TPC) at 5,010 CFU/100 mL compared to the urban zone (Area 2) at 4,260 CFU/100 mL, indicating significant microbial activity and organic enrichment (Figure 3). Fecal contamination was pervasive across the system, with mean E. coli levels of 3,090 CFU/100 mL in Area 1 and 3,190 CFU/100 mL in Area 2. These concentrations exceed the WHO drinking water standard of 0 CFU/100 mL and the safe recreational water limit for E. coli (<126–250 CFU/100 mL), posing a direct public health risk. These findings highlight the widespread presence of untreated wastewater and the potential for pathogen transmission, especially following rainfall, when runoff exacerbates contamination (Figure 7). The microbial community, comprising decomposers, facultative anaerobes, and faecal indicators, indicates the nutrient-dense, low-oxygen conditions influenced by pollution. Contamination leads to the degradation of water quality, which poses significant health risks, including the risk of waterborne diseases such as cholera, dysentery, and typhoid, particularly among vulnerable populations. The ongoing microbial contamination in the canal highlights the necessity for enhanced sanitation, wastewater management, and public health measures, especially in tropical, resource-limited environments. Conceptual funnel illustrating the combined impacts of microplastics and microbial contaminants on water quality degradation and public health risks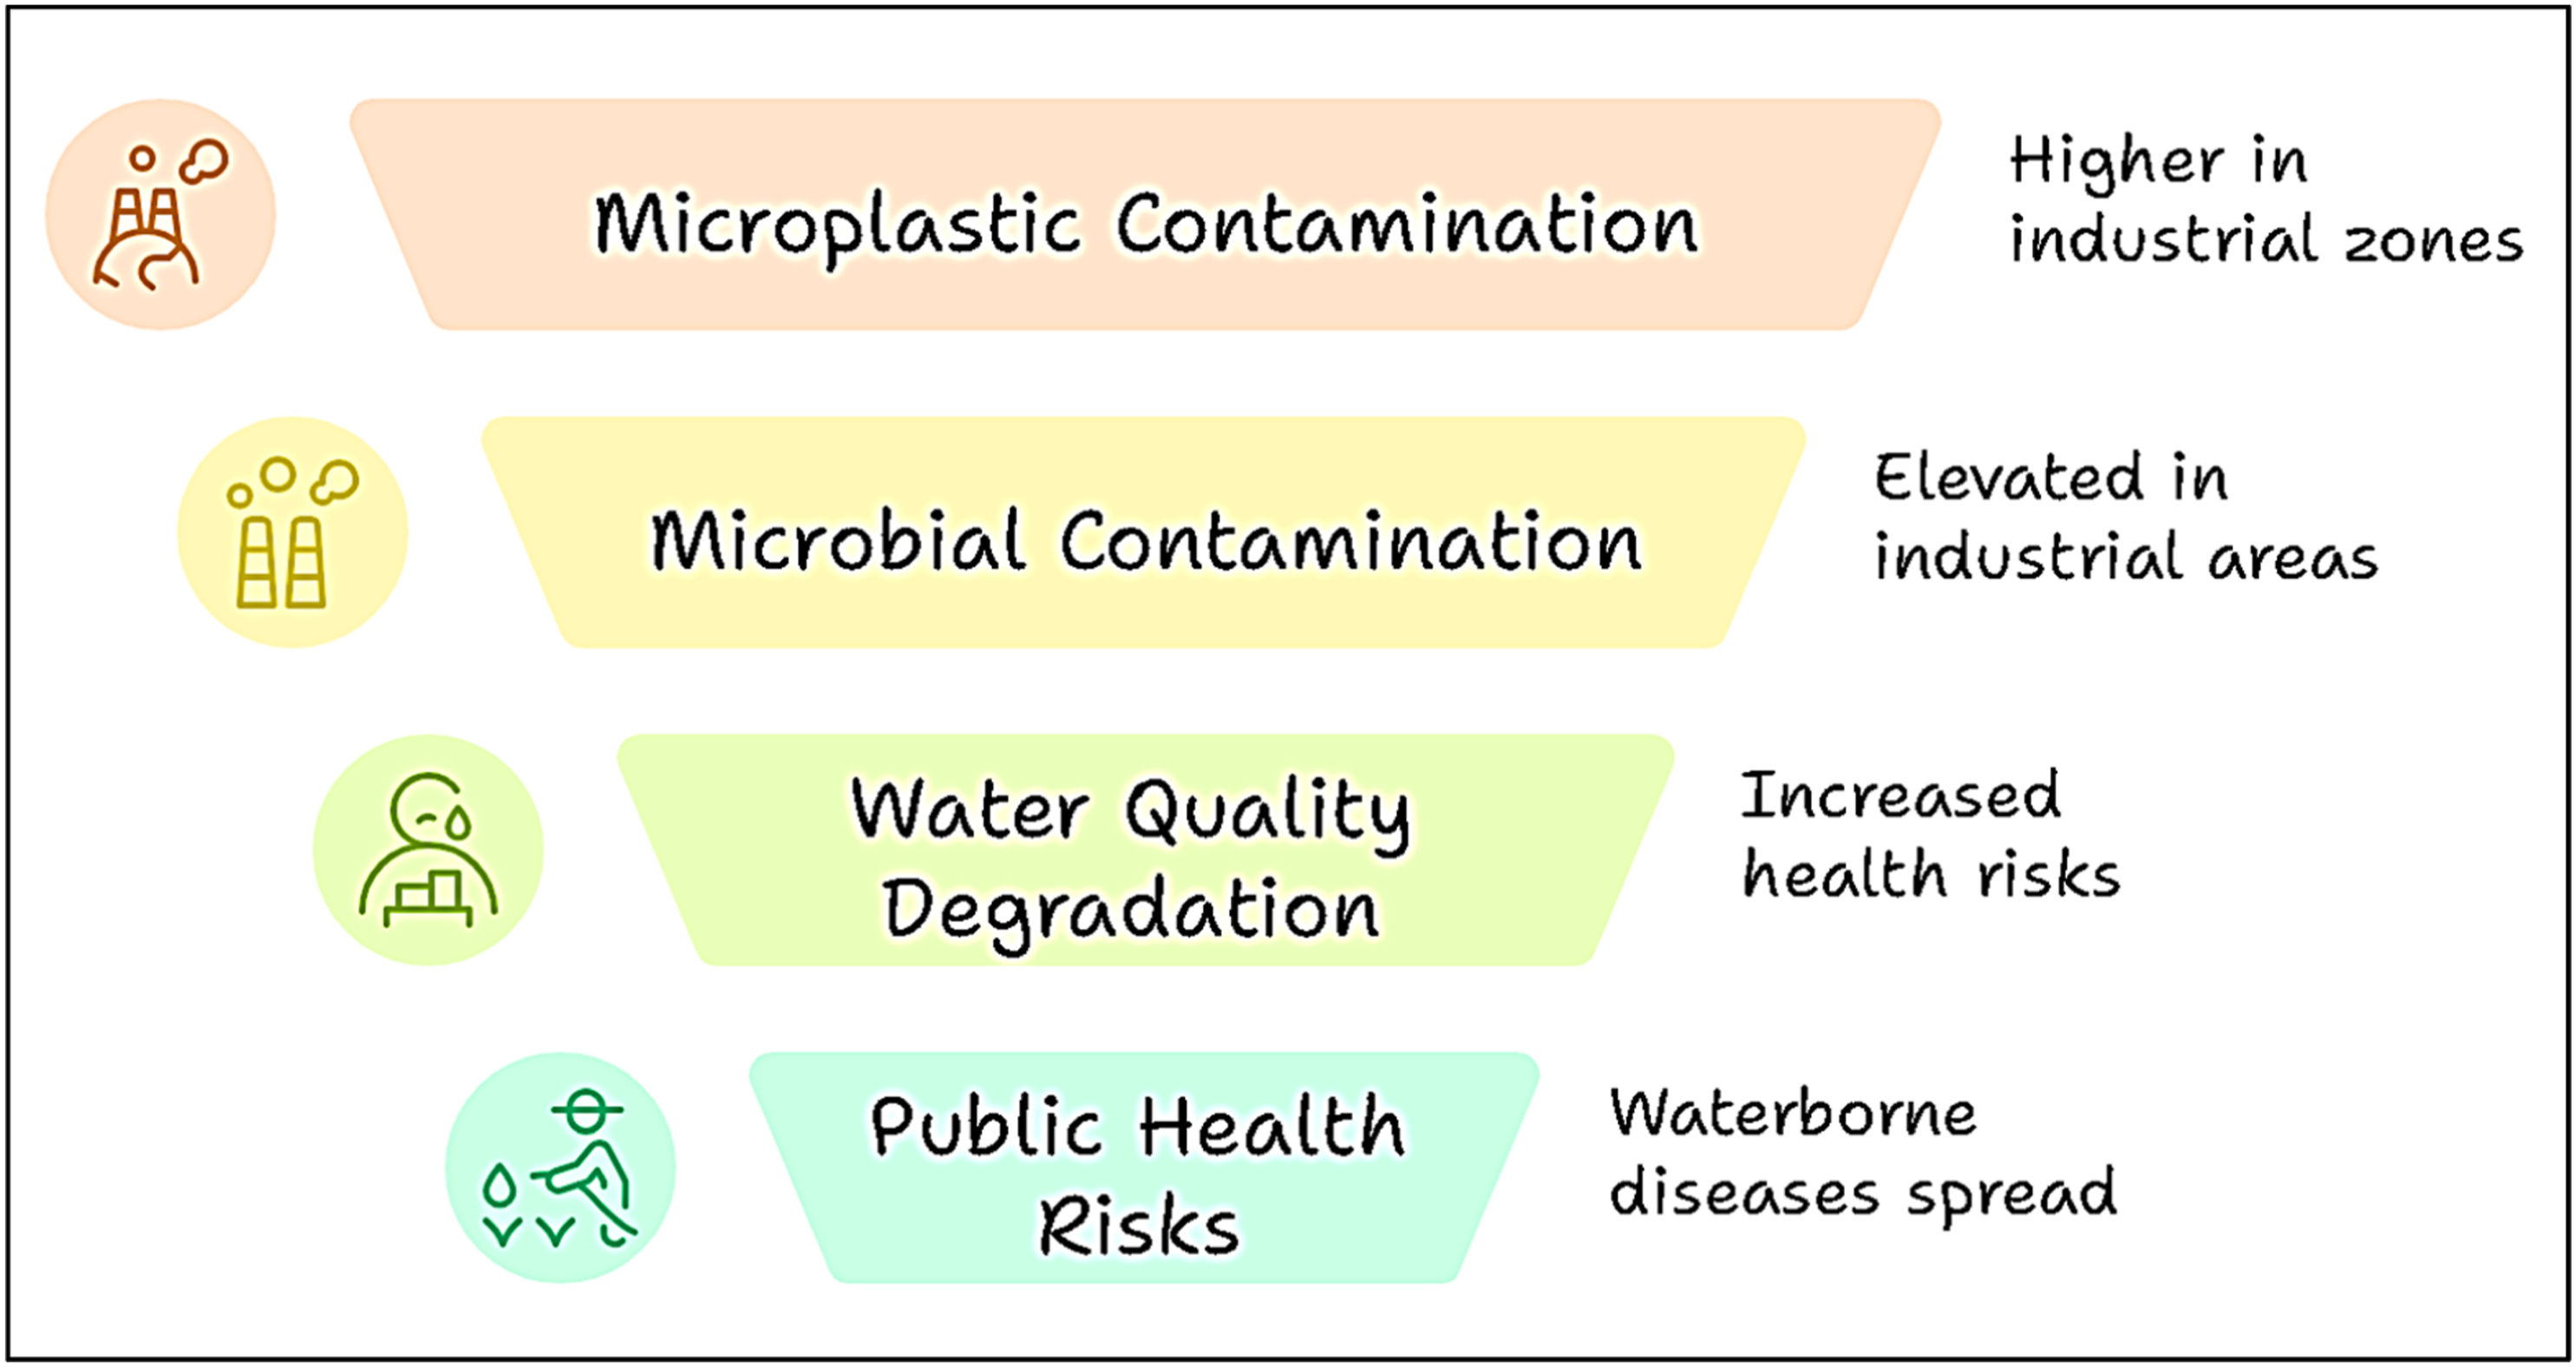
3.3.3. Public Health Risks From Non-Potable Water Use and Integrated Mitigation Strategies
In addition to concerns regarding drinking water, microbial contamination presents significant risks associated with secondary applications, including irrigation, aquaculture, and household tasks. Although E. coli and faecal coliform levels significantly surpass WHO standards, communities in the study area consistently utilize canal water for washing, bathing, and irrigation, thereby promoting the transmission of waterborne pathogens.
Contaminated irrigation water is capable of transmitting E. coli and Salmonella spp. To fresh produce. Additionally, aquaculture systems utilizing polluted water experience diminished fish health, increased disease prevalence, and economic losses. 11 The use of untreated surface water in households heightens the risk of gastrointestinal and dermal infections, particularly in low-income regions with inadequate access to safe water, as evidenced by regional studies.77,78
To mitigate the risks presented, a comprehensive and multi-level approach must be taken. This includes expanding on decentralized wastewater treatment systems to provide localised, cost-effective solutions to manage effluents before they enter the canal, as well as the implementation of nature-based solutions like vegetative buffer strips and constructed wetlands/detention basins to act as efficient bio-filters to help retain microplastics and naturally reduce the number of microbial pathogens through sedimentation of the organisms or through ‘biological uptake’ by the bio-filter materials. As part of the technical interventions outlined above, routine microbial testing should be performed using both culture and molecular techniques, alongside providing household treatment options such as boiling, chlorinating, and using biosand filters. The continued education regarding hygiene practices and the strict enforcement of effluent discharge regulations are critical components for protecting public health. Finally, the effective tracking of sources of contamination using source tracking tools like sterols (which indicate faecal contamination) will assist in identifying sources of contamination and aid in developing effective intervention strategies.
4. Strenthgs and Limitations of the Study
Despite the advantages of providing a comprehensive assessment of microplastic–microbial co-contamination, this study is methodologically limited by the lack of polymer composition confirmation (e.g., FTIR or Raman spectroscopy). Visual selection is limited in its detection sensitivity for particles less than 100 µm, and entrapment of natural or semi-synthetic materials may result in rare false-positive identifications as plastics. However, the only reported particles in this size range were selected by a series of stringent morphological criteria plus the hot-needle test with high confidence. Although the absence of chemical composition data is a limitation, the distribution patterns, abundance estimates, and assessed associations with microbial contamination will also be invaluable in assessing ecological degradation and potential public health threats in this understudied coastal zone. Advanced polymer characterization techniques (e.g. FTIR, Raman spectroscopy or pyrolysis-GC/MS) should be included to confirm particle identity and improve source apportionment in future studies that explore how specific polymers (e.g. PE, PET). It is important to note that co-occurrence and statistical associations between microplastics and faecal indicators are at the water column level but not bacterial colonization on individual plastic particles. To assess whether E. coli or the plastisphere community was associated with particles, direct methods would be required, such as microscopy, culture-based particle assays.
5. Conclusion
This study provides an integrated assessment of microplastic and microbial pollution in a coastal canal system of Bangladesh, revealing distinct spatial patterns associated with industrial and urban influences. High levels of MPs and fecal indicator bacteria, alongside degraded water quality parameters, indicate compounded ecological stress and substantial public health risks to the water users. The predominance of small, fibrous, and dark-colored MPs, and their positive correlation with microbial indicators, suggests that MPs may serve as effective vectors for microbial colonization in stagnant or polluted waters. These interactions not only amplify contamination levels but also complicate remediation efforts. The calculated CF and PLI affirm widespread MP contamination, especially in industrial zones. The persistence of high-risk microbial levels across both zones consistently exceeds WHO standards for recreational and drinking water, signaling a critical public health threshold. The future of mitigation efforts needs to shift from individual intervention measures to a merging of wastewater treatment upgrades with proper source control of industrial microplastics. Long-term health and protection of aquatic ecosystems can only be realized by integrating the monitoring of both microplastics and microorganisms into national water quality regulation policies, along with the long-term development of science-based regulations and long-range surveillance of the health of vulnerable coastal communities.
Supplemental Material
Supplemental Material - Co-Contamination and Combined Effects of Microplastic and Microbial Load on Water Quality and Public Health Risks in Industrial and Urban Canals of Coastal Bangladesh
Supplemental Material for Co-Contamination and Combined Effects of Microplastic and Microbial Load on Water Quality and Public Health Risks in Industrial and Urban Canals of Coastal Bangladesh by Nayema Subrin Ahmed, Mehedi Mahmudul Hasan Khadijatul Kubra Riya, Firoz Ahmed, Takaomi Arai, Nurul Aini Kamaruddin and Mohammad Belal Hossain in Environmental Health Insights.
Footnotes
Acknowledgements
Special thanks are extended to the lab assistants and research staff of the Laboratory for Ecology, Environment and Biodiversity, Noakhali, Bangladesh, for their dedicated support. Appreciation is also due to the Department of Microbiology, Noakhali Science and Technology University (NSTU), for providing essential laboratory facilities. We are sincerely grateful to Editor and the reviewers for the constructive feedback, which has significantly improved the manuscript. AI tools (e.g., ChatGpt, Napkin) were used only to refine and improve the language clarity, not to generate content, as the authors are non-native English speakers.
Author Contributions
Nayema Subrin Ahmed: Writing – original draft, Formal analysis, Data curation; Mehedi Mahmudul Hasan: Conceptualization, Supervision, resources; Khadijatul Kubra Riya: Writing – original draft, Investigation, Formal analysis, Data curation. Firoz Ahmed: Resources, supervision; Takaomi Arai: Writing – review & editing, Resources. Nurul Aini Kamaruddin: Writing – review & editing, Resources. Mohammad Belal Hossain: Conceptualization, Supervision, Writing – original draft, Writing – review & editing.
Funding
The authors disclosed receipt of the following financial support for the research, authorship, and/or publication of this article: This work was partially supported by the Universiti Brunei Darussalam Faculty/Institute/Center Research Grant (UBD/RSCH/1.4/FICBF/2024/074).
Declaration of Conflicting Interests
The authors declared no potential conflicts of interest with respect to the research, authorship, and/or publication of this article.
Data Availability Statement
Data is included in the main text.
Supplemental Material
Supplemental material for this article is available online.
References
Supplementary Material
Please find the following supplemental material available below.
For Open Access articles published under a Creative Commons License, all supplemental material carries the same license as the article it is associated with.
For non-Open Access articles published, all supplemental material carries a non-exclusive license, and permission requests for re-use of supplemental material or any part of supplemental material shall be sent directly to the copyright owner as specified in the copyright notice associated with the article.