






Abstract
Water is essential for life. Safe water quality and proper sanitation play a crucial role for improving human life by preventing waterborne diseases and enhancing better health and well-being. This study evaluated drinking water quality of Bahir Dar City from reservoirs to household taps during dry and wet seasons. Samples were examined for key physicochemical and bacteriological parameters using standard methods. The mean physicochemical analyses (pH, temperature, turbidity, total dissolved solid, Electrical conductivity, free residual chlorine, nitrate, phosphate, and fluoride) in the reservoirs were generally within World Health Organization (WHO) guideline limits during the dry and wet seasons. However, turbidity levels in the wet season and sulfide concentrations in both seasons exceeded the recommended standards. At household taps, turbidity and sulfide also exceeded permissible levels, indicating quality deterioration in the distribution system. Two-way ANOVA revealed that the main effects of sampling location and the interaction effect between sampling location and season were not statistically significant for any of the measured water quality parameters (p > 0.05), with the exception of free residual chlorine, indicating that seasonal variation was the primary factor influencing water quality in the study area. Bacteriological contamination was notable. Total coliforms were detected in 20% (dry) and 40% (wet) of reservoir samples, increasing to 46.67% (dry) and 66.67% (wet) at taps. Fecal coliforms occurred in 20% (dry) and 40% (wet) of reservoirs, and 33.33% (dry) and 26.67% (wet) of taps. All exceeded WHO standards, posing health risks. Therefore the city requires to improving sewage and drainage systems and enhancing disinfection processes at the reservoirs.
Introduction
Water plays a vital role in sustaining life and maintaining environmental balance. Access to safe drinking water is essential for human health, development, and well-being. 1 Although, water is crucial for the survival of all living organisms, it can also be a source of various infectious and chronic diseases, if it is found contaminated with biological, chemical, or physical pollutants. 2 Contaminated water supports the growth of pathogens, which have increasingly become health concerns. It is estimated that 80% of the global illnesses and diseases stem from inadequate sanitation, contaminated water, or lack of water access. 3
Water sources are increasingly threatened by urbanization and industrialization, with untreated domestic waste and industrial discharge polluting water bodies due to inadequate sanitation systems. 4 As a result; the combined impacts of pollution and population growth have made it more difficult to ensure safe drinking water for communities. Despite global initiatives to improve water quality, the spread of waterborne diseases remains a significant concern.5-7 Urban water distribution systems are particularly vulnerable to contamination from poor waste management, agricultural runoff, and other pollutant sources. 8 Further complications arise from system leaks, aging infrastructure, insufficient maintenance, and low disinfectant levels, all of which compromise water safety. In countries like Ethiopia, these issues are especially critical, with studies in cities such as Dire Dawa and Jimma revealing high levels of bacterial contamination in drinking water 83.34% and 87.5% of samples, respectively. 9 Ensuring the protection of water supplies is therefore essential to reduce health risks and prevent disease outbreaks.
In 2000, the United Nations launched the Millennium Development Goals, aiming to halve the population lacking sustainable access to safe drinking water.10,11 Ethiopia committed to this target, yet access to clean water and adequate sanitation remains a major challenge in the country and other developing nations. 12 According to WHO report, 13 in Ethiopia, about 52% of the population has access to safe drinking water, and 28% to adequate sanitation. Consequently, 60-80% of the population is affected by waterborne and water-related illnesses. The quality of water and the prevalence of related diseases are significant public health concerns in Ethiopia and other developing nations. To address these challenges, extensive research on water quality and continuous monitoring are essential for improving the situation.
Bahir Dar is the capital city of the Amhara Regional State and known for its remarkable natural beauty. It is located along the shores of Lake Tana and the Abbay River. Nevertheless, the city does not have an effective and sustainable waste management system; approximately 43% of solid waste remains uncollected or improperly disposed of in open areas, thereby posing significant risks to public health and environmental quality. 14 The Ethiopian Demographic and Health Survey (EDHS) 15 reported that the prevalence of diarrhea in Bahir Dar was 12%. Factors such as leaking pipelines, low water pressure, and intermittent water supply may contribute to contamination within the water distribution system. In addition, the city’s water service coverage is estimated to be about 60%, and this limited access to water may further exacerbate the deterioration of drinking water quality in the area. Moreover, previous Studies revealed considerable microbial contamination in the drinking water supplies of the city. Sitotaw et al., 16 reported that 83.83% of total coliform and 26.12% of fecal coliform samples exceeded the WHO permissible limits. Similarly, Alemu et al., 2 documented fecal coliform concentrations ranging from 3.2 to 10.6 CFU/100 mL and total coliform counts varying from 56.8 CFU/100 mL to uncountable levels. Despite these concerns, there is limited documented information on the quality of drinking water at the reservoir & in the distribution system. Therefore, this study was designed to evaluate the physicochemical and bacteriological quality of drinking water from the reservoir (treatment site) to household taps in Bahir Dar City.
Materials and Methods
Description of the Study Area
Bahir Dar is the capital city of the Amhara regional state which is one of the leading tourist destinations in Ethiopia surrounded by Lake Tana and Blue Nile River (Figure 1). It covers an area of 28 Km2 or 11sq miles. It is located at the exits of the Abay from Lake Tana at an altitude of 1,800 meters (5,970 ft) above sea level, located approximately 578 Km North West of Addis Ababa. Its location with Ethiopian coordinates is 110 30′ N, and 370. 23′E while its population is above 750,993. Geologically, the area lies within the Tana Basin, which has been shaped by volcanism, sedimentation, and erosion.
17
The climate is tropical with four seasons (rainy, dry period, small rains and a dry spell between the long and small rains) and 50% of the rainfalls are in July and August and 18% falls during October to February. The maximum rainfall (499.6 mm) was in July and the minimum was in January (1.8 mm). The mean annual relative humidity was 55%. The maximum temperature usually occurs in March to May. The mean monthly maximum was 27.7 °C and minimum was 13 °C.
16
In Bahir Dar City, diverse human activities are taking place, including trade and commerce, small-to medium-scale industrial operations, ongoing construction and infrastructure development, as well as urban and intensive agricultural practices in and around the city. Map of the study area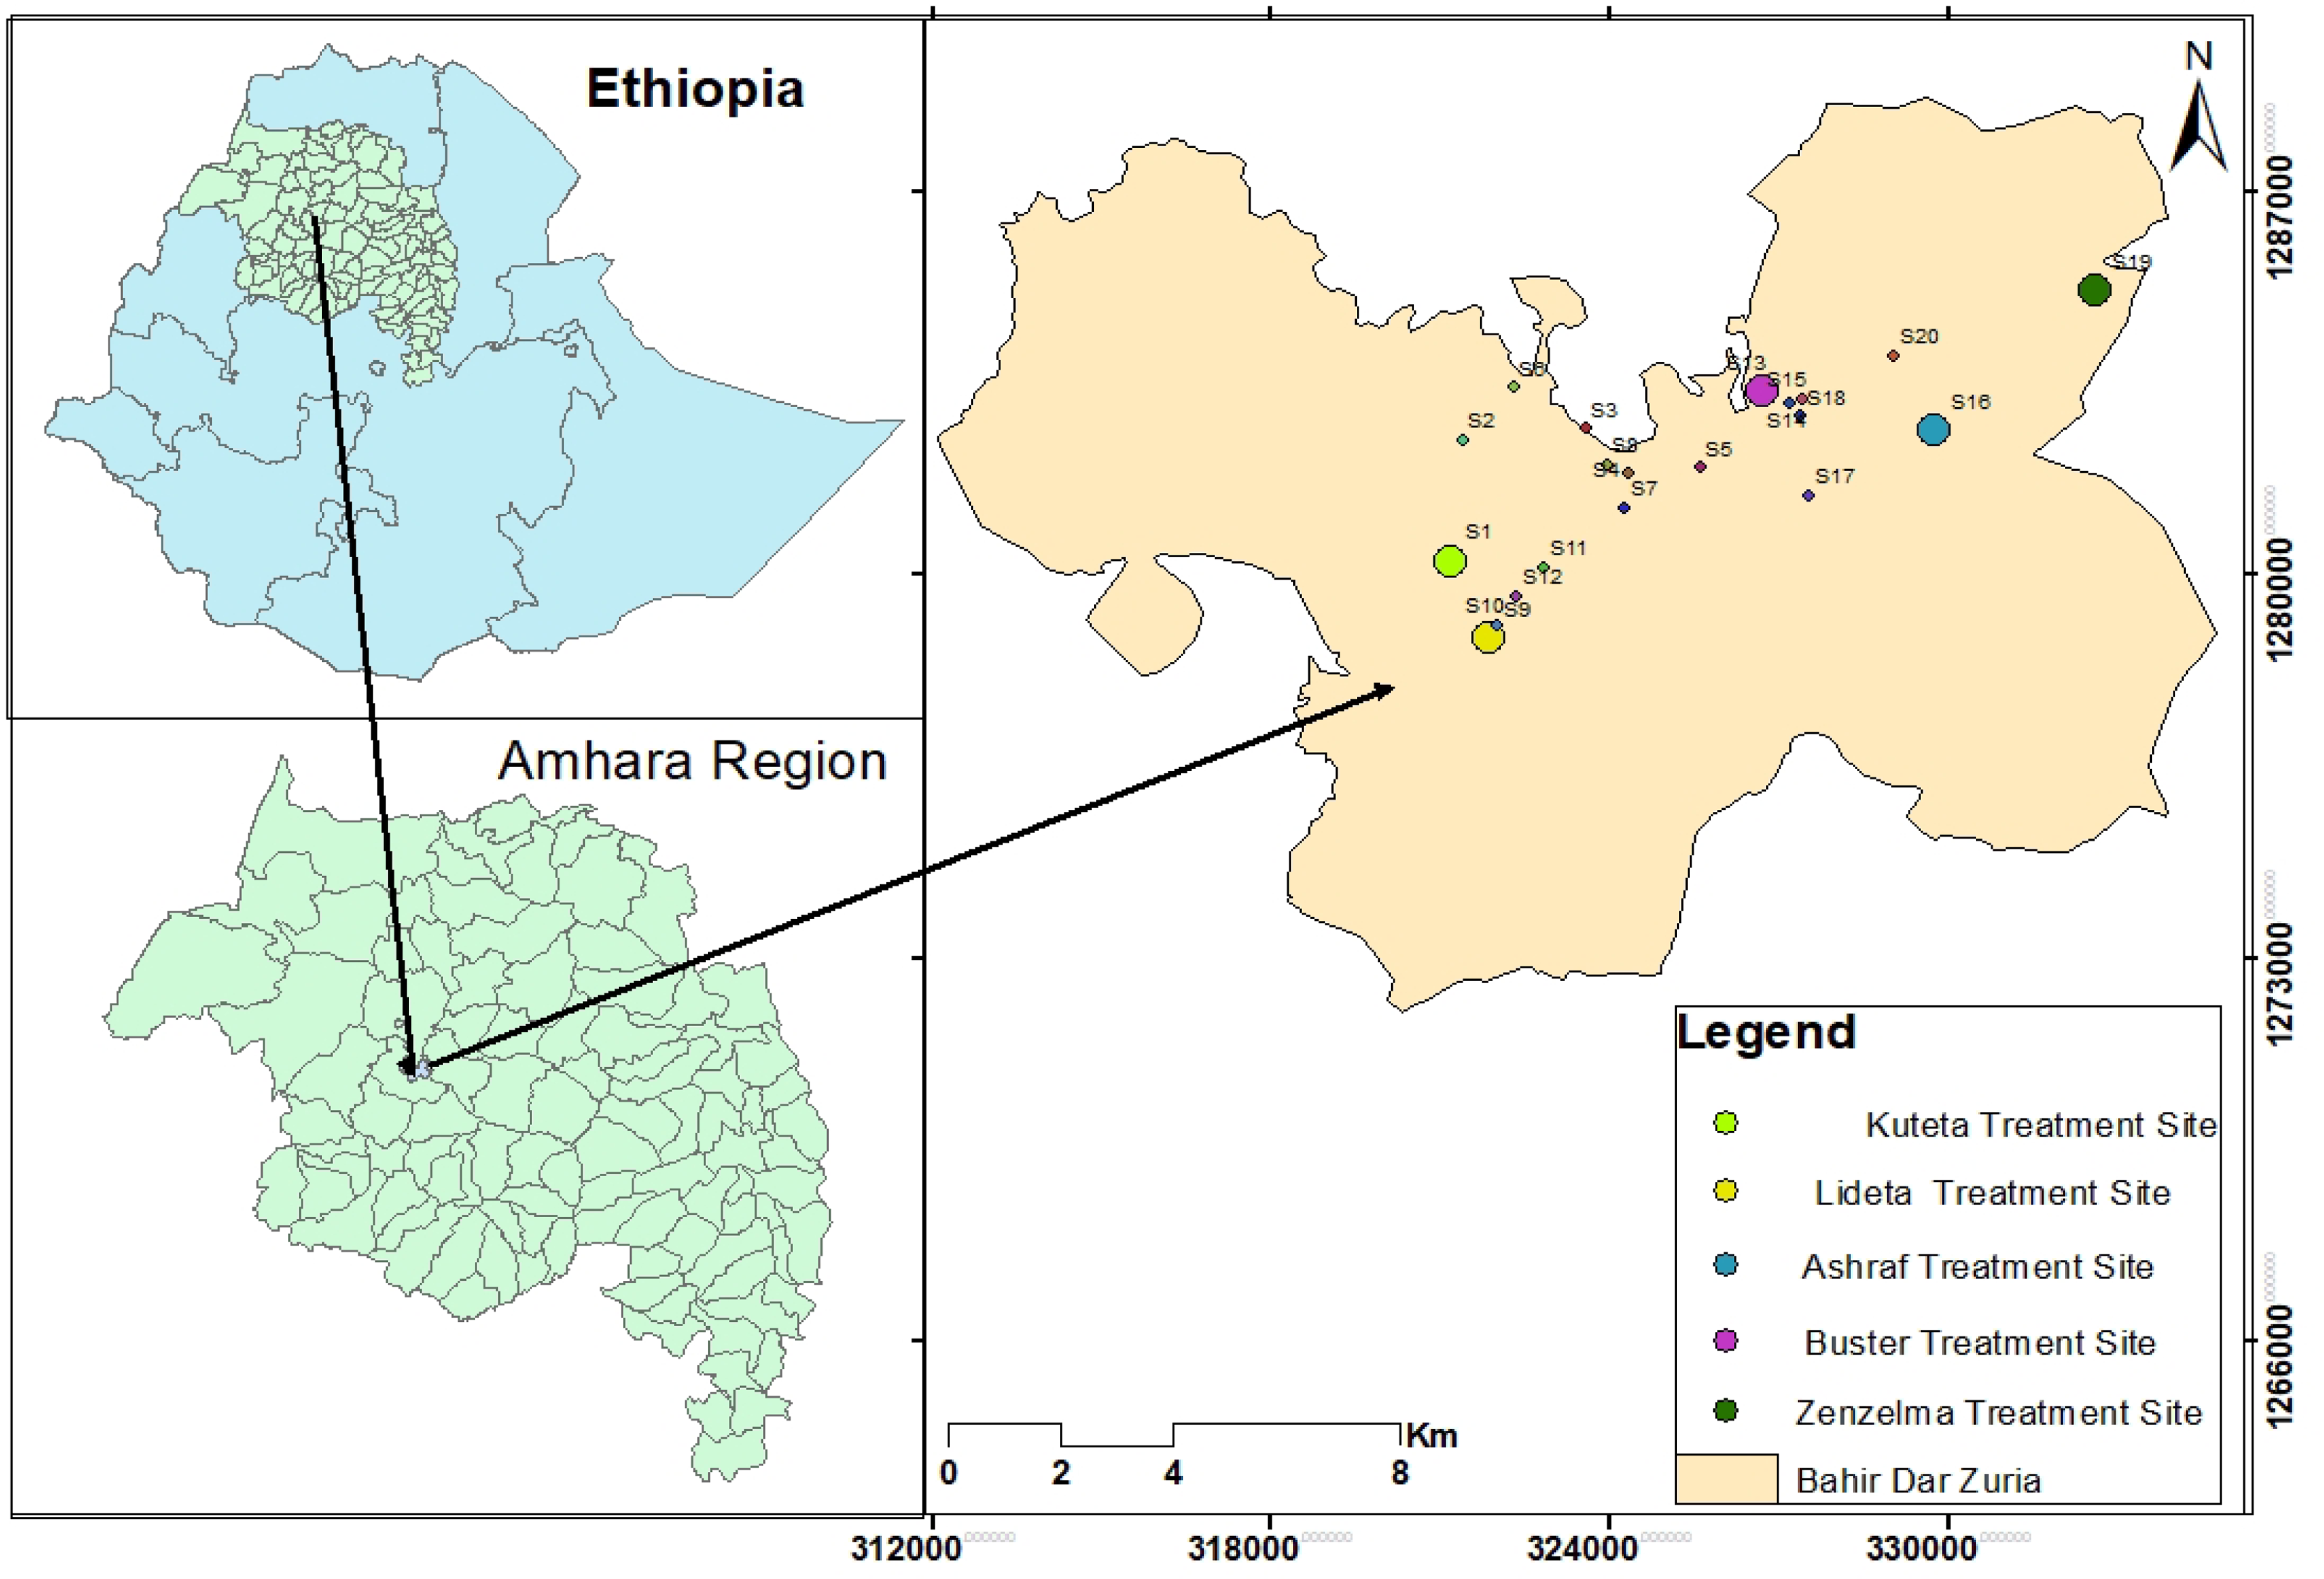
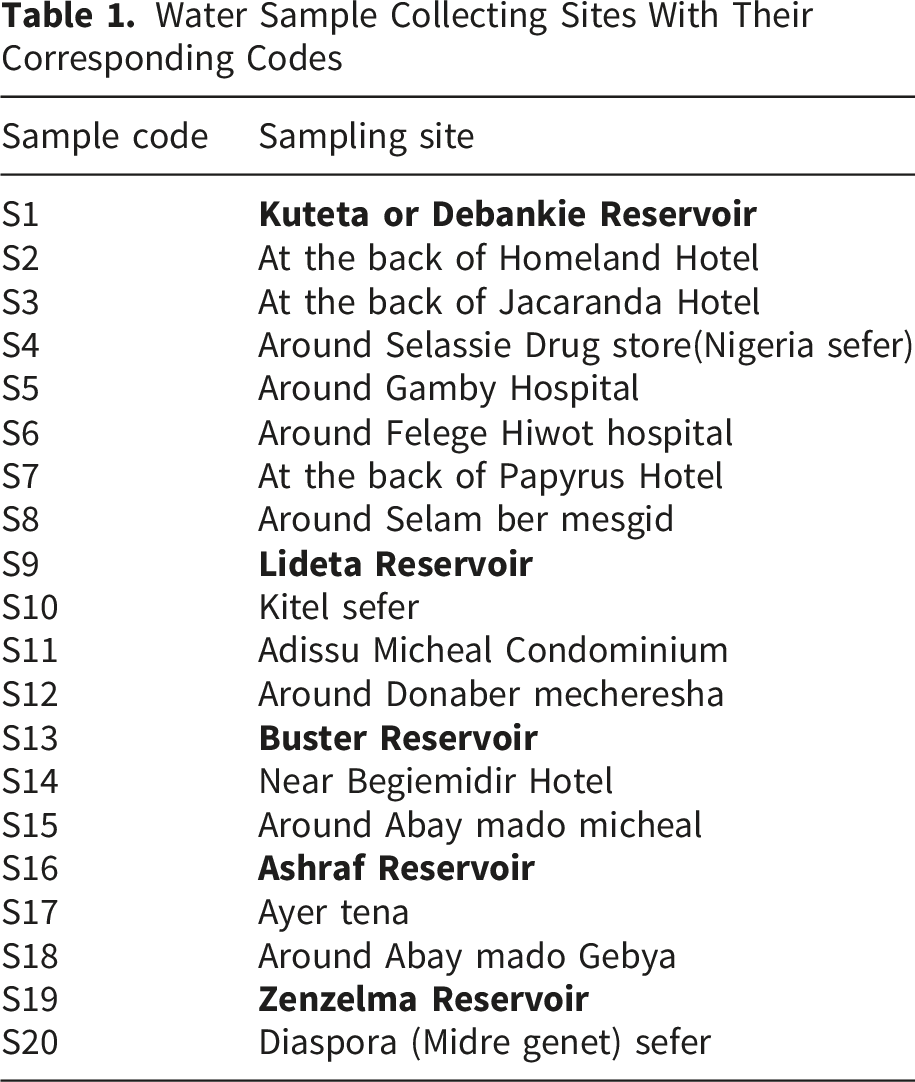
Water Sample Collection and Preservation
Water Sample Collecting Sites With Their Corresponding Codes
Water Sample Analysis
The physicochemical parameters including temperature and pH were analyzed at the sampling site using portable digital pH meter (Jenway model 370, England) after calibrating with standard buffer solutions (4, 7 and 10). The total dissolved solids (TDS) and electrical conductivity (EC) were analyzed using portable digital conductivity meter (CC-401, Poland) after calibrating it with a standard KCl solution. Turbidity of the water samples were analyzed using portable microprocessor turbidity meter (H193703 ELE international, Hungary).It was first calibrated with standards ranging from 0 to 100 NTU. Nitrate, phosphate, fluoride, sulfide and free residual chlorine were analyzed by colorimetric method using 7500 photometer following the procedures in the manual
The bacteriological analyses were done using membrane filtration (MF), incubation and colony count method. 18 One hundred milliliter of water sample for each test was filtered through sterile cellulose membrane filter with a pore size of 0.45µm to retain the indicator bacteria. The filtration apparatus was sterilized before use and re-sterilized between samples using methanol when analyzing water samples. The cellulose membrane filter was transferred from filtration apparatus to a sterilized aluminum Petri-dish containing absorbent pad soaked with membrane lauryl sulphate tryptose broth (Wagtech, England) for total coliforms (TC) and fecal coliform(FC) determination. Then after, plates for total coliform and thermo tolerant coliform counts were incubated at 37 °C and 44 °C, respectively, for 24 hours and then colonies were counted and recorded.
Determination of Water Quality Index (WQI)
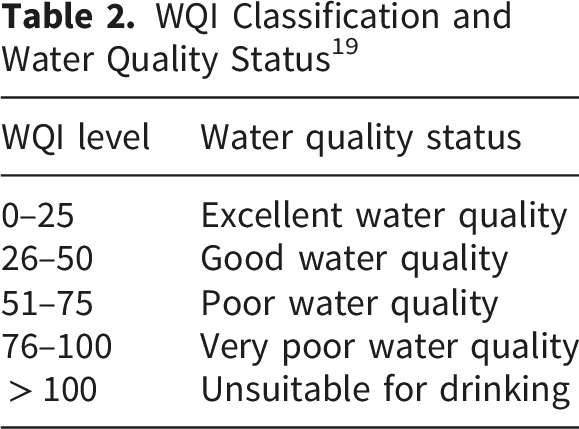
The WQI is a numerical tool used to evaluate overall water quality by combining multiple parameters into a single value. It was first introduced by Horton 19 and later developed by Brown. 20 In this study, WQI was calculated using seven parameters: pH, turbidity, EC, TDS, nitrate, fluoride, total coliform (TC), and fecal coliform (FC), based on permissible limits (Si) recommended by World Health Organization guidelines.
To calculate WQI:
Step 1. Select water quality parameters and assign the permissible standard limit (Si) from guidelines Such as WHO. In this study, WQI is based on 7 water quality parameters (pH, turbidity, EC, TDS, nitrate, Fluoride, TC, and FC counts).
Step 2
First, calculate the constant k

Step 3. Calculate Quality Rating (qi)

Step 4: Calculate Sub-Index (SIi)
Step 5: Calculate Final WQI
Data Analysis
The collected data were analyzed using the Statistical Package for the Social Sciences (SPSS) and Microsoft Excel. Descriptive statistical measures, including the mean, standard deviation, and range were used to analyze the water quality parameters at both the reservoir and household tap sampling sites during the dry and wet season. In addition, one-way analysis of variance (ANOVA) was used to assess statistically significant differences in water quality parameters among the sampling sites. Furthermore, two-way ANOVA was conducted to examine the effects of sampling site, season, and their interaction on the measured water quality parameters.
Results and Discussion
Physicochemical Water Quality at the Reservoirs and Household Taps
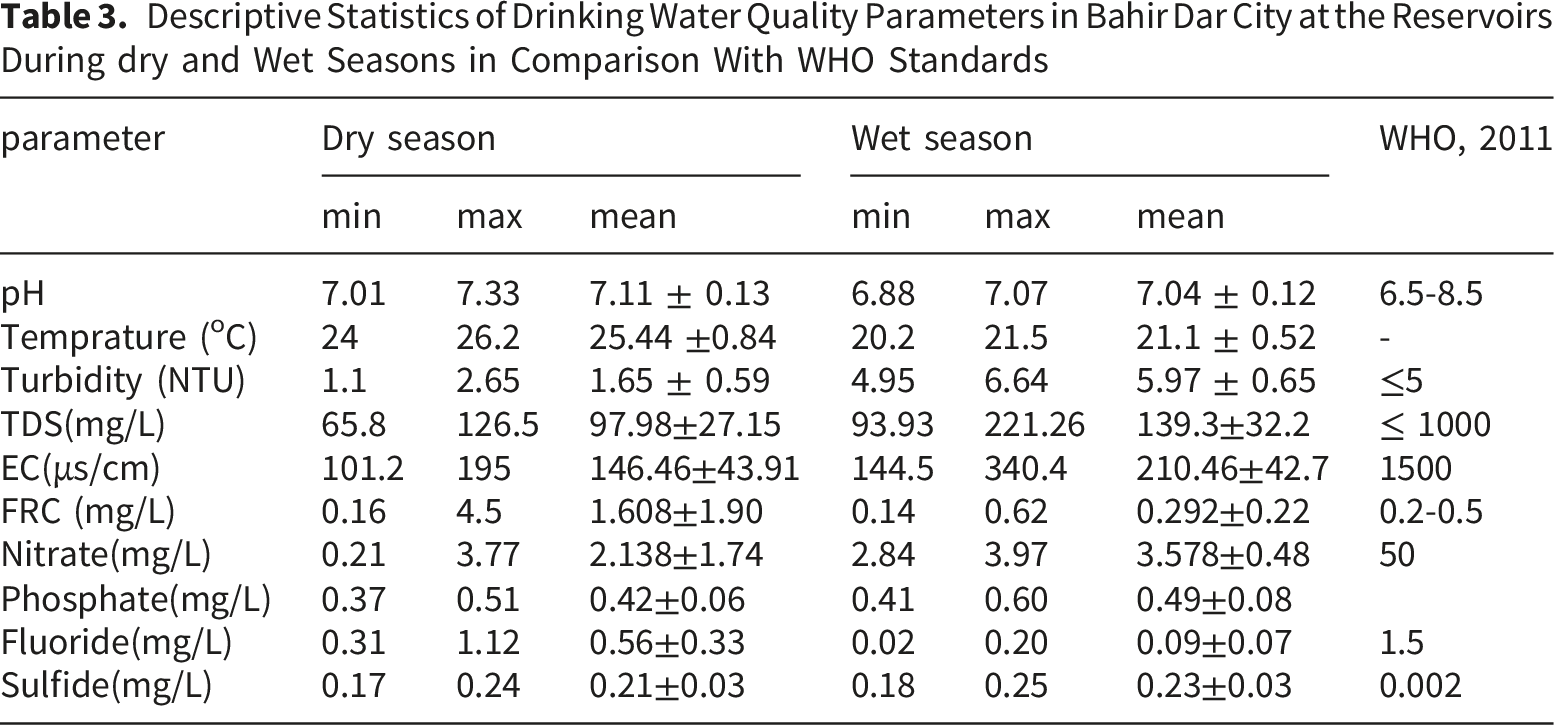
Descriptive Statistics of Drinking Water Quality Parameters in Bahir Dar City at the Reservoirs During dry and Wet Seasons in Comparison With WHO Standards
Descriptive Statistics of Drinking Water Quality Parameters in Bahir Dar City at the Household Taps During dry and Wet Seasons in Comparison With WHO Standards
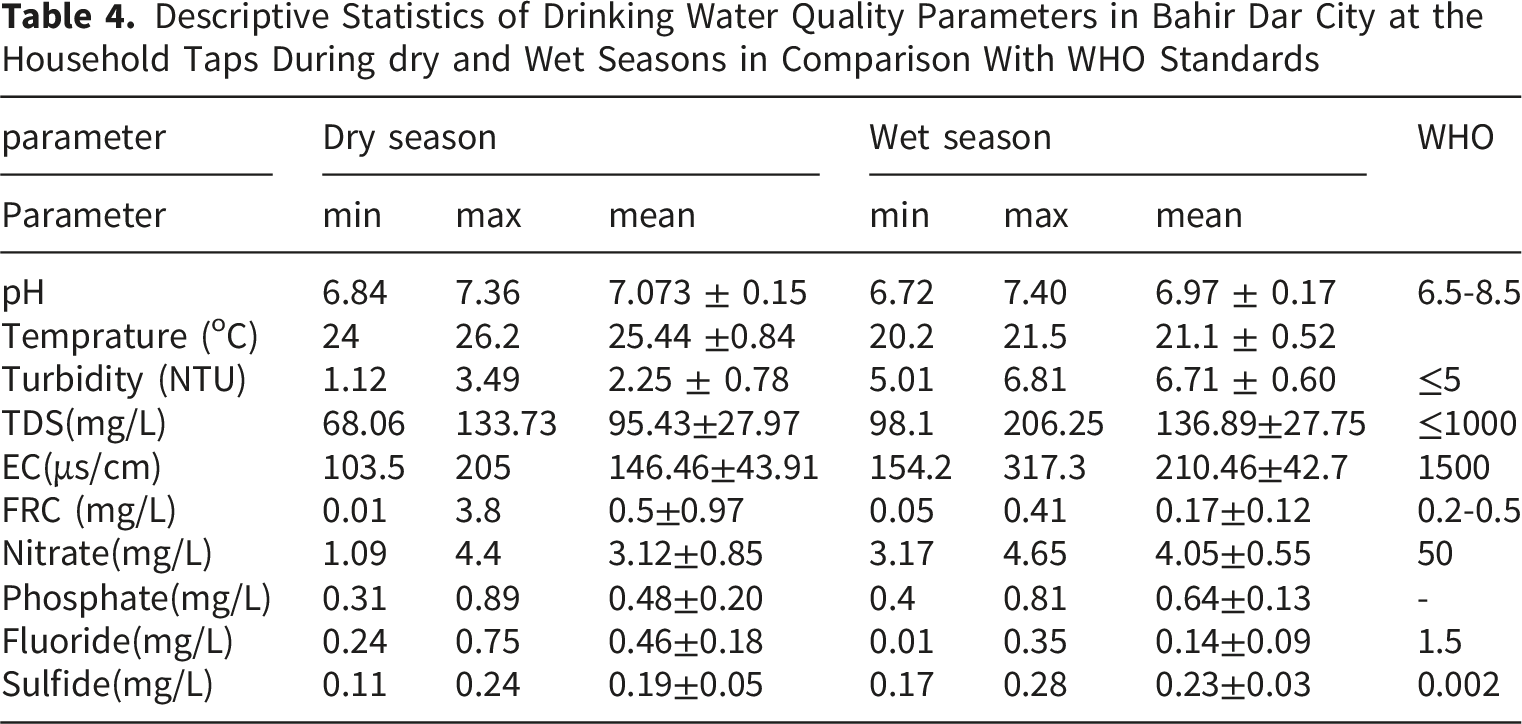
Two-Way ANOVA Results for the Effects of Location and Season on Drinking Water Quality Parameters
pH
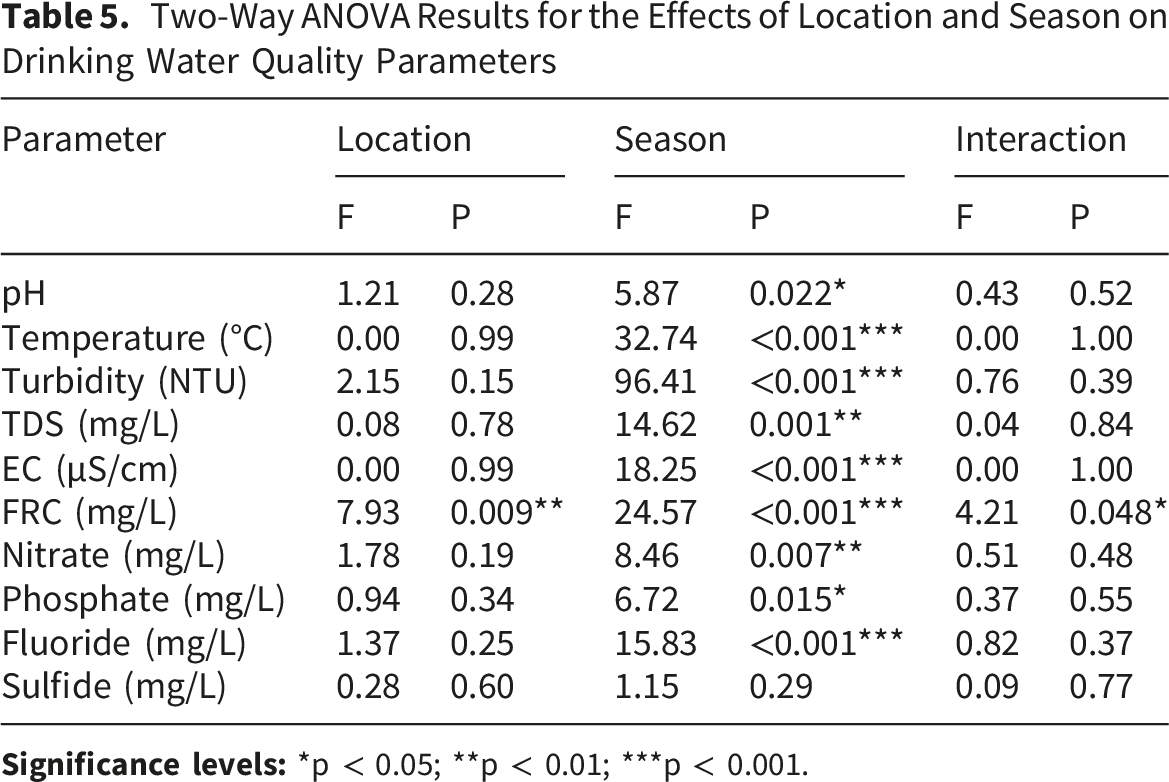
The pH values of the water samples at the reservoirs (treatment sites) during the dry season were found in the range of 7.01(S13) to 7.33(S16) with mean 7.114 ± 0.126 and during the wet season ranged from 6.88(S1) to 7.07(S9) with mean 7.038 ± 0.115. The pH of the samples during the dry season was slightly higher than that of the wet season (Figure 2a). This might be due to dilution of the water sources during Summer Season. Generally, the pH statuses of Bahir Dar City drinking water at reservoirs were found within the recommended standard limits of the WHO (6.5 to 8.5).
21
pH (a), temperature (b), turbidity (c), and TDS (d) analysis of Bahir Dar city drinking water both in the dry and wet seasons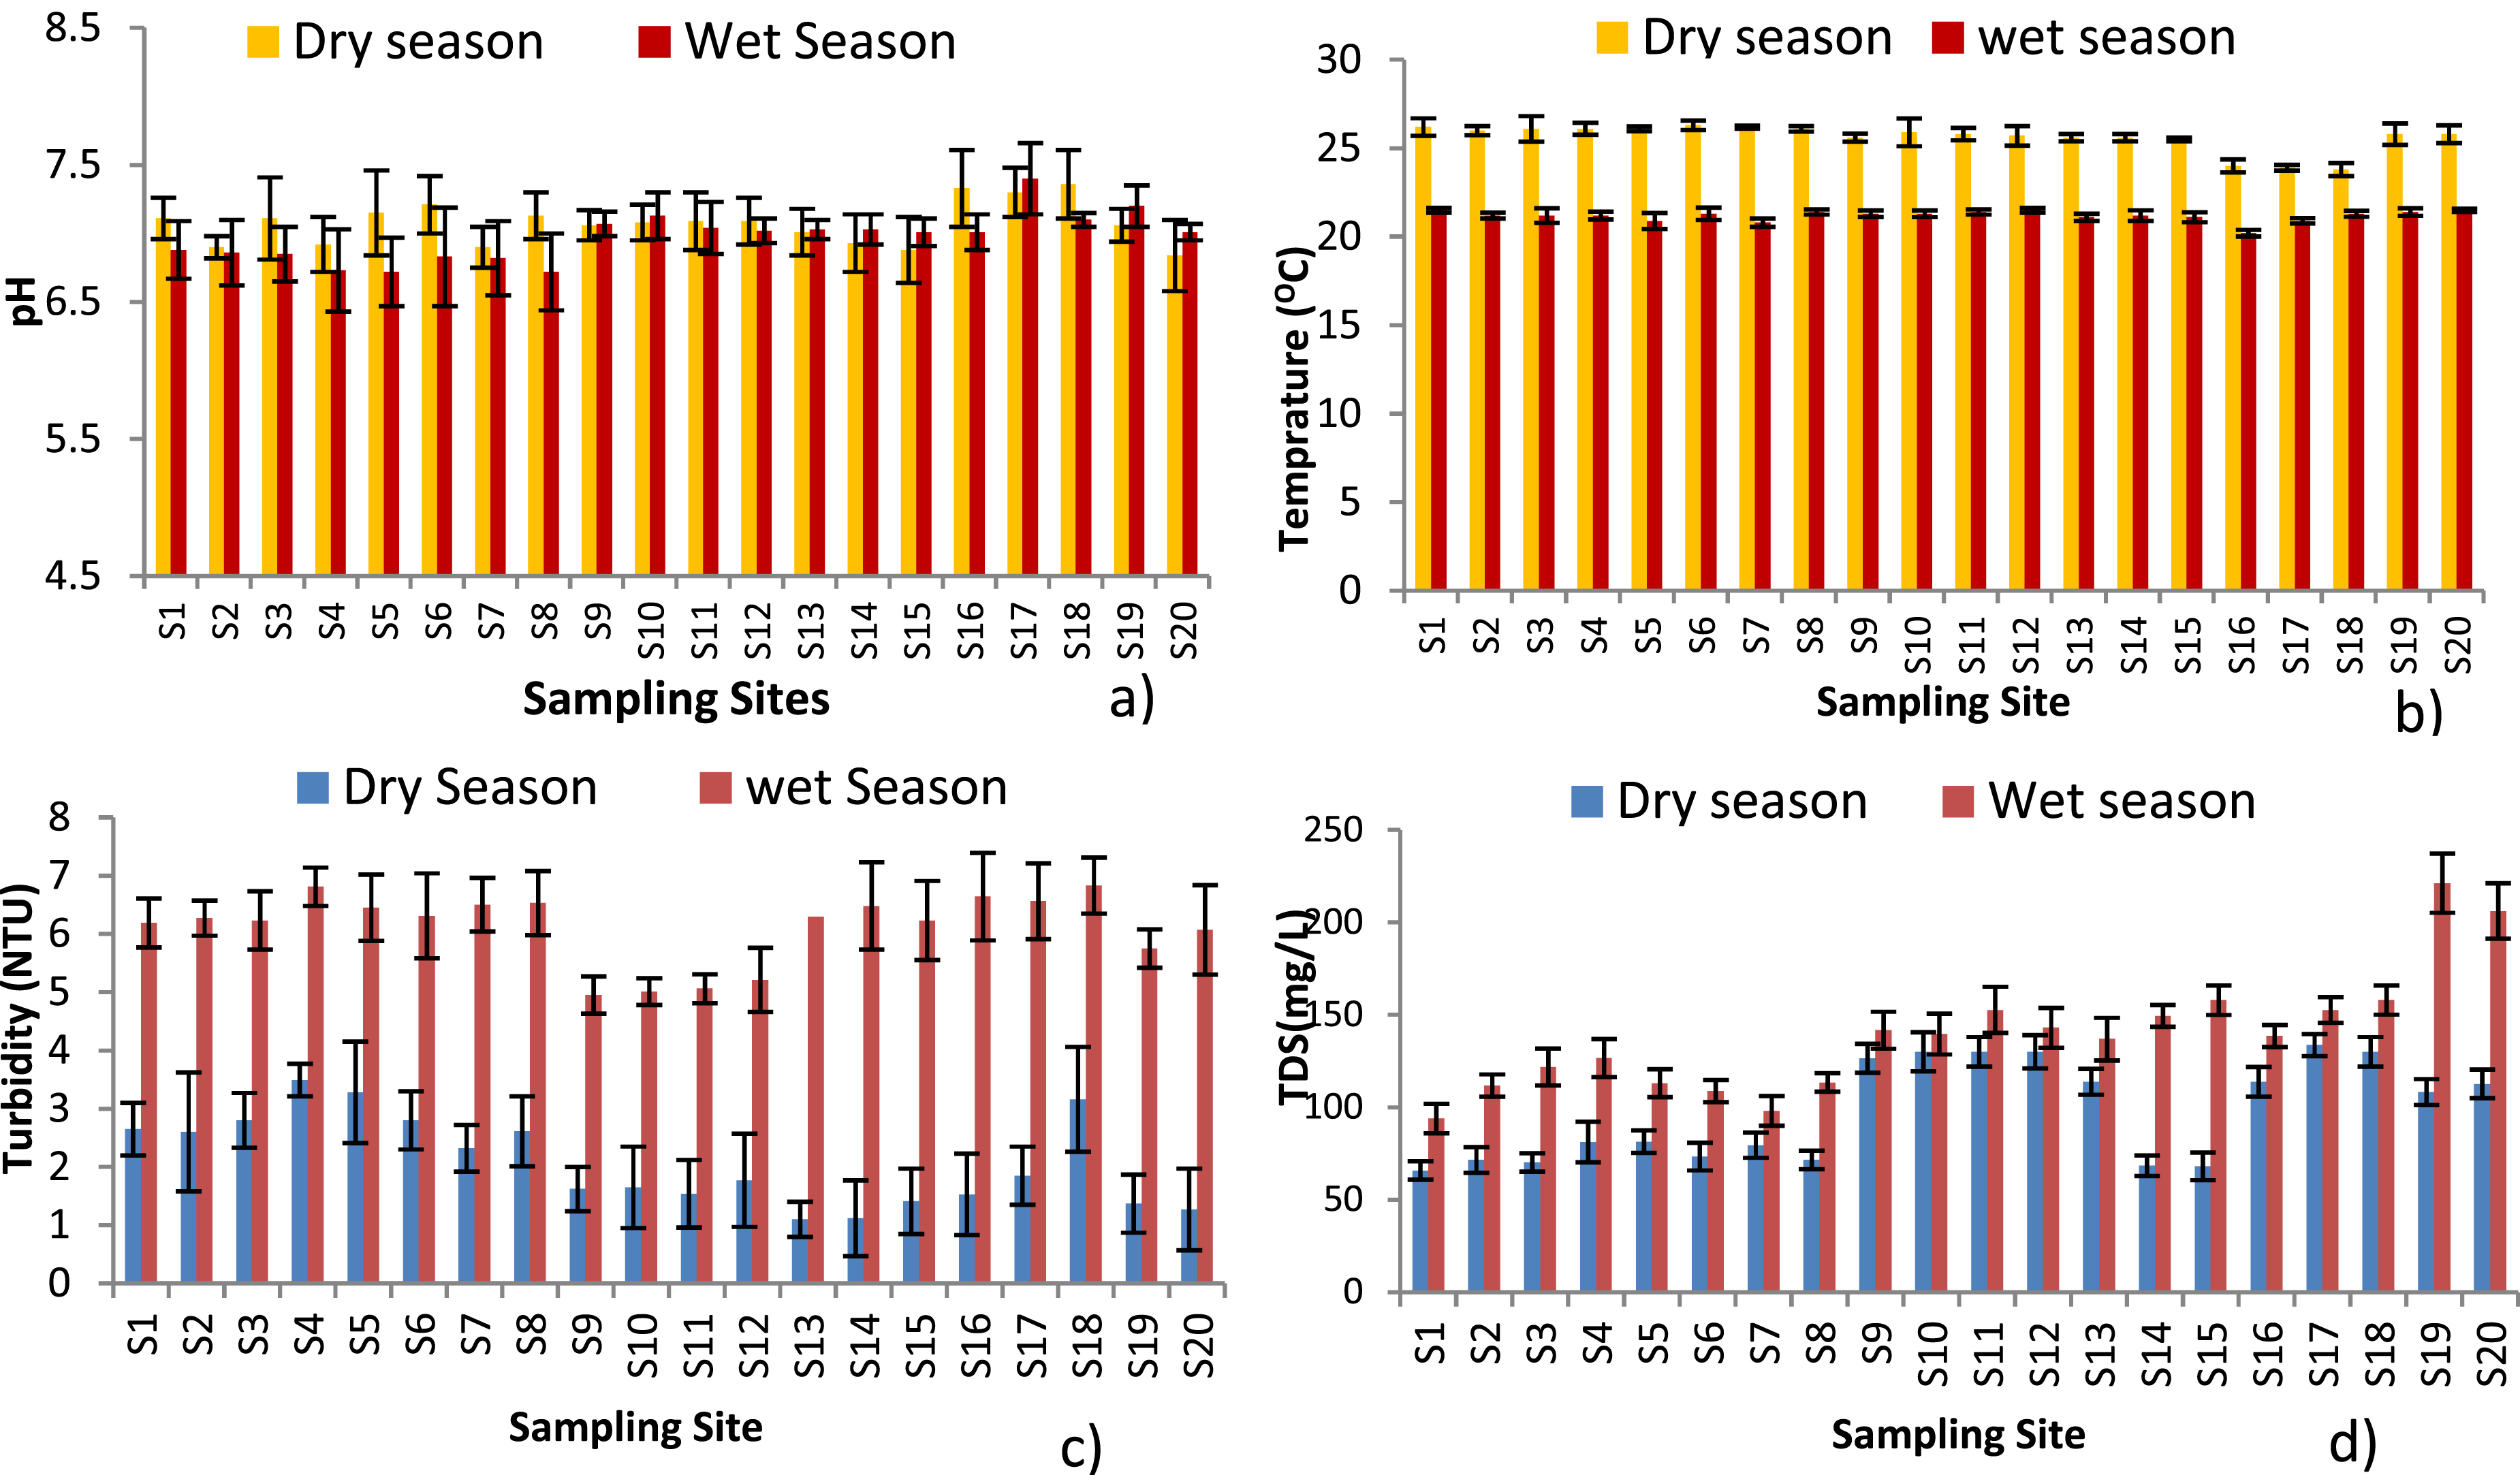
pH of tap water samples were found between 6.84 (S20) and 7.36 (S18) with mean 7.073 ± 0.151 during the dry season, where as in the wet season the pH values ranged from 6.72 (S5 & S8) and 7.40 (S17) with mean 6.973 ± 0.173. No significant differences were observed in the mean values of pH at the reservoirs (F=0.78; P=0.40 and at the household taps (F=3.01; p=0.094). All the pH values obtained at the tap in both seasons were found within the acceptable standard of WHO. The pH value of water obtained in this study was higher than the one which was found at Wondogenet campus with a pH value in the range of 6.52–6.83 22 in Ethiopia and was lower than the pH record ranging from 7.6 to 8.2 in Malda district, Eastern India. 23
Water Temperature
The temperature of water samples at the reservoir showed in the range of 24 to 26.2 oC with mean 25.44 ± 0.841 in the dry season. The highest temperature of 26.2 OC and the lowest temperature 24.0 O C were observed at S1 and S16, respectively during the dry season. The temperature in the summer season showed in the range of 20.2 to 21.5 oC with mean 21.1 ± 0.524 (Figure 2b). The water temperatures during the dry season were higher than the wet season. The reason for an increase of temperature may be due to the geo-location of the city which is characterized by high temperature during the dry season. The water temperature has no intolerable guideline; nevertheless an increase in temperature can produce a good condition for biological activities that can affect the quality of the water.
In the household tap samples the temperature ranged from 23 0C (S18) to 26.3 OC (S6) during the dry season and during the wet season it was found in the range of 20.8 (S7) to 21.5 oC (S12 and S20). One-way ANOVA revealed significant seasonal variations in the mean values of temperature (F = 101.35, p = 0.001) at the reservoirs and (F = 298.8, p <0.001)) at the household taps. Both at the reservoirs and household taps the water temperature of the dry season was higher than the wet season. This may be due to the increased atmospheric temperature during the dry season compared to the wet season. The study conducted by Meride & Ayenew 22 in Wondo Genet Campus showed a mean temperature of all water samples 28.49 oC and a study conducted by Alqarawy 24 in Saudi Arabia reported water temperature in the range of 24 to 32 oC. In tropics, the climate is characterized by high temperature and rainfall, and these factors might have contributed to the high temperature records of water.
Turbidity
The turbidity of water at the reservoirs in the dry season showed in the range of 1.1 to 2.65 NTU with mean 1.654 ± 0.591 and in the summer season in the range of 4.95 to 6.64 NTU with mean 5.966 ± 0.65(Figure 2c). During the dry season, the turbidity values of water samples were compliant with the WHO standard. Whereas in the wet season, the turbidity values of the water samples were above the WHO guideline limit (5 NTU). 21
Additionally, the turbidity measurements of the tap water samples were recorded between 1.12 NTU (S14) and 3.49 NTU (S4) during the dry season where both the 15 tap samples had a lower turbidity value than the WHO standard. During the wet season these values were found between 5.01 NTU (S10) and 6.83 NTU (S18) in which almost all the house-hold tap samples turbidity values exceeded the WHO maximum permissible limit.
Statistically, one-way ANOVA indicated that the mean values of turbidity levels differed significantly at the reservoirs ((F = 127.68, p < 0.001) and household taps (F = 291.7, p < 0.001) both in the dry and wet seasons.
The turbidity values of this study were higher than the turbidity value of Akaki Kaliti sub city of Addis Ababa (0.1-5.0 NTU). 25 The turbidity values during the wet season were higher than the dry season. This might be due to high run off and flood produced in the wet rainy season that could be mixed with the springs and wells raised the turbidity of water sources of the city.
Total Dissolved Solids (TDS)
The measurements of TDS at the reservoirs were found in the range of 65.8 to 126.5 mg/) during the dry season. While the TDS in the wet season found in the range of 93.93 to 221.26 mg/L as shown in Figure 2d below.The TDS in the household taps was found in the range of 68.37 to 133.73mg/L during the dry season. In the wet season, the TDS ranged between 98.1 to 206 mg/L as shown in Figure 2D. When the TDS values of the house hold taps were compared with that of the reservoir site, 80% and 86.6% of the house hold tap samples were having higher TDS values than their reservoir site during the dry and wet seasons respectively
One-way ANOVA revealed no significant seasonal differences in the mean TDS levels at the reservoirs (F = 5.11, p = 0.054). However, mean TDS levels at the household taps differed significantly between the dry and wet seasons (F = 16.7, p < 0.001). The TDS values at the reservoirs and the household taps both during the dry and wet seasons were below the WHO standard (500gm/L). 5
The TDS in Hawassa drinking water (Ethiopia) reported a mean value 67.30 ±32.77 mg/L at the reservoir and 170.17 ± 42.95 mg/L at the household taps. 24 This shows a similar pattern with the dry season of our study. A study in drinking water quality in five wells in Sebha city, Libya indicated TDS in the range of 1400 to 3704 mg/L (mean 2291.2 ±890.4), 26 which is much higher than this study.
Electrical Conductivity (EC)
The EC values of Bahir Dar city drinking water at reservoir varied from 101.2 µs/cm (S1) to 195 µs/cm (S9) with mean 162.54 ±35.86 during the dry season and 144.5 µs/cm (S1) to 340.4µs/cm (S19) with mean 225.7 ± 70.98 in the wet season (Figure 3a). At the household taps, EC values ranged from 103.5 to 205.0 µS/cm (mean = 146.46 ± 43.91 µS/cm) during the dry season and from 154.21 to 317.3 µS/cm (mean = 210.46 ± 42.70 µS/cm) during the wet season. EC (A), FRC (B), NO3- (C), and PO43- (D) analysis of Bahir Dar city drinking water both in the dry and wet seasons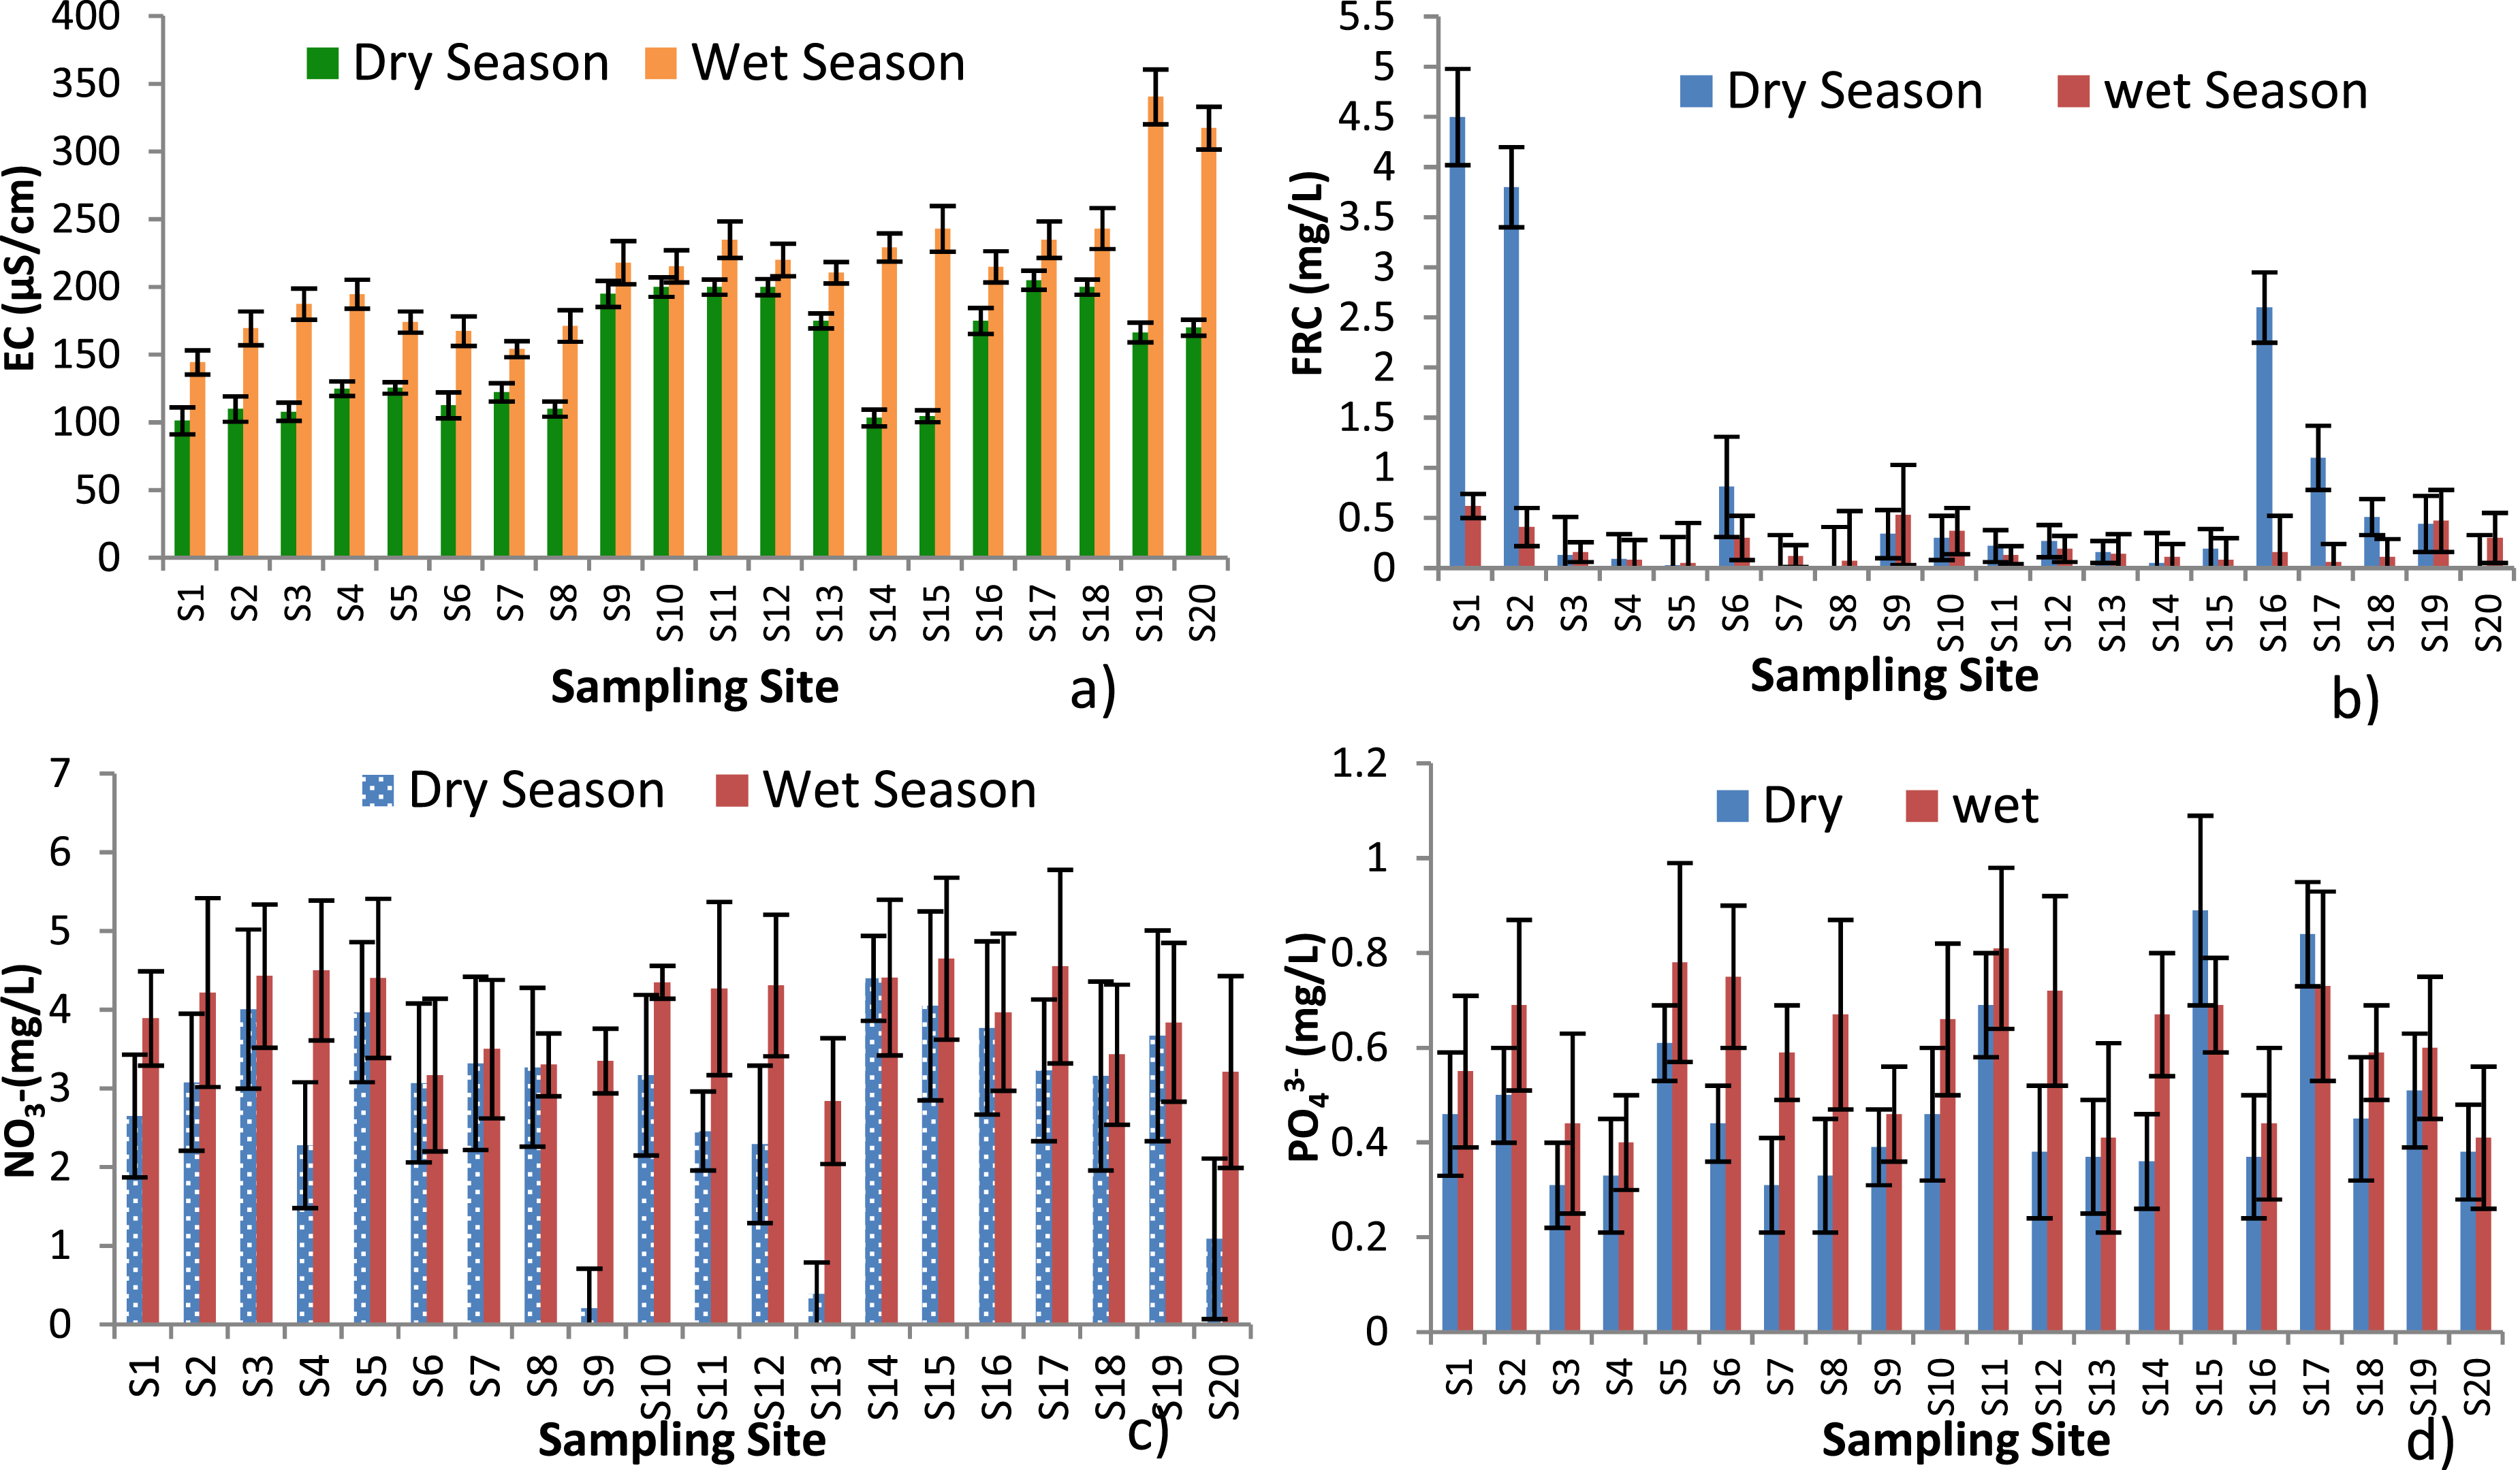
One way-ANNOVA revealed significant seasonal variations in the mean values of EC at the reservoirs (F = 5.49, p = 0.047) and household taps (F = 16.3, p < 0.001) during the dry and wet seasons. The Mean EC values at the sampling sites during the dry and wet seasons were below the WHO standard, which has a maximum limit of 1000 µs/cm. The Hawassa drinking water source at the reservoir found in the range of 35 to 115μS/cm, which was lower than this study and at the household taps EC of water samples found in the range of 166 to 388μS/cm, which was higher than this study. 27 The EC in the drinking water of the distribution network of the city of Azogues, Republic of Ecuador reported in the range of 91.75 to 117.71 μs/cm. 26 The EC in the drinking water of Malda district (India) obtained from ground water reported in the range of 159 to 6880 μs/cm (mean 1210.80 ±964.84). 23
Free Residual Chlorine (FRC)
The FRC values in at the reservoir sites were found in the range of 0.16 to 4.5 mg/L during the dry season as shown in Figure 3b. 80% of the reservoirs (except buster) fulfilled the WHO standard of 0.2 mg/L to 0.5 mg/L. 5 Whereas, EC values found in the range of 0.14 to 0.62 mg/L during the wet season. In this season, 40% of the disinfected samples were below the WHO standard limit. In comparison, the free residual chlorine values that were recorded during the dry season at the reservoir sites were better than the wet.
The FRC concentration in the tap water samples was found in the range of 0.01to 3.80 mg/L during the dry season. In the household tap water samples 26.6%, 20% and 53.3% of the samples were found above, compliant with and below the WHO minimum and maximum free residual chlorine drinking water standards 0.2 to 0.5 mg/L, 5 respectively. During the wet season the value of the FRC at taps were in the range 0.05 to 0.41mg/L in which 73.3% of the tap water samples were below the recommended limits of WHO standard. Statistically, no significant differences were observed in the mean value of FRC at the reservoirs (F = 2.38, P = 0.162) and household taps (F = 1.72, P = 0.200) during the dry and wet seasons. The FRC was going on decreasing from disinfection point to house hold taps both in the dry and wet season. Generally, the FRC of the water both at the reservoir sites and taps during the wet season was lower than the dry season which would be due to an increase in turbidity in the wet season.
In comparison,the mean free residual chlorine of the water samples at disinfection point and house hold taps during the dry season were1.6 mg/L and 0.5 mg/L which were above and compliant with the WHO maximum permissible limit respectively and these values were slightly higher in case of disinfection point and lower in case of house hold taps compared with the result obtained at Ziway town in Ethiopia (0.79 mg/L) 28 whereas the mean FRC at disinfection point and house hold taps during the wet season were found to be o.38 mg/L and 0.17 mg/L, respectively, which were below the WHO maximum permissible limit and also the result obtained at Ziway town. A study conducted in the West Bank of Palestine reported that the free residual chlorine levels in tap water ranged from 0 to 1.39 mg/L, with an average of 0.452 mg/L. 29 Similarly, in certain urban regions of Lahore, Pakistan, residual chlorine levels in drinking water were observed between 0.08 and 0.73 mg/L, with a mean value of 0.41 mg/L. 30
Nitrate (NO3-)
The nitrate concentrations at the reservoir sites were found between 0.21 and 3.77 mg/L during the dry season, where as in the wet season the nitrate concentrations were found between 2.84 and 3.97 mg/L. In both seasons the levels of nitrates were below the maximum recommended limits of WHO, 31 which is 50 mg/L (Figure 3c).
The concentration of nitrates at household taps ranged between 1.09 to 4.40 mg/L during the dry season while the concentration of nitrates ranged to 3.21 to 4.65 mg/L during the wet season. This indicates that the concentrations of nitrates in both seasons at the household taps were far below the acceptable limit set by, 5 i.e. 50 mg/L.
One-way ANOVA indicated that there was no statistically significant difference in mean nitrate concentrations among the reservoir samples (F = 4.09, p = 0.078), whereas a statistically significant difference was observed among the household tap samples (F = 12.40, p = 0.001).
The nitrate concentrations measured in the tap water samples were within the range of average values (0.3–7.0 mg/L) previously reported for Ziway Town, indicating a similar level of nitrate contamination. 28 The seasonal comparison of nitrate concentration both at the reservoir site and household taps during the wet season was higher than the dry season, this might be due the entrance of more nitrate to the water distribution system through high run off and flooding in the case of the over use of nitrate fertilizer. A study conducted by 32 on drinking water quality in disaster-affected regions of Khyber Pakhtunkhwa, Pakistan, assessed nitrate (NO3-) concentrations across Government, Non-Government, and Self-Based water supply schemes. The nitrate levels ranged from 12.20 to 51.5 mg/L (average 25.9 mg/L) in Government schemes, 7.20 to 55.6 mg/L (average 29.7 mg/L) in Non-Government schemes, and 9.30 to 58.1 mg/L (average 31.2 mg/L) in Self-Based schemes.
Phosphate (PO43-)
The concentration of phosphate ranged between 0.37 mg/L at (S13 and S16) to 0.51 mg/L at S19 reservoir were analyzed during the dry season whereas in the wet season the values were ranged between 0.41mg/L at S13 and 0.60 mg/L at S19 reservoirs (Figure 3d). The phosphate level of the tap water samples were within the interval of 0.31 mg/L(S3) and 0.89 mg/L (S15) during the dry season whereas in the wet season these values were found between 0.40 mg/L (S4) and 0.81 mg/L (at S11). No significant seasonal difference in mean PO43- concentration was observed at the reservoirs (F = 2.46, p = 0.155), whereas a significant difference was detected at the household taps (F = 7.60, p = 0.010).
Comparatively the phosphate concentration of both the treatment site and the house hold taps recorded during the wet season was higher than that of the dry season and 80% of the tap water samples during the wet season showed a higher phosphate value compared with that of their treated water source that indicates the existence of phosphate contamination in the distribution pipeline system due to high run off that was occurred during the wet rainy season.
A study carried out in Kachisi town, West Shewa, Ethiopia, found phosphate concentrations in reservoir and household tap water to range between 0.12 and 0.76 mg/L. 33 In contrast, Fadiran 34 reported that the mean phosphate levels in drinking water obtained from groundwater in Swaziland, sampled at both reservoirs and household taps, ranged from 0.08 to 0.09 mg/L.
Fluoride (F-)
As shown in Figure 4a, fluoride concentrations at the reservoir sites ranged from 0.31 mg/L (S19) to 1.12 mg/L (S1) during the dry season, while during the wet season, the fluoride levels at the reservoirs (treatment sites) were found to range from 0.02 mg/L (S1) to 0.20 mg/L (S9). At the household taps in the dry season, the fluoride concentrations found in the range of 0.17mg/L (S20) to 0.75 mg/L (S17). While fluoride concentrations at taps during the wet season ranged between 0.01 mg/L (S2) to 0.35 mg/L (S7). One-way ANOVA revealed significant difference in the mean concentration of fluoride at the reservoirs (F = 9.56, p = 0.015), and household taps (F = 38.9, p< 0.001) during the dry and wet seasons. F- (a), and S2-(b) analysis of Bahir Dar City drinking water from the source to the household taps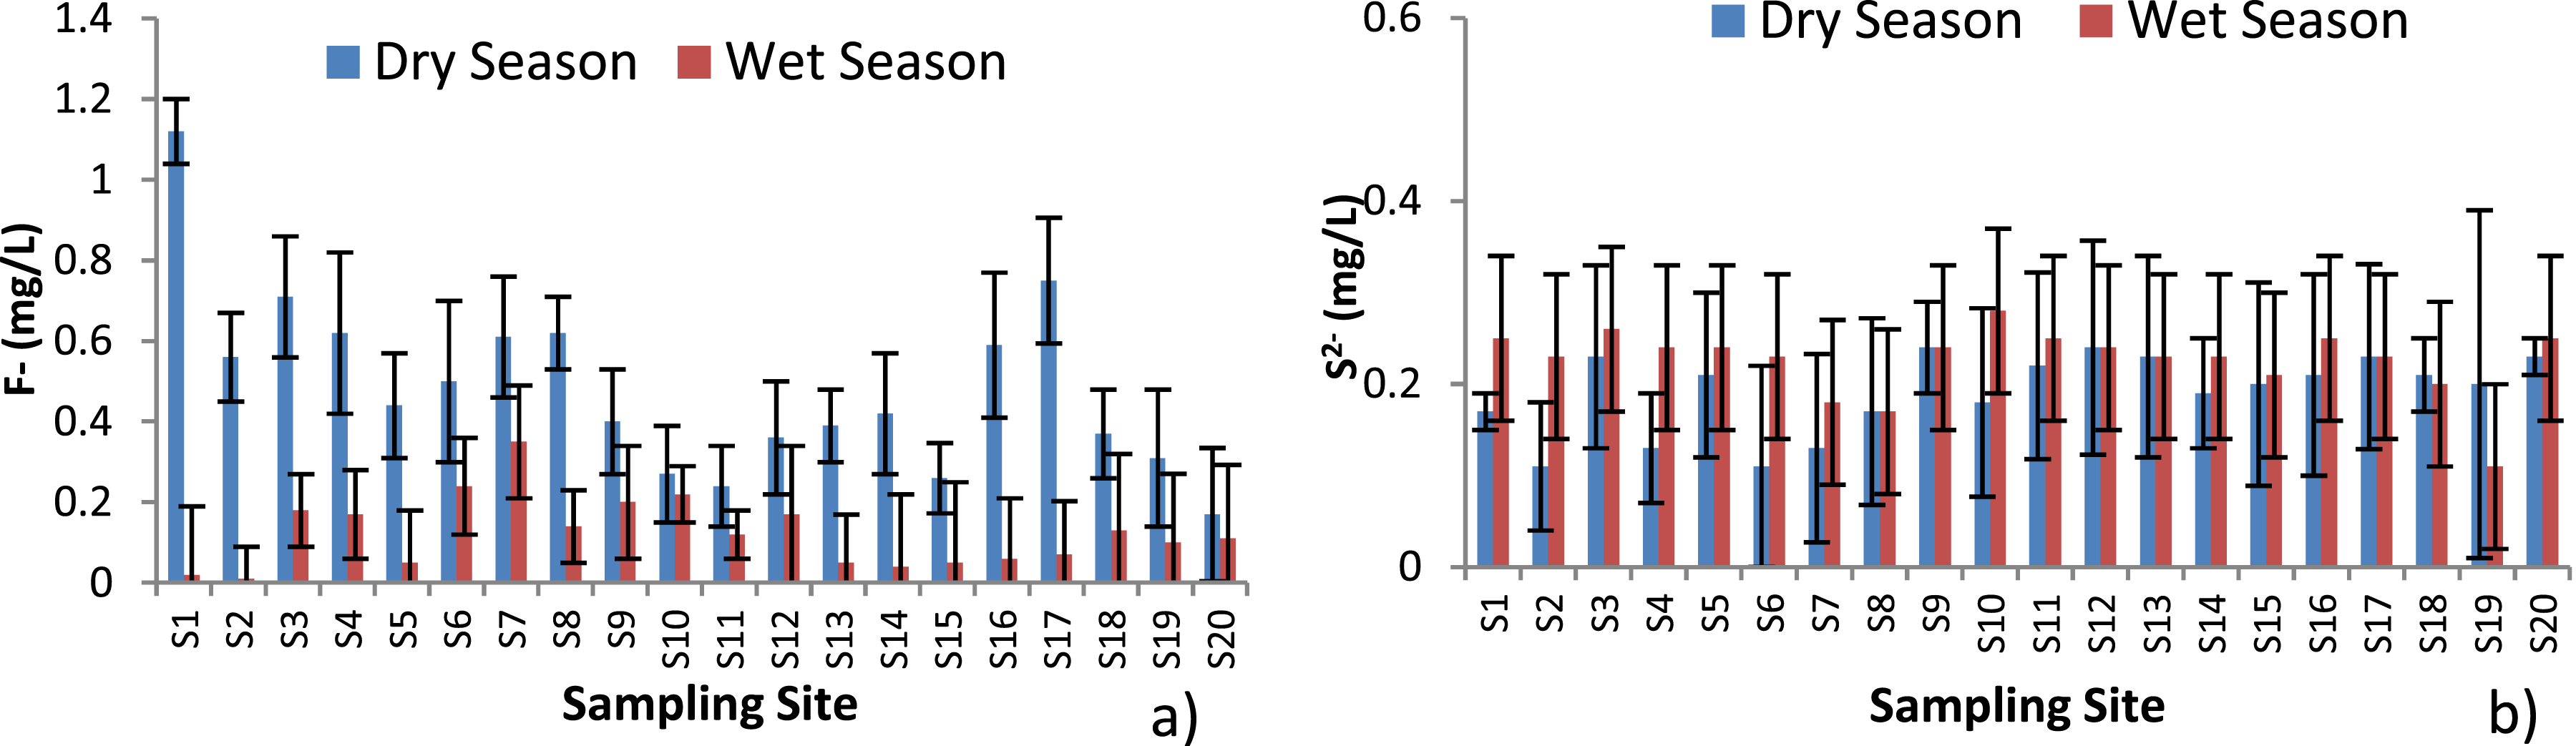
The F- concentrations at the treatment sites and household taps were less during the wet season than the dry due to the highest dilution occurred in case of rain in the wet season (Figure 4A. In general, the analyzed samples in both seasons were below the maximum permissible limit set by WHO (1.5 mg/L). 5 The fluorides result of the current study were lower than the fluoride contents reported by 32 that was found in Awash Fentalie (0.9 mg/L-2.6 mg/L). This means the supplied water to the city of Bahir Dar has no health risk to the consumers.
A study conducted in Hawassa City, Ethiopia, reported mean fluoride concentrations of 1.30 mg/L at the reservoir and 1.04 mg/L at household taps. 24 In comparison, fluoride levels in tap water from two communities in Mexico ranged from 0.01 to 0.88 mg/L, with a mean of 0.20 ± 0.17 mg/L. 35
Sulfide (S-2)
The sulfide concentration at the reservoir sites ranged from 0.17 mg/L (S1) to 0.24 mg/L (S9) during the dry season and from 0.18 mg/L (S19) to 0.25 mg/L (S1 and S16) during the wet season (Figure 4b). At the household taps, sulfide concentrations varied between 0.11 mg/L (S2) and 0.24 mg/L (S12) in the dry season, while in the wet season it ranged from 0.17 mg/L (S8) to 0.28 mg/L (S10). One-way ANOVA revealed no statistically significant difference in the mean sulfide concentration at the reservoirs during the dry and wet seasons (F = 1.11, p = 0.323). In contrast, a statistically significant seasonal variation in sulfide concentration was observed at the household taps (F = 6.80, p = 0.014).
The sulfide concentrations recorded at both the reservoir sites and household taps exceeded the World Health Organization (WHO) maximum permissible limit of 0.002 mg/L. 5 The elevated sulfide levels observed in the reservoirs may be attributed to pollution of the city’s water sources. The elevated sulfide concentrations observed in the distribution system may originate from contamination at the source and from leakage in water distribution pipes that allows the intrusion of sewage. High sulfide levels at household taps can negatively affect the aesthetic quality of drinking water by imparting an unpleasant taste and odor, thereby reducing its acceptability to consumers. Furthermore, prolonged consumption of water containing excessive sulfide may pose potential health risks to consumers.
The sulfide concentrations observed in the present study were considerably higher than those reported by Hailu in Addis Ababa, 36 where sulfide levels during the dry season were 0.000 mg/L at the treatment site and 0.002 mg/L at household taps. Similarly, during the wet season, sulfide concentrations were reported as 0.001 mg/L at the treatment site and 0.003 mg/L at household taps. These findings indicate that sulfide contamination in the present study area was substantially greater than that documented in Addis Ababa.
According to two-way ANOVA (Table 5), revealed that season had a significant effect on temperature (F =208.6, p < 0.001), turbidity (F = 191.3, p < 0.001), TDS (F = 14.8, p < 0.01), EC (F = 20.6,p < 0.001), free residual chlorine (F = 8.74, p < 0.01), nitrate (F = 7.95, p < 0.05),phosphate (F = 5.48, p < 0.05), and fluoride (F = 16.3, p < 0.01). However, the main effects of sampling location and the interaction effect between sampling location and season were not statistically significant for any of the measured water quality parameters (p > 0.05), with the exception of free residual chlorine (FRC), indicating that seasonal variation was the primary factor influencing water quality in the study area.
Bacteriological Water Quality Analysis at Reservoirs and Household Taps
Bacteriological water quality analyses for total coliforms and fecal coliforms of Bahir Dar city drinking water in the dry and wet seasons are shown in Figure 5 below. TC (a) and FC (b) levels in Bahir Dar City drinking water samples in the dry and wet season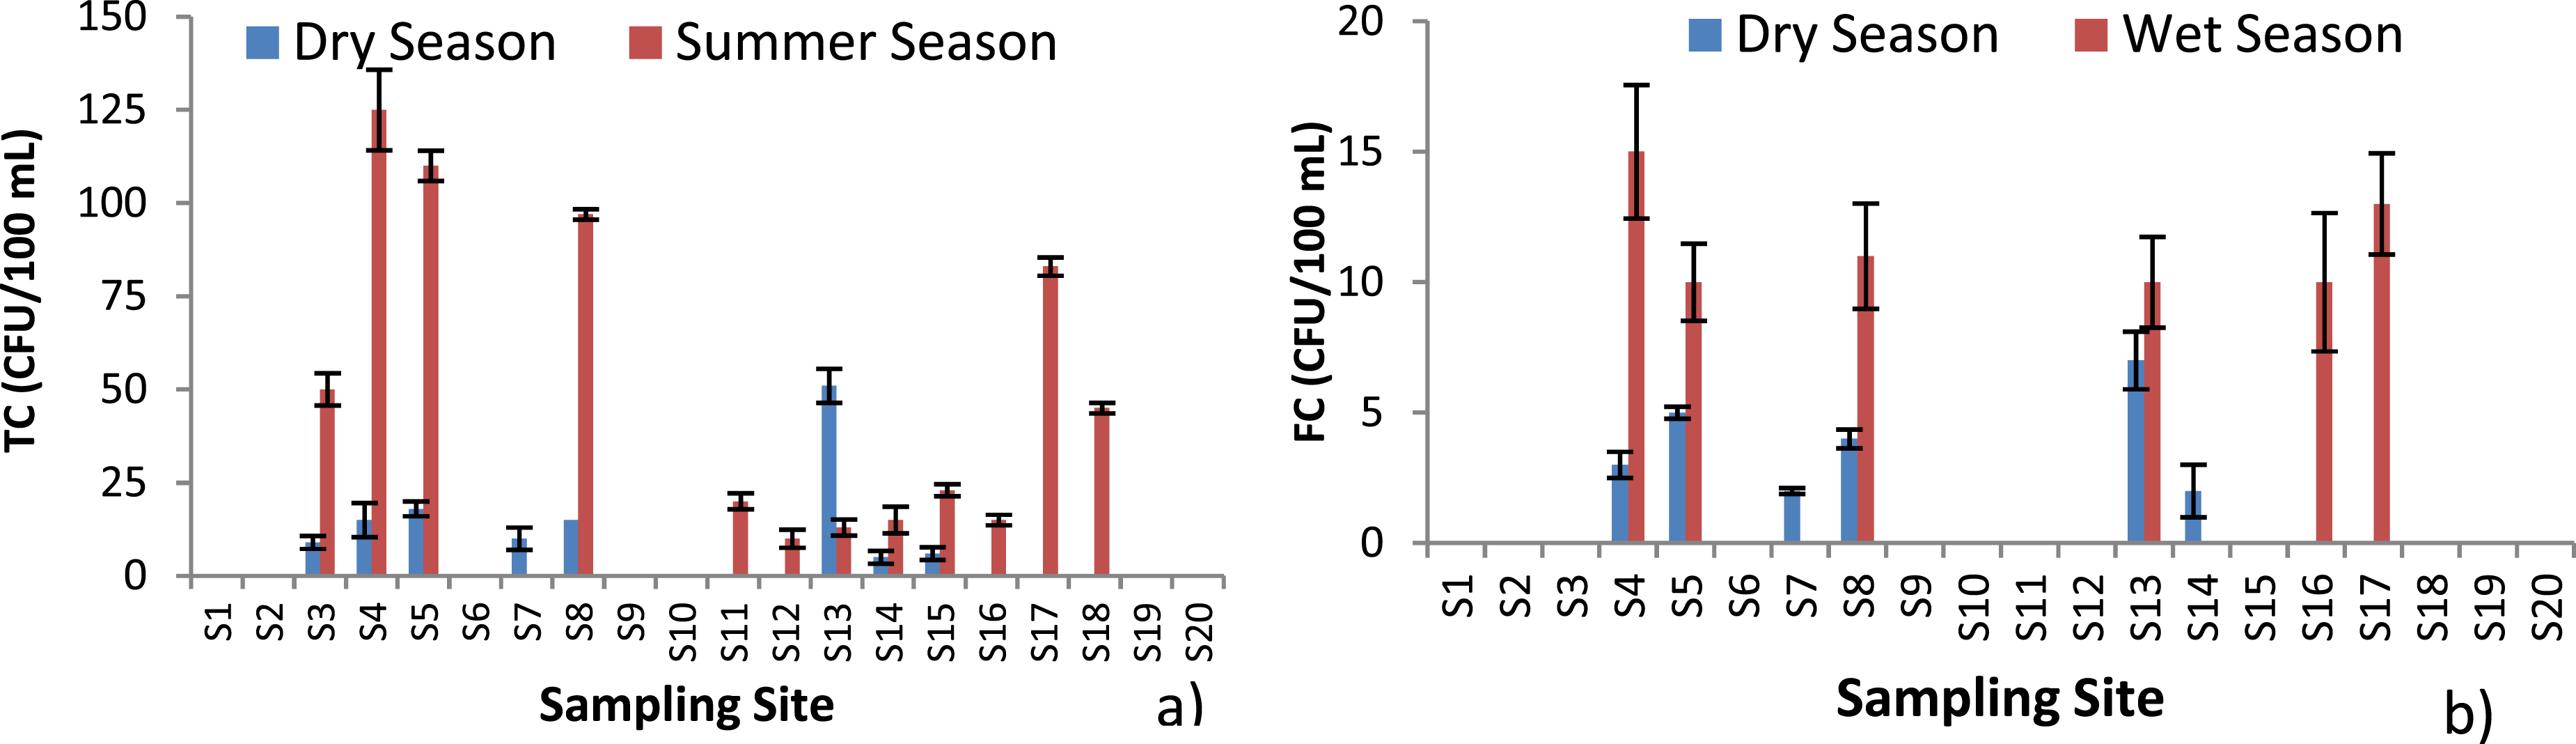
Total Coliform (TC)
As it has been shown in the Figure 5a, during the dry season from the five reservoir sites only at (S13) a TC count of 51 CFU/100mL was analyzed while in the remaining four sites (80%) there was no count of TC, whereas in the house -hold tap samples in the same season 53.3% of them (8 samples) showed the detection of TC counts from 5 CFU/100mL (S14) to 18CFU/100mL (S5) in the dry season. The analysis of TC in samples collected from both reservoir sites and household taps during the dry season revealed that 20% of the samples from each location did not comply with the WHO TC standard of 1 to 10 CFU/100mL.
During the wet season 40 % of the treatment site samples (S13 &S16) and 66.7% of the household tap samples TCs were detected. At the reservoir sites a TC of 13 CFU/100mL at S13 and 15 CFU/100mL at S16 were observed. At the household taps a TC count from 0 to 125 CFU/100mL were analyzed. High TC counts were observed at S4, S5, S8 and S17. In the wet season, water sample analysis for TC indicated that 40% at the reservoir sites and 60 % at the household taps were not compliant with the WHO drinking water standards (0 to 10 CFU/100mL). 21 This confirmed that the water supplied was unsafe to drink. In addition to this the TC counts were increased in number from the treatment sites to the taps which might be the indication of the pollution of water at the distribution pipe line.
Fecal Coliform (FC)
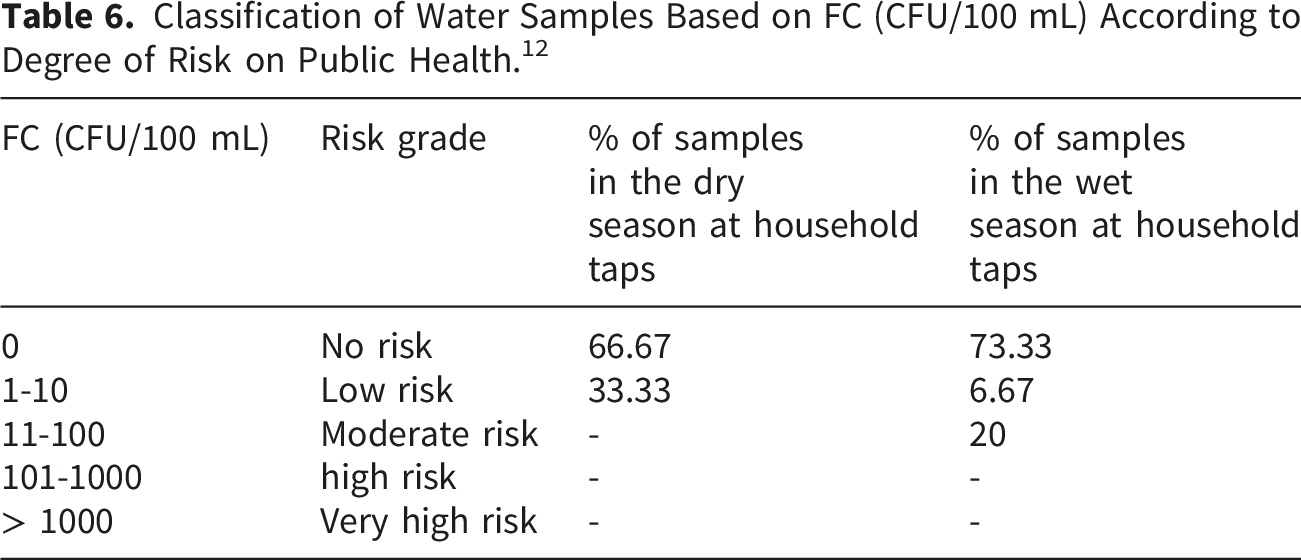
The FC analysis of Bahir Dar city’s drinking water for both the dry and wet seasons is presented in Figure 5b. During the dry season, FC were detected at only one reservoir site, S13 (Buster), with a count of 7 CFU/100mL. Additionally, 20% of the reservoir site samples from the dry season and 40% of those from the wet season did not meet the WHO drinking water standard of 0 CFU/100mL for fecal contamination.
Classification of Water Samples Based on FC (CFU/100 mL) According to Degree of Risk on Public Health. 12
In Kobo town, Ethiopia, fecal coliform levels in household tap water ranged from 1 to 29 CFU/100 mL, with an average of 13.5 ± 8.4 CFU/100 mL. Total coliform concentrations ranged from 6 to 40 CFU/100 mL, with a mean value of 18.9 ± 10.8 CFU/100 mL. 37 In contrast, in Thulamela municipality, Limpopo Province, South Africa, total coliform levels in household tap water ranged from 0 to over 2000 MPN/100 mL during the dry season and from 200.5 to over 2000 MPN/100 mL in the wet season. 38
Water Quality Index (WQI)
The average Water Quality Index (WQI) values during the dry season ranged from 16.49 to 45, with the highest value recorded at site S1 (45). Based on the WQI classification, sites S9, S13, and S19 at the reservoir, as well as S10, S11, S12, S14, S15, and S20 at the household taps, had WQI values between 0 and 25 and were therefore categorized as excellent water quality.
In the wet season, WQI values ranged from 33.4 to 64.8. At the reservoir, site S19 recorded the highest value (64.8) classified as poor, while the remaining reservoir sites were classified as good. Among the household tap samples, S11 showed the highest WQI value (51.6). Overall, 20% of the sampling sites (S11, S15, and S19) fell into the poor category, whereas 80% were classified as good.
Despite the generally high WQI ratings observed in both seasons, several sampling sites were contaminated with coliform bacteria, indicating potential microbial risks to public health.
Conclusion
In this study the physicochemical parameters including temperature, pH, TDS, EC, NO3-, PO43- and F- were found below the WHO drinking water standard both at the reservoir sites and the household taps that were measured both during the dry and wet seasons, while sulfide concentrations were higher than the WHO permissible limit at all sites and in both seasons. The turbidity values obtained during the dry season were below 5 NTU, which were compliant with the WHO guideline both at the reservoirs and household taps, while during the wet season the turbidity values were found between 5.75 NTU and 6.83 NTU, that were above the WHO standard at all sites. The turbidity values had been increased from reservoir site to taps. This might be due to contamination of the water with sewage in broken pipes in the distribution system. The FRC of the current study during the dry season showed that 40% at the reservoirs and 53 .3% of the tap samples were compliant with the drinking water disinfection standard of WHO, which is between 0.2 to 0.5 mg/L, while in the wet season 40 % of the samples at the reservoirs and 73.3% at the household taps did not fit the WHO standard limit. The mean sulfide levels both at the reservoirs and household taps were beyond the permissible limit of WHO. Elevated sulfide concentrations at household taps may adversely affect the aesthetic quality of drinking water by causing objectionable taste and odor, thereby reducing its acceptability to consumers. With respect to bacteriological analysis, 20 % of the water samples in the dry 55% samples in the wet seasons showed total coliforms above WHO drinking water guideline (>10 CFU/100 mL). The water samples showed 25 % and 30% of fecal coliforms in the dry and wet seasons, respectively, which were above the WHO guideline limit (0 CFU/100 mL): indicating that the consumers are at health risk from microbial contamination in the drinking water. According to the WQI classification, during the dry season, sites S9, S13, and S19 at the reservoir, and S10, S11, S12, S14, S15, and S20 at household taps, fell within the 0–25 range and were rated as excellent, while the remaining sites were classified as good. In the wet season, S19 at the reservoir and S11, S15, and S19 at the taps were categorized as poor, with all other sites rated as good. This indicates that the water is contaminated and requires sufficient disinfection of water and control water distribution pipe lines from damage, which allows mixing up with the wastewater generated from the city. The city Water and Sewerage Authority, in collaboration with relevant stakeholders, should strengthen efforts to address this problem. Consumers should also be made aware of potential risks and take appropriate measures to safeguard their health. Moreover, policymakers should prioritize and implement effective strategies to ensure access to safe drinking water, thereby contributing to the achievement of the United Nations Sustainable Development Goal 6 (SDG 6). Further investigations are recommended to include additional water quality parameters, particularly trace metals, microplastics, polycyclic aromatic hydrocarbons, bisphenol, and radionuclides in order to provide a more comprehensive assessment of drinking water safety and potential health risks.
Footnotes
Acknowledgement
The authors are grateful to Bahir Dar University for the financial support of this study.
Author Contribution
Funding
The authors received no financial support for the research, authorship, and/or publication of this article.
Declaration of Conflicting Interests
The authors declared no potential conflicts of interest with respect to the research, authorship, and/or publication of this article.