






Abstract
Background
Sustainable Development Goal 3 (SDG 3) emphasizes universal access to high-quality healthcare services as a cornerstone of global health improvement. Although access to care has expanded in many low- and middle-income countries, including Ghana, healthcare service quality (HSQ) and patient satisfaction (PS) remain uneven, particularly within tertiary hospitals. This study assessed PS and determinants of HSQ in Ghanaian tertiary hospitals using the RATER model.
Methods
A multi-center cross-sectional survey was conducted among patients attending five tertiary hospitals in Ghana that were operational prior to the inception of SDG 3. PS was measured using the Client Satisfaction Questionnaire (CSQ-8), while HSQ was assessed using the RATER dimensions of SERVQUAL. Of the 354 participants targeted, 297 were enrolled with a response rate of 83.9%. Data were collected electronically using REDCap. Group differences, associations, and predictors of PS were examined using appropriate non-parametric tests and multivariable regression models. All analyses were performed using SPSS and R software.
Results
The mean age of participants was 38.96 ± 15.19 years (range: 18–75), and 65.7% were female. Overall PS was high with a mean score of 3.56 ± 0.41. All RATER gap dimensions were strongly intercorrelated (ρ= 0.62–0.80) and demonstrated moderate-to-strong positive associations with PS (ρ=0.50–0.59). Demographic characteristics were not significantly associated with satisfaction. However, monthly income predicted satisfaction, with low-income participants reporting higher satisfaction than those with no income. Institutional differences in unadjusted satisfaction were observed, with the highest satisfaction among patients attending Tamale and Komfo Anokye Teaching Hospitals, although these differences attenuated after multivariable adjustment. Among HSQ dimensions, reliability showed the strongest association with PS.
Conclusion
Patient satisfaction in Ghana’s tertiary hospitals is driven more by structural and socioeconomic conditions, institutional performance and perceived service reliability than by demographic characteristics. Strengthening reliability in service delivery and reducing inter-hospital disparities are critical for advancing patient-centered care and achieving SDG 3.
Introduction
Healthcare service quality (HSQ) is a cornerstone of effective health systems and a critical determinant of population health outcomes, although its conceptualization varies across disciplines and contexts.1,2 A broad consensus exists that HSQ reflects the extent to which health services improve health outcomes in accordance with evidence-based professional standards. The World Health Organization defines HSQ as care that is safe, effective, timely, efficient, equitable, and people-centered, 3 a position similarly emphasized by the Institute of Medicine. 4
Globally, poor-quality healthcare has been identified as a greater contributor to avoidable mortality than lack of access alone, particularly in low- and middle-income countries (LMICs). Inadequate HSQ accounts for an estimated 60% of deaths from conditions amenable to healthcare, underscoring the need to assess healthcare performance beyond service coverage to include quality and patient experience. 5 Consequently, improving HSQ has become a strategic priority for health system strengthening and for achieving SDG 3, which aims to ensure healthy lives and promote well-being for all.
In Ghana, substantial progress has been made in expanding access to healthcare through the National Health Insurance Scheme (NHIS), which covers a broad range of services, including outpatient consultations, inpatient care, essential medicines, diagnostic tests, and maternal and child health services, and through which approximately 68.6% of the population is currently insured.6,7 However, increased utilization has not consistently translated into high-quality care. Tertiary hospitals in particular continue to face structural and workforce constraints, including resource limitations, aging infrastructure, and shortages of skilled health professionals, all of which undermine HSQ.8-10 Evidence suggests that gains in healthcare access have not been matched by improvements in patients’ perceived quality of care, resulting in raising concerns about Ghana’s progress toward SDG 3. 11
Assessing HSQ is inherently complex, encompassing healthcare structures, service delivery processes, and outcomes. Donabedian’s Structure-Process-Outcome framework remains foundational in healthcare quality assessment, 12 while contemporary quality improvement approaches such as Total Quality Management, Continuous Quality Improvement, and the Plan-Do-Study-Act cycle emphasize system-wide optimization.13,14 Nevertheless, many quality assessments remain provider-centered and rely heavily on administrative indicators, often overlooking patient experiences.
PS has therefore emerged as a key indicator of HSQ, reflecting patients’ evaluations of service delivery, interpersonal care, and system responsiveness. SERVQUAL-based frameworks, including the RATER model, provide a robust patient-centered approach by capturing gaps between patient expectations and perceived service performance across five dimensions: reliability, assurance, tangibility, empathy, and responsiveness. These dimensions are particularly relevant in healthcare settings, where trust, communication, timeliness, and individualized care strongly shape patient experiences and satisfaction.
Despite growing recognition of the importance of patient-centered quality assessment, there remains limited multi-institutional evidence on healthcare quality in Ghanaian tertiary hospitals since the adoption of SDG 3.5,15,16 Existing studies are often restricted to single facilities, specific patient groups, or descriptive analyses, limiting their generalizability and policy relevance.15,17 Moreover, few studies simultaneously examine demographic, socioeconomic, institutional, and HSQ determinants of patient satisfaction using appropriate multivariable analytical approaches.
This evidence gap is particularly critical given the central role of tertiary hospitals as referral centers for specialized and complex care and their expected contribution to national progress toward SDG 3. A comprehensive, multi-institutional assessment of patient satisfaction and healthcare HSQ is therefore essential to generate actionable evidence to strengthen patient-centered care and improve health system performance in Ghana.
Accordingly, this study aims to assess healthcare HSQ and patient satisfaction across Ghana’s tertiary hospitals using the RATER framework. Specifically, the study addresses the following research questions: What is the level of patient satisfaction in Ghana’s tertiary hospitals? Do demographic and socioeconomic characteristics significantly predict patient satisfaction? Are there significant differences in patient satisfaction across tertiary hospitals? and Which RATER HSQ dimensions significantly predict patient satisfaction?
Methods
Study Setting and Design
Study Setting
Korle Bu Teaching Hospital (KBTH)
KBTH, established in 1923 in Accra, is Ghana’s oldest and largest teaching hospital and the primary training facility for the University of Ghana Medical School. It operates over 2,000 beds and manages high volumes of specialized services, including most neurosurgical, renal transplant, and cardiothoracic surgery cases in the country. 18 KBTH serves an estimated population of over 24 million people across southern Ghana and is currently the third-largest referral center in Africa. 19 The hospital employs more than 8,000 staff across multiple departments. 18
Komfo Anokye Teaching Hospital (KATH)
KATH, established in 1954 in Kumasi, is Ghana’s second-largest teaching hospital and the main training site for the Kwame Nkrumah University of Science and Technology Medical School. The hospital has over 1,000 beds and is a major center for cardiothoracic care, serving a catchment population of over 10 million people across the Ashanti, Bono, Bono East, and Ahafo regions. 20
Tamale Teaching Hospital (TTH)
Established in 1974, TTH is the main referral hospital in northern Ghana and the primary teaching hospital for the University for Development Studies School of Medicine and Health Sciences. It operates over 400 beds and serves approximately 2.5 million people across the Northern, Savannah, and North East Regions.21,22
Cape Coast Teaching Hospital (CCTH)
CCTH, established in 2011, serves as the main teaching facility for the University of Cape Coast School of Medical Sciences. The hospital has approximately 300 beds and provides both general and specialist care to an estimated catchment population of 1.2 million people, primarily in the Central Region. 23
Ho Teaching Hospital (HTH)
HTH, established in 1977, is the primary teaching hospital for the University of Health and Allied Sciences. Located in the Volta Region, it has nearly 300 beds and provides comprehensive healthcare services to an estimated population of about 2 million people in the region. 24
Study Design
A cross-sectional analytical study was conducted across five of Ghana’s six teaching hospitals: HTH, KATH, KBTH, TTH, and CCTH. Sunyani Teaching Hospital, inaugurated in June 2023, 25 was excluded as it had insufficient operational history (18 months at the time of data collection) for meaningful comparison with the five established institutions, which have been operational since before the adoption of SDG 3 in 2015.
These tertiary hospitals were chosen for the following reasons. First, as leading public referral facilities, they serve large and diverse populations across multiple regions of Ghana, making them critical for assessing healthcare quality, access, and equity, core dimensions of SDG 3.26,27 Second, these hospitals represent substantial national investments in healthcare infrastructure and workforce development; evaluating their performance provides evidence on the returns of Ghana’s health system investments. 28 Further, as academic and training centers, these hospitals play a pivotal role in shaping Ghana’s future healthcare workforce; accordingly, assessments of healthcare quality and service delivery are essential for evaluating the sustainability of human capital development in the health sector, Adjei. 29
These facilities provide advanced and specialized services, including neurosurgery, oncology care, and organ transplantation, where HSQ directly influences patient outcomes and progress toward SDG 3. 30 Finally, as hubs of research and innovation, teaching hospitals contribute to system-wide improvements in care quality and outcomes, making them representative of Ghana’s broader healthcare system. 31 Conducting a multi-institutional evaluation across these hospitals also enables regional comparisons, facilitating the identification of disparities in healthcare quality and access to inform evidence-based health policy.
Sample Size Determination
The sample size for this study was determined using the single population proportion formula, appropriate for cross-sectional studies assessing patient satisfaction:
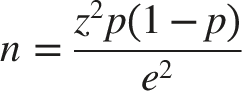
p denotes the estimated proportion of patient satisfaction, and d is the margin of error set at 5% (0.05).
Based on evidence from national studies in Ghana indicating that patient satisfaction rate of 70%, 32 this study adopted a prevalence estimate of 0.70.
Substituting These Values Into the Formula

To account for potential non-response and incomplete questionnaires, a 10% adjustment was applied, resulting in a final minimum sample size of approximately 354 participants. Although the final analytical sample (n = 228 with complete data) post hoc accounted for 64.4% of the calculated target (n = 354). A post hoc power analysis using G*Power 3.1 confirmed adequate statistical power for all primary analyses. For the multivariable generalized linear model with 26 predictors and α = .05, the achieved sample of 228 provided power of 0.87 to detect medium effect sizes (f2 = 0.15, equivalent to R2 = 0.13) and power exceeding 0.95 to detect large effects (f2 = 0.35, equivalent to R2 = 0.26). For the Kruskal-Wallis tests comparing five hospitals, power exceeded 0.92 to detect medium-to-large effects (η2 ≥ 0.13), and the observed effect size for hospital differences in satisfaction (η2 = 0.31) was well above this threshold. For Spearman correlations, the sample provided power > 0.90 to detect medium correlations (ρ ≥ 0.30), and observed correlations ranged from 0.50 to 0.59. Thus, despite the reduction from 354 to 228, the study maintained more than adequate power for detecting clinically meaningful associations, and all key findings exceeded conventional thresholds for medium-to-large effects.
Sampling Proportion and Allocation
Distribution of Study Participants by Site and Sampling Proportion
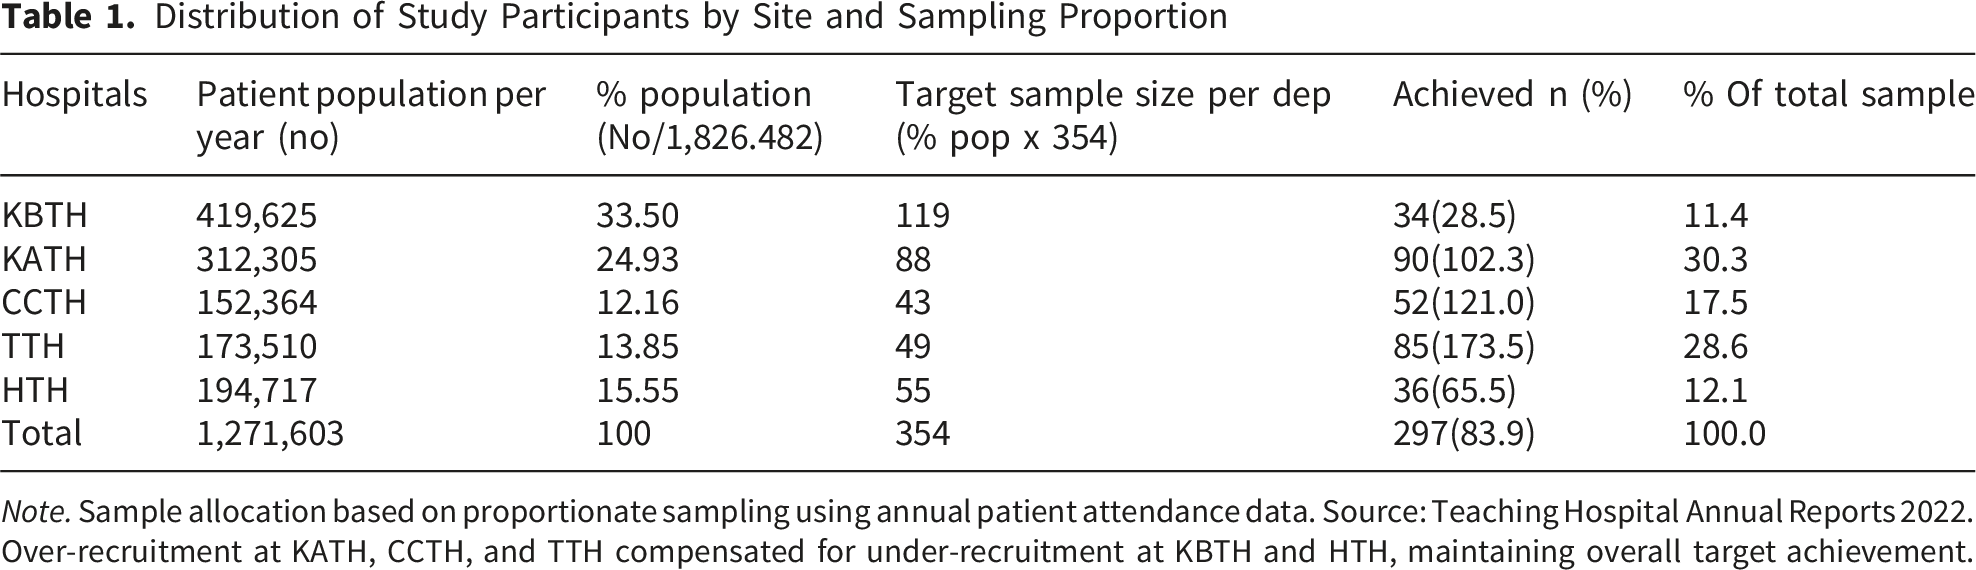
Note. Sample allocation based on proportionate sampling using annual patient attendance data. Source: Teaching Hospital Annual Reports 2022. Over-recruitment at KATH, CCTH, and TTH compensated for under-recruitment at KBTH and HTH, maintaining overall target achievement.
Inclusion Criteria
1. Adult patients (≥18 years) receiving inpatient or outpatient services at the selected tertiary hospitals during the study period. 2. Relatives or caregivers accompanying patients to the selected tertiary hospitals and directly involved in the care-seeking process. 3. Individuals who had completed at least one clinical encounter at the facility at the time of data collection. 4. Ability to communicate effectively in English or a locally understood language, either independently or with minimal assistance. 5. Willingness to provide informed consent to participate in the study.
Exclusion Criteria
1. Individuals younger than 18 years of age. 2. Patients who were critically ill, unconscious, or in severe clinical distress at the time of data collection and therefore unable to participate. 3. Repeat respondents who had previously participated in the study to avoid duplication of responses.
Sampling Technique
The study was conducted across multiple tertiary hospitals. To ensure proportional representation, the total sample size was allocated to each facility based on patient attendance volumes during the data collection period. This proportional allocation ensured that larger facilities contributed more respondents while smaller facilities were adequately represented. At each selected hospital, systematic sampling was employed to recruit patients and accompanying relatives from outpatient and inpatient departments. A sampling interval of k = 5 was used (every fifth eligible patient or accompanying relative encountered during clinic hours). The starting point was randomly selected each day from 1 to 5 using a random number table. If a selected participant declined or did not meet eligibility criteria, the next eligible individual was approached to maintain the sampling interval. This process continued until the facility-specific sample size was achieved. This approach minimized selection bias while maintaining operational feasibility in busy clinical settings.
Data Collection Management and Instruments
Data collection was facilitated by trained research assistants using REDCap on handheld electronic devices to ensure standardized data capture, real-time validation, and secure data management. Participation was entirely voluntary, and informed consent was obtained before enrollment. Only respondents who met the eligibility criteria and completed the survey were included in the final analysis. HSQ was assessed using the RATER model, derived from the SERVQUAL instrument developed by Parasuraman, Zeithaml, and Berry. SERVQUAL was originally designed to measure the gap between customer expectations and perceptions of HSQ across five dimensions: reliability, assurance, tangibles, empathy, and responsiveness, using 22 items. 36 Each item is rated on a 7-point Likert scale (1 = strongly disagree to 7 = strongly agree), with higher scores reflecting stronger agreement. The maximum possible score per RATER dimension is 7, and the maximum composite score across all 22 items is 154. In the present study, all 22 items were administered and grouped into the five RATER dimensions as follows: reliability (5 items), assurance (4 items), tangibles (4 items), empathy (5 items), and responsiveness (4 items). For each item, participants provided both an expectation rating and a perception rating, and an item-level gap score was computed as the perception rating minus the expectation rating. Dimension-level gap scores were then derived by averaging the item-level gap scores within each dimension, with negative values indicating that perceived service fell short of expectations.
RATER is the widely used mnemonic for these five SERVQUAL dimensions; in the present study it denotes the dimensional grouping of the full 22-item instrument rather than a reduced single-item version of the scale.36,37
The RATER model offers a pragmatic approach for assessing HSQ in busy healthcare environments such as tertiary hospitals. Empirical studies have demonstrated acceptable internal consistency for the RATER scale, with Cronbach’s alpha values of 0.80 or higher. 38 Although concerns have been raised regarding potential oversimplification and variability in factor structure across settings, the RATER model remains widely used and validated, particularly where feasibility and efficiency are critical.
PS was measured using the Client Satisfaction Questionnaire (CSQ-8), an 8-item unidimensional scale designed to assess overall satisfaction with healthcare services. Each item is rated on a 4-point Likert scale, with response options tailored to the specific item (e.g., 1 = quite dissatisfied to 4 = quite satisfied). The maximum total score is 32, and the maximum mean score is 4.0; higher scores indicate greater satisfaction. The CSQ-8 has been extensively validated across healthcare settings and populations, demonstrating strong reliability and construct validity. In this study, the CSQ-8 provided a robust composite measure of PS, complementing the HSQ dimensions assessed through the RATER model. The complete data collection instrument, including all RATER expectation and perception items and the CSQ-8 items administered to participants, is provided in Supplementary File 2
Pilot Testing and Reliability
The questionnaire was piloted in a non-tertiary healthcare facility to assess clarity and feasibility, and internal consistency reliability analysis demonstrated high reliability, with Cronbach’s alpha values exceeding .85 for the CSQ-8 and ranging from .78 to .91 across the RATER dimensions, meeting the recommended thresholds for acceptable reliability (Nunnally & Bernstein, 1994).
Data Management and Analysis
Data were collected electronically using Research Electronic Data Capture (REDCap), administered by trained research assistants. REDCap enabled real-time validation, secure storage, and centralized data management. Data were analyzed using IBM SPSS Statistics Version 27. Before conducting the inferential analysis, the data were screened for completeness, outliers, and distributional assumptions.
Of the 297 recruited participants, 69 (23.2%) had incomplete data on one or more variables required for multivariable modeling, primarily monthly income (n = 24, 8.1%) and education-related items (n = 18, 6.1%). Little’s Missing Completely at Random (MCAR) test indicated no systematic pattern of missingness (χ 2 = 145.23, df = 138, p = .317), supporting the MCAR assumption. To assess potential bias from incomplete cases, we compared participants with complete data (n = 228) to those with missing data (n = 69) on key characteristics. No statistically significant differences were observed for age (complete: M = 38.5, SD = 15.1; missing: M = 40.2, SD = 15.5; t = 0.82, p = .412), gender (complete: 65.4% female; missing: 66.7% female; χ 2 = 0.04, p = .841), hospital distribution (χ2= 5.21, p = .267), or mean CSQ-8 satisfaction scores (complete: M = 3.57, SD = 0.40; missing: M = 3.52, SD = 0.45; t = 0.89, p = .375). Given the MCAR pattern and lack of systematic differences between complete and incomplete cases, complete-case analysis (listwise deletion) was employed for multivariable modeling, resulting in a final analytical sample of 228 participants (76.8% of the recruited sample, 64.4% of the calculated sample).
Descriptive statistics, including frequencies, percentages, means, and standard deviations, were computed to summarize participants’ demographic characteristics and key study variables (Table 1). Normality was assessed using graphical methods and formal tests, which indicated that the dependent variable PS (MeanCSQ-8) was negatively skewed and violated the assumption of normality. Consequently, non-parametric methods and generalized modeling approaches were adopted where appropriate. Monthly income was categorized into four groups (no income, low, middle, and high income) based on the Ghana Statistical Service and World Bank income classification approaches. Geographic access to care was categorized into four levels (≤30 minutes, 31-60 minutes, 61-120 minutes, and >120 minutes) in line with WHO healthcare accessibility benchmarks.
Demographic and Clinical Characteristics of Participants
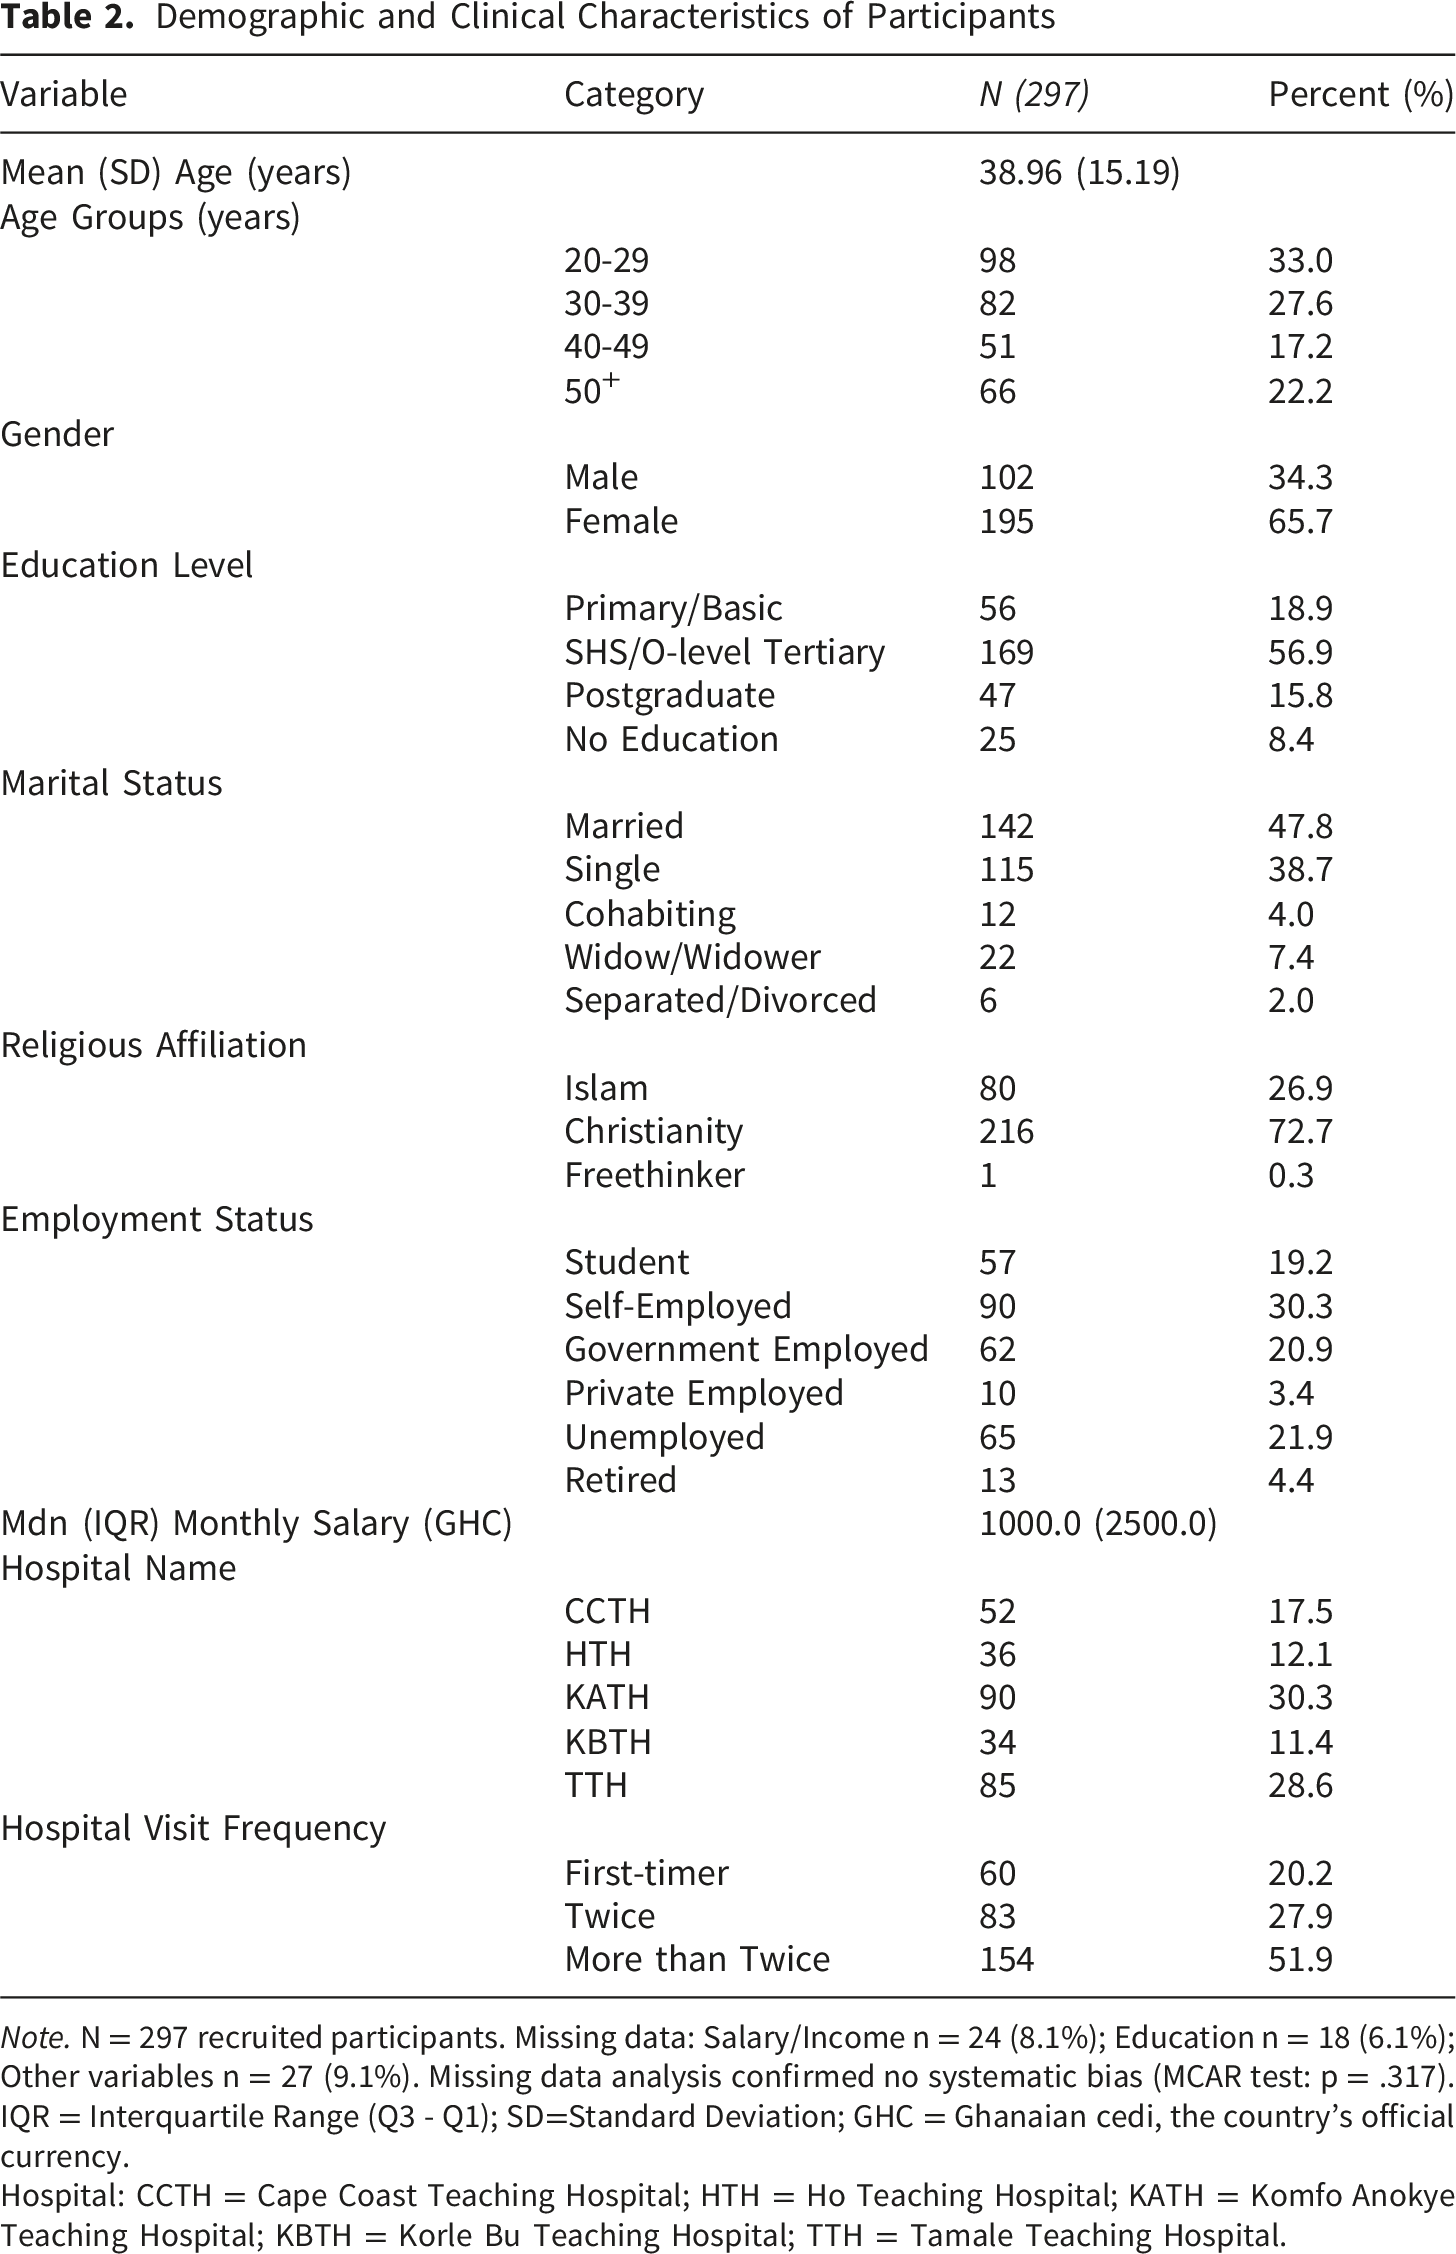
Note. N = 297 recruited participants. Missing data: Salary/Income n = 24 (8.1%); Education n = 18 (6.1%); Other variables n = 27 (9.1%). Missing data analysis confirmed no systematic bias (MCAR test: p = .317). IQR = Interquartile Range (Q3 - Q1); SD=Standard Deviation; GHC = Ghanaian cedi, the country’s official currency.
Hospital: CCTH = Cape Coast Teaching Hospital; HTH = Ho Teaching Hospital; KATH = Komfo Anokye Teaching Hospital; KBTH = Korle Bu Teaching Hospital; TTH = Tamale Teaching Hospital.
Internal Consistency Reliability of the RATER Dimensions of HSQ Across Expectations, Perceptions, and Gap Scores
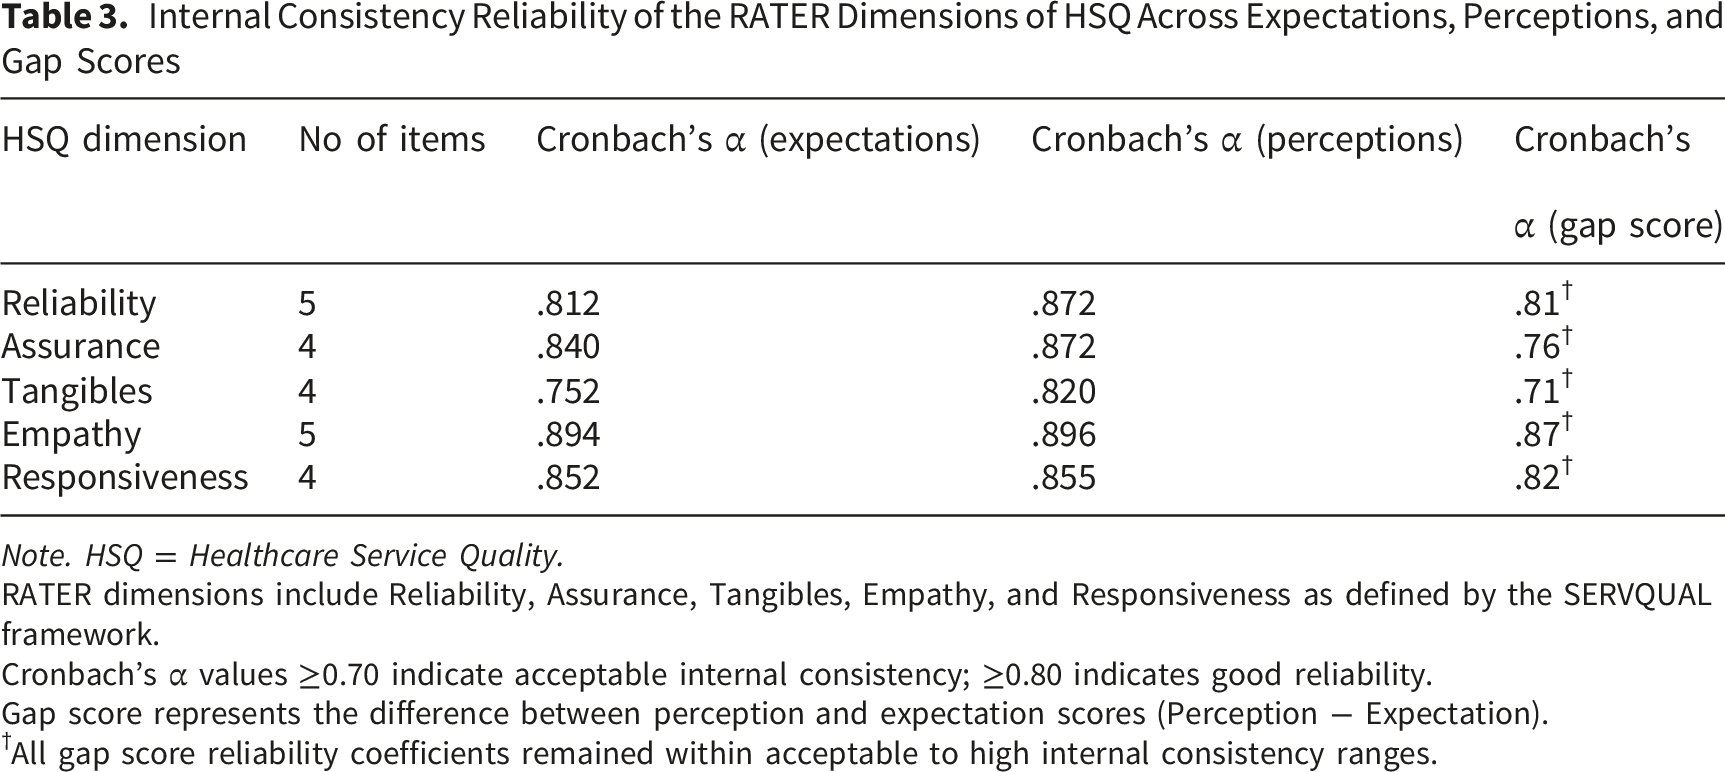
Note. HSQ = Healthcare Service Quality.
RATER dimensions include Reliability, Assurance, Tangibles, Empathy, and Responsiveness as defined by the SERVQUAL framework.
Cronbach’s α values ≥0.70 indicate acceptable internal consistency; ≥0.80 indicates good reliability.
Gap score represents the difference between perception and expectation scores (Perception − Expectation).
†All gap score reliability coefficients remained within acceptable to high internal consistency ranges.
Associations between HSQ gap dimensions and PS were examined using Spearman’s rank-order correlation, given the non-normal distribution of the outcome variable. To examine predictors of PS while accounting for non-normality and positive continuous outcomes, Generalized Linear Models (GLMs) were employed. Multiple GLM families were tested to identify the best-fitting model: Gamma with a log link, inverse Gaussian with a log link, and Gaussian with an identity link. Model comparison based on Akaike’s Information Criterion (AIC) and Bayesian Information Criterion (BIC) favored the Gamma distribution with log link (AIC = 287.84, BIC = 383.86) over inverse Gaussian (AIC = 302.15, BIC = 398.17) and Gaussian models (AIC = 315.42, BIC = 411.44). Residual diagnostics, including deviance residuals and Pearson residuals, confirmed adequate model fit with no substantial deviations from expected patterns (diagnostic plots available in Supplementary File 1). To assess multicollinearity, Variance Inflation Factors (VIF) were calculated for all predictors. VIF values ranged from 1.42 (gender) to 3.18 (empathy gap), all well below the threshold of 5, indicating no problematic multicollinearity despite moderate correlations among RATER dimensions (ρ = .62-.80).
Ethical Considerations
Ethical approval for the study was obtained from the Institutional Review Boards of all participating tertiary hospitals, thus, HTH, where approval was granted through the Policy, Planning, Monitoring and Evaluation (PPME) dated 25th October 2024 uni
Participation was entirely voluntary, and respondents were informed of their right to withdraw from the study at any stage without penalty. Confidentiality and anonymity were ensured by collecting no personally identifiable information and restricting access to the dataset to the research team only. For participants who were unable to read or write, written informed consent was obtained from their legally authorized representative (LAR) typically a next-of-kin or accompanying caregiver in the presence of an impartial witness and with the assistance of a trained bilingual research assistant who explained the study procedures in the participant’s preferred local language, in accordance with applicable ethical guidelines for research involving vulnerable populations
Results
Demographic Characteristics of Participants
Table 2 shows the demographic characteristics of patients. Participants were drawn from TTH (28.6%), KATH (30.3%), CCTH (17.5%), HTH (12.1%), and KBTH (11.4%). The study included 297 participants with a mean age (SD) of 38.96 ± 15.19 years, with the majority in the 20-29 years age group (33.3%). Females predominated among the participants (65.7%). Most participants had attained secondary or tertiary education (56.9%). Nearly half of the respondents were married (47.8%). Christianity was the predominant religion (72.7%), with Islam accounting for 26.9% and freethinkers 0.3%. The largest group of participants was self-employed (30.3%). Monthly salaries had a median of GHC 1,000 (IQR = 2,500). Over half (51.9%) had visited the hospital more than twice, while 27.9% had visited twice, and 20.2% were first-time visitors.
Internal Consistency Reliability of the RATER HSQ Dimensions
Table 3 presents Cronbach’s alpha coefficients for the RATER dimensions across expectation, perception, and gap scores, demonstrating the measurement scales’ internal consistency. The RATER dimensions demonstrate acceptable to excellent internal consistency across expectations, perceptions, and gap scores (α = 0.71-0.87), indicating strong reliability of the measurement scales. This indicates that the items within each dimension reliably measure HSQ and that the derived gap scores are psychometrically sound for subsequent analyses.
Descriptive Distribution of Patient Expectations and Experiences Across RATER HSQ Items
Item-level descriptive statistics for all 22 RATER expectation and experience items are presented in Supplementary File 1-Table S1. In summary, expectation scores across all RATER items were uniformly high, with means ranging from 6.59 to 6.82 (on a 7-point scale) and medians at or near the maximum value of 7.0. The strongly negative skewness (range: -1.86 to -4.48) and elevated kurtosis values reflect pronounced ceiling effects. In contrast, experience scores were consistently lower and more dispersed than expectations (range: 5.92-6.46), with greater standard deviations (0.88-1.21 vs. 0.54-0.79 for expectations) and less severe ceiling effects (skewness: -0.91 to -1.50). This pattern was consistent across all five RATER dimension’s reliability, assurance, tangibles, empathy, and responsiveness.
Descriptive Statistics of Dimension-Level RATER Gap Scores
Descriptive Statistics of RATER Dimension Level Gap Scores
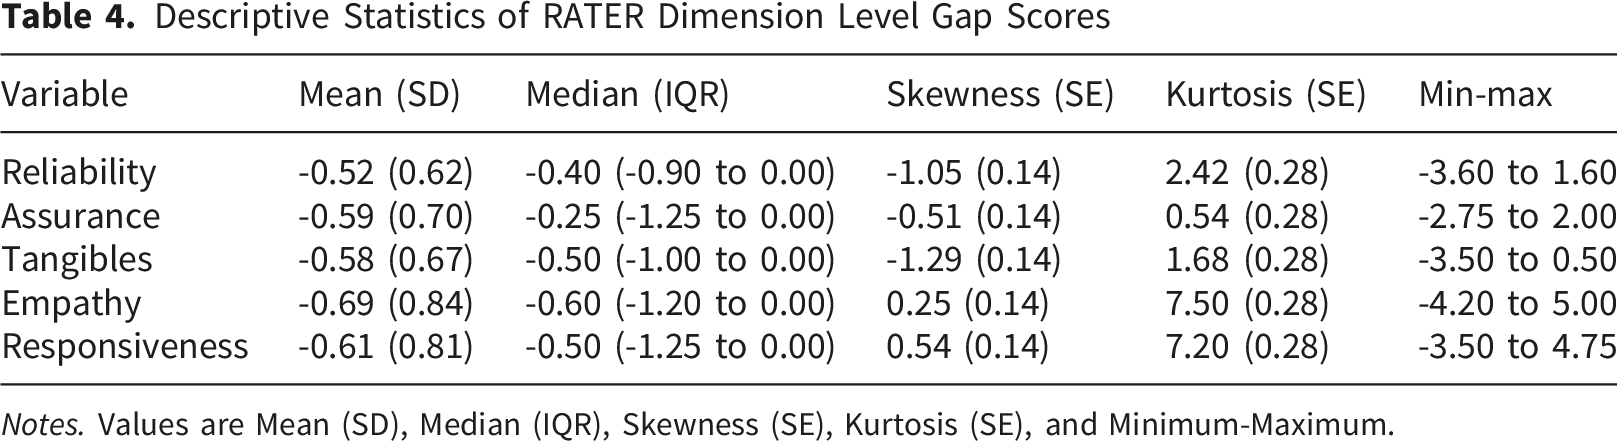
Notes. Values are Mean (SD), Median (IQR), Skewness (SE), Kurtosis (SE), and Minimum-Maximum.
Comparison of RATER Gap Scores Across Tertiary Hospitals
Comparison of RATER Gap Dimensions Across Tertiary Teaching Hospitals
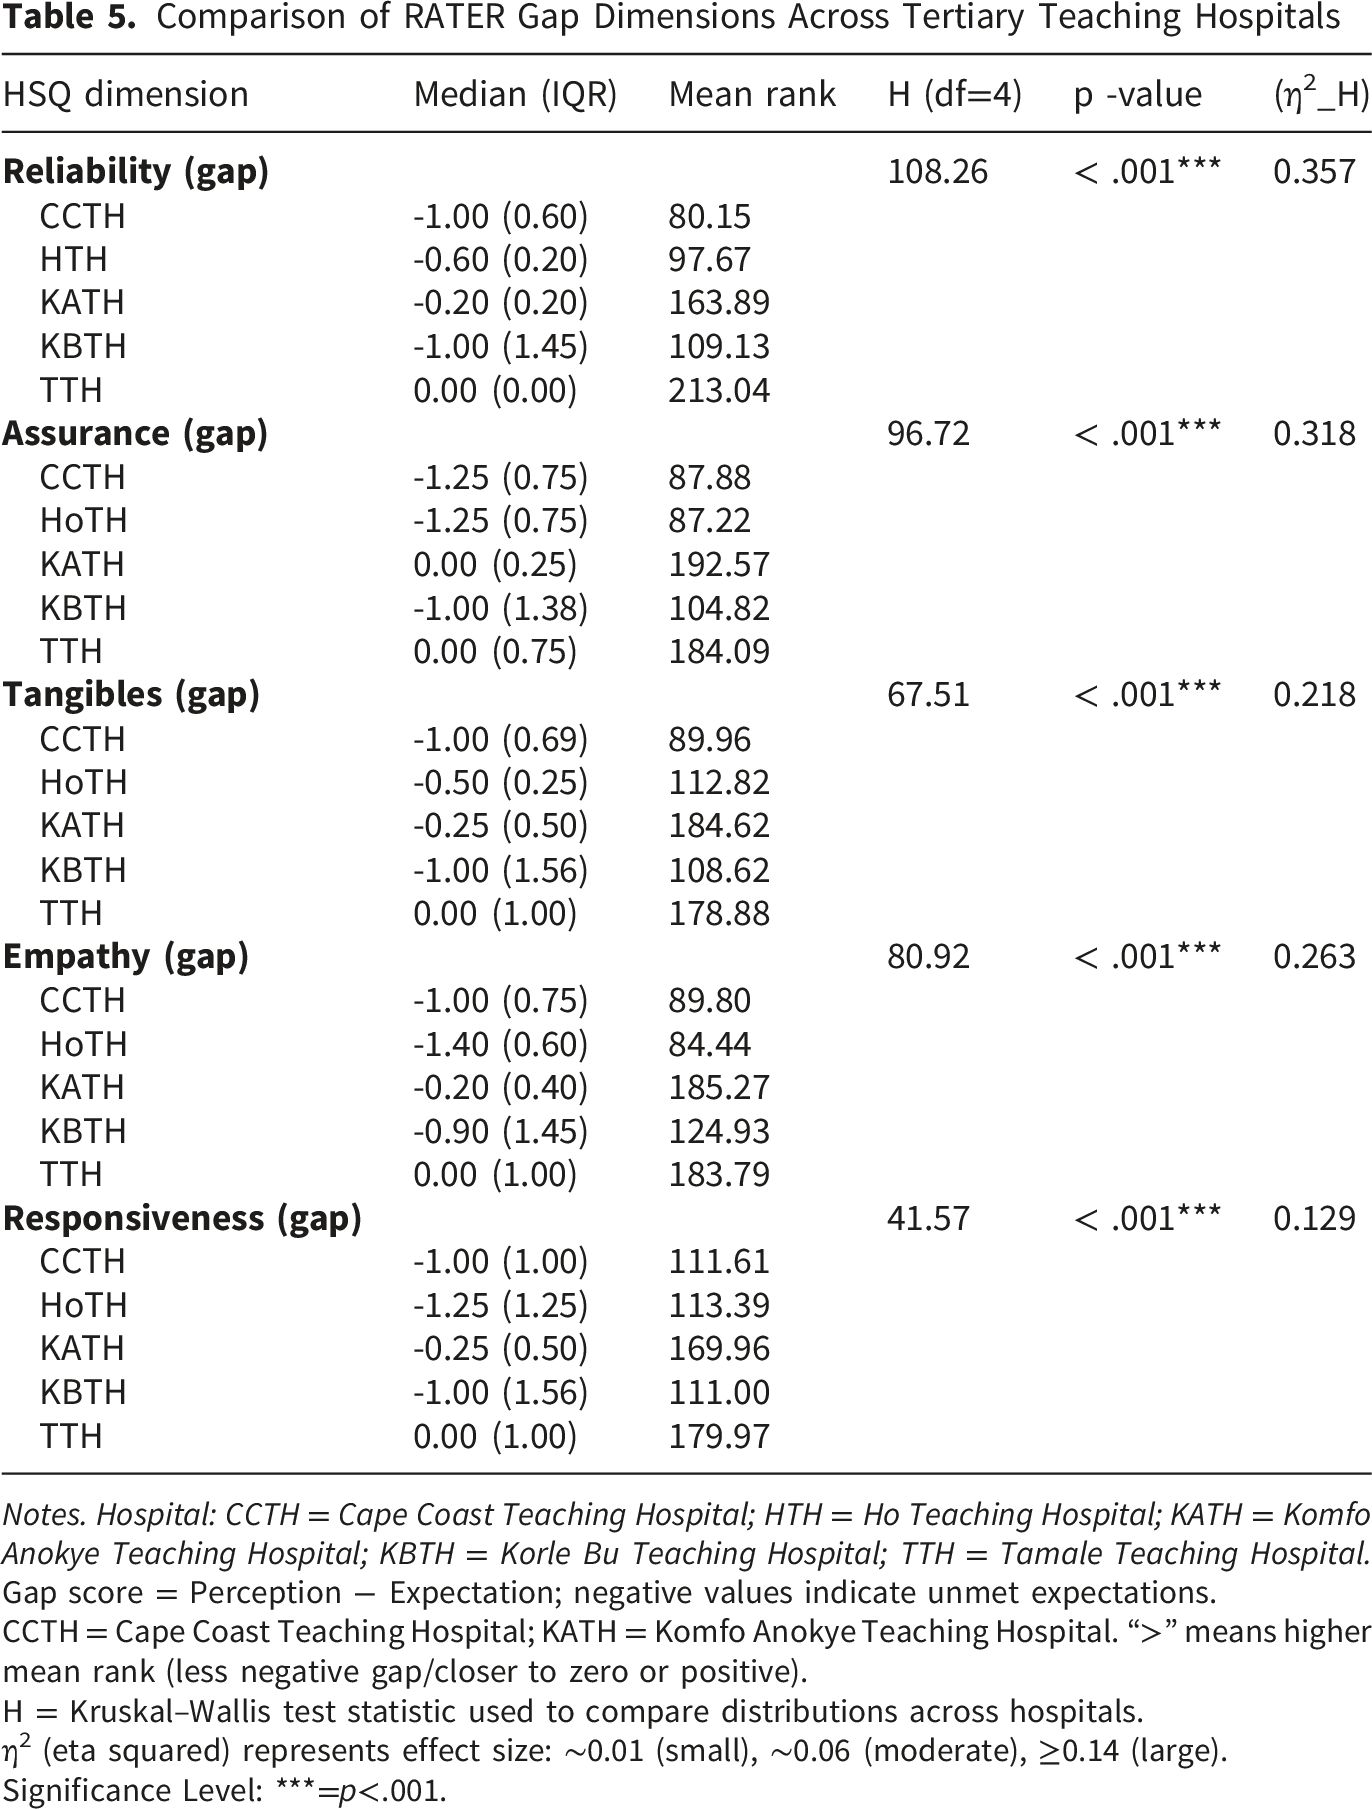
Notes. Hospital: CCTH = Cape Coast Teaching Hospital; HTH = Ho Teaching Hospital; KATH = Komfo Anokye Teaching Hospital; KBTH = Korle Bu Teaching Hospital; TTH = Tamale Teaching Hospital.
Gap score = Perception − Expectation; negative values indicate unmet expectations.
CCTH = Cape Coast Teaching Hospital; KATH = Komfo Anokye Teaching Hospital. “>” means higher mean rank (less negative gap/closer to zero or positive).
H = Kruskal–Wallis test statistic used to compare distributions across hospitals.
η2 (eta squared) represents effect size: ∼0.01 (small), ∼0.06 (moderate), ≥0.14 (large).
Significance Level: ***=p<.001.
Dunn-Bonferroni Pairwise Comparisons Across RATER Gap Dimensions
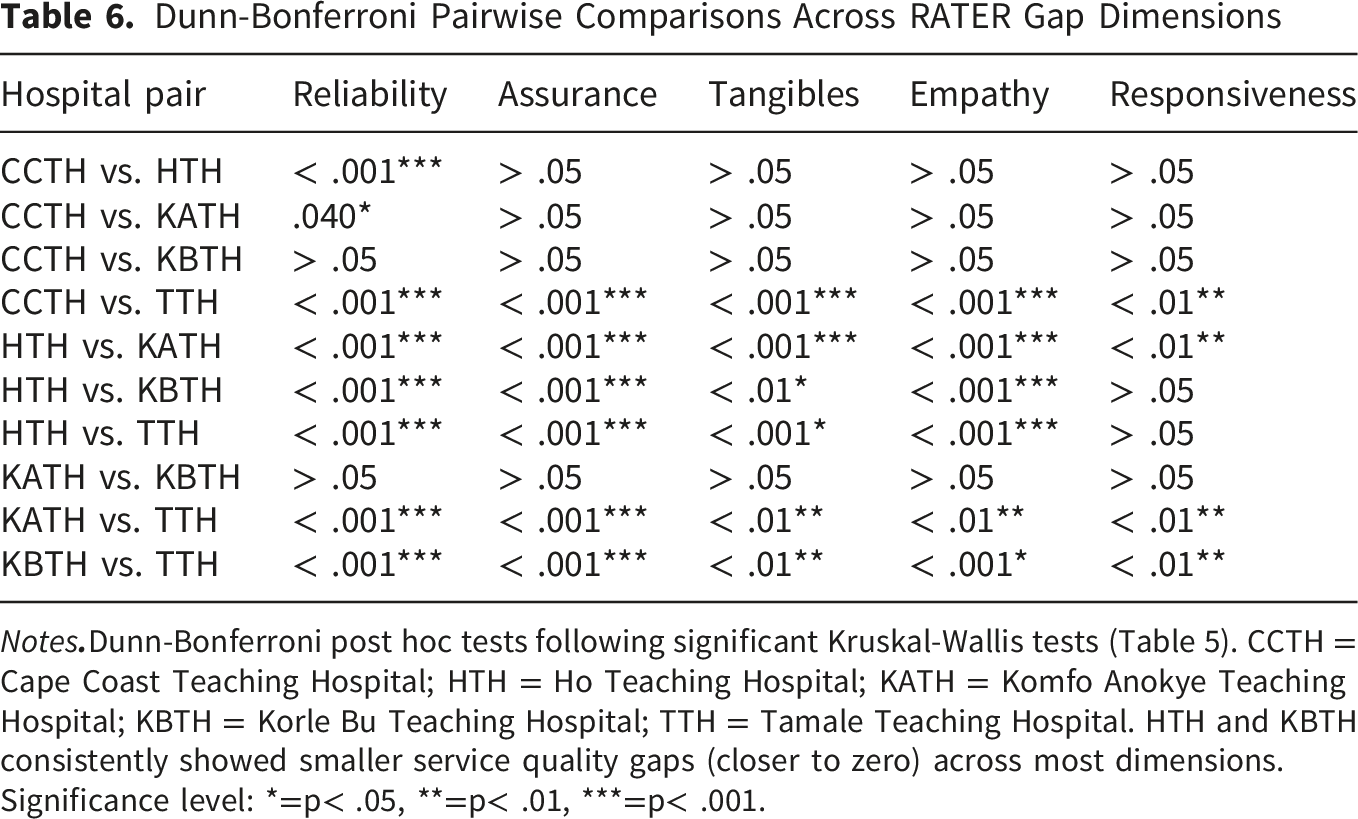
Notes
Descriptive Statistics for CSQ-8 Satisfaction Scores by Hospital
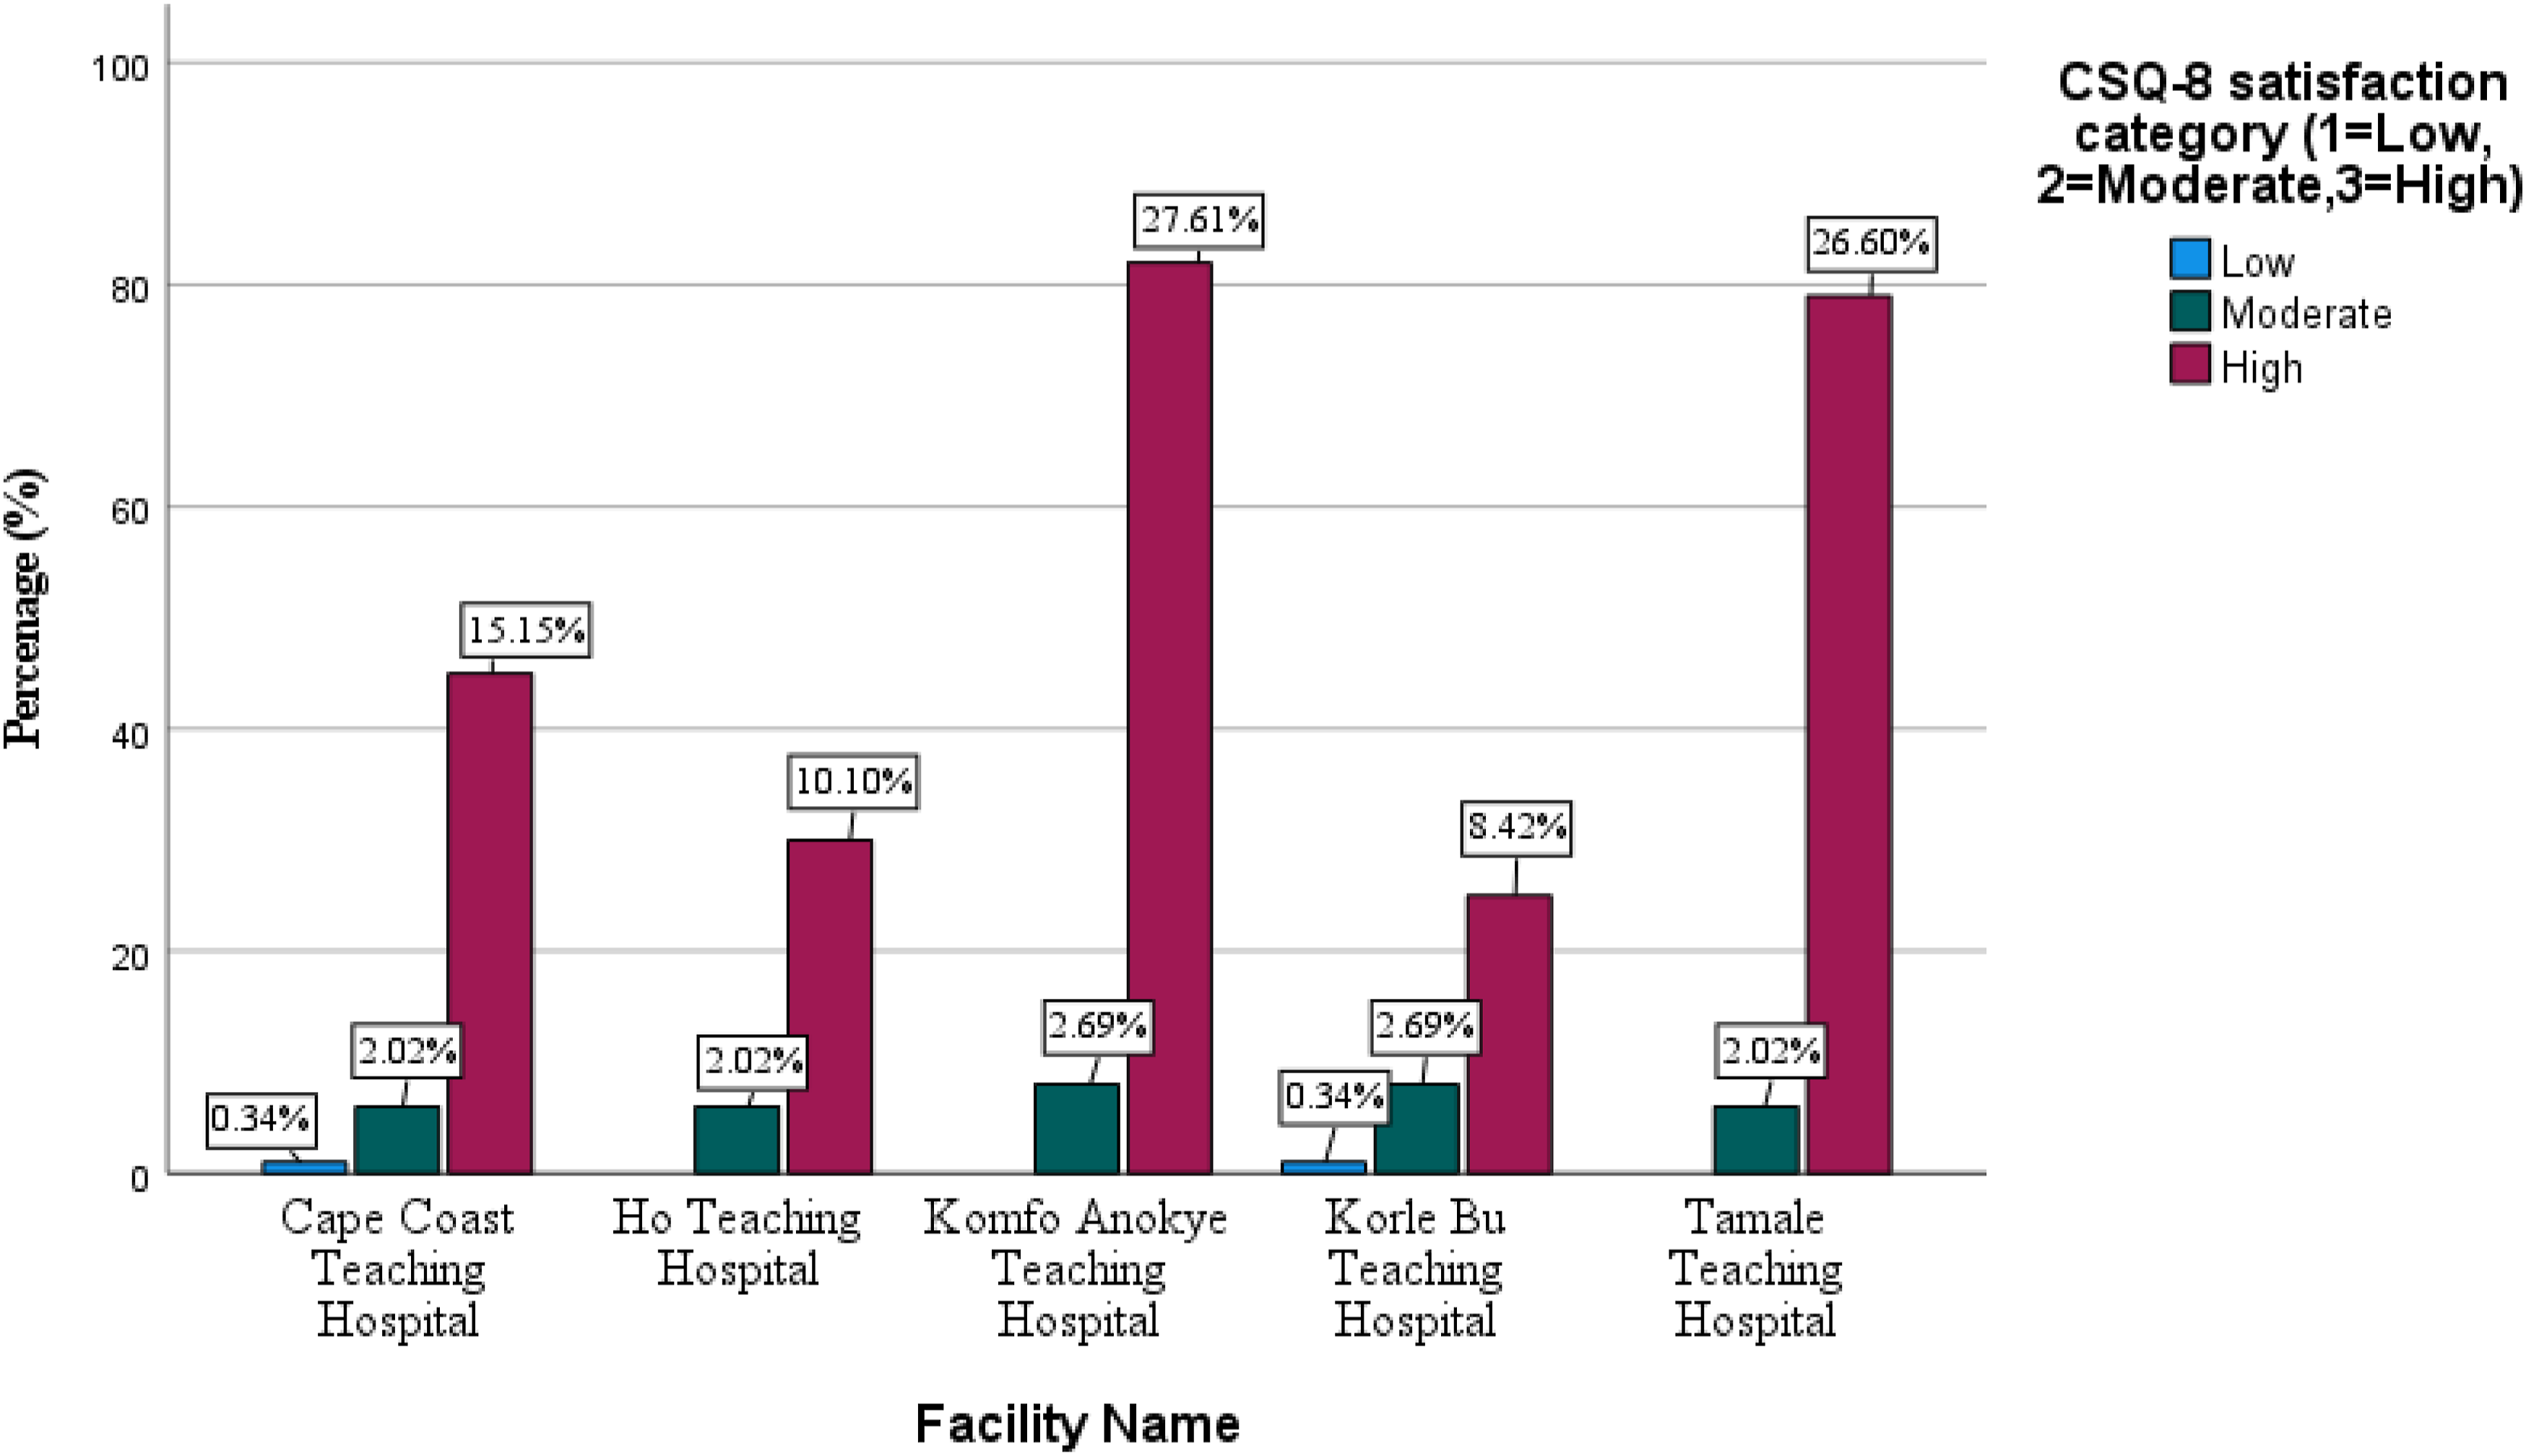
In Figure 1, across all teaching hospitals, high patient satisfaction was predominant. The highest levels of high satisfaction were observed at KATH (27.6%) and TTH (26.6%), followed by CCTH (15.2%). Moderate and low satisfaction levels were minimal across all facilities. Overall satisfaction was high (mean CSQ-8 = 3.56 ± 0.41), with 87.9% of patients reporting satisfaction scores above the threshold of 3.0. In Table 7, a Kruskal-Wallis’s test was conducted to examine differences in PS (CSQ-8 composite score) across the five tertiary hospitals. Normality tests were significant for all groups (Shapiro-Wilk p < .001), warranting nonparametric analysis. Results showed a statistically significant difference in satisfaction across hospitals, H (4) = 95.27, p < .001, with a large effect size (η2=.31). Mean ranks indicated that TTH had the highest satisfaction (MR = 195.20), followed by KATH (MR = 182.70), whereas CCTH had the lowest (MR = 81.24). Distribution of patient satisfaction (CSQ-8) across teaching hospitals in Ghana Descriptive Statistics, Kruskal-Wallis Test, and Comparisons for CSQ-8 Satisfaction Scores by Hospital
Notes. Kruskal-Wallis Test: H(4) = 95.266, p < .001, Effect size (η
2
h
) = 0.31 (large).
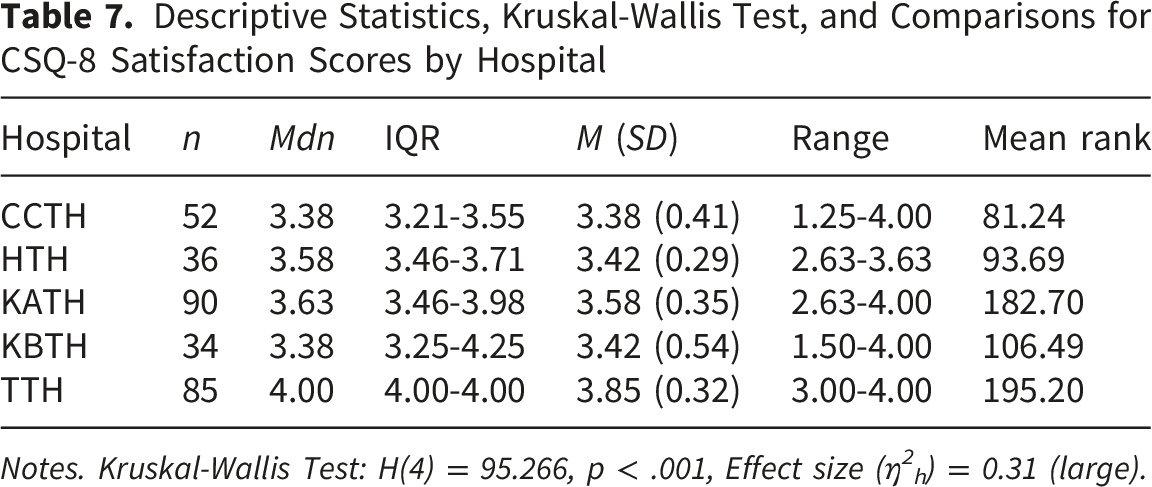
Post hoc Dunn-Bonferroni tests revealed that TTH reported significantly higher satisfaction scores than all other hospitals (adjusted p < .001). No other pairwise comparisons reached statistical significance after correction. Overall satisfaction was high (mean CSQ-8 = 3.56 ± 0.41), with 87.9% of patients reporting satisfaction scores above the threshold of 3.0.
Pairwise Dunn-Bonferroni Comparisons for Patient Satisfaction (CSQ-8) Across Tertiary Hospitals
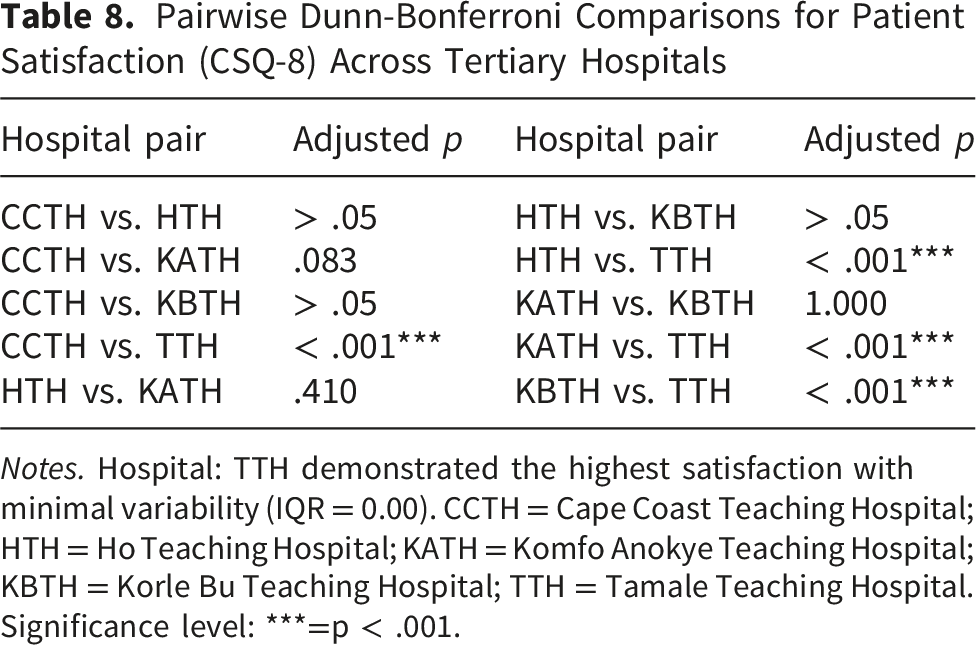
Notes. Hospital: TTH demonstrated the highest satisfaction with minimal variability (IQR = 0.00). CCTH = Cape Coast Teaching Hospital; HTH = Ho Teaching Hospital; KATH = Komfo Anokye Teaching Hospital; KBTH = Korle Bu Teaching Hospital; TTH = Tamale Teaching Hospital.
Significance level: ***=p < .001.
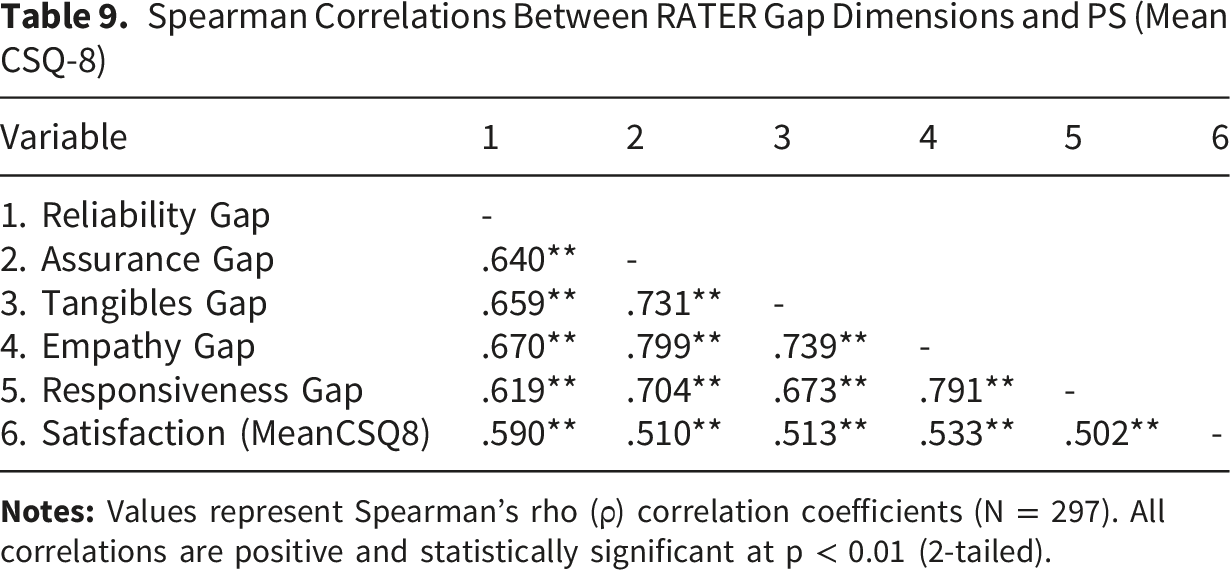
Correlation between RATER gap and CSQ-8
Spearman Correlations Between RATER Gap Dimensions and PS (Mean CSQ-8)
Predicting PS (Mean CSQ-8) in the Tertiary Hospitals
Hierarchical Generalized Linear Model (Gamma, Log Link) Predicting Patient Satisfaction (Mean CSQ-8) in Ghana’s Tertiary Hospitals
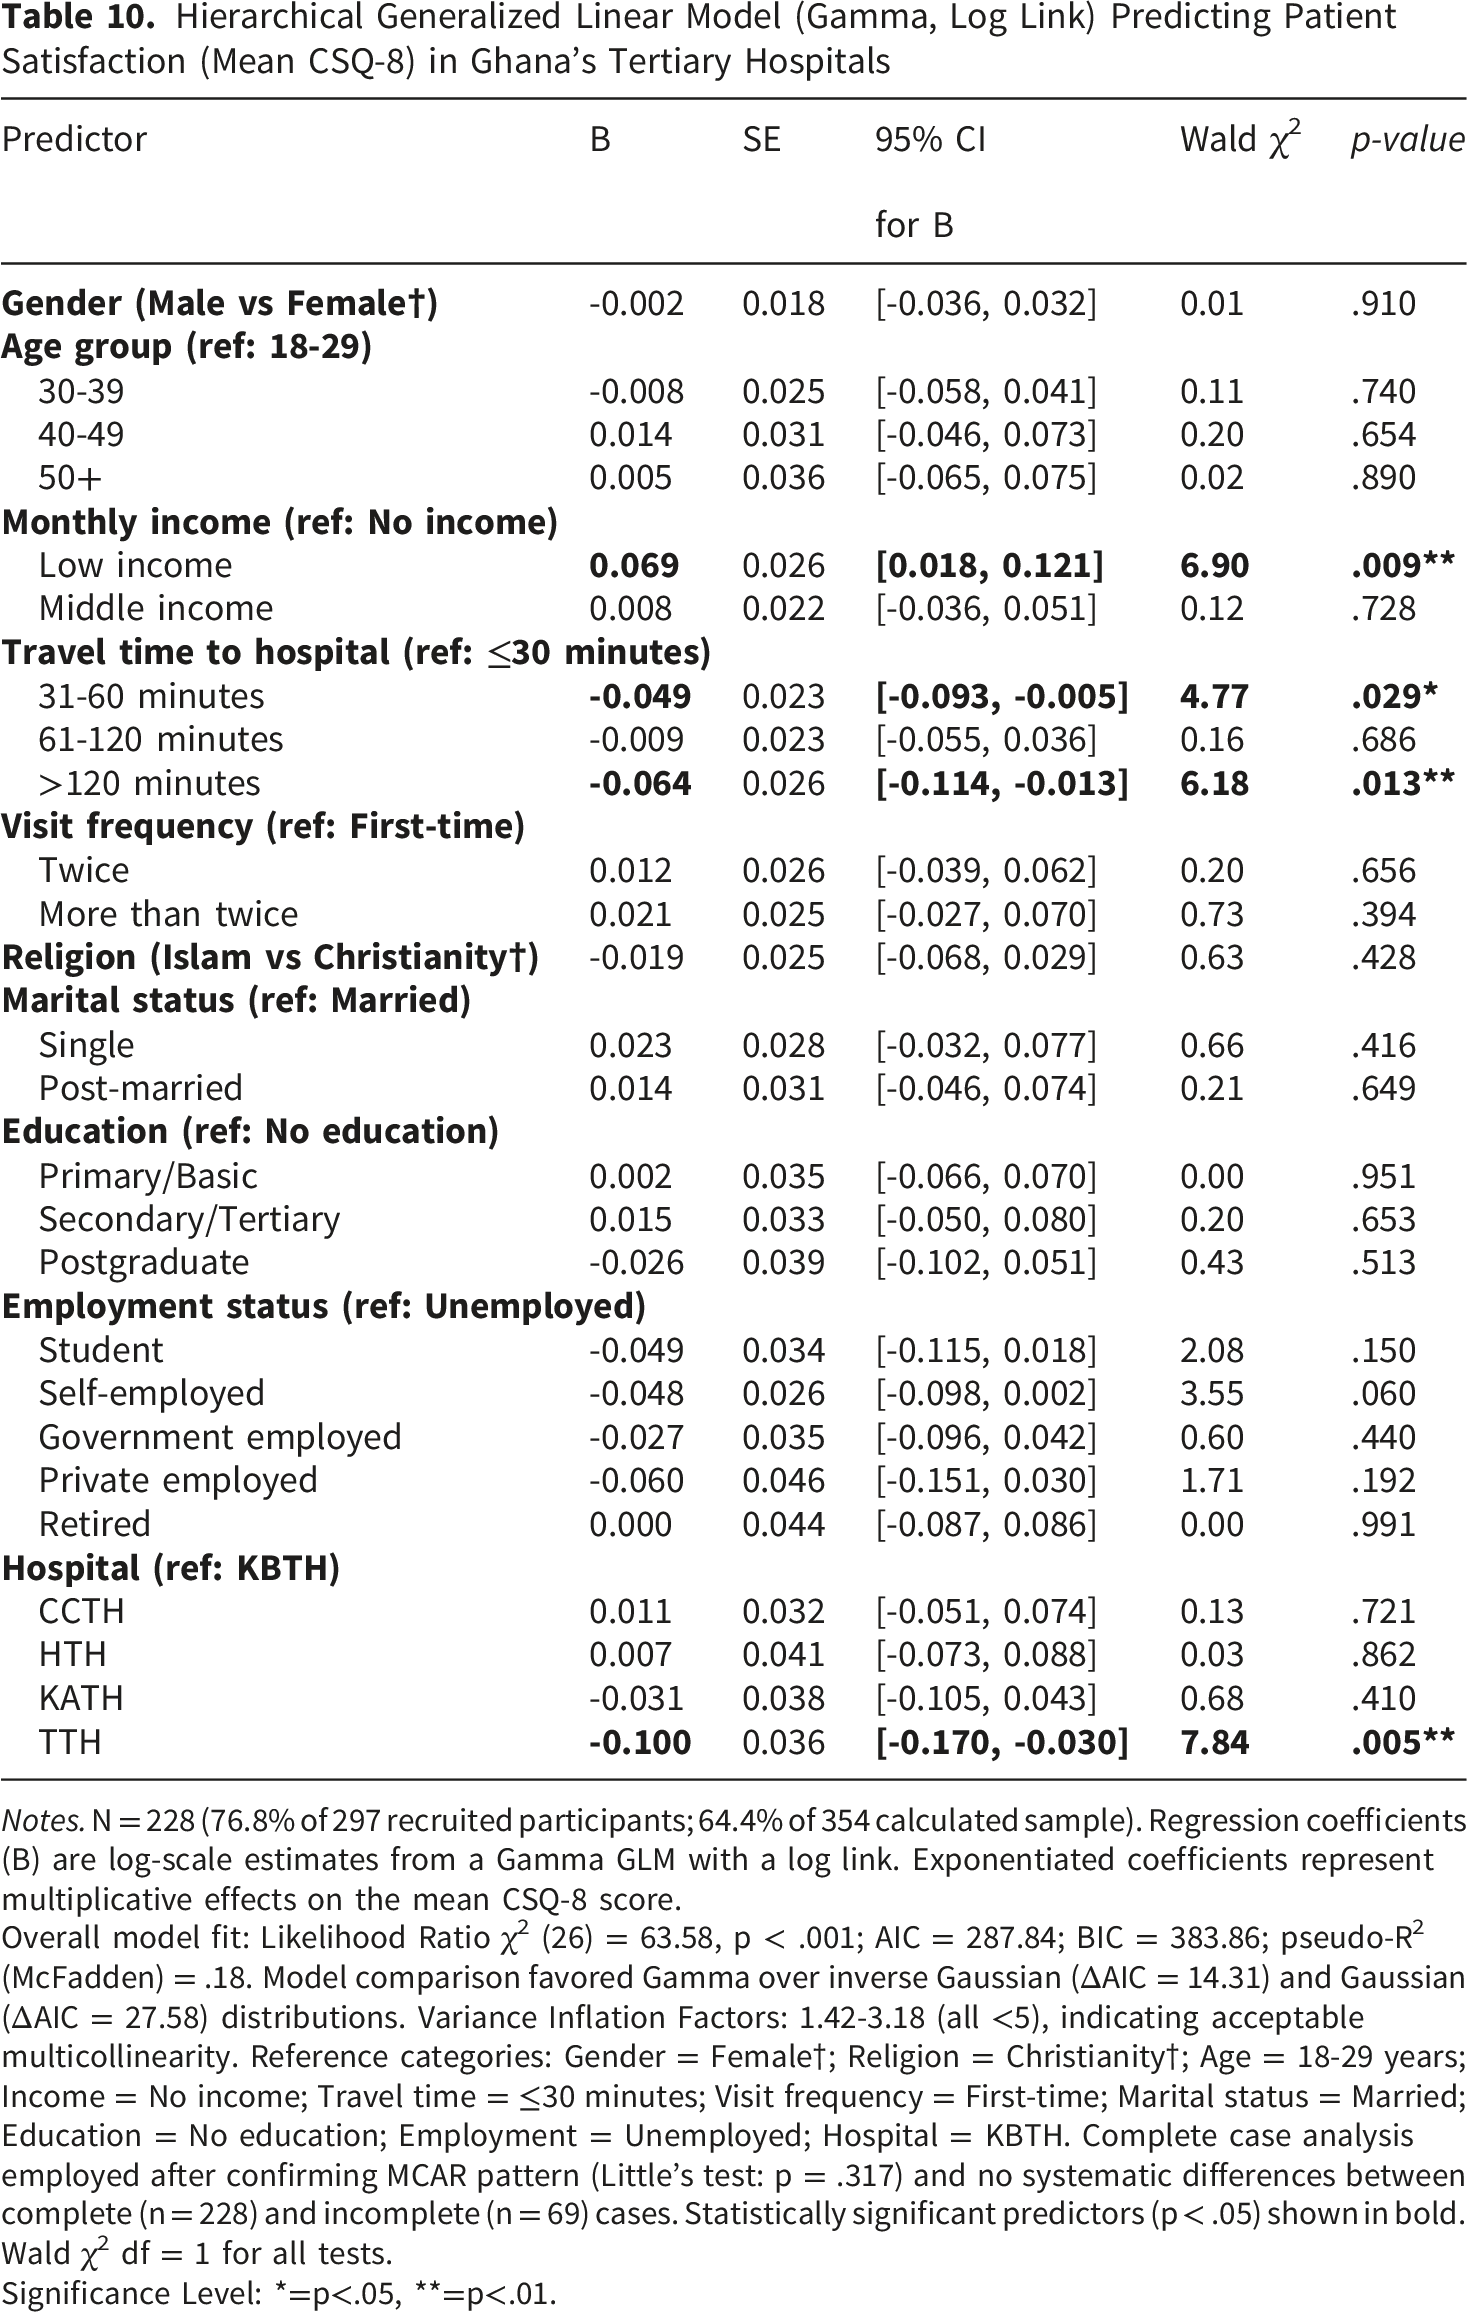
Notes. N = 228 (76.8% of 297 recruited participants; 64.4% of 354 calculated sample). Regression coefficients (B) are log-scale estimates from a Gamma GLM with a log link. Exponentiated coefficients represent multiplicative effects on the mean CSQ-8 score.
Overall model fit: Likelihood Ratio χ2 (26) = 63.58, p < .001; AIC = 287.84; BIC = 383.86; pseudo-R2 (McFadden) = .18. Model comparison favored Gamma over inverse Gaussian (ΔAIC = 14.31) and Gaussian (ΔAIC = 27.58) distributions. Variance Inflation Factors: 1.42-3.18 (all <5), indicating acceptable multicollinearity. Reference categories: Gender = Female†; Religion = Christianity†; Age = 18-29 years; Income = No income; Travel time = ≤30 minutes; Visit frequency = First-time; Marital status = Married; Education = No education; Employment = Unemployed; Hospital = KBTH. Complete case analysis employed after confirming MCAR pattern (Little’s test: p = .317) and no systematic differences between complete (n = 228) and incomplete (n = 69) cases. Statistically significant predictors (p < .05) shown in bold. Wald χ2 df = 1 for all tests.
Significance Level: *=p<.05, **=p<.01.
The monthly income category was significantly associated with Mean CSQ-8, with the low-income category showing a positive coefficient relative to the reference group (B = 0.069, SE = 0.026, 95% CI [0.018, 0.121], p = .009). Travel time to the tertiary facility was also associated with Mean CSQ-8, with moderate access (31-60 minutes) (B = -0.049, SE = 0.023, 95% CI [-0.093, -0.005], p = .029) and very poor access (>120 minutes) (B = -0.064, SE = 0.026, 95% CI [-0.114, -0.013], p = .013) showing statistically significant coefficients relative to the reference category. Institutional affiliation was significantly associated with TTH compared with the reference hospital (B = -0.100, SE = 0.036, 95% CI = [-0.170, -0.030], p = .005). All other variables included in the model, gender, age group, middle income category, poor access (61-120 minutes), visit frequency, religion, marital status, education level, employment status, and other hospitals, did not reach statistical significance (p > .05). It should be noted that this adjusted institutional estimate differs in direction from the unadjusted descriptive comparison. Whereas TTH recorded the highest crude satisfaction in the descriptive and Kruskal-Wallis analyses (Table 7), its coefficient in the fully adjusted model was negative relative to the KBTH reference category, indicating that the apparent crude advantage of TTH was attenuated, and reversed, once monthly income, travel time, and the remaining covariates were taken into account. This divergence reflects confounding of the crude institutional comparison by patient-level socioeconomic and access characteristics rather than an inconsistency in the data, and the institutional findings should therefore be interpreted in light of both the unadjusted and adjusted estimates.
Forest Plot of Predictors of PS
The forest plot in Figure 2 shows adjusted rate ratios from a gamma generalized linear model showing that most predictors have modest associations with PS, with confidence intervals frequently crossing unity. Service-related factors appear more influential than sociodemographic characteristics. Longer waiting times, particularly >120 minutes, were associated with lower PS compared with shorter waits. Income gradients were also evident: relative to participants with no income (the reference category in the adjusted model), low-income participants reported higher satisfaction, whereas the middle-income category did not differ significantly. Differences by hospital, age, gender, marital status, education, religion, and employment status are small and largely not statistically significant. Forest plot of predictors of patient satisfaction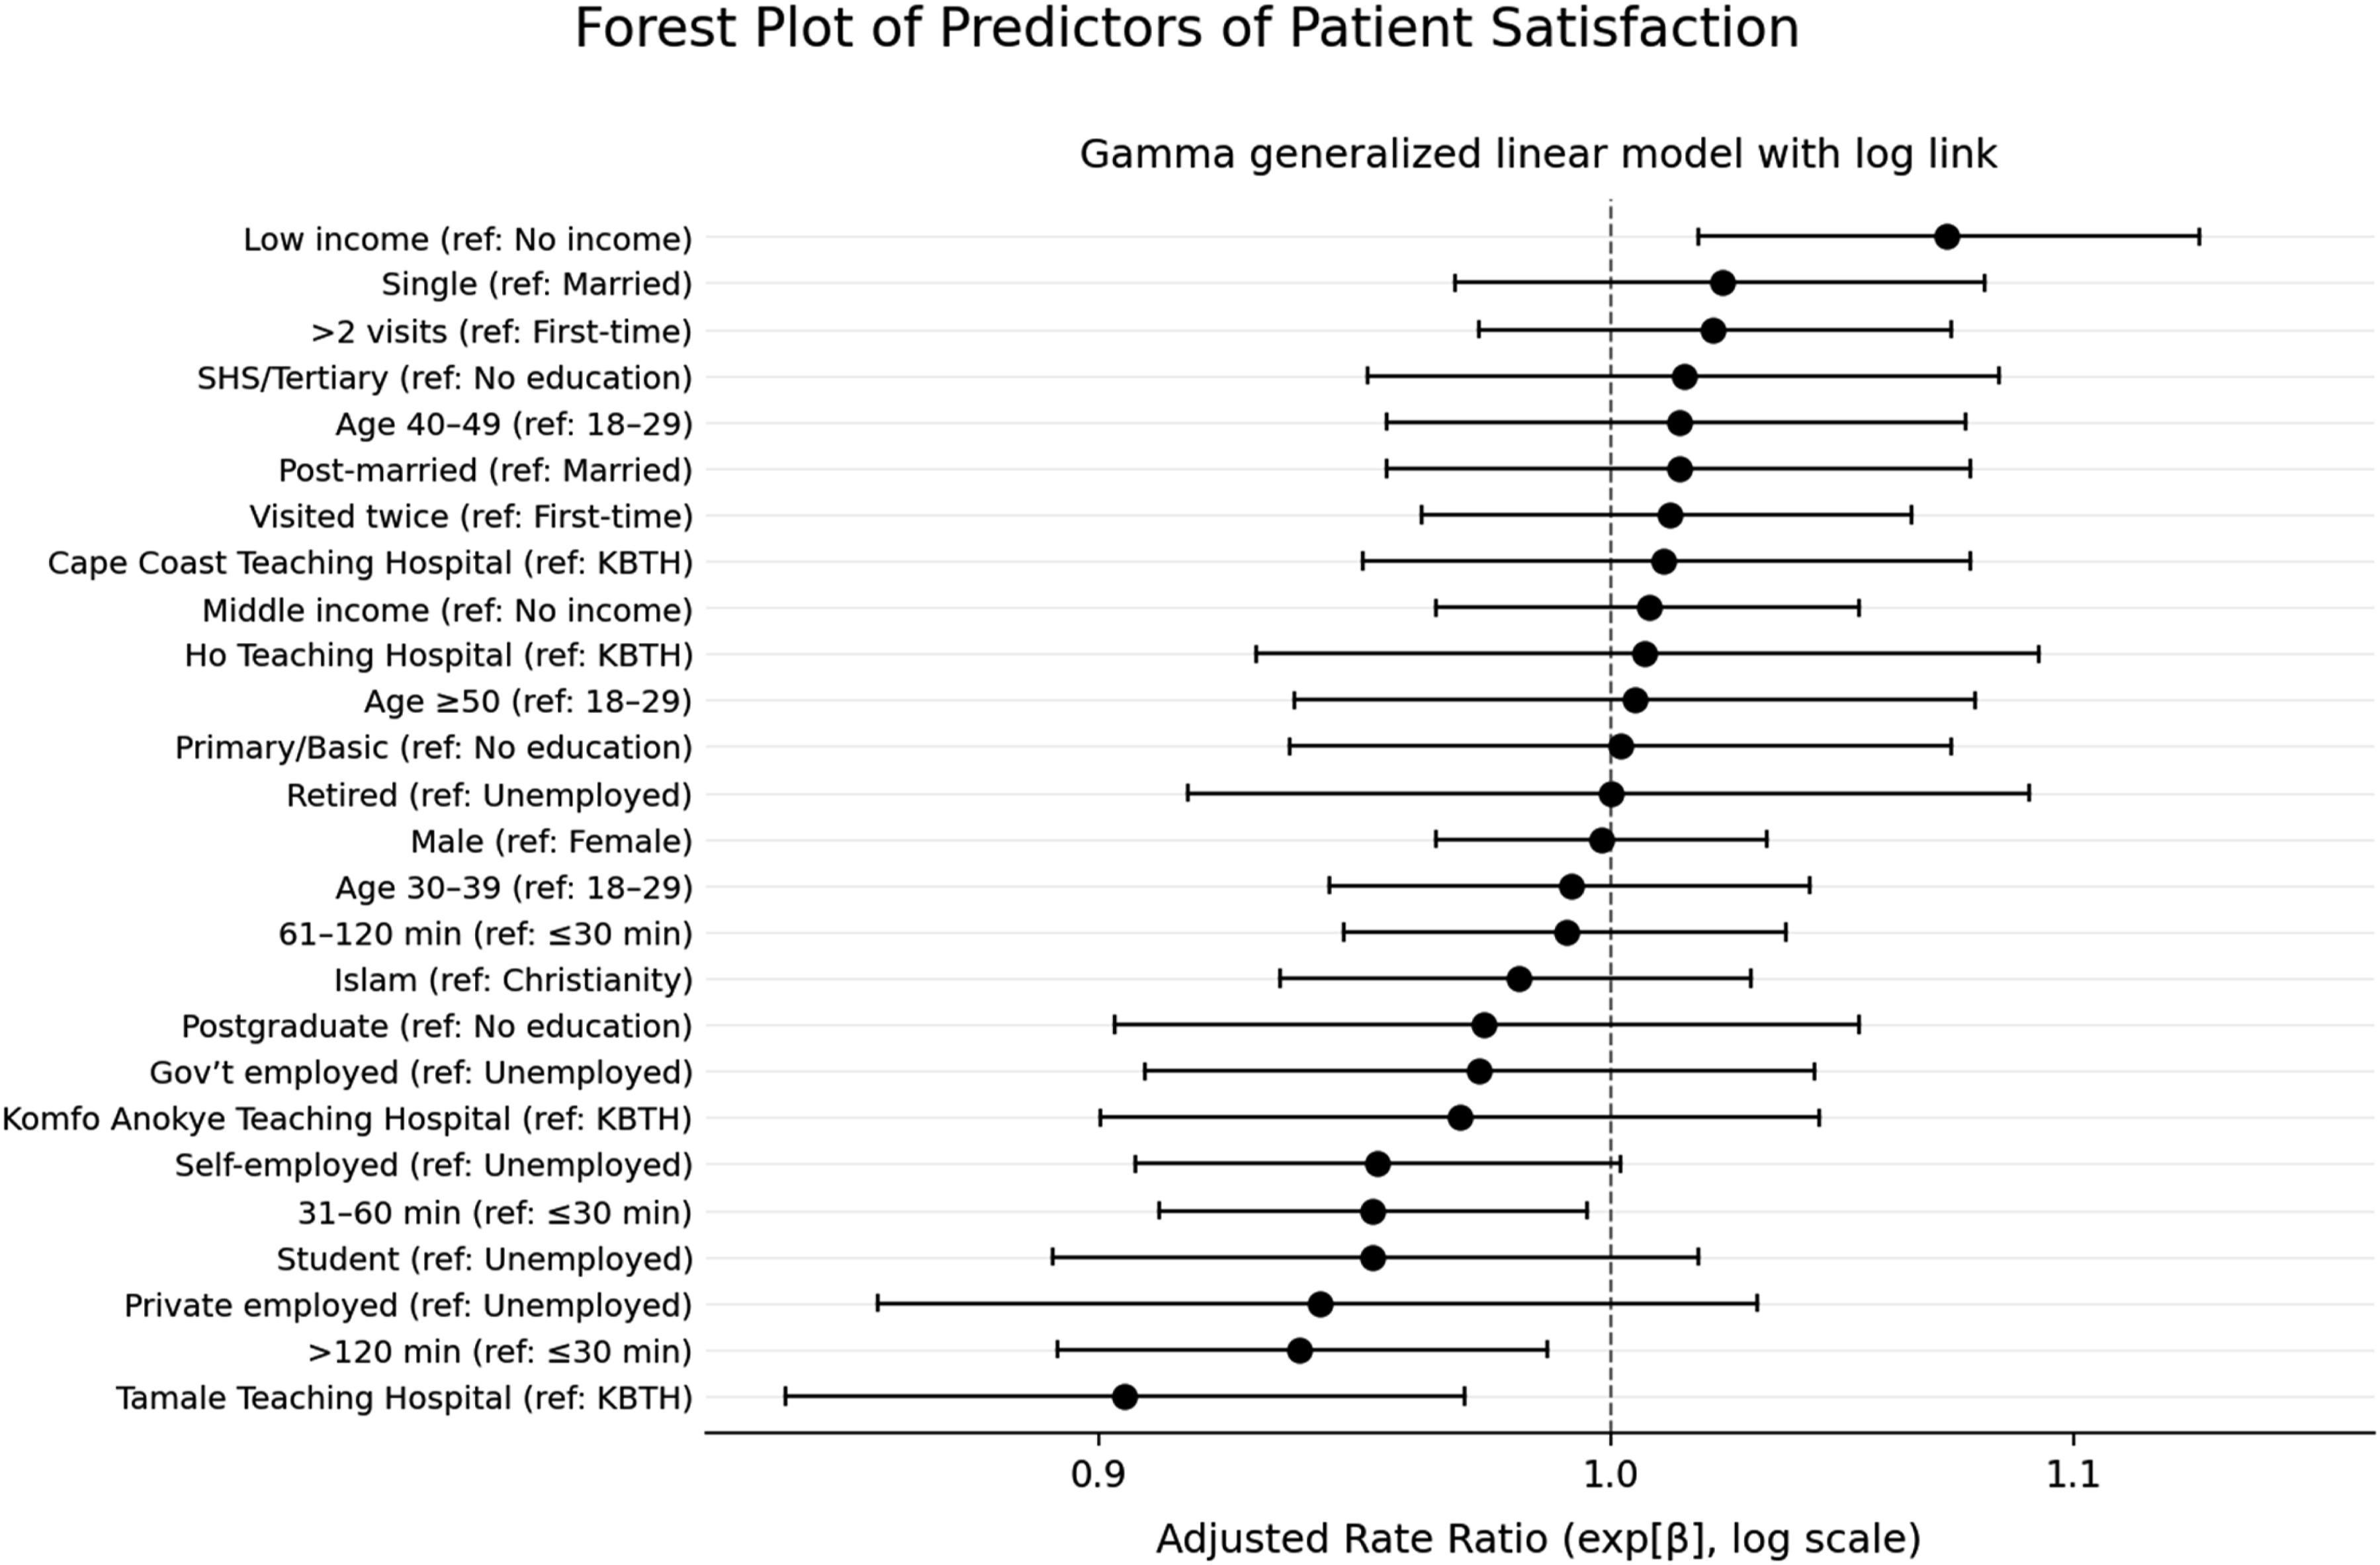
Discussion
This study achieved a strong response rate of 83.9%, indicative of high participant engagement and lending credibility to the representativeness of the sample. Despite a reduction to 228 participants with complete data due to missing income and education variables, missing data analysis confirmed no systematic bias, and post-hoc power analysis demonstrated adequate statistical power for all primary analyses.33,35,39 These methodological strengths support confidence in the substantive findings discussed below.
Our findings generally indicated that patient satisfaction in Ghana’s tertiary hospitals is generally high but unevenly distributed across institutions. Facilities such as TTH and KATH demonstrated higher satisfaction scores and narrower service-quality gaps than KBTH and CCTH in unadjusted comparisons; however, these crude institutional differences were attenuated after multivariable adjustment for patient-level socioeconomic and access characteristics, indicating that part of the apparent institutional variation reflects differences in the patient populations served rather than facility performance alone. This degree of inter-hospital variability reinforces evidence that institutional performance and service delivery processes, rather than patient sociodemographic characteristics alone, are major determinants of patient experience, and that strengthening organizational reliability and service systems is critical to advancing SDG-3 objectives. 5 The open-ended patient responses strongly corroborated this pattern, with respondents frequently attributing dissatisfaction to system-level constraints such as overcrowding, staffing shortages, and workflow inefficiencies rather than to individual provider behavior.
Across all hospitals, negative gap scores were observed for all five RATER dimensions, indicating that patient expectations consistently exceeded service experiences. Reliability emerged as the strongest predictor of patient satisfaction, consistent with the broader SERVQUAL and RATER literature, which identifies dependable, timely, and accurate service delivery as central drivers of patient experience. 40 Patient narratives provided concrete explanations for these gaps, particularly emphasizing prolonged waiting times, inconsistent appointment adherence, and perceived inequities in queue management. These experiences directly align with deficits in responsiveness and reliability, underscoring the need for targeted investments in patient flow management, triage systems, and standardized clinical processes to reduce delays and improve the consistency of care delivery.
Socioeconomic access factors, including monthly income and travel time to tertiary facilities, were also significant predictors of satisfaction, whereas most sociodemographic characteristics were not. This pattern supports the interpretation that structural and organizational constraints such as geographic accessibility, financial burden, and facility-level resource distribution mediate how patient background translates into care experiences. Patient comments regarding out-of-pocket payments despite NHIS coverage, high laboratory costs, and limited drug availability highlight persistent equity challenges and reinforce evidence from Ghana and other LMICs that access expansion alone does not guarantee high-quality or equitable care. 15 These findings are particularly salient for SDG-3 targets related to financial risk protection and people-centered health systems.
Importantly, despite systemic challenges, patients consistently expressed positive perceptions of healthcare workers’ attitudes, competence, and communication skills, supporting relatively stronger performance in the Assurance and Empathy dimensions. Recurrent affirmations such as “the nurses and doctors are good at their job” suggest that frontline providers often deliver care under considerable constraints, and that dissatisfaction is largely driven by system-level limitations rather than provider-patient interactions.
From a policy and practice perspective, these findings have clear implications. At the national level, Ghana’s Ministry of Health and the Ghana Health Service should incorporate patient satisfaction and HSQ benchmarks into health-sector performance reviews as formal accountability measures for tertiary hospitals. Publishing annual hospital quality scorecards would promote transparency, drive improvement, and support evidence-based resource allocation. At the institutional level, hospital management should focus on operational reforms to improve reliability and responsiveness. Key actions include digital appointment and queue systems to reduce waiting times, structured patient flow protocols in high-volume outpatient departments, and routine service audits with feedback to clinical teams. Establishing patient experience committees with both staff and patient representation can further support participatory quality improvement.
Infrastructure investment should prioritize stable power supply (e.g., solar backup), expanded diagnostic capacity at regional teaching hospitals to reduce transfers, and improved waiting and sanitation facilities. These investments should be distributed equitably across all tertiary hospitals, rather than concentrated on facilities like KBTH, to reduce disparities. Sustaining quality improvements also requires healthcare worker incentives. Policies should include performance-linked pay tied to patient experience, non-financial recognition, protected time for professional development, and mental health support for frontline staff. Together, these measures provide a practical pathway for translating study findings into improved patient-centred care and progress toward SDG 3. 5 Future research should build on these findings using longitudinal or repeated cross-sectional designs to track whether quality improvement interventions translate into sustained changes in patient satisfaction over time. Mixed-method approaches that combine patient-reported experience data with objective process metrics such as actual waiting times, staffing ratios, stockout frequencies, and laboratory turnaround times would strengthen causal inference and provide a richer basis for quality improvement. Multi-level studies that simultaneously examine patient, provider, and facility-level determinants of satisfaction across primary, secondary, and tertiary care levels are also warranted, as are comparisons with private-sector facilities to contextualize public hospital performance within Ghana’s mixed health system.
Study Limitations and Strengths
This study has several limitations. First, although the 83.9% response rate exceeded conventional benchmarks and post-hoc power analysis confirmed adequate power, the 23.2% incomplete data rate may introduce selection bias despite no systematic differences between complete and incomplete cases (MCAR, p = .317). Second, the cross-sectional design precludes causal inference. Third, self-reported measures may introduce response bias and social desirability effects, with no objective quality indicators for triangulation. Fourth, the five-dimension RATER framework, while pragmatic, provides limited psychometric precision compared to comprehensive quality assessments. Fifth, ceiling effects in expectations (median = 7.0) may have attenuated variability in the gap score. Sixth, sampling was limited to five of six teaching hospitals (83%), excluding Sunyani due to recent inauguration, restricting generalizability beyond public academic medical centers. Finally, unmeasured institutional characteristics may confound observed hospital effects. These include structural factors such as bed capacity and occupancy rates, staffing ratios and skill mix, accreditation status, age and maintenance levels of physical infrastructure, availability of diagnostic equipment, and adoption of electronic health records or health information systems. Management quality, organizational culture, and the proportion of patients covered by the NHIS versus out-of-pocket payers may also vary across hospitals in ways not captured in this study, and future research should seek to account for these factors through facility-level audits or administrative data linkage.
Despite these limitations, this study provides valuable multi-institutional evidence on patient satisfaction and healthcare quality in Ghana’s public teaching hospitals, with implications for targeted quality improvement interventions aligned with SDG 3 objectives. The high response rate (83.9%), adequate statistical power, and large observed effect sizes strengthen confidence in the substantive findings.
Conclusion
Patient satisfaction in Ghana’s tertiary hospitals is generally high but marked by significant inter-hospital disparities. Satisfaction is primarily driven by institutional performance and service reliability rather than by patients’ sociodemographic characteristics. Persistent negative HSQ gaps across all RATER dimensions indicate that patient expectations exceed the care experienced, highlighting systemic shortcomings in service delivery.
Strengthening reliability, responsiveness, and equitable access across tertiary hospitals is critical for improving patient-centred care and advancing SDG 3. Achieving this requires coordinated, system-level quality improvement efforts that combine governance reform, infrastructure investment, operational redesign, and workforce incentives. Such an approach is essential for reducing institutional inequities and ensuring that increased healthcare access translates into consistently high-quality, people-centered care.
Supplemental Material
Supplemental Material - A Multi-Hospital Assessment of Healthcare Service Quality and Patient Satisfaction in Ghana’s Tertiary Hospitals: Implications for Sustainable Development Goal 3
Supplemental Material for A Multi-Hospital Assessment of Healthcare Service Quality and Patient Satisfaction in Ghana’s Tertiary Hospitals: Implications for Sustainable Development Goal 3 by Michael Darko Ashaley, Thompson Jacob Asare, Kissinger Marfo, Asare Offei, Mark Tiboah Appiah, Gloria Amy Kumi, Veronica Adwubi, Godsway Solomon Attepor, Ivana Abena Adzigbli, Osaro Mgbere, James Edward Mensah and Stephen T. Odonkor in Health Services Insights.
Supplemental Material
Supplemental Material - A Multi-Hospital Assessment of Healthcare Service Quality and Patient Satisfaction in Ghana’s Tertiary Hospitals: Implications for Sustainable Development Goal 3
Supplemental Material for A Multi-Hospital Assessment of Healthcare Service Quality and Patient Satisfaction in Ghana’s Tertiary Hospitals: Implications for Sustainable Development Goal 3 by Michael Darko Ashaley, Thompson Jacob Asare, Kissinger Marfo, Asare Offei, Mark Tiboah Appiah, Gloria Amy Kumi, Veronica Adwubi, Godsway Solomon Attepor, Ivana Abena Adzigbli, Osaro Mgbere, James Edward Mensah and Stephen T. Odonkor in Health Services Insights.
Supplemental Material
Supplemental Material - A Multi-Hospital Assessment of Healthcare Service Quality and Patient Satisfaction in Ghana’s Tertiary Hospitals: Implications for Sustainable Development Goal 3
Supplemental Material for A Multi-Hospital Assessment of Healthcare Service Quality and Patient Satisfaction in Ghana’s Tertiary Hospitals: Implications for Sustainable Development Goal 3 by Michael Darko Ashaley, Thompson Jacob Asare, Kissinger Marfo, Asare Offei, Mark Tiboah Appiah, Gloria Amy Kumi, Veronica Adwubi, Godsway Solomon Attepor, Ivana Abena Adzigbli, Osaro Mgbere, James Edward Mensah and Stephen T. Odonkor in Health Services Insights.
Footnotes
Acknowledgment
We would like to acknowledge the management of the hospital facilities stated above for providing us with all the necessary assistance during data collection.

Author Contribution
MDA served as the Principal Investigator and corresponding author, and was responsible for the study concept and design, data analysis and interpretation, and manuscript drafting and submission. KM and OM contributed to the study design, analysis, and development of the conceptual framework. GSA, MA, VA, IAA, and AK were responsible for data management and data collection. SO and TA, as official supervisors, contributed to the development of the study concept, provided methodological and intellectual guidance, and critically reviewed the manuscript for important intellectual content. JEM and AO provided overall facility supervision and oversight of the research process. All authors reviewed and approved the final manuscript. The corresponding author confirms that all listed authors meet authorship criteria and that no eligible contributors have been omitted.
Funding
The authors received no financial support for the research, authorship, and/or publication of this article.
Declaration of Conflicting Interests
The authors declared no potential conflicts of interest with respect to the research, authorship, and/or publication of this article.
Data Availability Statement
Dataset available upon request from the corresponding author.
Supplemental Material
Supplemental material for this article is available online.
References
Supplementary Material
Please find the following supplemental material available below.
For Open Access articles published under a Creative Commons License, all supplemental material carries the same license as the article it is associated with.
For non-Open Access articles published, all supplemental material carries a non-exclusive license, and permission requests for re-use of supplemental material or any part of supplemental material shall be sent directly to the copyright owner as specified in the copyright notice associated with the article.
