
Abstract
Background
The incidence of papillary thyroid cancer (PTC) has risen sharply over the past several decades. Early identification of high-risk PTC is crucial to mitigate the societal burden associated with its overdiagnosis. ER-phagy, a selective form of autophagy targeting the endoplasmic reticulum, is categorized into macro-ER-phagy and micro-ER-phagy. To date, the role of ER-phagy receptors and their impact on risk stratification and progression in thyroid cancer remain unclear.
Methods
This study employed an integrative approach combining bioinformatics analysis with wet-lab molecular biology experiments. Transcriptomic and clinical data from TCGA were processed using Xiantaoxueshu, GSCA, TIMER, and TISIDB platforms to assess differential expression, survival, ROC characteristics, and KEGG/GO enrichment, as well as immune infiltration. In vitro, shRNAs targeting RTN3, SEC62, or ATL3 were transfected into TPC-1 and CAL-62 cells to silence gene expression, validated by RT-qPCR and Western Blot. Cell proliferation, migration, and invasion were assessed by CCK-8, EdU, colony formation, wound healing, and Transwell assays. All experiments were performed in at least three independent replicates, and the resulting data were subjected to statistical analysis. Data were analyzed using SPSS 18.0 and GraphPad Prism 9.3.0. Quantitative results are presented as mean ± SEM. Independent-samples t-tests, univariate/multivariate Cox regression and LASSO Cox regression were used; P < 0.05 was considered significant.
Results
Comprehensive analysis of all ER-phagy receptors using public databases revealed that several receptors significantly impact the diagnosis and prognosis of thyroid cancer. We also characterized the mutation and methylation pattern of these receptors. Furthermore, these genes were also closely associated with immune infiltration in thyroid cancer. Of note, RTN3, SEC62 and ATL3 appeared to have distinct importance in thyroid cancer. All three genes were downregulated and their reduced expression was significantly related to poor survival in thyroid cancer. Receiver Operating Characteristic (ROC) curve analysis demonstrated that these markers hold substantial promise for thyroid cancer diagnosis, particularly RTN3 and SEC62. Immune-related analysis indicated a strong correlation with immune infiltration, implying a potential role in modulating the immune landscape of thyroid cancer. Functional assays demonstrated that knockdown of RTN3, SEC62, and ATL3 promoted proliferation and metastasis of thyroid cancer cells in vitro. Western blot analysis indicated that this process is likely mediated by the Epithelial-Mesenchymal Transition (EMT).
Conclusion
In summary, our findings indicate that ER-phagy represents a promising avenue for thyroid cancer diagnosis. Specifically, RTN3, SEC62, and ATL3 were found to suppress the proliferation and metastasis of thyroid cancer cells, underscoring their pivotal roles in disease progression.
1. Introduction
Thyroid cancer is the most prevalent malignancy of the endocrine system. 1 Among all the pathological types, although differentiated thyroid cancer has a better prognosis in general, there are still some highly aggressive or iodine-refractory thyroid cancers that are challenging to treat. Patients with lymph node metastasis, extrathyroidal extension or distant metastasis have impaired prognosis and risk of recurrence.2,3 Potential molecular markers can be used to distinguish high risk thyroid cancer patients and individualize their treatment. Such stratification would be beneficial to the rational allocation of medical resources and further improve the treatment of thyroid cancer.4,5 In thyroid cancer, autophagy represents a significant area of research, and its role in tumor initiation and progression is being intensively investigated. 6 In recent years, several studies revealed that ER-phagy receptor SEC62 was associated with aggressive behavior of thyroid cancer.7,8 However, studies on ER-phagy in thyroid cancer remain scarce.
ER-phagy refers specifically to a type of autophagy that occurs in the endoplasmic reticulum (ER), a term first proposed by Bernales S, et al in 2006. 9 The ER is one of the largest organelles in eukaryotic cells. Under normal conditions, ER-phagy maintains the dynamic homeostasis of the ER. Under conditions of nutrient deprivation and hypoxia, ER stress occurs and ER-phagy is thus triggered to mitigate the detrimental effects of stress, thereby preserving the normal function of the ER and cellular integrity.10,11 Dysregulation of ER-phagy has been associated with a variety of disease processes, including sensory neuropathies, viral infections, motor system disorders, and tumors.12-16 Its mechanistic underpinnings involve several critical aspects, including the maintenance of endoplasmic reticulum (ER) homeostasis, the regulation of autophagy, the adaptive fitness of tumor cells, and the facilitation of immune evasion.6,17 Autophagy is an evolutionarily conserved intracellular degradation pathway that maintains cellular homeostasis through the clearance of damaged organelles and protein aggregates. 18 Upon impairment of endoplasmic reticulum (ER) function and the consequent accumulation of unfolded or misfolded proteins, cells activate the unfolded protein response (UPR) and ER-phagy to restore ER homeostasis.19,20 Existing studies have demonstrated that the role of ER-phagy in tumors is more complex and may play an oncogenic or tumor-promoting role depending on the tumor type or stage.20-22
Depending on the degradation pathway involved, ER-phagy is classified into two types: macro-ER-phagy and micro-ER-phagy. It is generally accepted that micro-ER-phagy is a nonselective process in which portions of the endoplasmic reticulum are directly engulfed as a substrate by lysosomes or lysosomal membrane depressions, whereas macro-ER-phagy occurs as a selective process requiring the participation of ER-phagy receptors. Macro-ER-phagy is the main degradation mechanism, and through the action of receptors and related molecules, a double-membrane structure, the phagophore, forms around the ER cargo and encapsulates the cargo, which is then sequestered from the rest of the endoplasmic reticulum and subsequently fuses with lysosomes to enter the subsequent degradation steps. 23 To date, eight membrane-anchored ER-phagy receptors have been identified in mammalian cells: the family with sequence similarity 134 member A/B/C (FAM134A/FAM134B/FAM134C, encoded by RETREG2/RETREG1/RETREG3), translocation protein SEC62 (SEC62), reticulon 3 (RTN3), cell-cycle progression gene 1 (CCPG1), atlastin GTPase 3 (ATL3), and testis-expressed protein 264 (TEX264). Moreover, there are three soluble ER-phagy receptors in mammals: calcium-binding and coiled-coil domain-containing protein 1 (CALCOCO1), CDK5 regulatory subunit-associated protein 3 (C53), and sequestosome 1 (p62/SQSTM1). 16 ER-phagy receptors are pivotal mediators of selective ER-phagy, functioning by recognizing and recruiting specific ER subdomains to form autophagosomes.19,24 These receptors facilitate the selective delivery of ER fragments to lysosomes by interacting with members of the LC3/GABARAP protein family on the autophagosomal membrane.19,25 Accumulating evidence suggests that these receptors play critical roles in cancer pathophysiology.8,26,27
To further investigate the role of ER-phagy in thyroid cancer, we utilized bioinformatics methods to screen three of the eleven known ER-phagy receptors as potential molecular markers and evaluated their potential in thyroid cancer pathogenesis.
2. Materials and Methods
2.1. Cell Culture and Transfection
The human thyroid papillary cancer cell line TPC-1 (RRID: CVCL_6298) and human anaplastic thyroid carcinoma cell line CAL-62(RRID: CVCL_1112) were purchased from the Cell Bank of the Chinese Academy of Sciences (CAS). Cell lines were authenticated by unique short tandem repeats (STRs) reported in the Leibniz Institute DSMZ. Both TPC-1 and CAL-62 cells were cultured in Dulbecco’s modified Eagle’s medium (Gibco, Karlsruhe, Germany) containing 10% fetal bovine serum (FBS; Gibco, Karlsruhe, Germany) in a humidified environment with 5%
For gene silencing, cells were seeded at a density of 2×
2.2. CCK8 Cell Proliferation Assay
Cell Counting Kit-8 (CCK8) (Dojindo, Japan) was used to evaluate cell proliferation. Cells were seeded at a density of 1,000 cells/well in 96-well plates. Cell proliferation was assessed at 24, 48, 72, 96, and 120 h, and the absorbance of each sample was measured to determine the proliferation level.
2.3. EdU Cell Proliferation Assay and Imaging
Cells were seeded at a density of 1×
2.4. Cloning Formation Assay
Cells were seeded at a density of 1000 cells/well in 6-well plates. The cells were cultured for approximately 10 days until the number of colonies in most wells exceeded 50. The cells were washed with PBS and fixed with 4% paraformaldehyde for 30 min. The cells were stained with 0.1% crystal violet solution for 20 min. The cells were washed with distilled water until the excess stain was removed. The plates were dried and the colonies were counted and photographed.
2.5. Wound Healing Assay
Cells were seeded evenly at a density of 5×
2.6. Transwell Assay
A Transwell migration assay was performed using the BD Falcon FluoBlok system (BD, NJ) in 24-well inserts. The cells were digested and counted to adjust the concentration to 1×
A Transwell invasion assay was performed using the same system. Matrigel (Sigma, USA) was prepared at a concentration of 0.5μg/μL. 50μL of Matrigel was added to the upper chamber and allowed to solidify at 37°C for at least 5 h. Before use, 50μL of FBS-free medium was added to each chamber to briefly hydrate the surface of the Matrigel, after which the liquid was removed. Subsequently, cell counting, seeding, and culture were performed as described above. After 48 h, the cells were fixed and stained. Invasive cells were finally analyzed under an inverted phase-contrast microscope.
2.7. Reverse-Transcriptional Quantitative Real-Time Polymerase Chain Reaction (RT-qPCR)
mRNA was isolated from each group of cells by using Trizol (Takara, Japan), chloroform and isopropanol. Reverse transcription was performed with 5× qRT SuperMix II (Vazyme, China). The SYBR Premix Ex Taq kit (Takara, Japan) was used for quantitative real-time PCR of RTN3, SEC62, and ATL3 (Primers of qPCR were attached in Supplementary Table 1) on a Real-time fluorescence quantitative PCR instrument (Bio-Rad, US). The method of 2−ΔΔCT was conducted using GAPDH as a standard and the values were then normalized to each group transfected with shNC.
2.8. Western Blot
Proteins were extracted from each group of cells with lysis solution (Beyotime, China) and measure the concentration with BCA Kit (Beyotime, China). 10% resolving and 5% stacking gel were prepared with SDS-PAGE gel kit (Beyotime, China). Dilute protein samples with 5× protein loading buffer (Beyotime, China). Proteins were separated by SDS-PAGE and subsequently transferred to PVDF membranes. Membranes were blocked with blocking buffer (5% skim milk in TBS-T) at room temperature for one hour, and then incubated with diluted primary antibodies at 4°C with gentle shaking overnight. The primary antibodies were diluted with Western primary antibody dilution solution (P0023A, Beyotime, China) to the corresponding concentration with Western primary antibody dilution solution as follows: anti-SEC62 (A18589, ABclonal, China; 1:1000), anti-RTN3 (No. 12055-2-AP, Proteintech, China; 1:1000), anti-ATL3 (No. 16921-1-AP, Proteintech, China; 1:1000), anti-PERK (A27664, ABclonal, China; 1:1000), anti-Phospho-PERK (AP1501, ABclonal, China; 1:1000), anti-LC3 (No. 14600-1-AP, ABclonal, China; 1:1000), anti-ZO-1 (No. 21773-1-AP, ABclonal, China; 1:1000), anti-E-cadherin (A3044, Abclonal, China; 1:1000), anti-N-cadherin (A3045, Abclonal, China; 1:1000), anti-β-catenin (A19657, Abclonal, China; 1:1000), anti-Vimentin (A2584, Abclonal, China; 1:1000), anti-SNAI1 (A5243, Abclonal, China; 1:1000) and anti-GAPDH (A19056, Abclonal, China; 1:2000). After samples were washed with TBS-T, the membranes were incubated with appropriate secondary antibodies diluted with 5% skim milk in TBS-T as follows: HRP-labeled Goat Anti-Rabbit IgG (A0208, Beyotime, China; 1:3000) and HRP-labeled Goat Anti-Mouse IgG (A0216, Beyotime, China; 1:3000). Protein bands were visualized with an HRP-ECL luminescent liquid kit (Beyotime, China) using a ChemiDocXRS+ imaging system (Bio-Rad, US). The density of each band was normalized to the corresponding GAPDH loading control. All experiments were repeated at least three times.
2.9. Bioinformatic Analysis
The Cancer Genome Atlas Thyroid Cancer(TCGA-THCA) (https://www.cancer.gov/about-nci/organization/ccg/research/structural-genomics/tcga) dataset is a comprehensive public database primarily focused on papillary thyroid carcinoma. It encompasses multi-dimensional genomic data and detailed clinical annotations from thyroid cancer patients, covering both tumor tissues and matched adjacent normal tissues. In this study, we retrieved RNA sequencing expression profiles along with corresponding clinicopathological information from the TCGA database. The final dataset comprised 510 tumor samples and 58 adjacent normal tissue samples. Bioinformatics online analysis tools of Xiantaoxueshu (https://www.xiantao.love/) were utilized to perform gene expression difference analysis, Kaplan-Meier survival analysis, receiver operating characteristic curve (ROC) analysis and KEGG/GO enrichment analysis. The Gene Set Cancer Analysis (GSCA) database (https://bioinfo.life.hust.edu.cn/GSCA/#/) was used to analyze differentially expressed genes (DEGs), single-nucleotide variation (SNV), copy number variation (CNV) and DNA methylation of genes in thyroid cancer using the Expression and Mutation modules.
Immune infiltration analysis was performed using Xiantaoxueshu (https://www.xiantao.love/). The association between genes and immune infiltration was analyzed with TIMER database (https://cistrome.shinyapps.io/timer/). The relationship between genes and immune-related molecules expression levels and immune subtypes of thyroid cancer was analyzed using TISIDB database (https://cis.hku.hk/TISIDB/index.php/).
2.10. Statistical Analysis
The experimental data in this study were analyzed using SPSS 18.0 software (SPSS Inc., Chicago, IL) and GraphPad Prism 9.3.0. Quantitative data are presented as the mean±SEM.
Continuous variables were tested for normality and subsequently analyzed using the independent-samples Student's t-test. Univariate and multivariate Cox proportional hazards regression analyses were performed to evaluate prognostic variables, including age, gender, stage, and eleven ER-phagy receptors. A p-value < 0.05 was considered statistically significant. To further identify independent prognostic biomarkers, Least Absolute Shrinkage and Selection Operator (LASSO) Cox regression analysis was performed on clinicopathological data using R software. The optimal lambda value and cross-validated error plots were obtained.
Univariate Cox regression analysis was initially performed to assess the association between individual variables and survival outcomes. Variables yielding a P-value < 0.05 were retained for further modeling. This threshold was selected to minimize the risk of excluding potentially relevant predictors. Given the potential multicollinearity among covariates and the high dimensionality of the data, traditional stepwise multivariate selection was deemed unsuitable due to the risk of model instability and overfitting. Therefore, the Least Absolute Shrinkage and Selection Operator (LASSO) Cox regression method was employed to construct a robust and parsimonious prognostic model. By imposing an L1 penalty on the regression coefficients, LASSO shrinks specific coefficients to zero, thereby facilitating automatic variable selection and reducing model complexity. The proportional hazards assumption was evaluated using Schoenfeld residuals, and no significant violations were observed, supporting the validity of the model. All statistical analyses were performed using R software (Version 4.5.2; R Foundation for Statistical Computing). Missing data were addressed via multiple imputation, contingent upon the extent and pattern of missingness.
This study did not perform a priori sample size calculation, as the data were extracted from a public database. The sample size was determined by data availability.
Statistical figures were generated using GraphPad Prism 9.3.0. Statistical significance is indicated as follows: *p < 0.05, **p < 0.01, ***p < 0.001, and ****p < 0.0001; ns denotes not significant. All experiments were repeated at least three times.
3. Results
3.1. RTN3, SEC62 and ATL3 Among all ER-Phagy Receptors Showed Association With Tumor Diagnosis and Prognosis in PTC
We analyzed the expression of eleven ER-phagy receptor genes in the TCGA database. Except for TEX264 and CDK5RAP3, the remaining nine genes exhibited significant differences (FDR≤0.05) (Figure 1A). Based on expression, diagnostic and prognostic analyses, ATL3, RTN3 and SEC62 were identified as the most significant ER-phagy receptors (Figure 1 and Supplementary Figures 1 and 2). Compared with normal thyroid tissue, RETREG2, RETREG3 and CALCOCO1 were significantly upregulated, whereas SEC62, RTN3, ATL3, CDK5RAP3 and TEX264 were significantly downregulated in tumors. RETREG1, CCPG1 and SQSTM1 showed no significant differences in expression between normal and tumor tissues (Supplementary Figure 1 and Figure 1B). To further explore the impact of ER-phagy receptors on survival of thyroid cancer patients, the Kaplan-Meier method was employed. SEC62 (p=0.015), RTN3 (p=0.026), CCPG1 (p=0.02) and ATL3 (p=0.026) were significantly associated with Progression-Free Survival (PFS). Results indicated that lower expression of these genes was associated with poorer patient outcomes (Supplementary Figure 1 and Figure 1C). Lower expression levels of RETREG1, SEC62, RTN3, CCPG1, ATL3, TEX264 and CDK5RAP3 were associated with advanced stage of thyroid cancer, while RETREG2, RETREG3, CALCOCO1 and SQSTM1 showed no significant association (Supplementary Figure 2 and Figure 1D). These genes are potential predictors of high-risk thyroid cancer, warranting further investigation for clinical application. Cox regression analyses were performed to investigate the potential prognostic factors of ER-phagy receptors. Univariable Cox regression analyses revealed that age (p<0.001), stage (p<0.001), RETREG2 (p=0.015) and CALCOCO1 (p=0.007) were significantly associated with OS, while age (p=0.001), gender (p=0.019), stage (p<0.001), SEC62 (p=0.026) and CCPG1 (p=0.03) were significantly associated with PFS. However, multivariable regression analyses showed no significant factors among the ER-phagy receptors in either OS or PFS (Supplementary Table 2). ROC curves revealed that the AUCs of 10 receptor genes, except for SQSTM1, were all above 0.5 (Supplementary Figure 2). Of note, ATL3 (AUC=0.619), RTN3 (AUC=0.801), and SEC62 (AUC=0.820) showed particular potential in diagnosis of thyroid cancer (Figure 1E). RTN3, SEC62 and ATL3 serve as diagnostic and prognostic predictors for PTC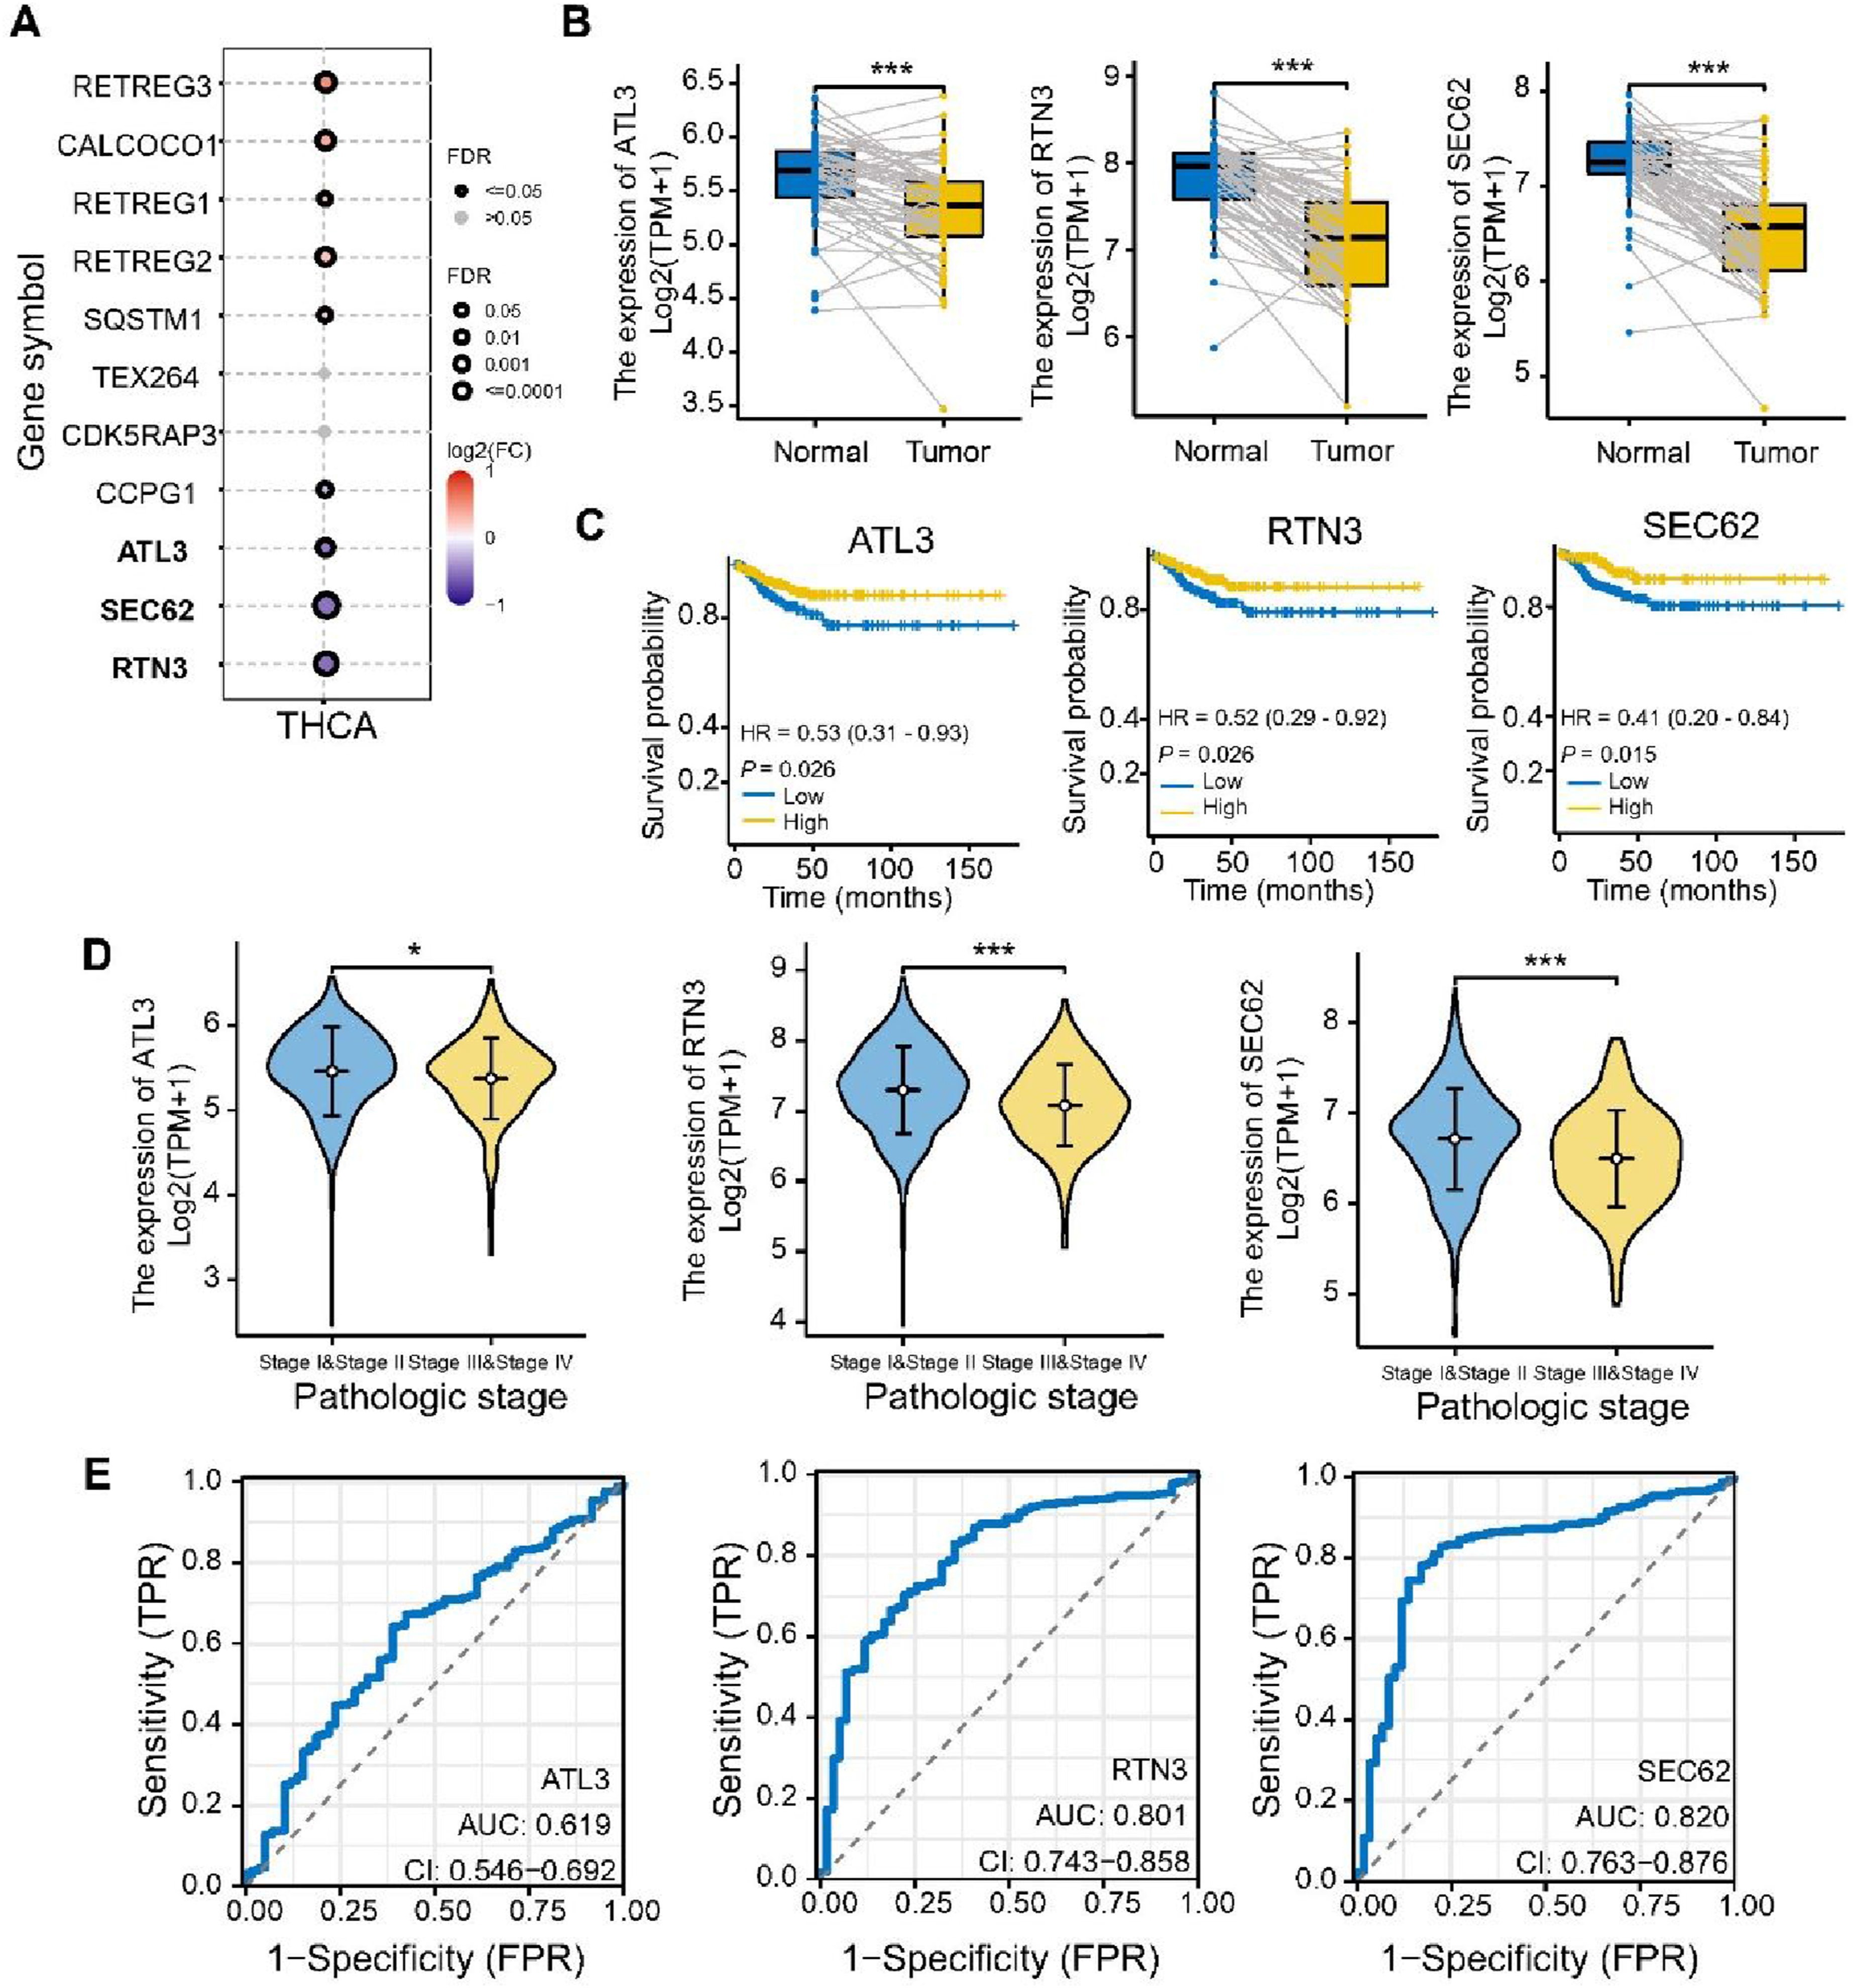
3.2. Gene Mutations and DNA Methylation Regulated Expression of ER-Phagy Receptors in PTC
We then explored gene mutations and DNA methylation of ER-phagy receptors in thyroid cancer based on the GSCA platform. The copy number variation (CNV) types of 11 genes in thyroid cancer included hemizygous or homozygous amplification and deletion. Interestingly, RETREG2/CCPG1, ATL3/RTN3, SEC62/TEX264, and CALCOCO1/SQSTM1/CDK5RAP3/RETREG3/RETREG1 seemed to have a similar CNV pattern (Figure 2A). Among all genes, only expression of RETREG3 and CDK5RAP3 was influenced by CNV (Figure 2B). CNVs of seven genes were significantly associated with overall survival in thyroid cancer (Figure 2C). The gene set CNV containing eleven genes was significantly associated with PFS, DSS and DFI of thyroid cancer (Figure 2D). Except for RTN3, RETREG2 and SEC62, the methylation levels of the other genes were all negatively correlated with their mRNA expression (Figure 2E). This phenomenon suggested that DNA methylation was not the core regulator of RTN3, RETREG2 and SEC62 expression. Although DNA methylation regulated the expression of most genes, there was no difference in survival between high and low methylation for any of the genes (Figure 2F). Gene mutations and DNA methylation were related to ER-phagy receptor expression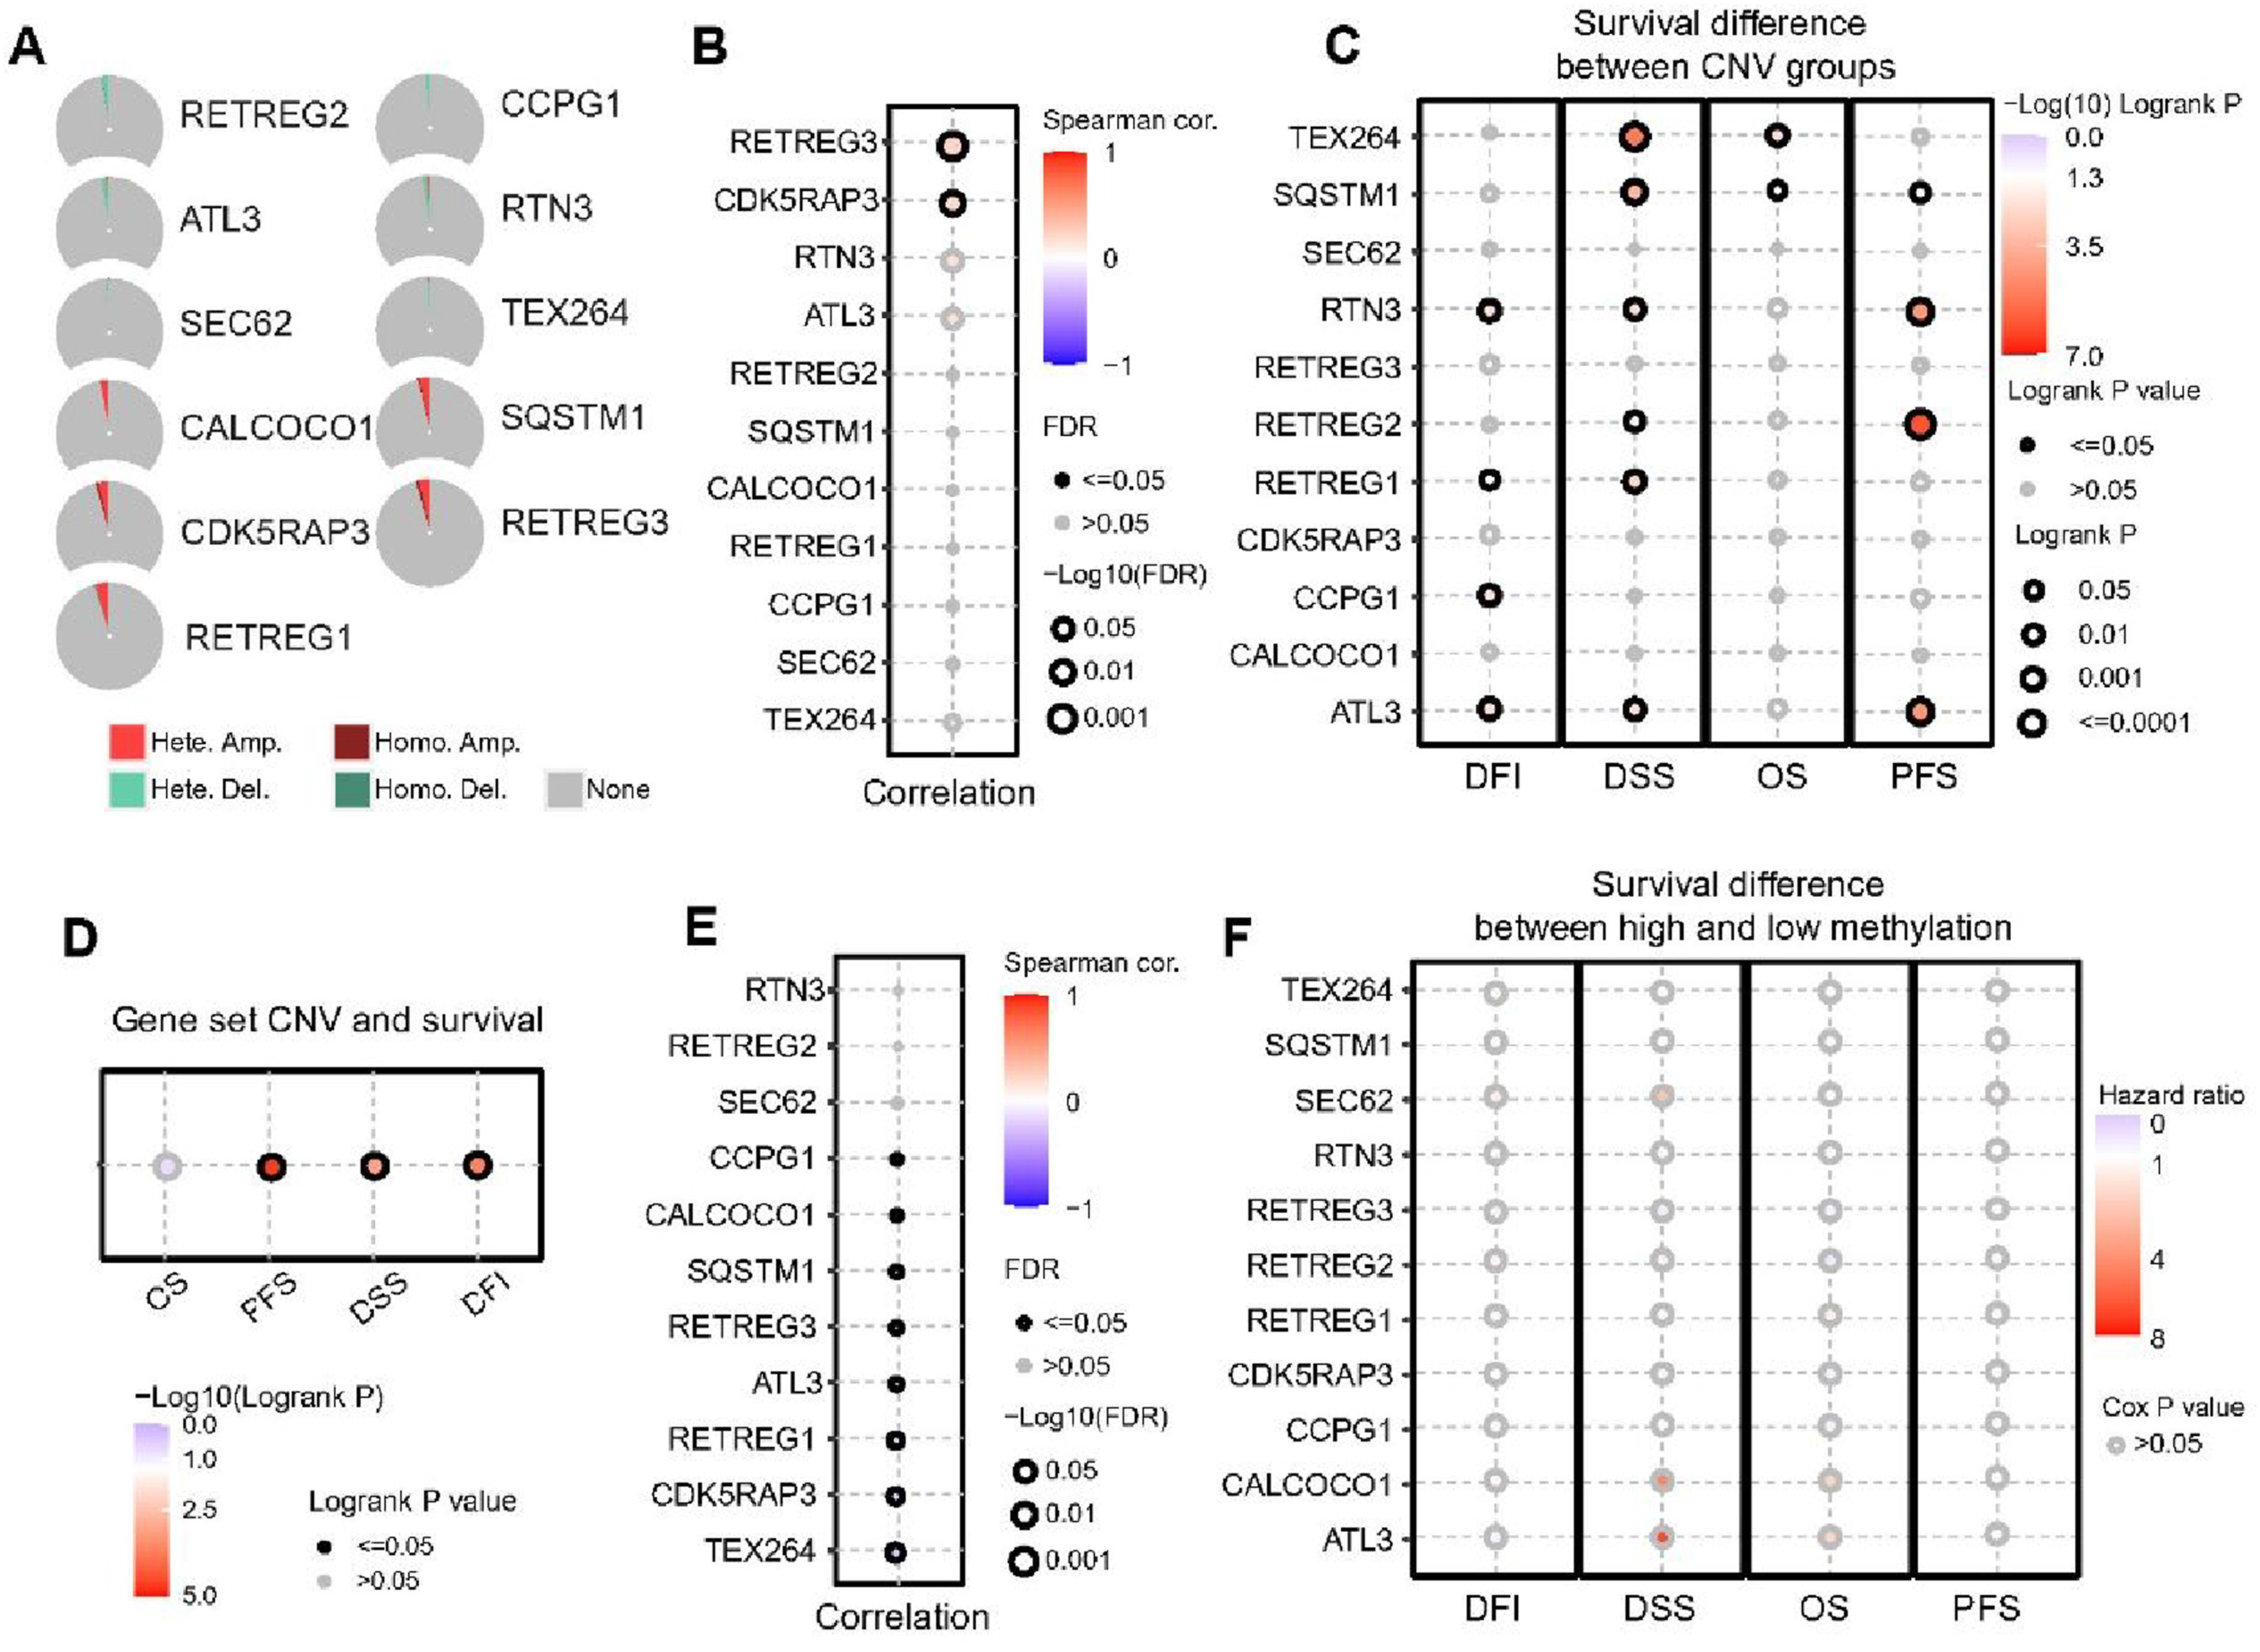
The single nucleotide variations (SNVs) of ER-phagy receptor genes were extremely rare. Only mutation frequencies of 0.2% for CCPG1, 0.2% for RTN3 and 0.4% for SEC62 SNVs were detected (Supplementary Figure 3 and Supplementary Table 3).
3.3. RTN3, SEC62 and ATL3 Showed Different Effects on Immune Cell Infiltration and Immune Subtype of Thyroid Cancer
KEGG/GO enrichment analyses of RTN3, SEC62 and ATL3 revealed that these genes were closely associated with immune-related pathways (Supplementary Figure 4). Then we investigated the relationship between the three genes and immune infiltration in thyroid cancer and found that all three genes exerted key immunosuppression functions. Interestingly, several immune cells such as Tregs, dendritic cells, macrophages, and CD8+ T cells, seemed to be negatively correlated with the expression of RTN3, SEC62 and ATL3 (Figure 3A–C). To further discuss the correlation between each gene and several main immune cells, we plotted curves comparing immune cell infiltration levels with gene expression levels using the TIMER database. CD8+ T cell infiltration was negatively correlated with the expression of all three genes (Figure 3D), consistent with the trends observed in Figure 3A–C. These results indicate that low expression of these genes is associated with reduced CD8+ T cell infiltration, suggesting a potential link to an immunosuppressive microenvironment. Contradictorily, using different algorithms, we obtained inconsistent conclusions on the infiltration of macrophage, neutrophil and dendritic cells. Further in-depth experiments are required to verify these findings. The expression of ATL3 and SEC62 was significantly associated with all immune cells listed, while RTN3 was relatively less correlated. Other than immune cells, RTN3 and SEC62 seemed to mainly negatively regulate the expression of immunomodulators and chemokines, while ATL3 showed a different pattern (Figure 3E and F). RTN3 and SEC62 were differentially expressed across immune subtypes as defined by Thorsson V et al
28
based on the pan-cancer immune landscape (Figure 3G–I). ATL3, RTN3 and SEC62 showed an Immunosuppressive Role in PTC
3.4. Knock-Down of RTN3, SEC62 and ATL3 Promoted Proliferation of Thyroid Cancer Cell Lines
RTN3-, SEC62-, and ATL3-silenced TPC-1 and CAL-62 cell lines were established by transfection with specific shRNAs (Figure 4A and B and Supplementary Figure 5A). LC3-II expression was elevated in shSEC62 and shATL3 with no obvious change in the ER stress marker p-PERK (Figure 4B). CCK8 showed that cell proliferation in shSEC62, shRTN3 and shATL3 groups was significantly higher than that in the NC group from day 4 onward in both TPC-1 and CAL-62 cell lines (Figure 4C and Supplementary Figure 5B). EdU experiments unveiled that following silencing of RTN3, SEC62, and ATL3, cellular fluorescence intensity was significantly increased in both TPC-1 and CAL-62 cell lines (Figure 4D and E and Supplementary Figure 5E and F). In both cell lines, colony formation ability of shRTN3, shSEC62 and shATL3 cells was significantly enhanced compared with the NC group (Figure 4F and G and Supplementary Figure 5C and D). All experiments were repeated at least three times. Knockdown of ATL3, RTN3 and SEC62 enhanced tumor proliferation of TPC-1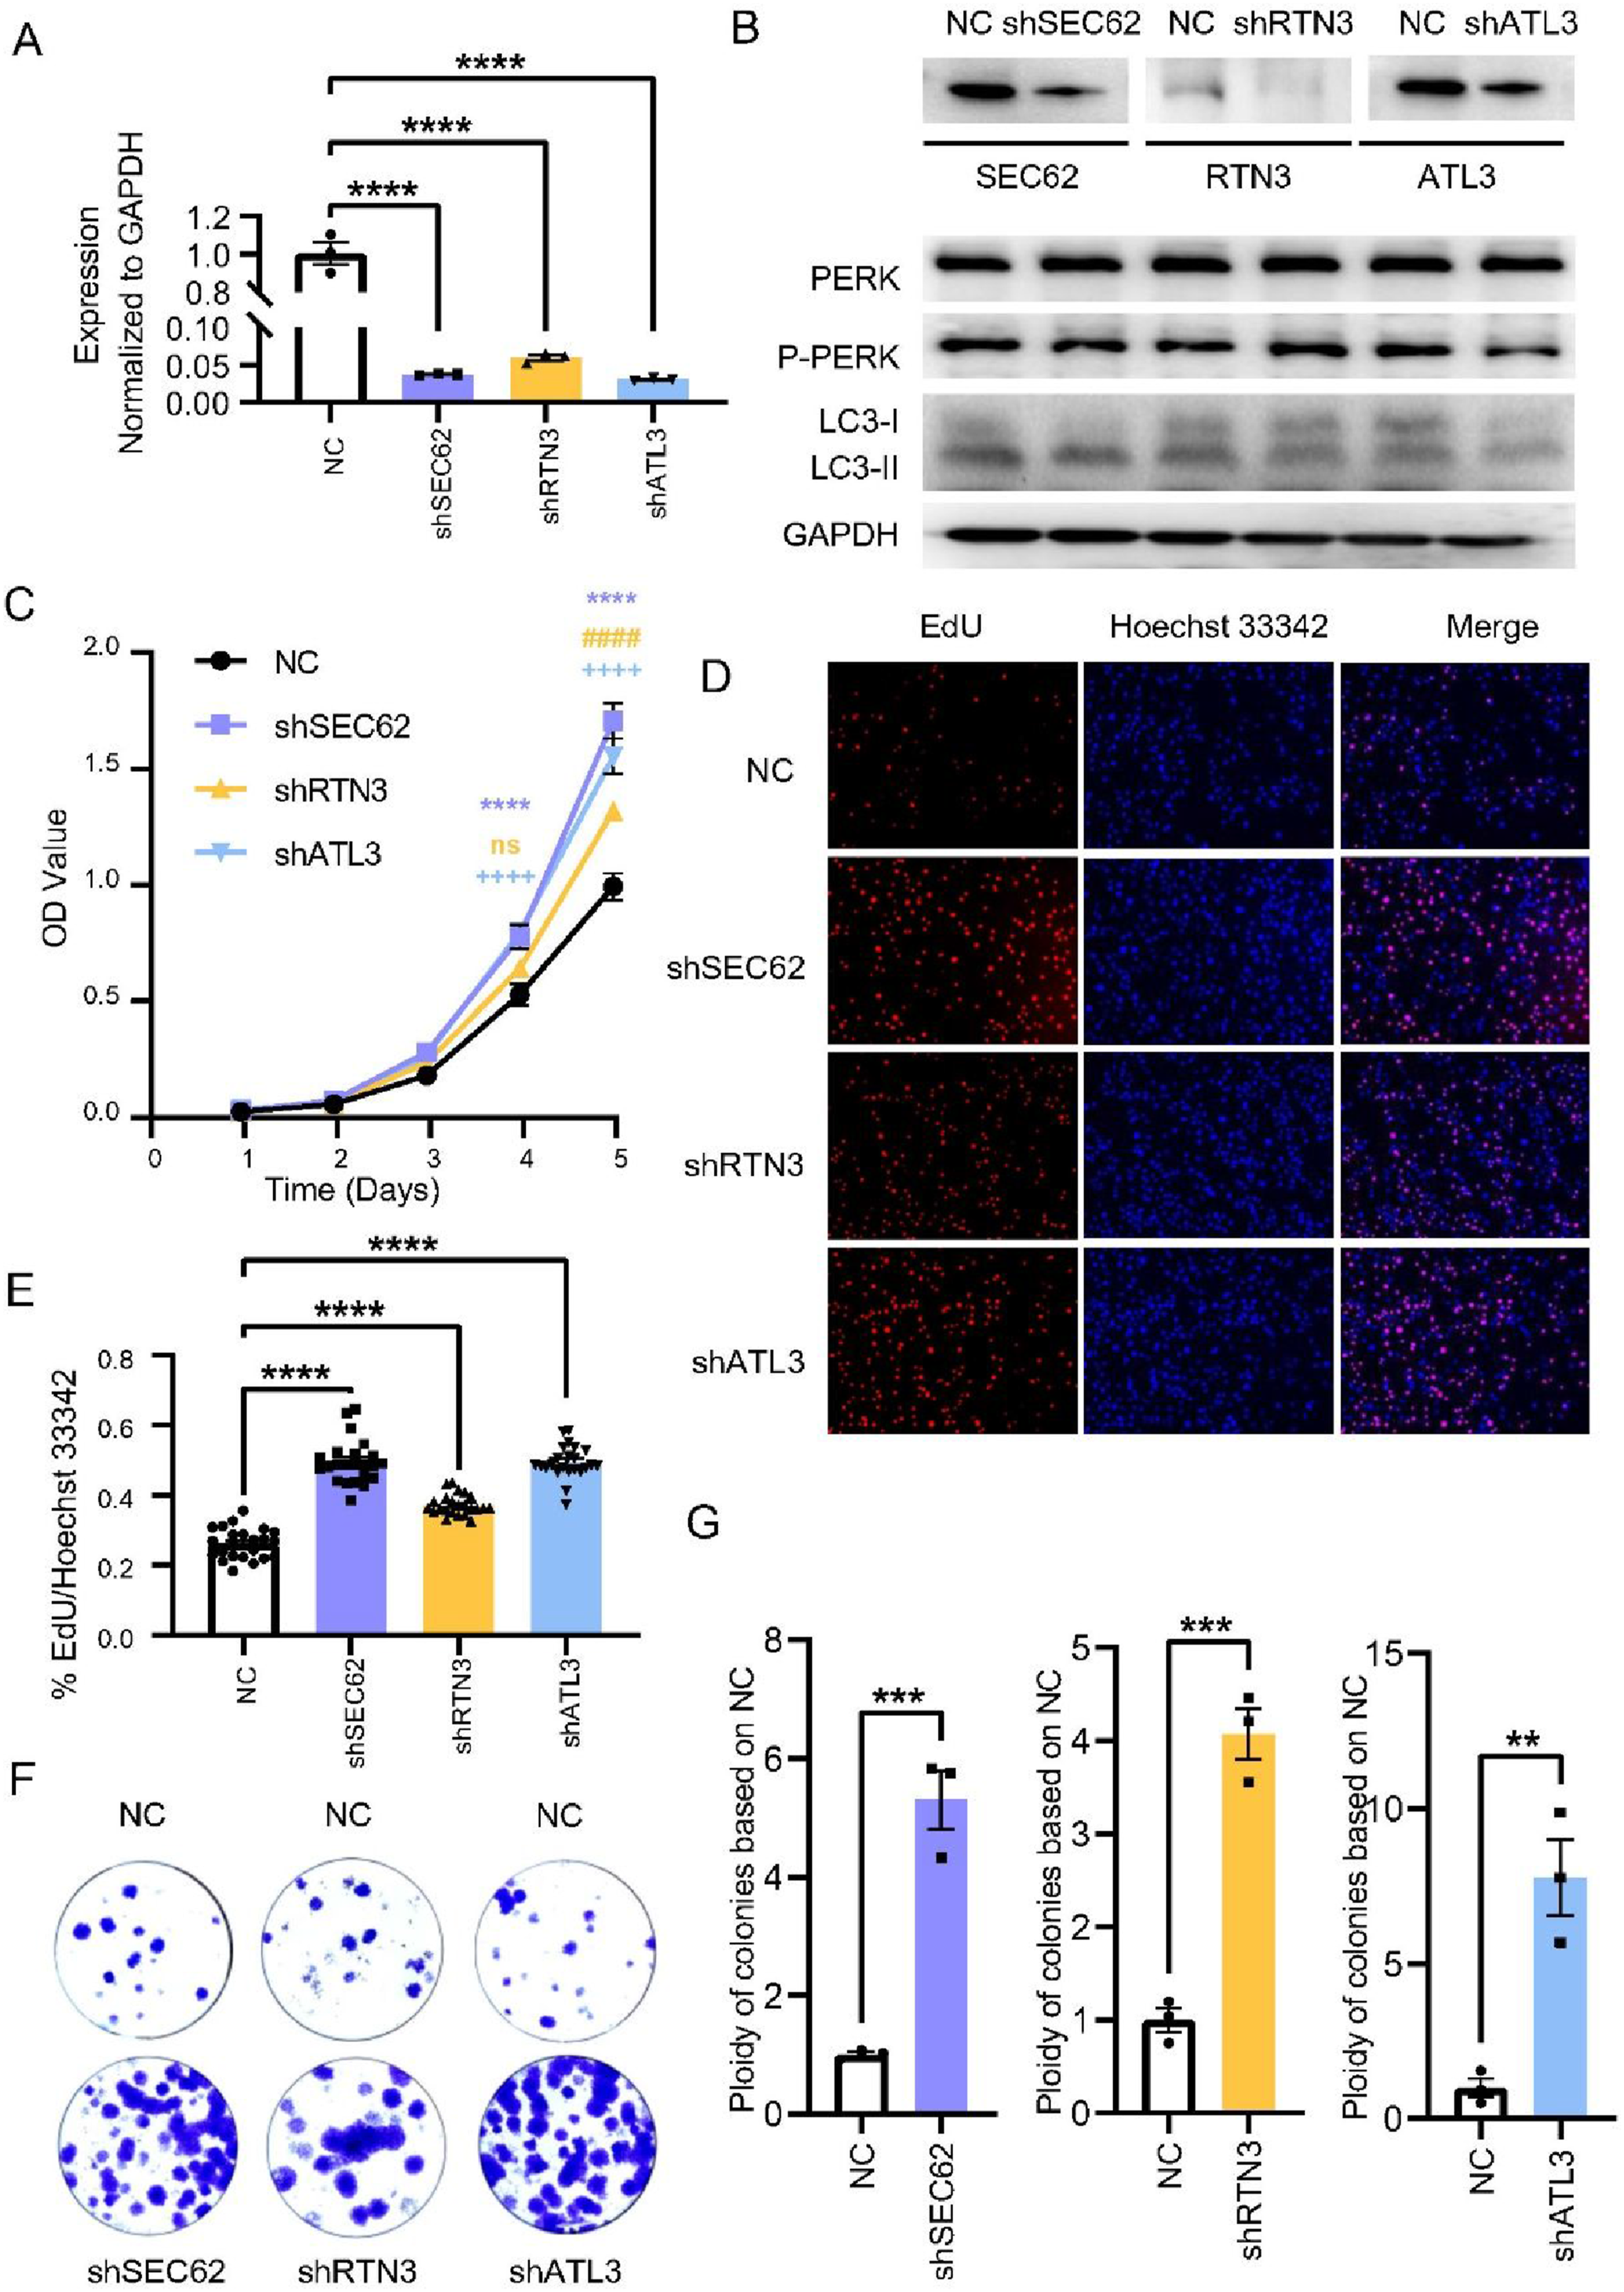
3.5. Knock-Down of RTN3, SEC62 and ATL3 Enhanced Metastasis and Epithelial-Mesenchymal Transition in Thyroid Cancer Cell Lines
Wound healing and transwell migration assays were performed to evaluate the migration ability of cells. After 24 hours, there was a modest difference in healing area between the NC group and all knockdown cell lines. After 48 hours, the healing areas of shRTN3, shSEC62 and shATL3 cells were significantly larger than those of the NC group (Figure 5A and B and Supplementary Figure 6A and B). Consistent results were observed in transwell migration assays. After 24 hours, more cells were observed to pass through the chamber membrane in shRTN3, shSEC62 and shATL3 cell lines (Figure 5C and D and Supplementary Figure 6C and D). Transwell invasion assays were subsequently performed to assess cell invasive capacity. After 48 hours, there were more cells passing through the chamber membrane in shRTN3, shSEC62 and shATL3 cell lines (Figure 5E and F and Supplementary Figure 6E and F). Finally, we examined the regulatory effects of RTN3, SEC62 and ATL3 on several EMT markers in TPC-1 cells via western blotting. Following knockdown of RTN3, SEC62 and ATL3, the expression levels of ZO-1 and E-cadherin were downregulated, while N-Cadherin, β-catenin, vimentin and SNAI1 were up-regulated significantly (Figure 5G). This shift in molecular marker expression indicated that RTN3, SEC62 and ATL3 may suppress the metastatic potential of tumor cells. All experiments were repeated at least three times. Knockdown of ATL3, RTN3 and SEC62 promoted metastasis and EMT in TPC-1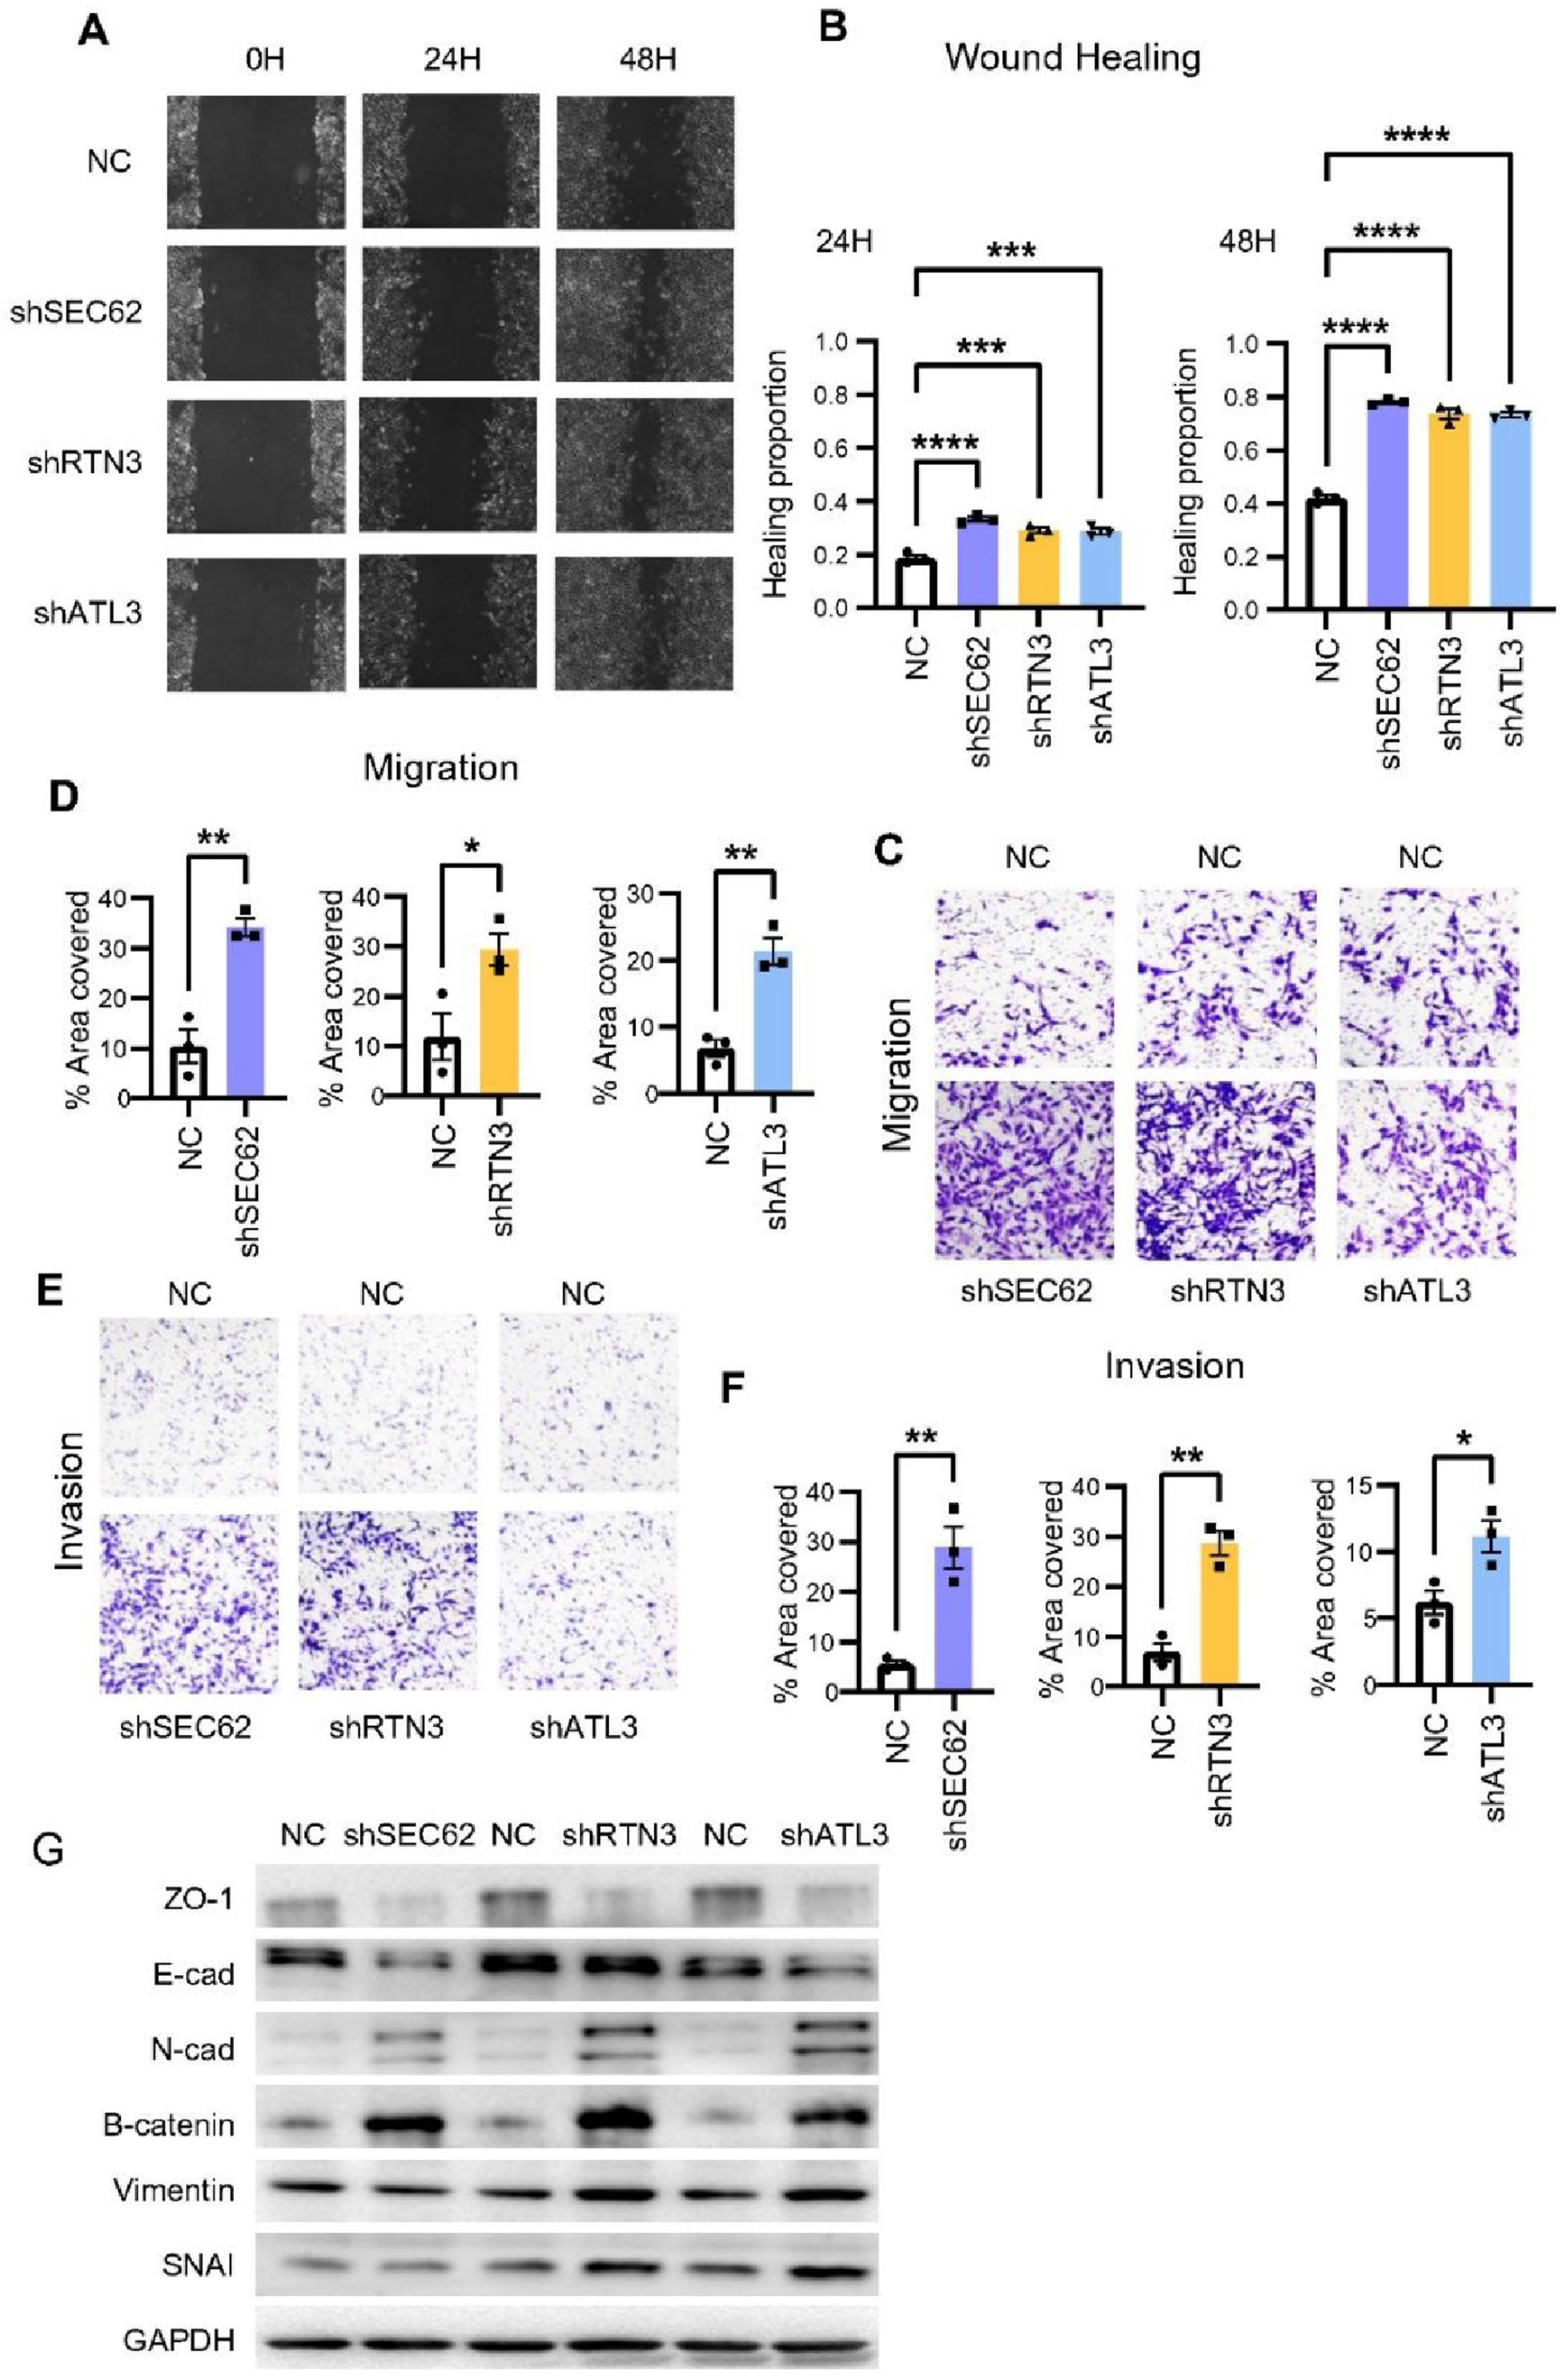
4. Discussion
The role of ER-phagy in the development of tumors is complex and context-dependent, often varying according to the stage of cancer progression. During cancer initiation and malignant transformation, ER-phagy typically exerts tumor-suppressive effects by removing damaged cellular components, thereby limiting cell proliferation and maintaining genomic stability.29,30 For instance, studies in pancreatic ductal adenocarcinoma (PDAC) have demonstrated that KRAS mutations suppress the transcription of the ER-phagy receptor CCPG1. This impairment may lead to protein aggregation, inflammation, and acinar-to-ductal metaplasia, consequently promoting tumorigenesis. 31 Similarly, in hepatocellular carcinoma (HCC), the upregulation of FAM134B has been found to suppress the expression of endoplasmic reticulum stress-associated degradative proteins, thereby promoting hepatocarcinogenesis. 32 Conversely, once malignant transformation is established, cancer cells often exploit ER-phagy to sustain their metabolic demands, thus favoring tumor progression and maintenance.15,19,33 Tentolouris et al. demonstrated that in highly secretory tumors such as multiple myeloma, the activation of ER-phagy receptors supports the high demand for protein synthesis and secretion, facilitating tumor proliferation. 34 It is widely recognized that ER-phagy involves numerous signaling pathways, forming a complex regulatory network. Consequently, the activation or inhibition of specific pathways at different stages of cell development can lead to diverse and sometimes unpredictable cell fates.
In this study, we explored the association of eleven ER-phagy receptors with clinical characteristics and transcriptional patterns in papillary thyroid cancer. Notably, some variables which were significant in univariate analysis did not retain significance in the multivariate model. This is likely due to the intercorrelations and shared prognostic information among the ER-phagy receptor molecules, suggesting that their influence on the outcome may not be entirely independent. Given the presence of multicollinearity (VIF > 10) among the covariates, caution is warranted when interpreting the results from conventional multivariate Cox regression. The LASSO regression analysis further suggested that RTN3, SEC62 and ATL3 might not function as fully independent prognostic biomarkers in a multivariate model (Supplementary Figures 7 and 8), implying that these molecules are more likely passenger features rather than driver features. Notwithstanding these statistical considerations, the robust differential expression of these genes (high diagnostic AUC values) and our in vitro functional validation—demonstrating their direct role in suppressing proliferation and metastasis—underscore their biological importance and potential as diagnostic markers and therapeutic targets, even if they are not independent prognostic factors.
Although it has been reported that certain ER-phagy receptors, such as SEC62, may play a significant role in thyroid cancer,8,35 comprehensive investigations into the roles of other receptors remain scarce. Through bioinformatics analysis and cellular experiments, this study provides a systematic analysis of the potential roles of ER-phagy receptors in thyroid cancer for the first time. Notably, three receptors—RTN3, SEC62, and ATL3—drew our particular attention. These receptors were significantly associated with Progression-free survival (PFS), implying their involvement in tumor recurrence and metastasis. Through the knockdown of RTN3, SEC62, and ATL3 in the thyroid cancer cell lines TPC-1 and CAL-62, we observed a significant enhancement in cellular proliferation, migration, and invasion capabilities. Although survival analysis indicates a trend linking low expression to unfavorable prognosis, the widespread downregulation of these genes in thyroid carcinoma may limit their statistical power as independent prognostic factors. However, the high frequency of this downregulation event itself highlights their critical tumor-suppressive functions during thyroid carcinogenesis. Consequently, we identified RTN3, SEC62, and ATL3 as potential predictors for high-risk thyroid cancer and confirmed their function in vitro.
Previous studies have extensively investigated the role of SEC62 in various cancers, consistently pointing to its function as a pro-oncogenic factor in diverse malignancies. In colorectal cancer, 36 malignant melanoma,37,38 lung cancer26,39 and cervical cancer, 40 SEC62 overexpression was associated with poor prognosis, metastasis and chemoresistance. Similarly, SEC62 has been reported to be highly expressed in thyroid cancer tissues and cell lines.8,26 However, our study showed that SEC62 played a role as a tumor suppressor in the thyroid cancer cell lines TPC-1 and CAL-62. In vitro experiments also indicated that downregulation of SEC62 promoted tumor proliferation and metastasis, suggesting that the role of SEC62 in thyroid cancer may be complex and warrants further investigation. As an ER membrane protein and ER-phagy receptor, SEC62 upregulates PERK/ATF expression, bound to LC3II, and activated FIP200/Beclin-1/Atg5. 41 In vivo assays showed that silencing of SEC62 diminished the metastatic ability by improving ER stress tolerance and increased invasiveness.42-44 In our protein analysis, LC3II was significantly increased after knockdown of SEC62 and ATL3 while phosphorylated-PERK (p-PERK) exhibited an ambiguous alteration. The credible role of SEC62, ATL3 and RTN3 in ER stress and LC3-dependent autophagy remains to be further investigated.
During ER-phagy, only RTN3L—the longest isoform of RTN3—participates in this process, primarily by clearing ER regions containing misfolded proteins.16,19,24 Interestingly, studies have revealed that ATL3 can work synergistically with RTN3L. When ATL3 is deficient, overexpressed RTN3L can compensate for the impairment of ER-phagy, and vice versa.45,46 However, little research has been done on the role of RTN3 and ATL3 in cancer. A recent study showed that RTN3 expression is often downregulated in HCC. In patients with TP53 mutation and HBV infection status-dependent HCC, low RTN3 expression predicted a poor prognosis. RTN3 exerts hepatocarcinoma-suppressive effects through activation of the Chk2/p53 pathway. 27 RTN3 has been reported to be associated with tubular ER degradation. ATL3 has been reported to be involved in nutrient-induced ER-phagy in tumors.10,47 In our study, RTN3 and ATL3 frequently exhibited similar trends in terms of expression, gene mutation patterns and survival analysis in thyroid cancer. Therefore, we hypothesized that RTN3 and ATL3 might also exhibit synergistic effects in thyroid cancer. However, ATL3 appeared to exert a distinct influence on the immune landscape of thyroid cancer compared to RTN3 and SEC62 (Figure 3E–I). The roles and mechanisms of RTN3 and ATL3 in thyroid cancer warrant further exploration.
Given the pivotal roles of ER-phagy receptors in maintaining ER homeostasis and regulating autophagy, pharmacological targeting of these receptors, their interaction interfaces (such as the ER-phagy receptor-LC3/GABARAP interface), or their upstream kinases (e.g., ULK1, TBK1) holds promise as novel therapeutic strategies for thyroid cancer and other malignancies.48,49 For instance, modulating autophagy via nanotechnology represents a promising therapeutic avenue in cancer treatment. 48 A deeper understanding of the molecular mechanisms of these receptors and their interplay with the tumor microenvironment and therapy-induced stress will pave the way for the development of more effective and selective cancer therapies.
There were some shortcomings in this study. First, our study has certain experimental limitations. Due to the constraints of the current study, in vivo animal experiments were not conducted. Future investigations incorporating more cell lines and in vivo models, including immune infiltration analyses, are required to draw more convincing conclusions and further elucidate the role of ER-phagy receptors in thyroid cancer. Second, while our findings are based on bioinformatics and cellular evidence, they do not necessarily reflect the pathophysiological processes in thyroid cancer patients. Conventional cell line models are established under artificial in vitro conditions and may not fully mimic the heterogeneity, microenvironmental complexity, and genetic diversity observed in human tumors. These observed molecular patterns or associations may reflect shared biological tendencies in vitro, but they do not necessarily directly translate to clinical realities. Future studies validating these findings using primary patient samples or patient-derived models will be essential to confirm the translational relevance of these in vitro observations. Third, while our current study focused on the loss-of-function effects of RTN3, SEC62, and ATL3 to mimic their downregulation in thyroid cancer, we acknowledge that gain-of-function experiments (overexpression) would provide complementary mechanistic insights. These experiments are planned for our future research. Fourth, we did not focus on the specific mechanisms by which these molecules inhibit thyroid cancer and the therapeutic potential of related small-molecule drugs. Finally, ER stress and autophagy—essential processes related to ER-phagy—need to be investigated, and elucidating their crosstalk represents a pivotal direction for future research.
Although the role of ER-phagy in thyroid cancer remains unclear, our study provides robust evidence for the role of RTN3, SEC62 and ATL3 in the diagnosis and prognosis of thyroid cancer and illustrates their effects on thyroid cancer proliferation and metastasis, which can be valuable in clinical stratification of high-risk thyroid cancer and future thyroid cancer research.
5. Conclusion
An exploratory analysis of eleven ER-phagy receptors was performed utilizing bioinformatics approaches. We identified that SEC62, RTN3, and ATL3 were significantly downregulated in thyroid cancer and might play immunosuppressive roles in thyroid cancer. In vitro assays further indicated that these molecules could suppress the proliferation, metastasis, and invasiveness of thyroid cancer cell lines. These findings suggest that ER-phagy receptors may play roles in thyroid cancer, warranting further investigation into SEC62, RTN3 and ATL3 as candidate biomarkers.
Supplemental Material
Supplemental Material - Unveiling ER-Phagy Receptors in Thyroid Cancer: A Combined Approach of Public Data Mining and In Vitro Validation
Supplemental Material for Unveiling ER-Phagy Receptors in Thyroid Cancer: A Combined Approach of Public Data Mining and In Vitro Validation by Nan Feng, Jun Zhou, Zihan Xi, Tao Huang, Ming Xu, and Xucai Zheng in Clinical Medicine Insights: Oncology.
Footnotes
Acknowledgements
We thank Professors Tao Huang and Xucai Zheng for providing financial support for this study. We would like to thank the other members of the Breast and Thyroid Surgery Laboratory of Union Hospital for their guidance and assistance in this study. Additionally, DeepSeek was used to assist with language editing and grammar checks.
Author Contributions
NF: Conceptualization, Validation, Formal analysis, Data Curation, Writing - Original Draft. JZ: Formal analysis, Investigation, Data Curation. ZX: Investigation, Resources, Writing - Original Draft. TH: Formal analysis, Writing - Review & Editing, Funding acquisition. MX: Conceptualization, Methodology, Validation, Writing - Review & Editing, Supervision. XZ: Validation, Resources, Visualization, Funding acquisition
Funding
The authors disclosed receipt of the following financial support for the research, authorship, and/or publication of this article: We acknowledge financial support by Grant No. 2022AH040188 of 2022 Annual Project of Higher Education Research Planning of Anhui Provincial Department of Education.
Declaration of conflicting interests
The authors declared no potential conflicts of interest with respect to the research, authorship, and/or publication of this article.
Data Availability Statement
The datasets generated and analyzed during the current study are available in the TCGA database (https://www.cancer.gov/about-nci/organization/ccg/research/structural-genomics/tcga), GSCA platform (https://bioinfo.life.hust.edu.cn/GSCA/#/), Xiantaoxueshu (https://www.xiantao.love/), Timer database (https://cistrome.shinyapps.io/timer/) and TISIDB database (![]() ).
).
Supplemental Material
Supplemental material for this article is available online.
References
Supplementary Material
Please find the following supplemental material available below.
For Open Access articles published under a Creative Commons License, all supplemental material carries the same license as the article it is associated with.
For non-Open Access articles published, all supplemental material carries a non-exclusive license, and permission requests for re-use of supplemental material or any part of supplemental material shall be sent directly to the copyright owner as specified in the copyright notice associated with the article.