






Abstract
Background
Sarcopenia significantly impacts stroke prognosis. Temporal muscle thickness (TMT) is an emerging metric for sarcopenia.
Objectives
To developed a TMT-incorporated model to predict 6-month adverse outcomes in acute ischemic stroke (AIS).
Design
In this retrospective study, 479 AIS patients were divided into training (n=283), test (n=120), and external validation cohorts (n=76).
Methods
A combined model was constructed to predict adverse outcomes in the training and test cohorts using LASSO regression analysis. Model performance was assessed via calculating accuracy, sensitivity, specificity, positive predictive value (PPV), negative predictive value (NPV) and F1 score.
Results
The proportion of patients with an adverse outcomes in the training and test sets was 18.02% vs 17.50%, respectively (P = 0.90). Ischemic stroke event, admission NIHSS score, BI score, TMT were used to construct the prediction model. The combined model presented good discriminatory potential in the training and test sets (AUC = 0.929 and 0.930, respectively), which was verified in the external validation cohort (AUC = 0.902). For the combined model, the P values of the Hosmer–Lemeshow test in the training set, the test set, and the external validation were < 0.001 (χ2 = 44.007), 0.472 (χ2 = 7.611), and <0.001 (χ2 = 4919.666), respectively. The combined model showed good calibration and discrimination. The clinical usefulness of the model was confirmed by decision curve analysis.
Conclusion
This study developed a combined model incorporating ischemic stroke event, admission NIHSS score, BI score, TMT and infarct volume to predict 6-month adverse outcomes in AIS patients, providing clinicians with a practical tool for treatment decisions and prognosis assessment.
Introduction
Stroke is the second leading cause of death worldwide. The burden of disability in stroke survivors is high, particularly in low- and middle-income countries, where the burden is increasing more rapidly compared with high-income countries. 1 In China, 3.94 million new cases of stroke occurred in 2019; among these, 2.87 million were ischemic in origin. The same year, stroke caused 2.19 million deaths nationwide. 2 Better neurological status 6 months after acute ischemic stroke (AIS) is associated with longer survival. 3 Therefore, accurately predicting 6-month functional outcome at the time of stroke would help guide appropriate management and improve healthcare resource allocation.
Sarcopenia is an aging-related loss of skeletal muscle mass and function which has been associated with poor functional outcome in AIS patients. 4 The diagnosis of sarcopenia is typically difficult in stroke patients with impaired consciousness or cognitive dysfunction because they cannot cooperate adequately to participate in clinical assessments of muscle strength and physical function. 5 Temporal muscle thickness (TMT) and area (TMA) as measured on magnetic resonance imaging (MRI) have been associated with functional outcome in patients with brain tumors, subdural hematomas, and stroke.6-9 However, in the real world, functional outcome is influenced by multiple clinical variables—relying on a single one to predict outcome would not be accurate. Optimally, models used to predict patient outcomes would include these multiple variables, yet they are often overlooked.
Several studies have designed and evaluated model for predicting 6-month outcome in AIS patients. Sun et al developed the model, which is based on National Institutes of Health Stroke Scale (NIHSS) score on admission, age, previous diabetes, and creatinine, to predict the probability of poor outcome 6 months after AIS in Chinese patients. 10 Li et al used machine learning to develop another one that incorporates age, NIHSS score on admission, premorbid modified Rankin scale (mRS) score, fasting blood glucose, and creatinine; their model exhibited better predictive performance. 11 However, both models require acquisition of blood samples and have not been externally validated. In contrast, MRI examination offers the advantage of being non-invasive, and the TMT is more readily measurable.
Models combining clinical features with radiomics based on diffusion-weighted imaging (DWI) or fluid-attenuated inversion recovery (FLAIR) images have performed well in predicting AIS outcome.12,13 However, the assessment of AIS lesions on MRI relies on manual measurement or segmentation, which is time-consuming, requires trained personnel, and is prone to interrater inconsistency. 14 Thus, the aim of this study was to develop and validate a combined model combining temporal muscle variables and clinical predictors for individualized 6-month unfavorable outcome prediction in AIS patients.
Methods
Study Participants
A total of 479 patients admitted for AIS to two clinical centers from December 2022 to December 2023 were retrospectively analyzed. Those from the First Affiliated Hospital of Shantou University Medical College (n = 403) were randomly divided into the training (n = 283) and test (n = 120) sets, while those from Meizhou People’s Hospital (n = 76) were conducted as the external validation set. A study flow chart is shown in Figure 1. Institutional ethics review board approval was obtained (no. B-2024-164). The requirement for informed consent was waived owing to the study’s retrospective design. Study flow chart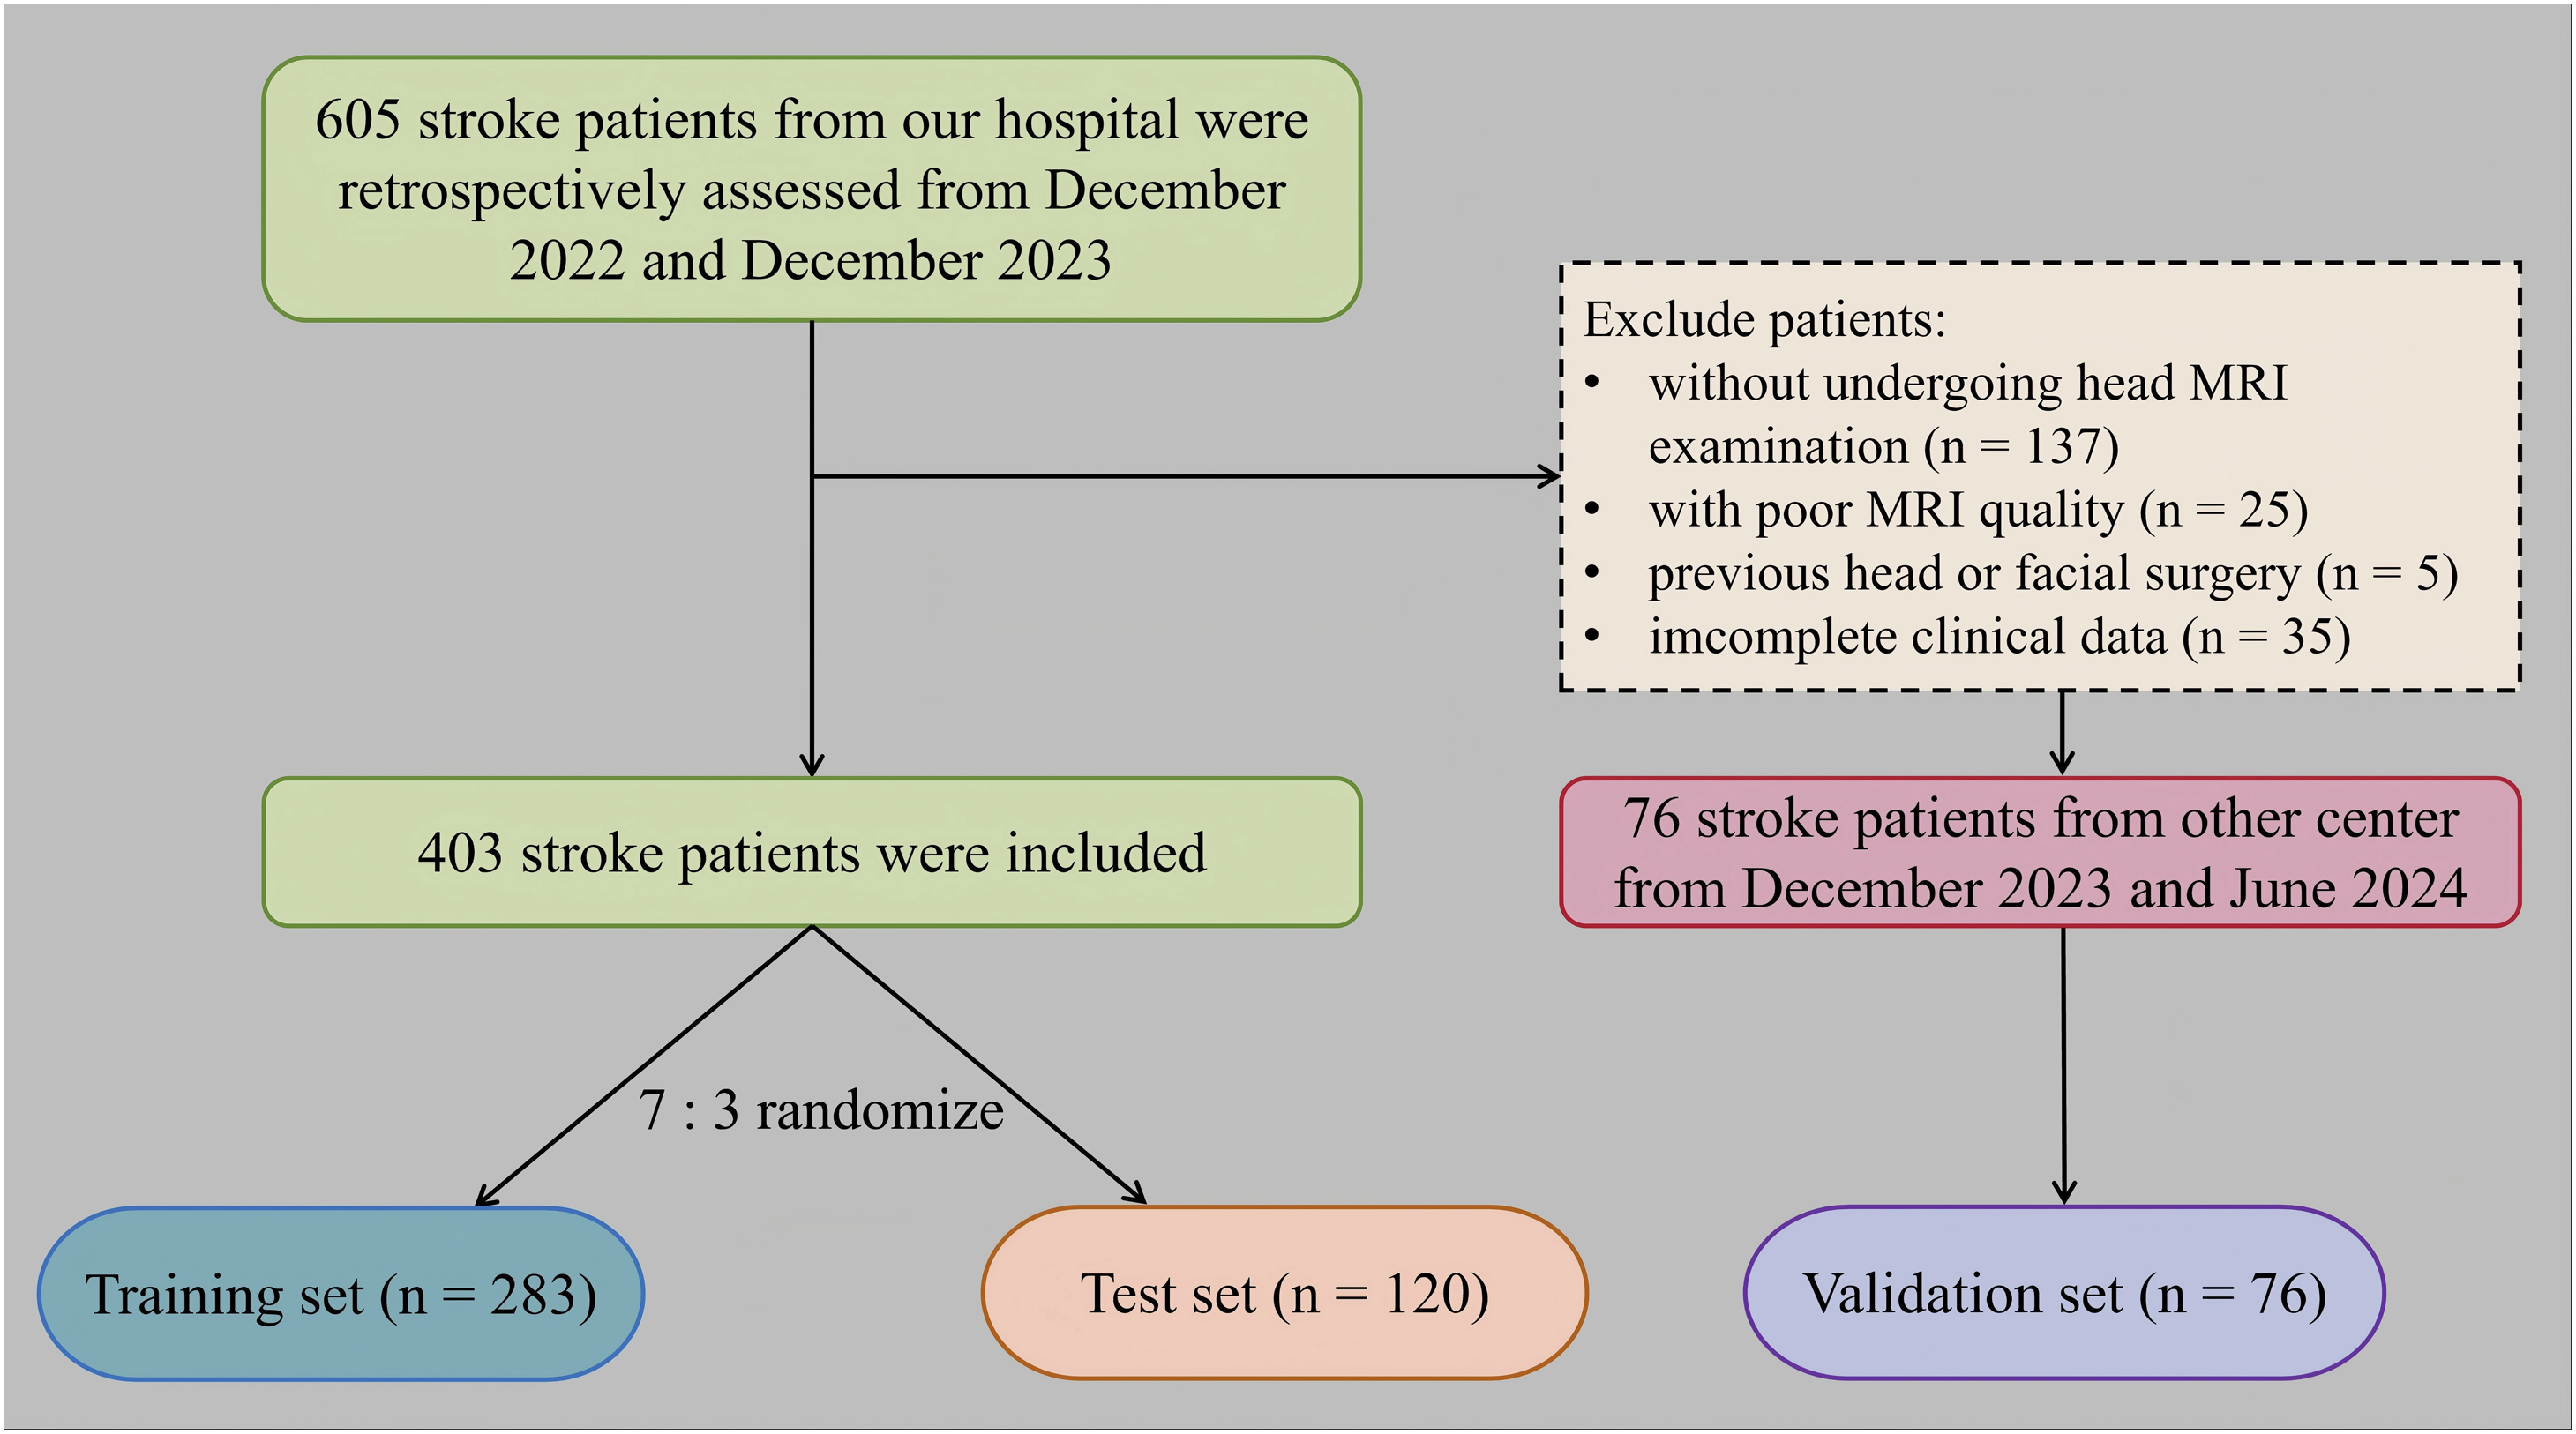
Inclusion and Exclusion Criteria
Patients’ inclusion criteria were an AIS diagnosis and an age > 18 years. The exclusion criteria were: (1) history of intracerebral hemorrhage, brain trauma, or previous neurological disease; (2) transient ischemic attack or subarachnoid hemorrhage; (3) severe artifact on imaging studies; and (4) severe concomitant heart/liver/kidney disease. We also excluded patients who underwent endovascular AIS treatment and those whose clinical, radiological, or follow-up data were unavailable.
Data Collection
The following data was collected for all participants: age, sex, vascular risk factors, previous medical history, Barthel Index (BI) score, and admission NIHSS score. All patients were clinically evaluated 6 months after AIS using the mRS questionnaire. Evaluations of the BI, NIHSS and mRS scores were performed by trained and certified assessors. Favorable outcomes were mRS 0-2, while unfavorable outcomes were mRS 3-6. 15 When the missing value of the observation index data was greater than or equal to 20%, the observation index was removed. For missing values below 20%, the multiple imputation method was employed to fill the gap.
MRI and Image Analysis
All patients underwent MRI of the brain on a 1.5 T GE SIGNA HDXT scanner (GE Healthcare, Milwaukee, WI, USA) with an eight-channel head coil or a Siemens Magnetom Trio 3.0 T scanner (Siemens Healthineers, Erlangen, Germany) with an 18-channel head/neck coil. Detailed acquisition parameters are summarized in Supplementary Table 1. T1-and T2-weighted sequences, DWI, and FLAIR imaging were performed in all patients.
Cerebral white matter hyperintensity (CWMH) was defined according to the Standards for Reporting Vascular Changes on Neuroimaging guidelines as white matter hyperintensity in the periventricular and subcortical areas of the brain without cavitation on FLAIR imaging. 16 Brain-stem white matter hyperintensity (BWMH) was defined as white matter hyperintensity in the brain stem. 17 FLAIR vascular hyperintensity (FVH) was defined as a focal, tubular, or serpentine hyperintensity (relative to cerebrospinal fluid) in the subarachnoid space that corresponded to the typical course of a cerebral artery. 18 The definition of a silent DWI lesion is as follows: 1) A parenchymal area that is markedly hyperintense on FLAIR relative to the surrounding brain and distinct from the hyperacute infarct. 2) A parenchymal area that is mild to markedly hyperintense on DWI with high b = 1000 relative to surrounding tissue. 19 The presence of CWMH, FVH, BWMH, and silent DWI lesions were assessed and recorded. Infarct volume (IV) was calculated in milliliters (mL) by multiplying the number of voxels of the segmented ischemic lesions with its voxel size.
TMT was used as temporal muscle markers of skeletal mass. It was manually measured on axial T2-weighted images obtained at the time of admission as shown in Figure 2. Slice thickness was reconstructed to 6 mm in the picture archiving and communication system before segmentation. TMT was measured perpendicular to the temporal muscle’s long axis, spanning from inner to outer margins (excluding fascia). The landmark for craniocaudal orientation was the roof of the orbit; the Sylvian fissure was used as the reference point for frontal–occipital orientation.20,21 Bilateral averages of TMT was computed for analysis (Figure 2). All measurements were performed by a single board-certified neuroradiologist with 5 years of experience (HW) who was blinded to all data. T2-weighted imaging of the brain measuring temporal muscle thickness (TMT). The red line indicates standard TMT, (A) Patient with high TMT values. (B) Patient with low TMT values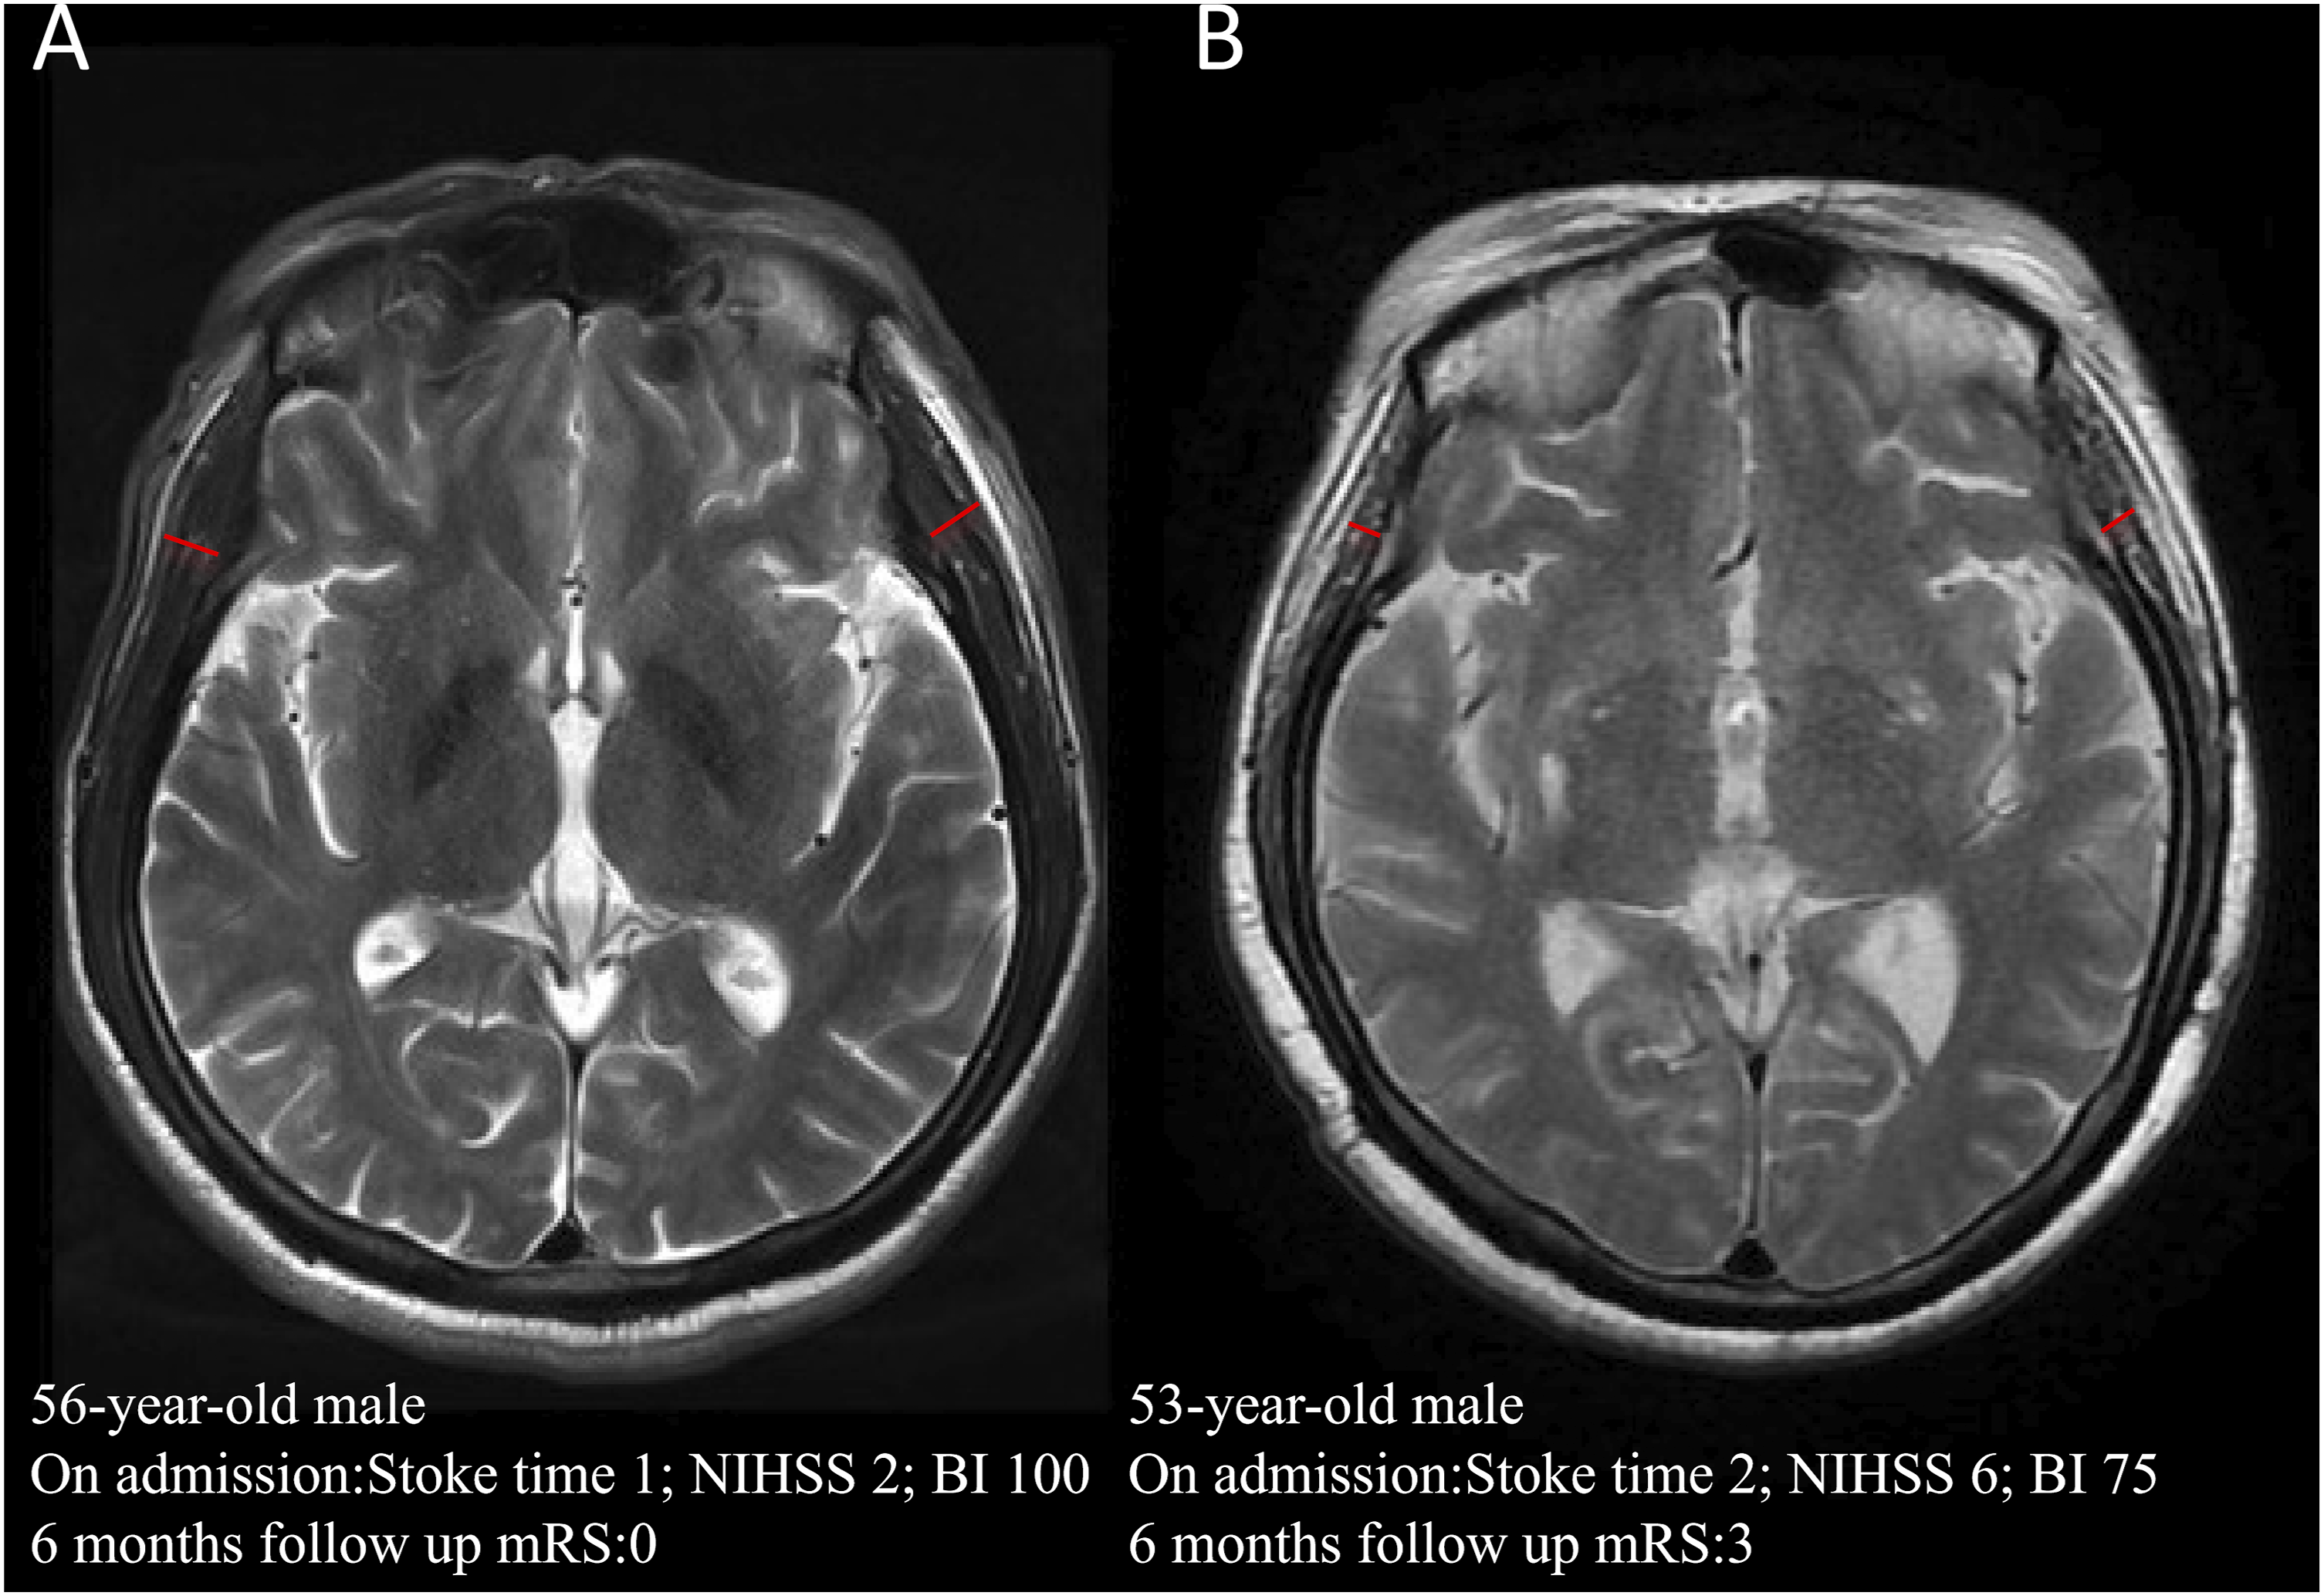
Statistical Analysis
Continuous data are summarized as means with standard deviation and were compared using the Student’s t-test or Mann–Whitney U test. Categorical variables are summarized as frequencies with percentage and were compared using the chi-square or Fisher’s exact test. Through LASSO regression analysis, clinical and imaging features associated with poor prognosis in ischemic stroke were screened to construct a clinical model, an imaging model, and a combined model.
The discrimination of these models was evaluated using the receiver operating characteristic (ROC) curve and the area under the curve (AUC). The DeLong test was used to compare the AUC values between the models. Calibration was assessed with the Hosmer-Lemeshow test and the calibration curve. Furthermore, the clinical utility of the model was examined through clinical decision curve analysis (DCA). In addition, the performance of all models was assessed by calculating accuracy, sensitivity, specificity, positive predictive value (PPV), negative predictive value (NPV) and F1 score.
Statistical analyses were performed using SPSS software version 25.0 (IBM Corp., Armonk, NY, USA) and R version 4.3.1 (R Development Core Team, Auckland, New Zealand). All tests were two-sided. A p-value of less than 0.05 was considered significant.
Results
Patient Characteristics
Population Characteristics of Patients With AIS in the Training and Test Sets
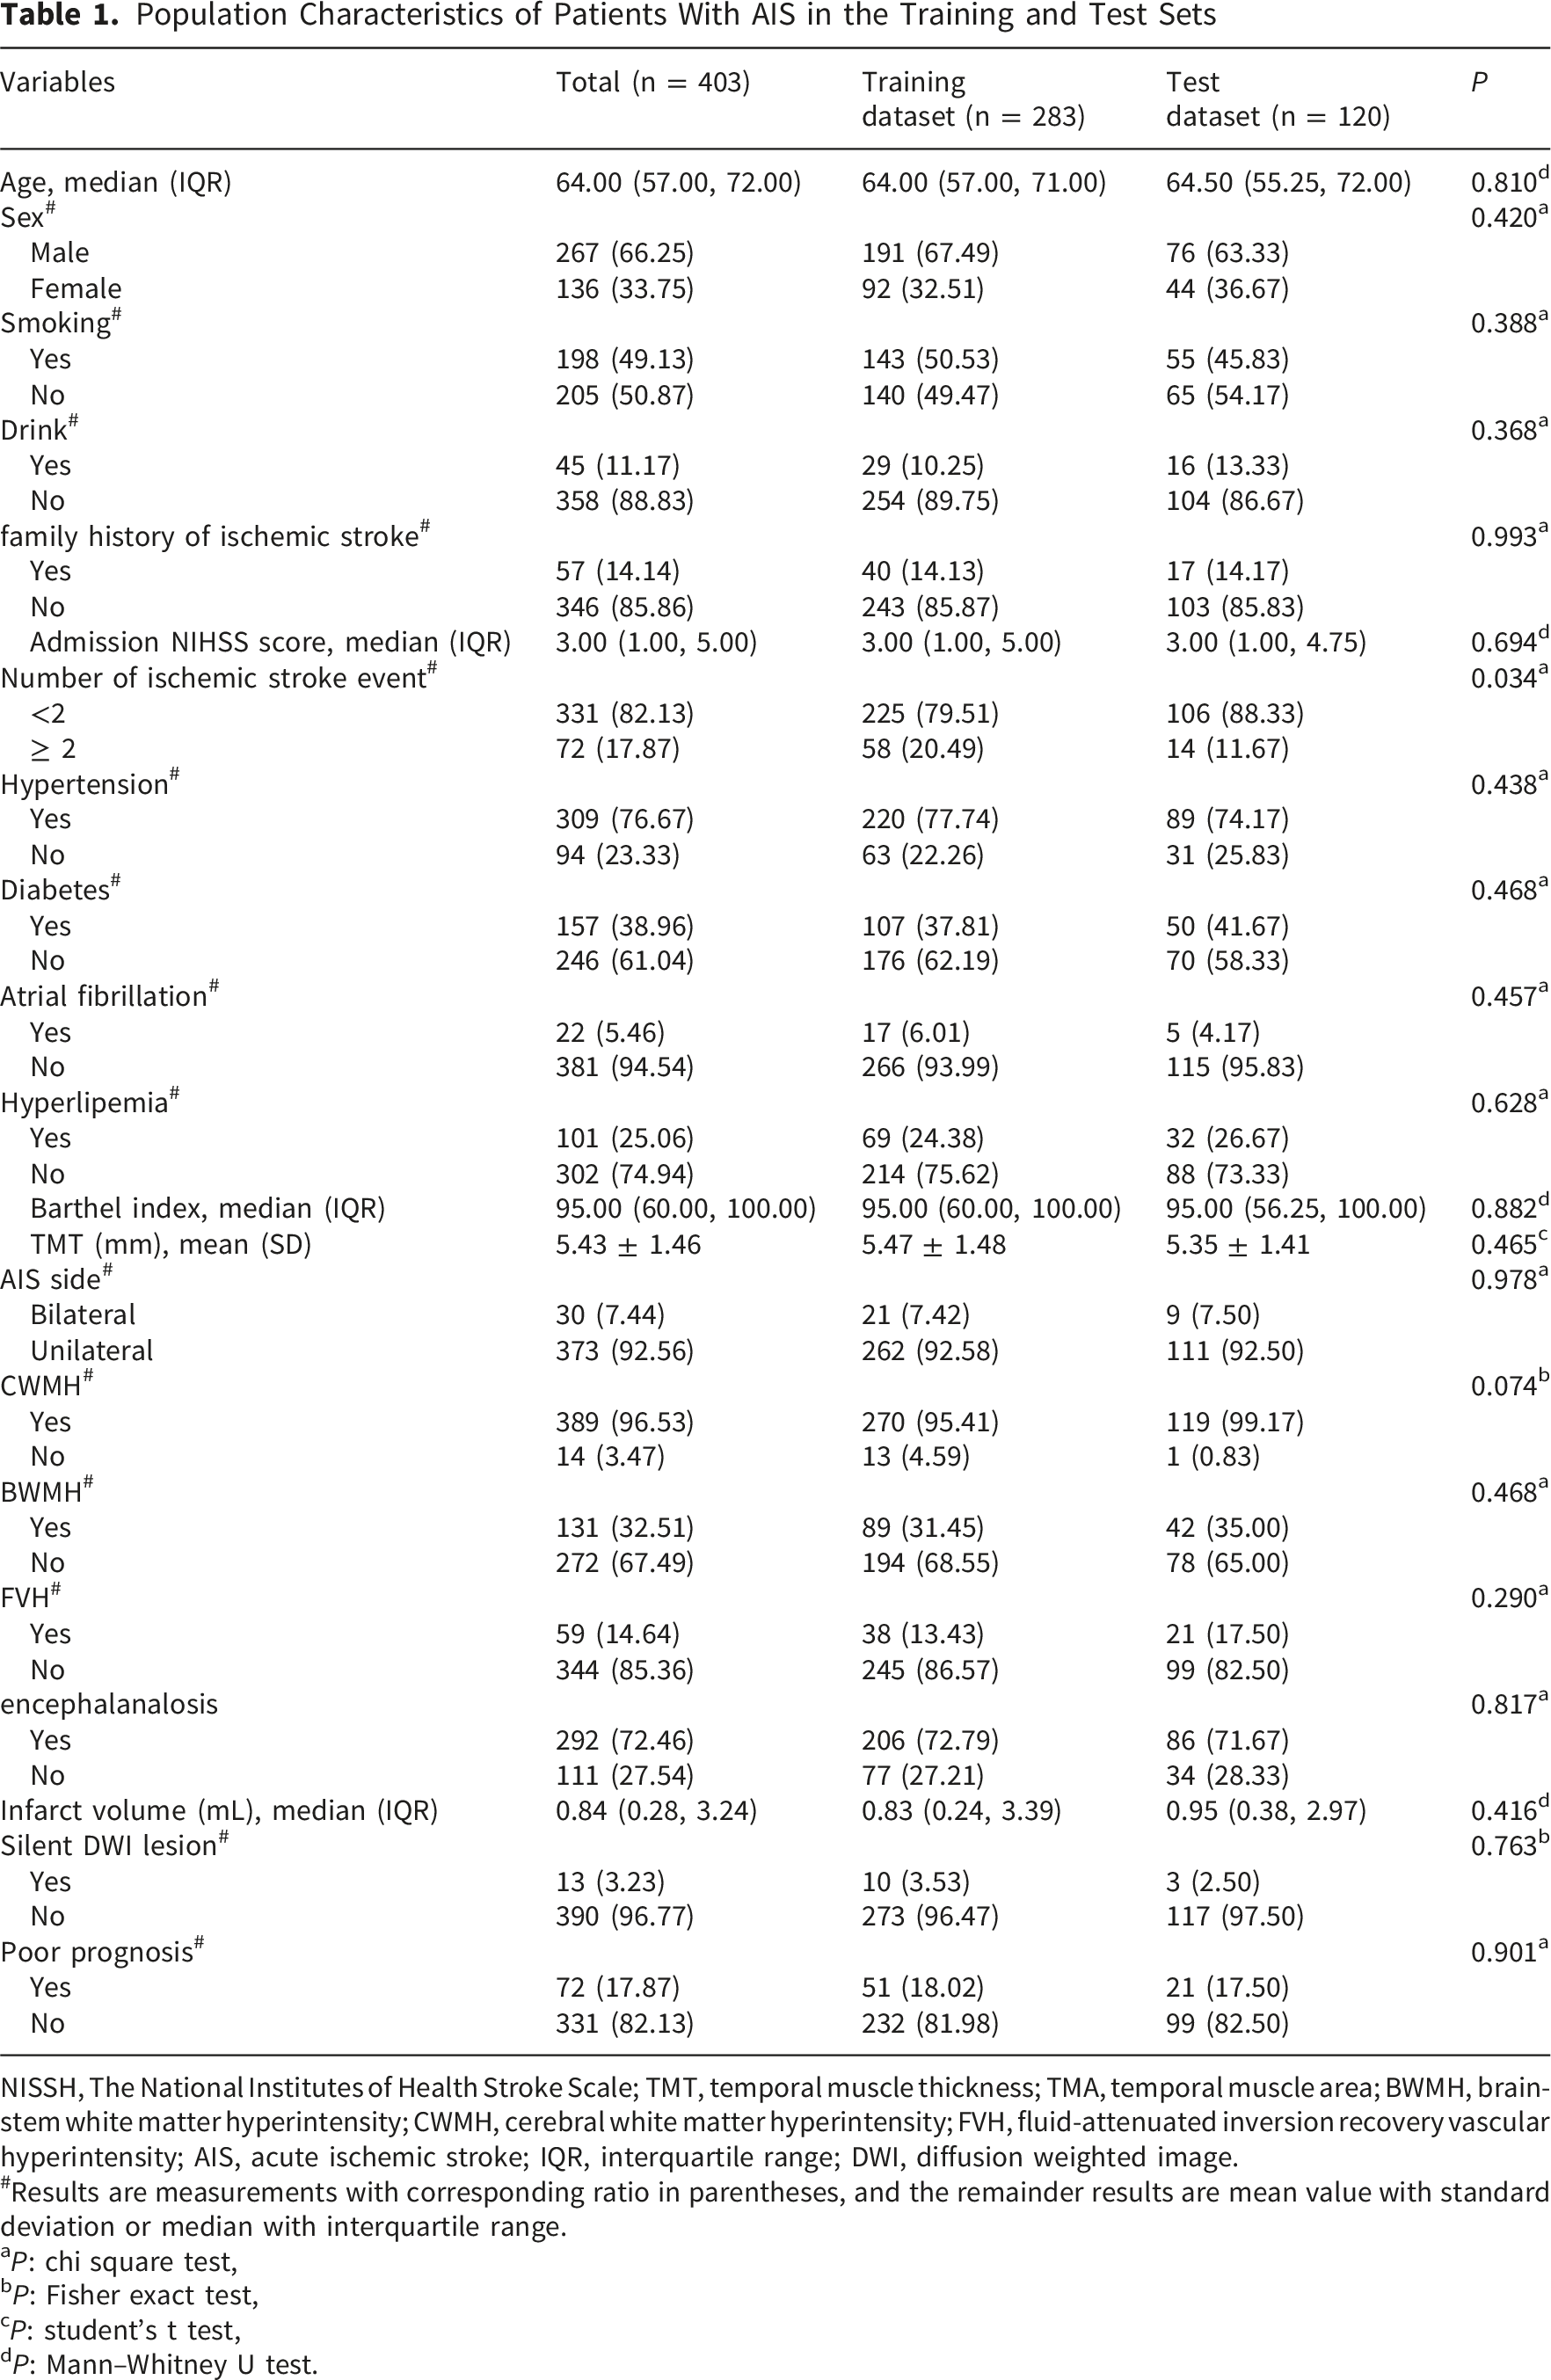
NISSH, The National Institutes of Health Stroke Scale; TMT, temporal muscle thickness; TMA, temporal muscle area; BWMH, brain-stem white matter hyperintensity; CWMH, cerebral white matter hyperintensity; FVH, fluid-attenuated inversion recovery vascular hyperintensity; AIS, acute ischemic stroke; IQR, interquartile range; DWI, diffusion weighted image.
#Results are measurements with corresponding ratio in parentheses, and the remainder results are mean value with standard deviation or median with interquartile range.
aP: chi square test,
bP: Fisher exact test,
cP: student’s t test,
dP: Mann–Whitney U test.
Clinical, Demographic, and Radiological Data of the Study Population Stratified According to 6-Month Favorable or Unfavorable Outcome After Acute Ischemic Stroke
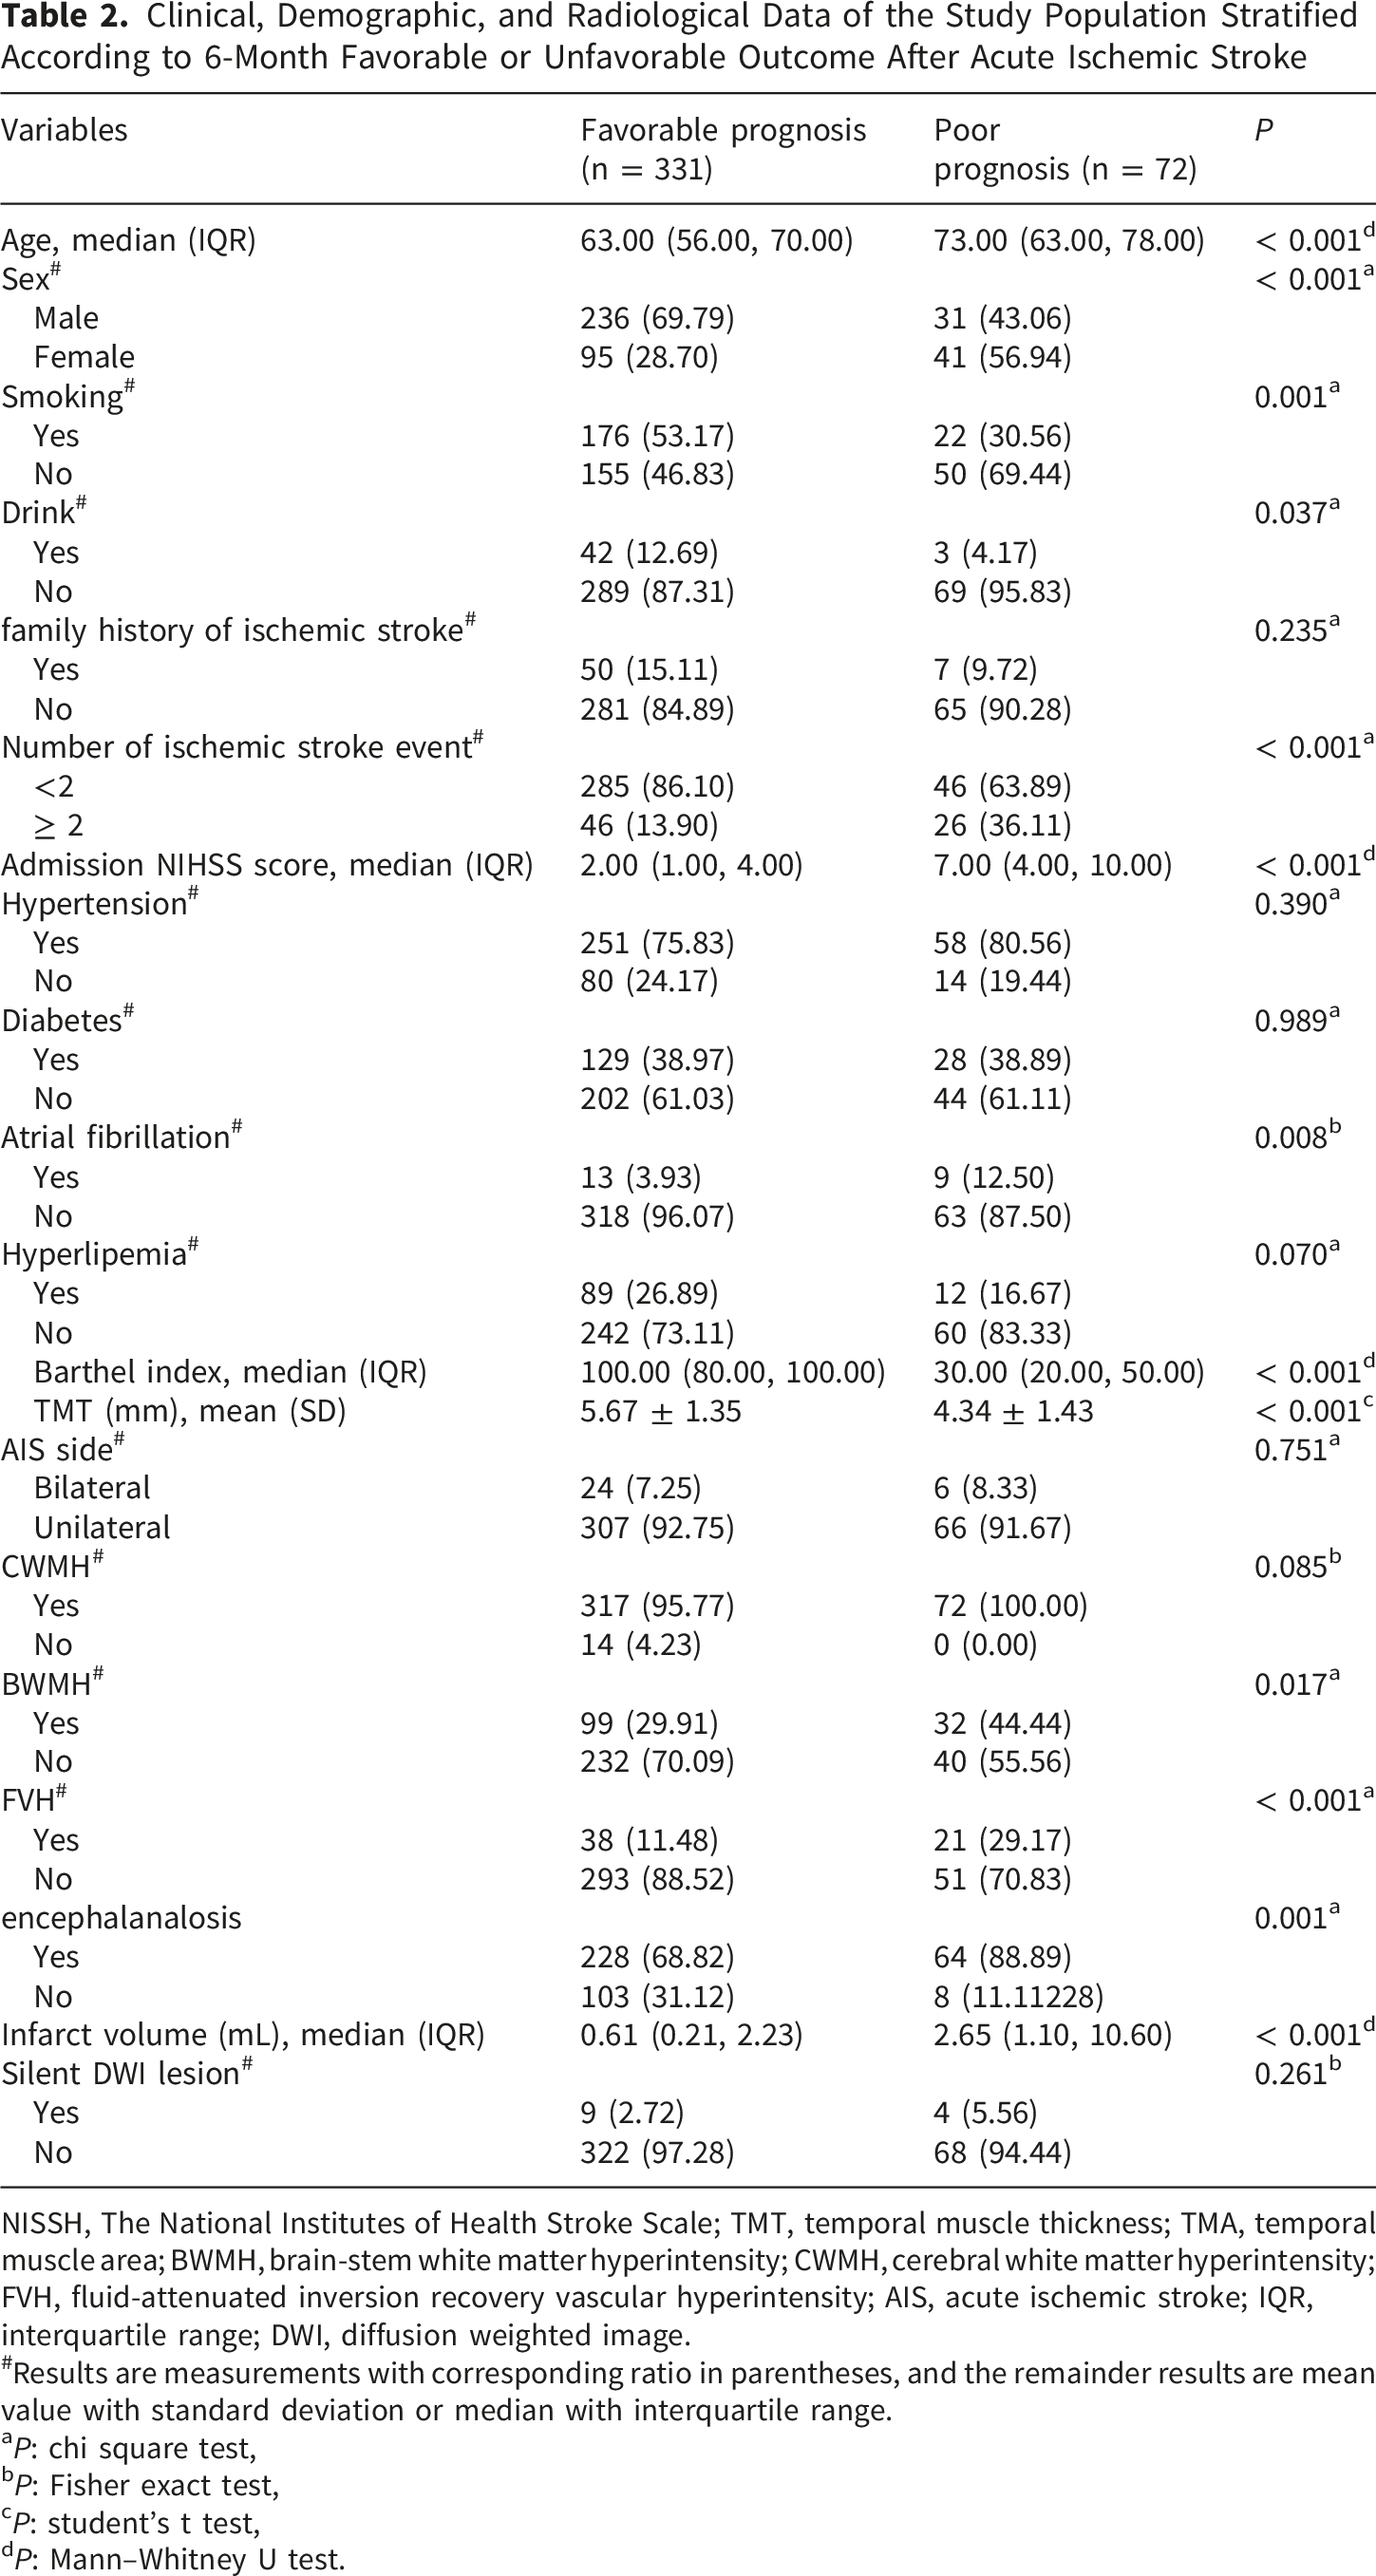
NISSH, The National Institutes of Health Stroke Scale; TMT, temporal muscle thickness; TMA, temporal muscle area; BWMH, brain-stem white matter hyperintensity; CWMH, cerebral white matter hyperintensity; FVH, fluid-attenuated inversion recovery vascular hyperintensity; AIS, acute ischemic stroke; IQR, interquartile range; DWI, diffusion weighted image.
#Results are measurements with corresponding ratio in parentheses, and the remainder results are mean value with standard deviation or median with interquartile range.
aP: chi square test,
bP: Fisher exact test,
cP: student’s t test,
dP: Mann–Whitney U test.
Screening of Clinical and Imaging Variables and Establishment of the Models
Through the 10-fold cross-validation LASSO regression method, 5 clinical features and 3 radiological features were selected (Figure 3). Given 72 positive events in this study, variables were further selected based on the EPV principle and clinical experience for constructing the final clinical, imaging, and combined models. The clinical model included number of ischemic stroke event, admission NIHSS score and BI score. The radiological model included TMT and infarct volume. The combined model was then constructed using all five of the aforementioned variables. All models were developed using logistic regression analysis. The figure illustrates the process of clinical and radiological features selection. (A) and (C) are LASSO coefficient profiles for clinical and radiological features. (B) and (D) are selections of the optimal tuning parameter (λ) in LASSO regression via 10-fold cross-validation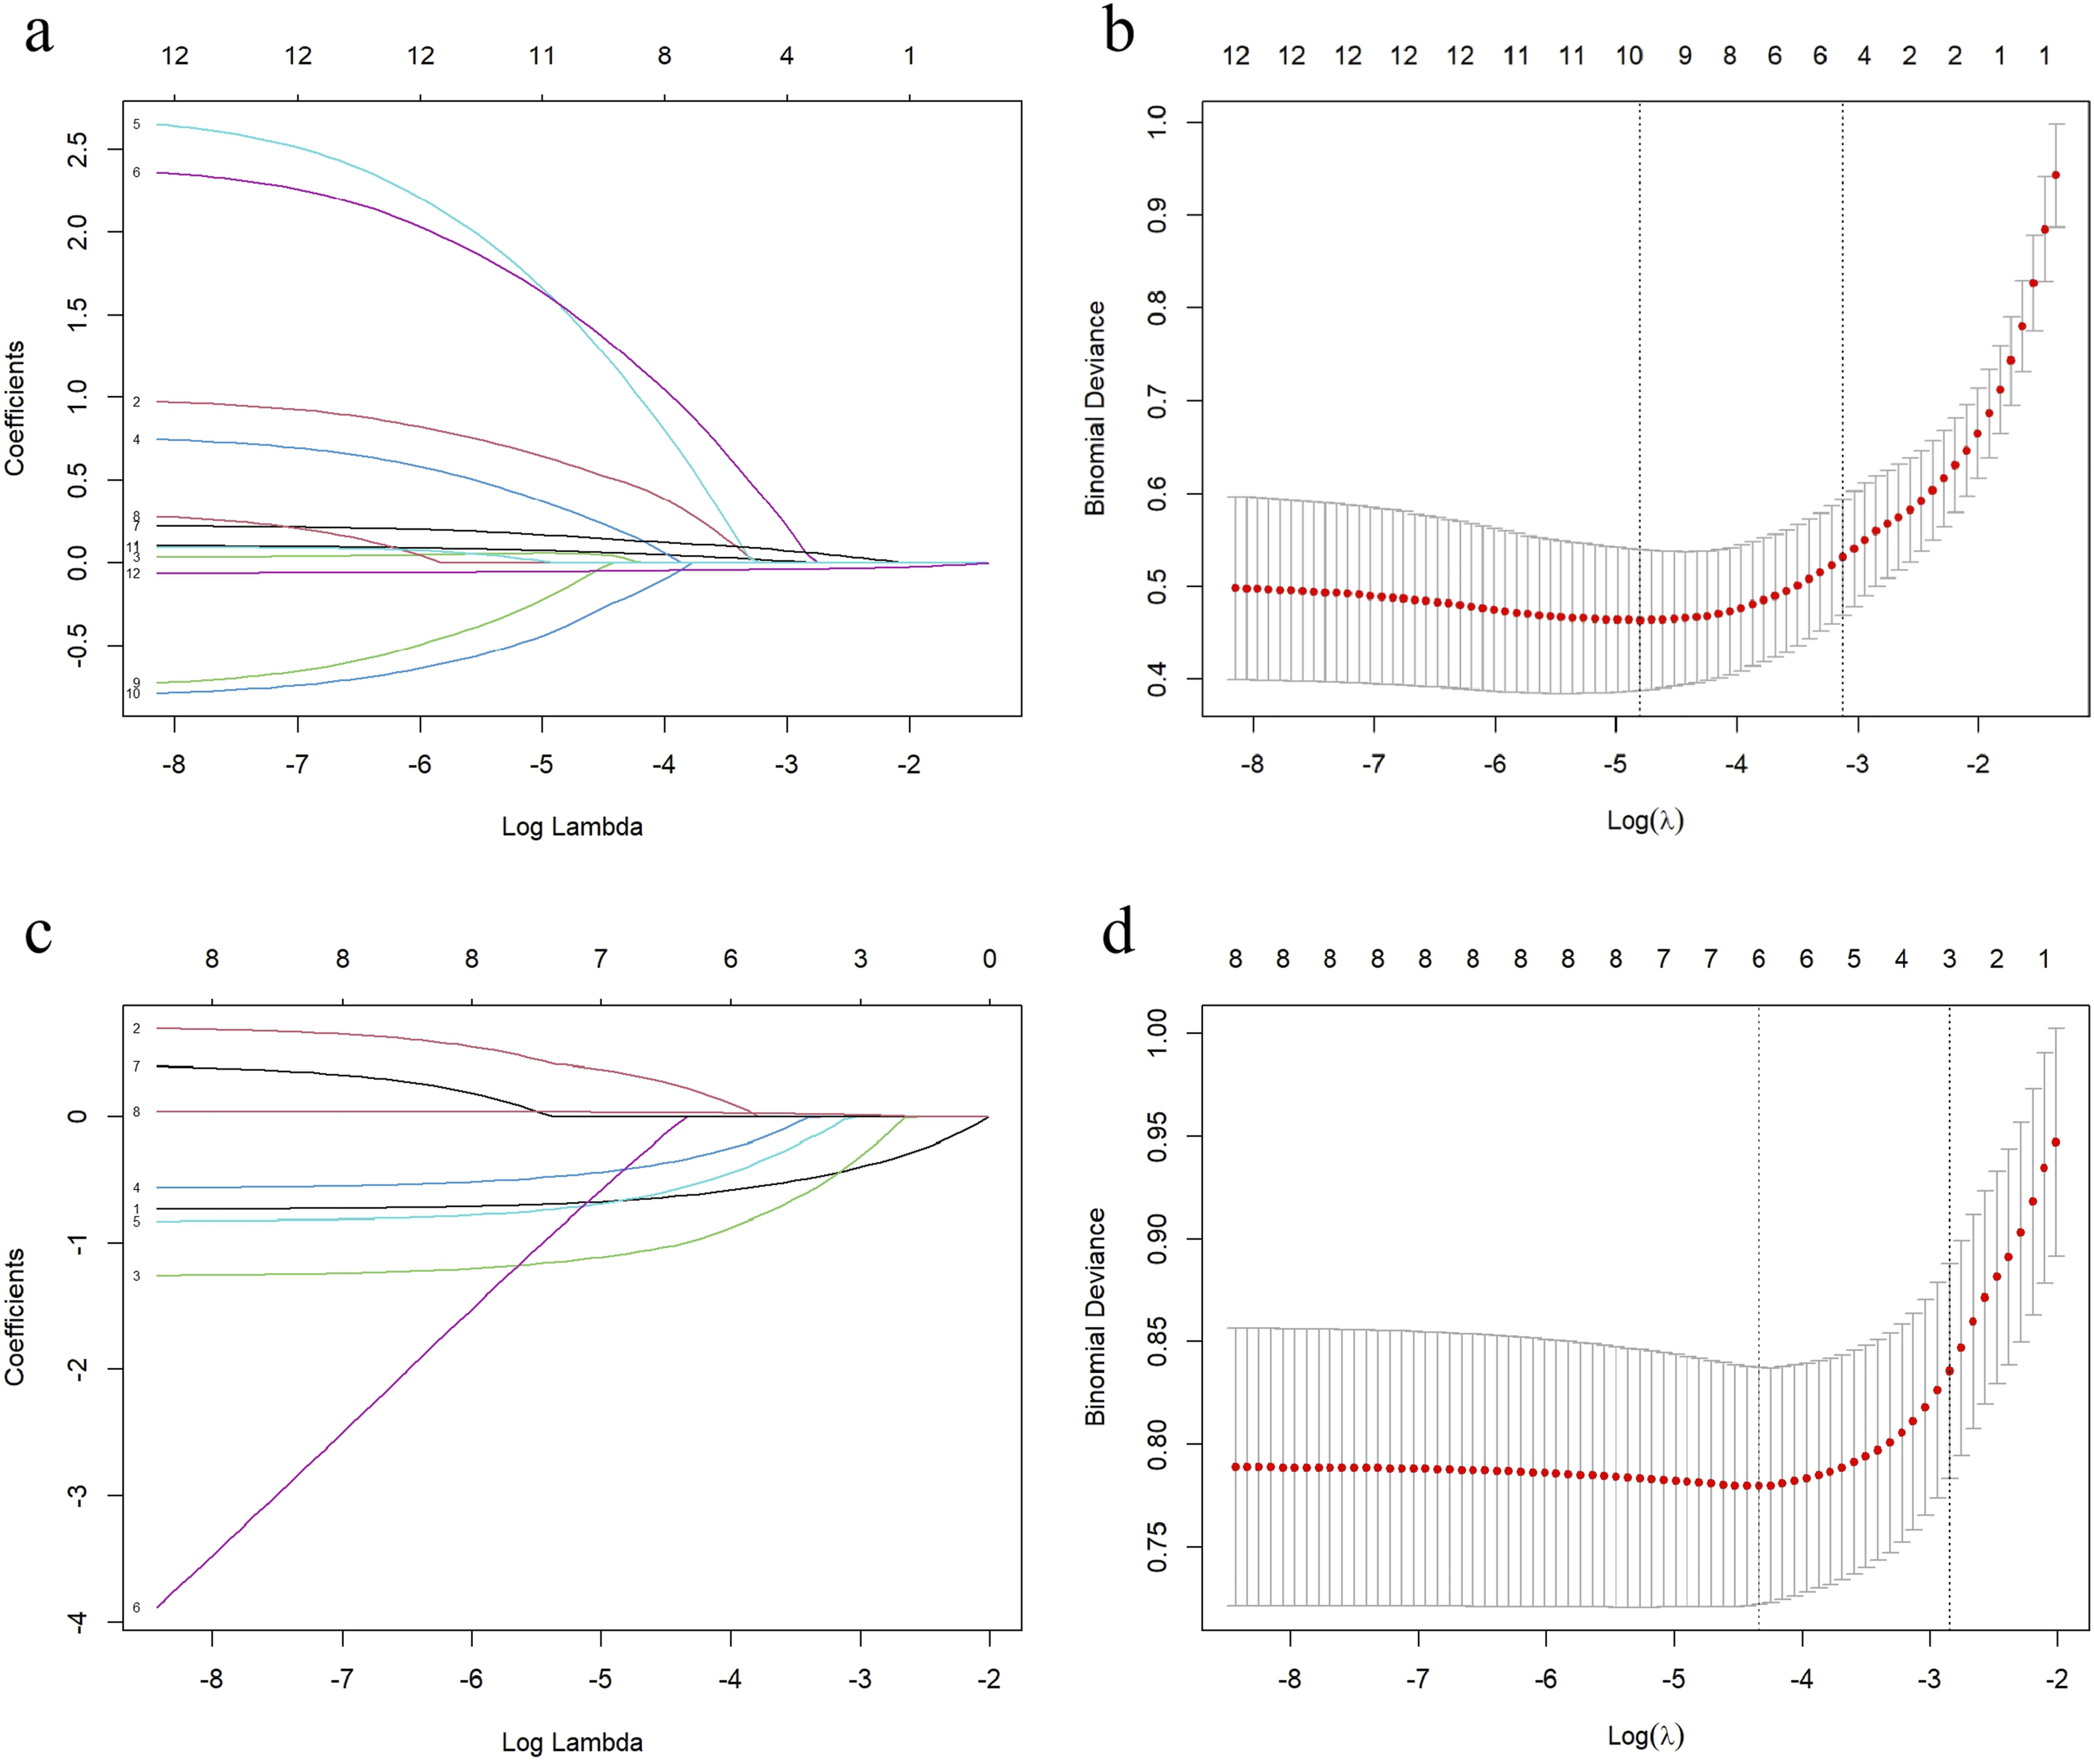
Performance Evaluation and Validation
Prediction Model Performance of the Clinical, Radiological and Combined Model for the Training Set, Test Set and External Validation Set
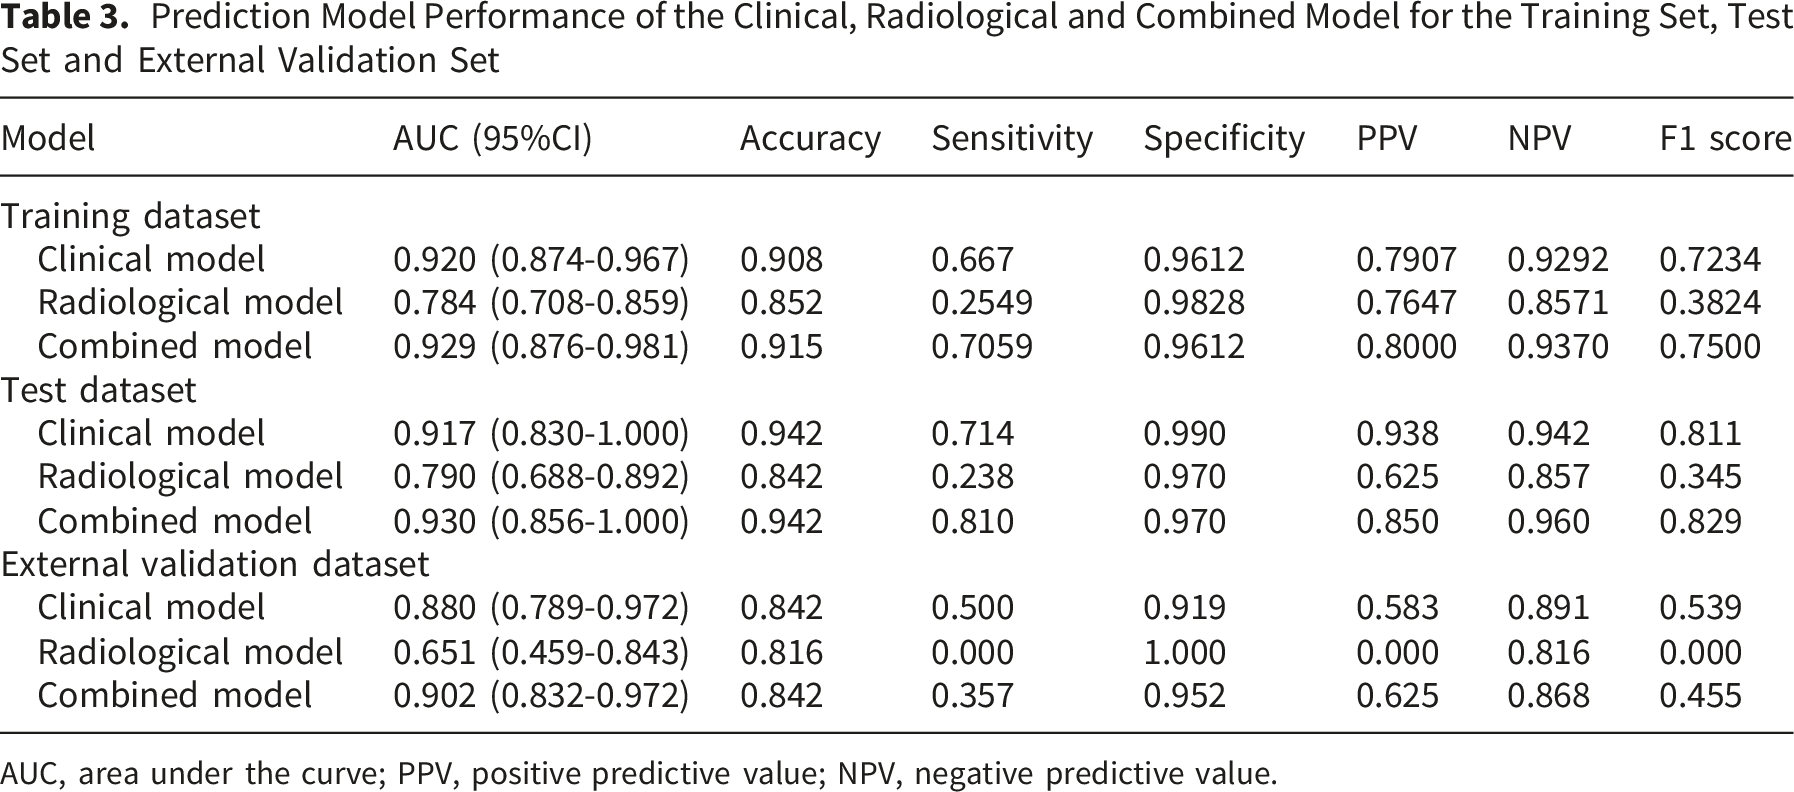
AUC, area under the curve; PPV, positive predictive value; NPV, negative predictive value.
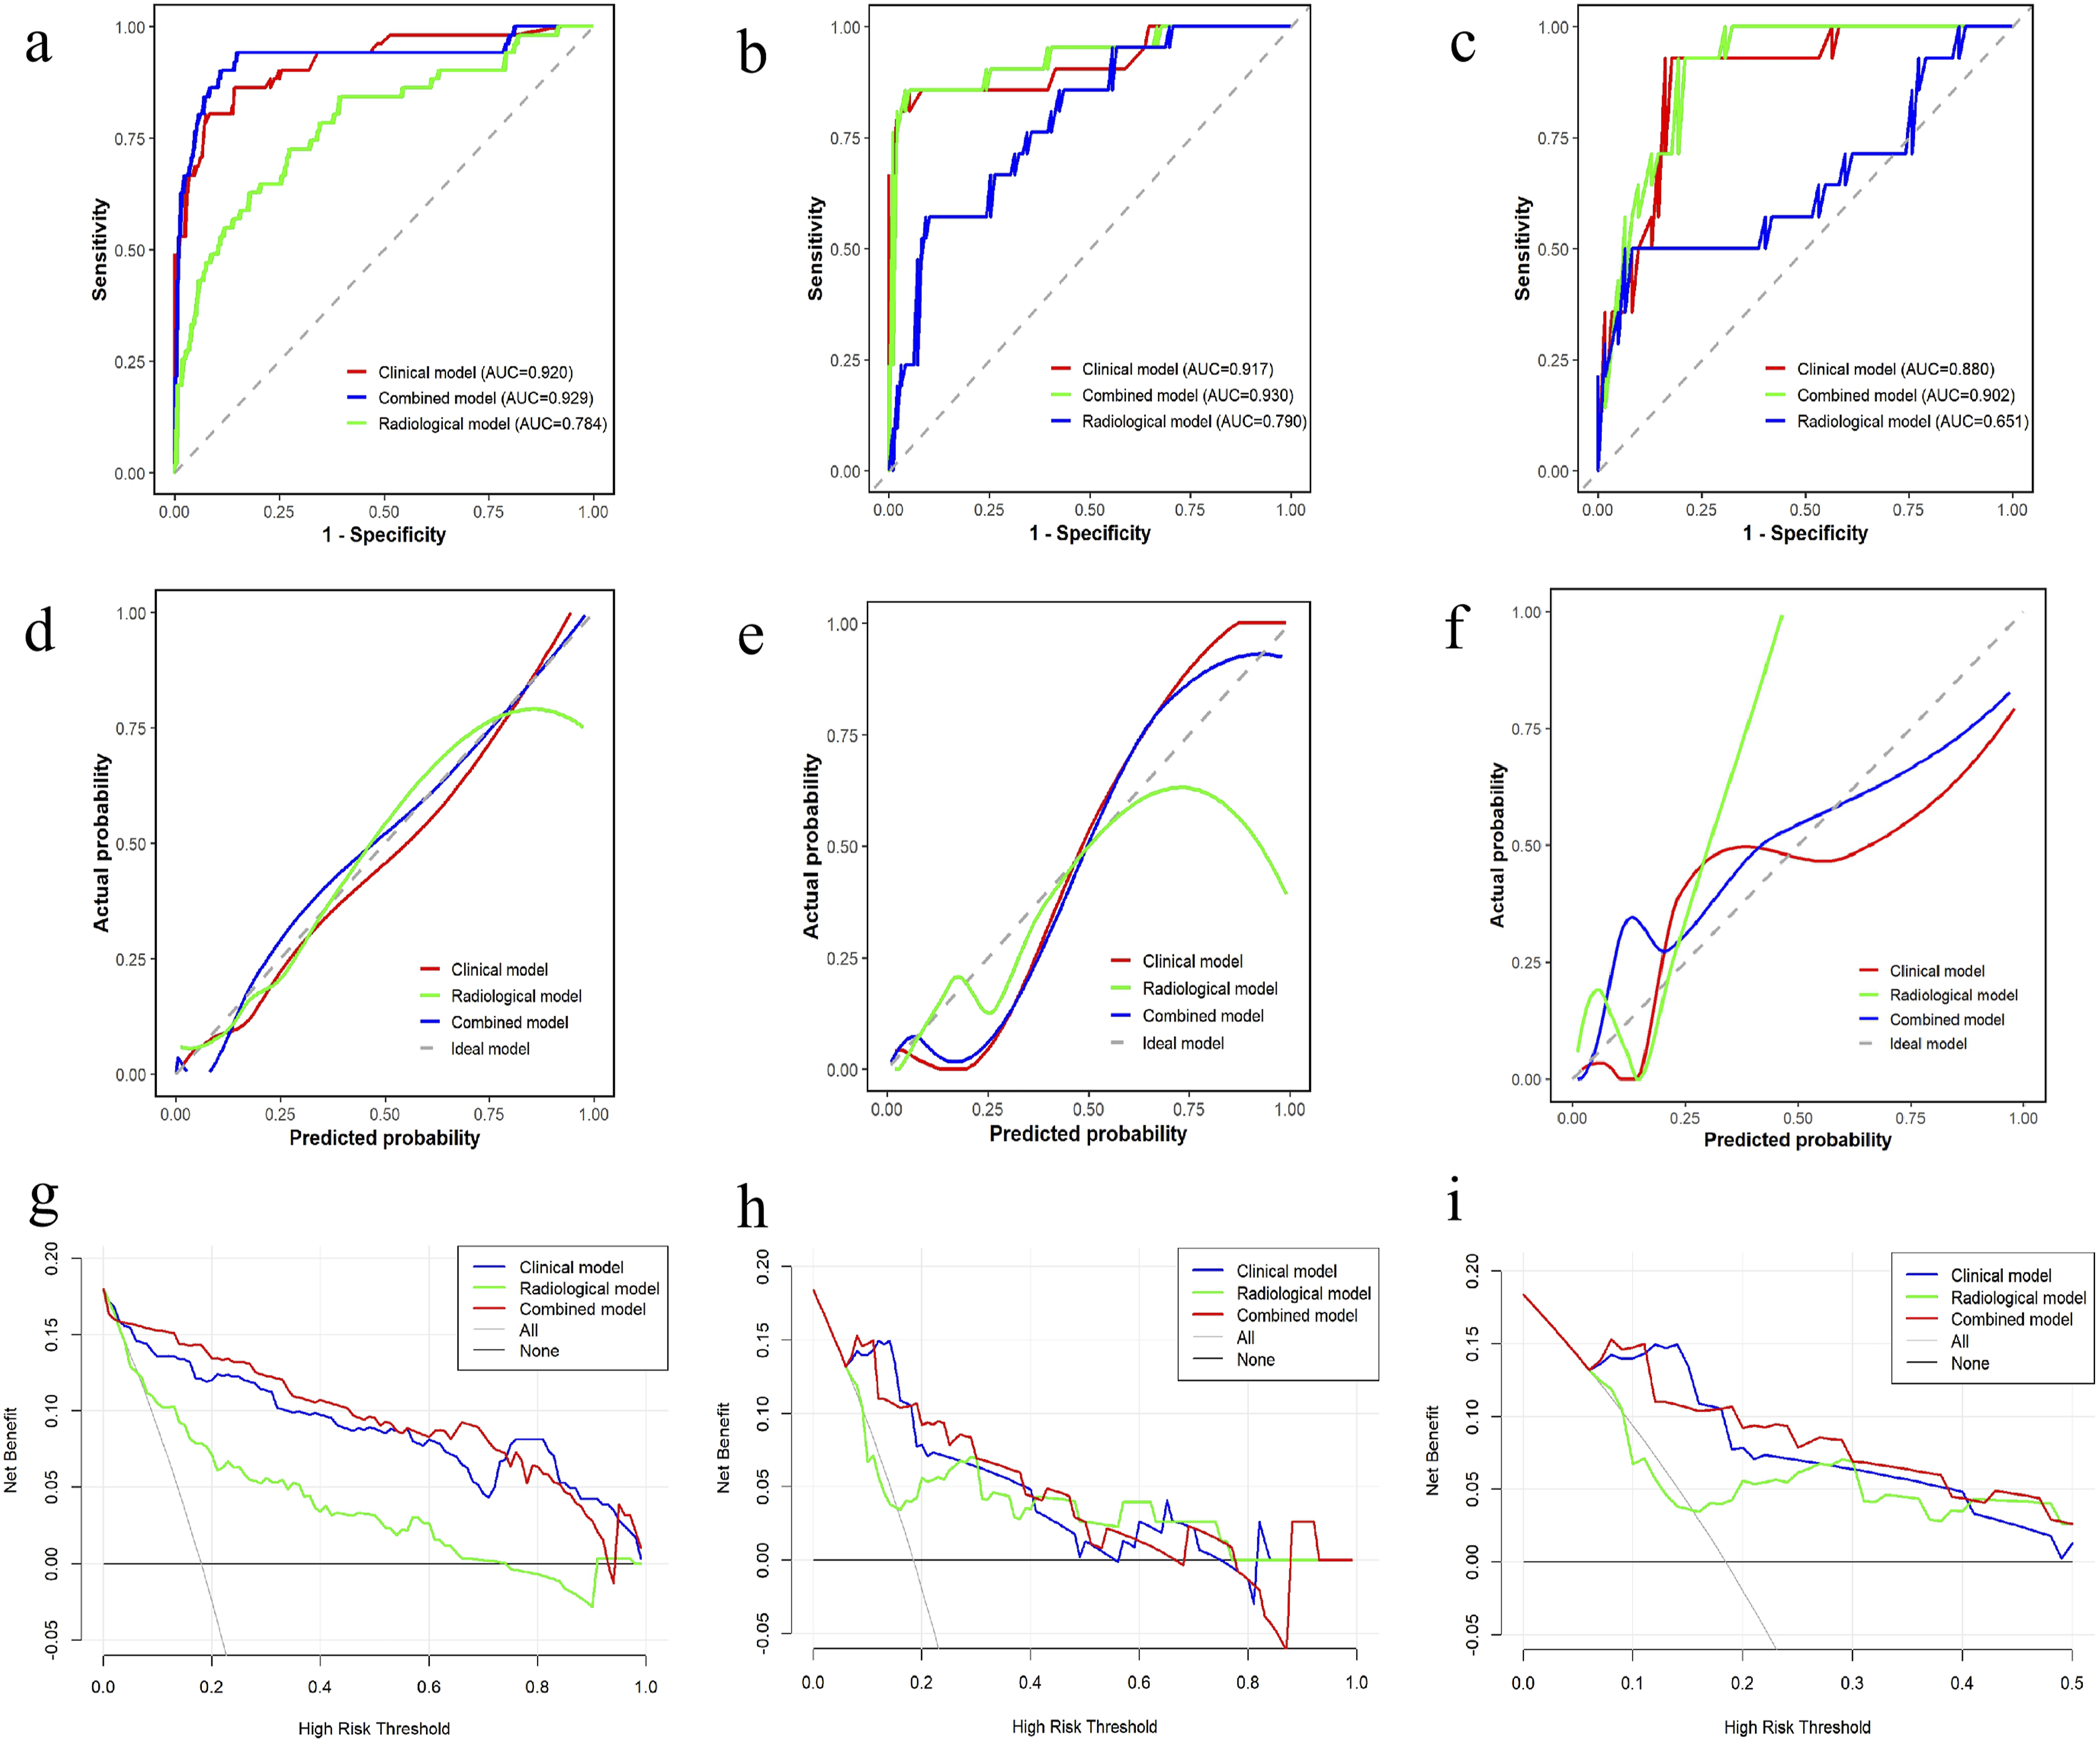
ROC curve, calibration curve, and clinical decision curve. (A) ROC curve of the training set; (B) ROC curve of the test set; (C) ROC curve of the external validation set; (D) the training set calibration curve; (E) test set calibration curve; (F) external validation set calibration curve; (G) training set clinical decision curve; (H) test set clinical decision curve; and (I) external validation clinical decision curve
For the clinical model, the P values of the Hosmer–Lemeshow test in the training set, the test set, and the external validation were 0.855 (χ2 = 4.024), < 0.001 (χ2 = 38.926), and <0.001 (χ2 = 2246.729), respectively. For the radiological model model, the P values of the Hosmer–Lemeshow test in the training set, the test set, and the external validation were 0.103 (χ2 = 13.255), 0.090 (χ2 = 13.699), and <0.001 (χ2 = 1340.090), respectively. For the combined model, the P values of the Hosmer–Lemeshow test in the training set, the test set, and the external validation were < 0.001 (χ2 = 44.007), 0.472 (χ2 = 7.611), and <0.001 (χ2 = 4919.666), respectively. The calibration curves demonstrated good calibration of the combined model in both the training, test and external validation sets (Figure 4).
Additionally, the DCA for the clinical, radiological, and combined models is shown in Figure 4, indicating that both the clinical and combined models provide high net benefit, with the combined model slightly outperforming the clinical model. The accuracy, sensitivity, specificity, PPV, NPV and F1 score of all models were detailed in Table 3.
Discussion
In this study, we created a combined models based on ischemic stroke event, admission NIHSS score, BI score, TMT and infarct volume to predict the probability of unfavorable outcome 6 months after AIS. The combined models exhibited good discriminatory potential in the training and test sets, which was validated in the external validation cohort.
Several previous prognostic scores22-25 and models10,26 have been developed to predict clinical outcome after AIS. The Houston Intra-arterial Recanalization Therapy score uses age, NIHSS score, hypertension, diabetes mellitus, and atrial fibrillation as independent predictors of poor 3-month outcomes. This score was validated using a substantial dataset from the Virtual International Stroke Trials Archive, with an AUC of 0.7523. The Houston Intra-arterial Recanalization Therapy score incorporates three independent predictors of unfavorable 3-month outcome in AIS patients undergoing intra-arterial recanalization therapy: age over 75 years, NIHSS score >18, and baseline glucose concentration >150 mg/dL. The score demonstrated AUC values of 0.69 and 0.73 across two distinct cohorts. 24 However, it is somewhat limited because all three variables in score determination are dichotomized, which results in a loss of information. Our combined model uses continuous variables to predict the robability of 6-month unfavorable outcome in individual AIS patients. This methodology facilitates enhanced precision and granularity in the assessment of individual patient risk profiles, as continuous variables preserve the complete informational spectrum of clinical data, thereby avoiding the oversimplification inherent in binary categorization. As exemplified by the NIHSS core, which quantifies the severity of neurological deficits on a continuous scale ranging from 0 to 42, is employed, enabling the model to capture nuanced gradations in stroke severity that could be crucial for accurate outcome prognostication. By maintaining the granular integrity of these pivotal clinical parameters, our combined model endeavors to deliver more individualized and refined prognostic accuracy for 6-month outcomes, surpassing the limitations of scores reliant on dichotomized variables.
Several studies have recently explored the effect of infarct lesions on prognosis and treatment of ischemic stroke using radiomics. Xu et al investigated the value of radiomics based on DWI and FLAIR imaging combined with total cerebral small vessel disease burden score in predicting AIS outcome after thrombolysis in 201 patients. The FLAIR model AUC was 0.922 (95% CI, 0.876–0.968). 12 Wang et al developed a DWI-based clinical radiomics nomogram that demonstrated accuracy for prediction of ischemic stroke outcome in both the training dataset (AUC = 0.80; 95% CI, 0.75–0.86] and an independent validation cohort (AUC = 0.73; 95% CI, 0.63–0.82). 27 However, radiomics depends heavily on handcrafted feature engineering, which is vulnerable to human bias and may result in a high superfluity of information. 28 In our study, the combined model included only five variables: ischemic stroke event, admission NIHSS score, BI score, TMT and infarct volume. Unlike previous tools, our model avoids the complex and time-consuming process of handcrafted feature engineering in radiomics. By focusing on these five readily available and clinically meaningful variables, it reduces the potential for human bias introduced by feature selection and minimizes information redundancy. This not only simplifies the model construction but also enhances its practicality and reproducibility in real-world clinical settings.
Sarcopenia has gained significant research attention due to its robust predictive value for adverse functional outcomes in brain tumor patient. 14 It has also shown predictive value in patients with other neurosurgical conditions such as traumatic brain injury 29 and subarachnoid hemorrhage 30 as well as in patients with stroke.6,31-33 The temporal muscle is one of the few muscles that can be fully delineated on routinely performed MRI of the brain. Moreover, TMT is highly correlated with the cross-sectional area of lumbar skeletal muscles and the skeletal muscle index, serving as a proxy for sarcopenia.34-36 Our findings are consistent with previous studies, indicating that lower TMT is associated with poor prognosis in patients with ischemic stroke. The underlying mechanisms may involve the following factors. First, sarcopenia may be associated with poor outcomes via increased skeletal muscle secretion of the inflammatory cytokines interleukin-6 and interleukin-10 and increased interleukin-6:interleukin-10 ratio. 37 In addition, patients with neurosurgical conditions are usually bedridden for some time owing to impaired consciousness, sedation, or debility related to surgery. Skeletal muscle is further catabolized during the treatment and hospitalization period, making rehabilitation difficult for those with low skeletal muscle mass.
The NIHSS score is the most widely used stroke scale. 38 Wouters et al showed that ischemic stroke patients with a high NIHSS score at discharge typically had greater disease severity and infarct size. This correlated with their 90-day clinical outcome. 39 The BI is widely used to assess activities of daily living, with a higher score indicating a lower risk of poor outcome. Govan et al demonstrated that higher NIHSS and mRS scores, as well as lower BI scores, were associated with more severe strokes, larger infarct volumes in the brain, and worse outcomes at 90 days. 40 Macciocchi et al identified age, previous stroke, initial neurological deficit, and lesion location as significant predictors of functional outcomes in ischemic stroke patients. 41 In this study, ischemic stroke event, BI score and NHISS score at admission were significantly associated with poor 6-month outcomes in patients with acute ischemic stroke (AIS), consistent with previous research findings.
It is worth noting that generally, we regard the infarct volume as being positively correlated with the prognosis of patients with ischemic stroke. Previous studies 42 have demonstrated that infarct volume (IV) is a strong independent predictor of functional prognosis in patients with ischemic stroke. Yedavalli Vivek et al 43 established that the optimal cutoff value for IV in stroke prognosis assessment is 15 mL, which demonstrates high specificity and sensitivity. When the threshold exceeds 40 mL, a significant reduction in the probability of favorable prognosis is observed. The findings of this study are consistent with most previous literature, indicating a poorer prognosis in patients with larger infarct volumes. However, the infarct volumes in this study were generally smaller, therefore the specific cutoff values for infarct volume in predicting prognosis may differ from those reported in previous studies with larger infarct volume ranges. This suggests that the relationship between infarct volume and prognosis might exhibit some variability depending on the study population’s baseline characteristics, such as the severity of initial stroke, the timing of infarct volume measurement, and potential differences in treatment strategies implemented. Future studies with larger sample sizes encompassing a broader spectrum of infarct volumes, especially including more cases with very small and very large infarcts, would help to further clarify the generalizability and potential adjustments needed for infarct volume thresholds in different clinical contexts. Additionally, subtype analyses based on infarct location could provide more nuanced insights, as infarcts in critical brain regions might have a more profound impact on prognosis even with relatively smaller volumes compared to non-eloquent areas.
Our study has some limitations. First, the study was retrospective in design and selection and attrition biases were present. Second, we did not consider stroke subtype, acute treatments and infarct location. 44 Future prospective studies should assess whether incorporating novel predictors may improve predictive accuracy. Third, our temporal muscle measurements were based on manual segmentation. Interestingly, a deep learning-based quantification of TMA has been reported. 14 We plan to continue this study using deep learning in the future. Finally, The current model only demonstrates predictive value for 6-month outcomes and cannot dynamically assess corresponding prognostic outcomes as the disease progresses. Future work could incorporate intelligent machine learning methods to fully utilize time-series data (e.g., continuous follow-up mRS scores, NIHSS scores, etc.) for dynamic updates of prognostic predictions, thereby enhancing the model’s accuracy and practicality.45,46
Conclusion
A combined model using ischemic stroke event, admission NIHSS score, BI score, TMT and infarct volume as input variables may be used to predict 6-month outcome in AIS patients.
Supplemental Material
Supplemental Material - Construction and Validation of a Risk Prediction Model Incorporating Temporal Muscle Thickness for Adverse Outcome in Acute Ischemic Stroke Patients
Supplemental Material for Construction and Validation of a Risk Prediction Model Incorporating Temporal Muscle Thickness for Adverse Outcome in Acute Ischemic Stroke Patients by Huanpeng Wang, Yanchun Wu, Xiaojia Wu, Shuyan Su, Ziting Peng, Minping Lin, Xiaoqin Xu, Dongli Chen, Hong Zhang, Ruibin Huang in Journal of Central Nervous System Disease
Supplemental Material
Supplemental Material - Construction and Validation of a Risk Prediction Model Incorporating Temporal Muscle Thickness for Adverse Outcome in Acute Ischemic Stroke Patients
Supplemental Material for Construction and Validation of a Risk Prediction Model Incorporating Temporal Muscle Thickness for Adverse Outcome in Acute Ischemic Stroke Patients by Huanpeng Wang, Yanchun Wu, Xiaojia Wu, Shuyan Su, Ziting Peng, Minping Lin, Xiaoqin Xu, Dongli Chen, Hong Zhang, Ruibin Huang in Journal of Central Nervous System Disease
Footnotes
Acknowledgments

ORCID iDs
Ethical Considerations
The study protocol was reviewed and approved by the Ethics Committee of the First Affiliated Hospital of Shantou University of Medical College(no. B-2024-164).
Consent to Participate
This study received ethical approval from the Ethics Committee of the First Affiliated Hospital of Shantou University of Medical College. The present study constitutes a retrospective study into health services, all patient information was de-identified and patient consent was not required.
Author Contributions
ZTP, MPL, XQX, DLC, XJW and SYS acquired data, RBH, HPW, SYS performed the statistical analysis and interpreted data. HPW, YCW and RBH prepared the manuscript. RBH and HZ revised the manuscript. All authors approved the protocol.
Funding
The authors disclosed receipt of the following financial support for the research, authorship, and/or publication of this article: This work was supported by Guangdong Nursing Association Research Fund Project (Grant numbers: GDHLYJYB202430) and 2026 Guangdong Provincial Medical Research Fund Approved Projects (Grant numbers: B2026010).
Declaration of Conflicting Interests
The authors declared no potential conflicts of interest with respect to the research, authorship, and/or publication of this article.
Data Availability Statement
The data in this study are available from the corresponding author on a reasonable request.
Supplemental Material
Supplemental material for this article is available online.
References
Supplementary Material
Please find the following supplemental material available below.
For Open Access articles published under a Creative Commons License, all supplemental material carries the same license as the article it is associated with.
For non-Open Access articles published, all supplemental material carries a non-exclusive license, and permission requests for re-use of supplemental material or any part of supplemental material shall be sent directly to the copyright owner as specified in the copyright notice associated with the article.
