
Abstract
Keywords
Introduction
The world’s population is ageing rapidly, marking an unprecedented and irreversible demographic shift. According to the World Health Organization, the number of adults aged 60 years or older will rise from 1 billion in 2020 to 1.4 billion by 2030, reaching 2.1 billion by 2050. 1 Countries worldwide are adapting their healthcare and social systems to support the ageing populations. The prevalence of cardiovascular diseases (CVDs) increases with age. Projections indicate substantial growth in CVD cases as the number of older adults expands. 2 CVDs remain the leading global cause of death, responsible for 19.8 million deaths in 2022, 32% of all deaths, with heart attacks and strokes accounting for 85% of the cases. 3 This also results in huge financial burden for the society.
Continuous health monitoring has become essential for effective CVD management, and physiological variability measures play a key role. Heart rate variability (HRV), derived from beat-to-beat fluctuations in cardiac intervals, is a well-established indicator of autonomic function. 4 Reduced HRV reflects autonomic impairment and is associated with cardiac mortality; it also predicts post-myocardial infarction outcomes and can reveal autonomic imbalance that precedes dangerous arrhythmias. 4 Blood pressure variability (BPV) is an equally important predictor of cardiovascular risk. 5 Long-term BPV is linked to higher risks of cardiovascular mortality, coronary heart disease, and stroke because it reflects instability in vascular and autonomic regulation. Power spectral analysis of HRV and BPV is a widely used method for assessing autonomic regulation. 6 Their spectra contain two key bands: a high-frequency (HF) component (0.15-0.50 Hz) indicating parasympathetic activity, and a low-frequency (LF) component (0.04-0.15 Hz) reflecting combined sympathetic and parasympathetic influences. The LF/HF ratio serves as an index of sympathovagal balance. These frequency-domain measures provide practical markers of autonomic dynamics and baroreflex functions, and have become essential for detecting autonomic dysfunction and predicting cardiovascular risk, as reduced HF power or elevated LF/HF ratios are associated with higher cardiac morbidity and mortality. Continuous monitoring of HRV and BPV in conventional mobile health systems typically requires sensors to be attached at standardized body locations. Ambulatory electrocardiogram (ECG) uses chest electrodes, while photoplethysmogram (PPG) rely on fingertip, earlobe, or forehead probes. Each monitoring session usually involves manual setup, which can be difficult for older adults living alone. Moreover, many users find these sensors intrusive or uncomfortable, limiting their acceptance in daily life. Measuring the pupillary dynamic known as pupil size variability (PSV) offers a promising and unobtrusive method for monitoring autonomic function, as it can be captured using camera-equipped smart eyewear. PSV refers to the spontaneous fluctuations in pupil size that occur without changes in lighting or visual focus. Although once regarded as simple Gaussian noise arising from the pupillary muscles,7,8 subsequent studies showed that PSV actually embeds respiratory rhythms 9 and frequency components similar to those found in HRV and BPV. 10 These shared spectral features arise from the common cardiovascular regulatory signals originating in the brainstem and coupled to the pupil via parasympathetic and sympathetic pathways. Therefore, PSV has been proposed as a non-invasive marker of autonomic nervous system (ANS) activity. However, early efforts to apply conventional HRV and BPV frequency-domain techniques to PSV produced inconsistent results, highlighting the need for deeper investigation into the physiological mechanisms underlying PSV.11,12
This paper presents a computational model that integrates pupillary biomechanics with cardiovascular regulatory mechanisms to simulate PSV. The model is designed to investigate the physiological foundations of PSV and to support its potential use as an indirect, eye-based measure of ANS function. The main objective is to simulate PSV under different ambient brightness conditions and assess how effectively the resulting frequency-domain indices reflect cardiovascular variability and autonomic balance. The insights gained from this work will help advance PSV as an easily accessible biomarker for detecting cardiovascular abnormalities.
Related Works
Across decades of development, computational modeling of pupillary dynamics has evolved from simple linear descriptions to more sophisticated biomechanical and stochastic frameworks. Early works by Day and Dennison provided foundational models. Day et al proposed modeling the pupillary light reflex (PLR) loop as a second-order linear system, 13 while Dennison introduced a parametric sphincter–dilator model grounded in empirical tension measurements from stimulated cat iris muscles. 14 Semmlow and Stark further proposed a biomechanical model, which comprised spring and damper elements, to simulate PLRs. 15 Hansmann expanded the physiological basis by detailing iris muscle mechanics, autonomic pathways, and key nonlinear behaviors. 16 Building on these foundations, Usui and Stark developed a nonlinear stochastic model that reproduced random fluctuations with a range-nonlinearity (RNL) property. 17 They presumed this behavior as Gaussian noise originating within the pupillary control system. RNL refers to fluctuations that are largest at mid-range pupil sizes and minimal at the extremes of constriction or dilation. Sun et al extended the systems perspective by linking pupil dynamics to broader visual and neurological processes, incorporating adaptive and nonlinear elements. 18 More recently, Denison et al introduced a convolution-based model for explaining pupillary response to rapid sequences of visual events. 19 Although these prior studies demonstrated a progression from simple empirical models to systems-level representations, they only focused on light- or visually-evoked responses, and did not address ANS-related PSV, which was generally regarded as noise rather than a physiological signal.
Physiological Mechanisms
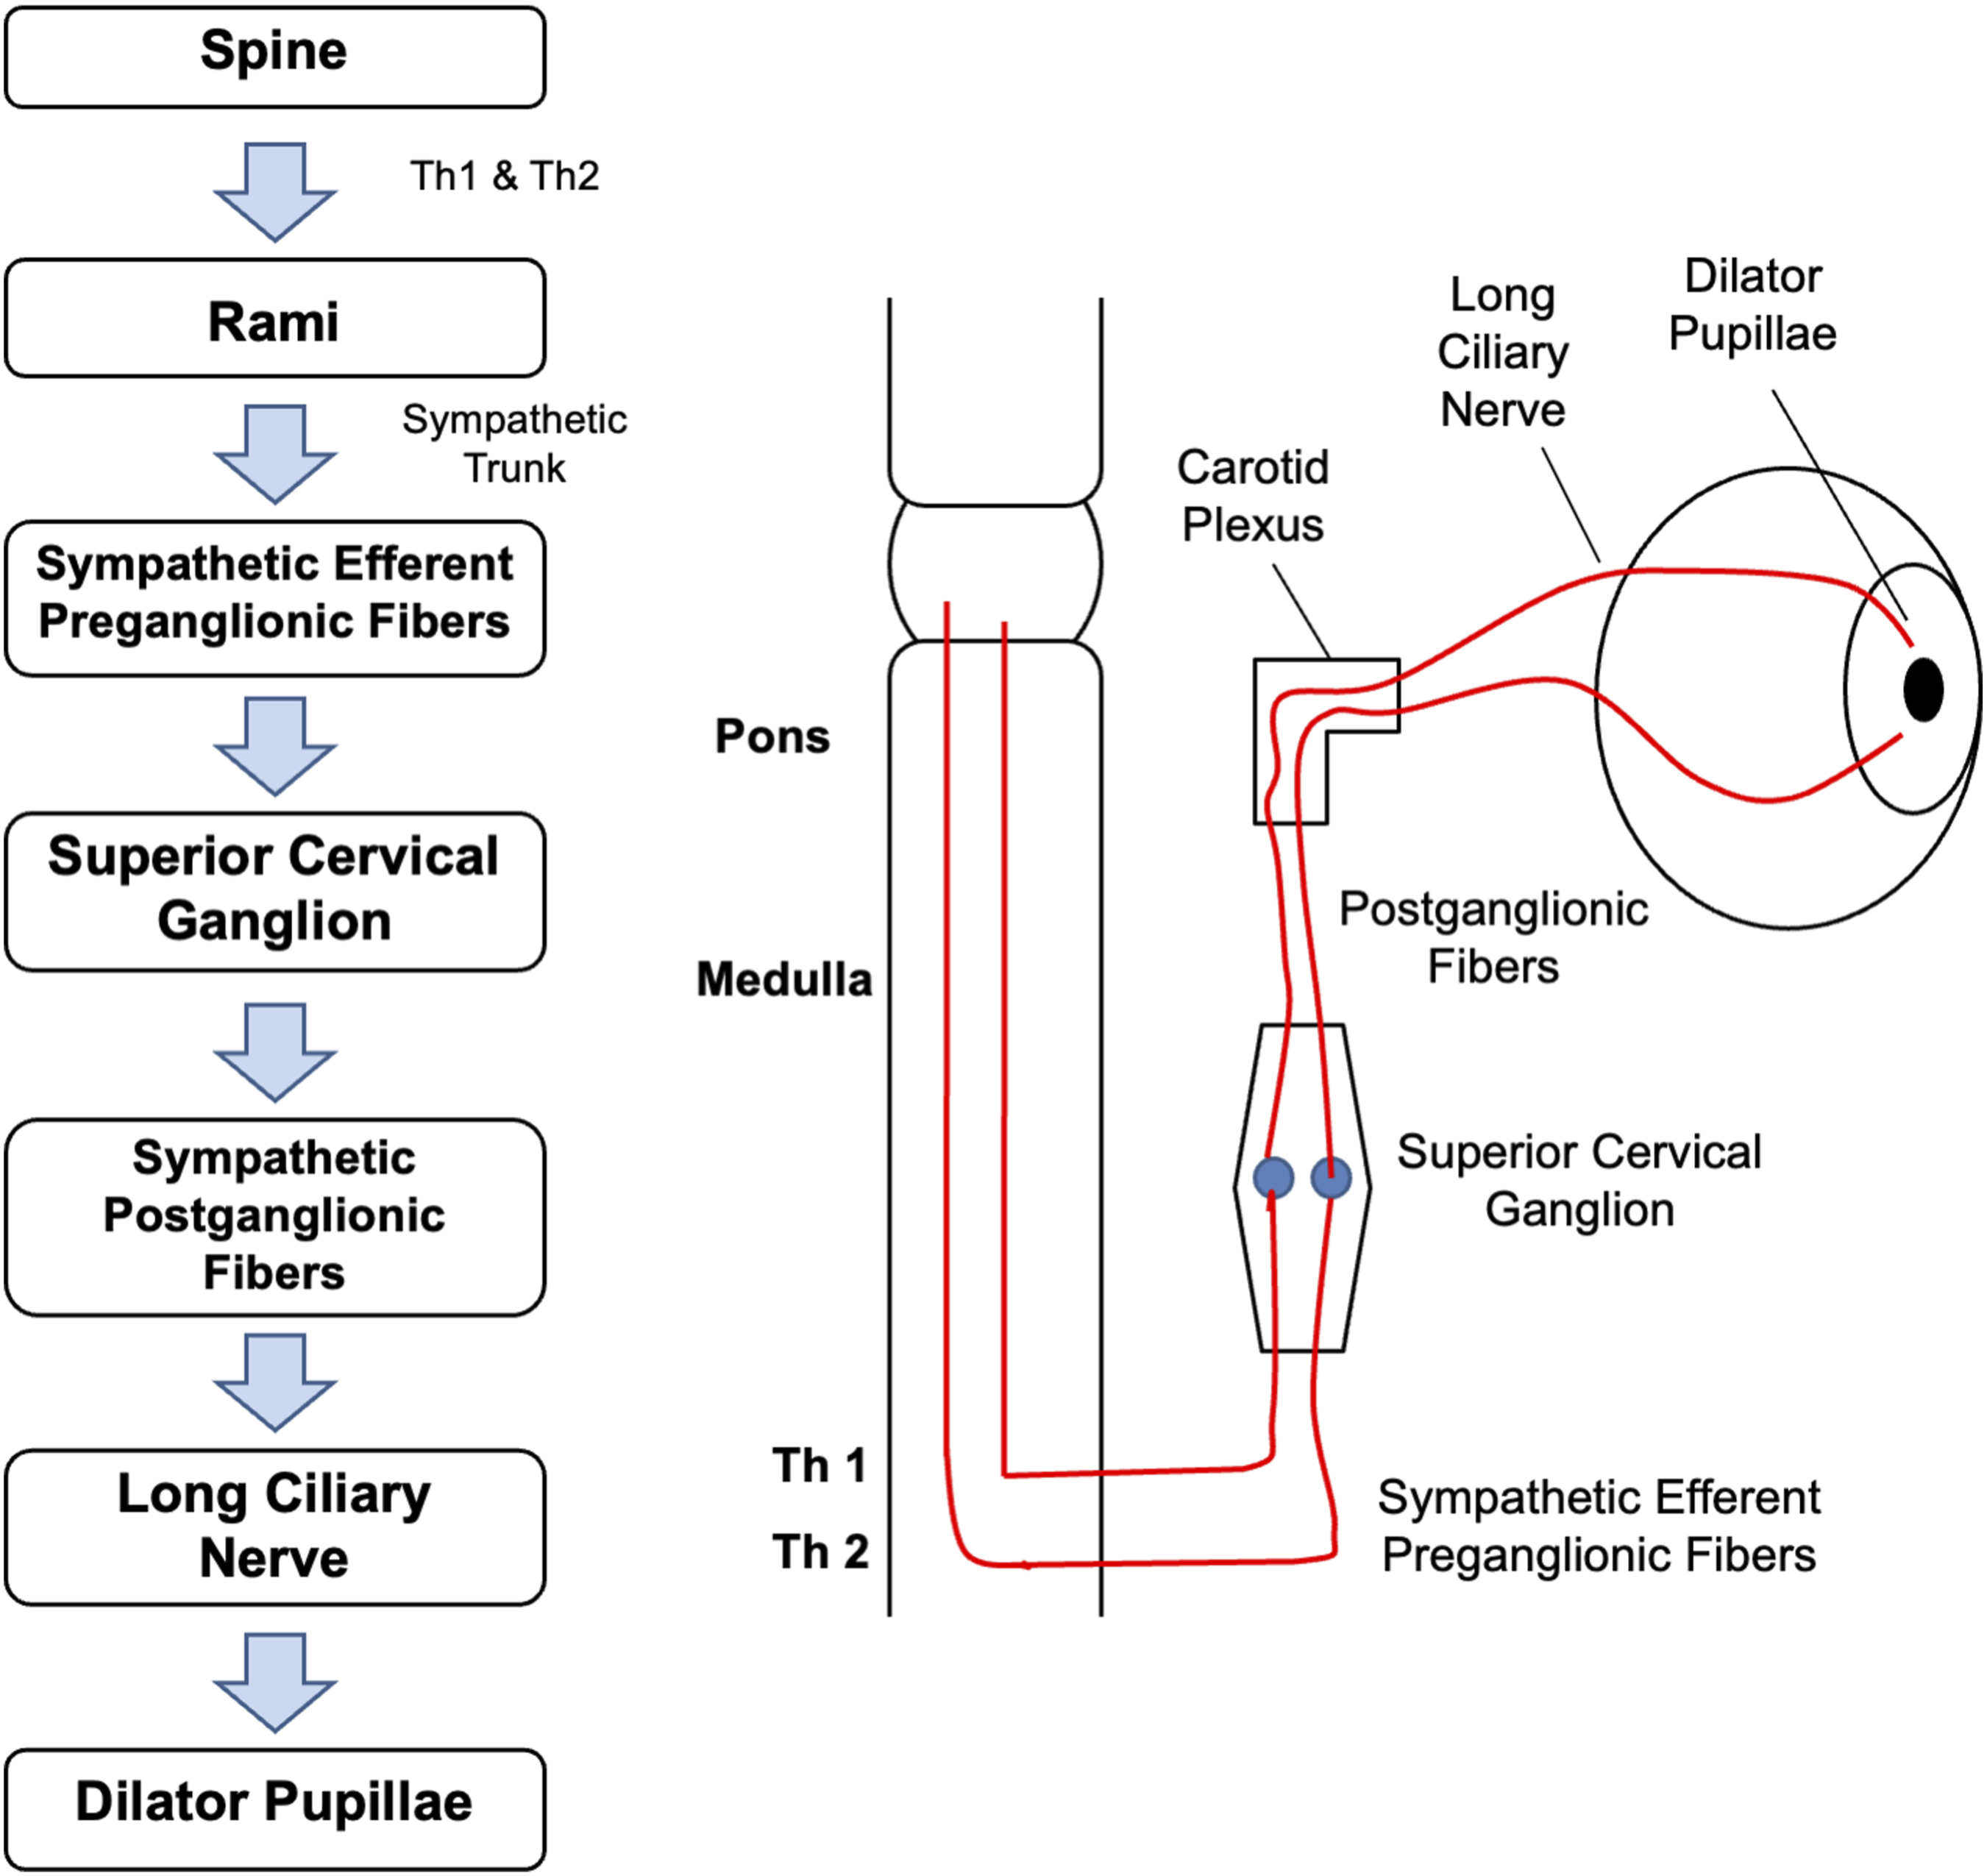
This section introduces the physiology of pupillary dynamics and outlines the physiological mechanisms on which our computational model is based. Light enters the eye through the pupil, regulated by two antagonistic iris muscles: sphincter pupillae and dilator pupillae. As illustrated in Figure 1, the sphincter pupillae receives parasympathetic input via the oculomotor nerve (CN III). Preganglionic fibers from the Edinger–Westphal (EW) nucleus synapse in the ciliary ganglion (CG), where postganglionic fibers trigger contraction of the sphincter pupillae. Conversely, the dilator pupillae is controlled by a three-neuron sympathetic pathway originating in the posterior hypothalamus, as shown in Figure 2. These fibers descend to the ciliospinal center, synapse in the superior cervical ganglion, and innervate the dilator pupillae via long ciliary nerves. Parasympathetic innervation pathway from EW nucleus, through CN III, ciliary ganglion and short ciliary nerve, to the sphincter pupillae Sympathetic innervation pathway from the spine to the dilator pupillae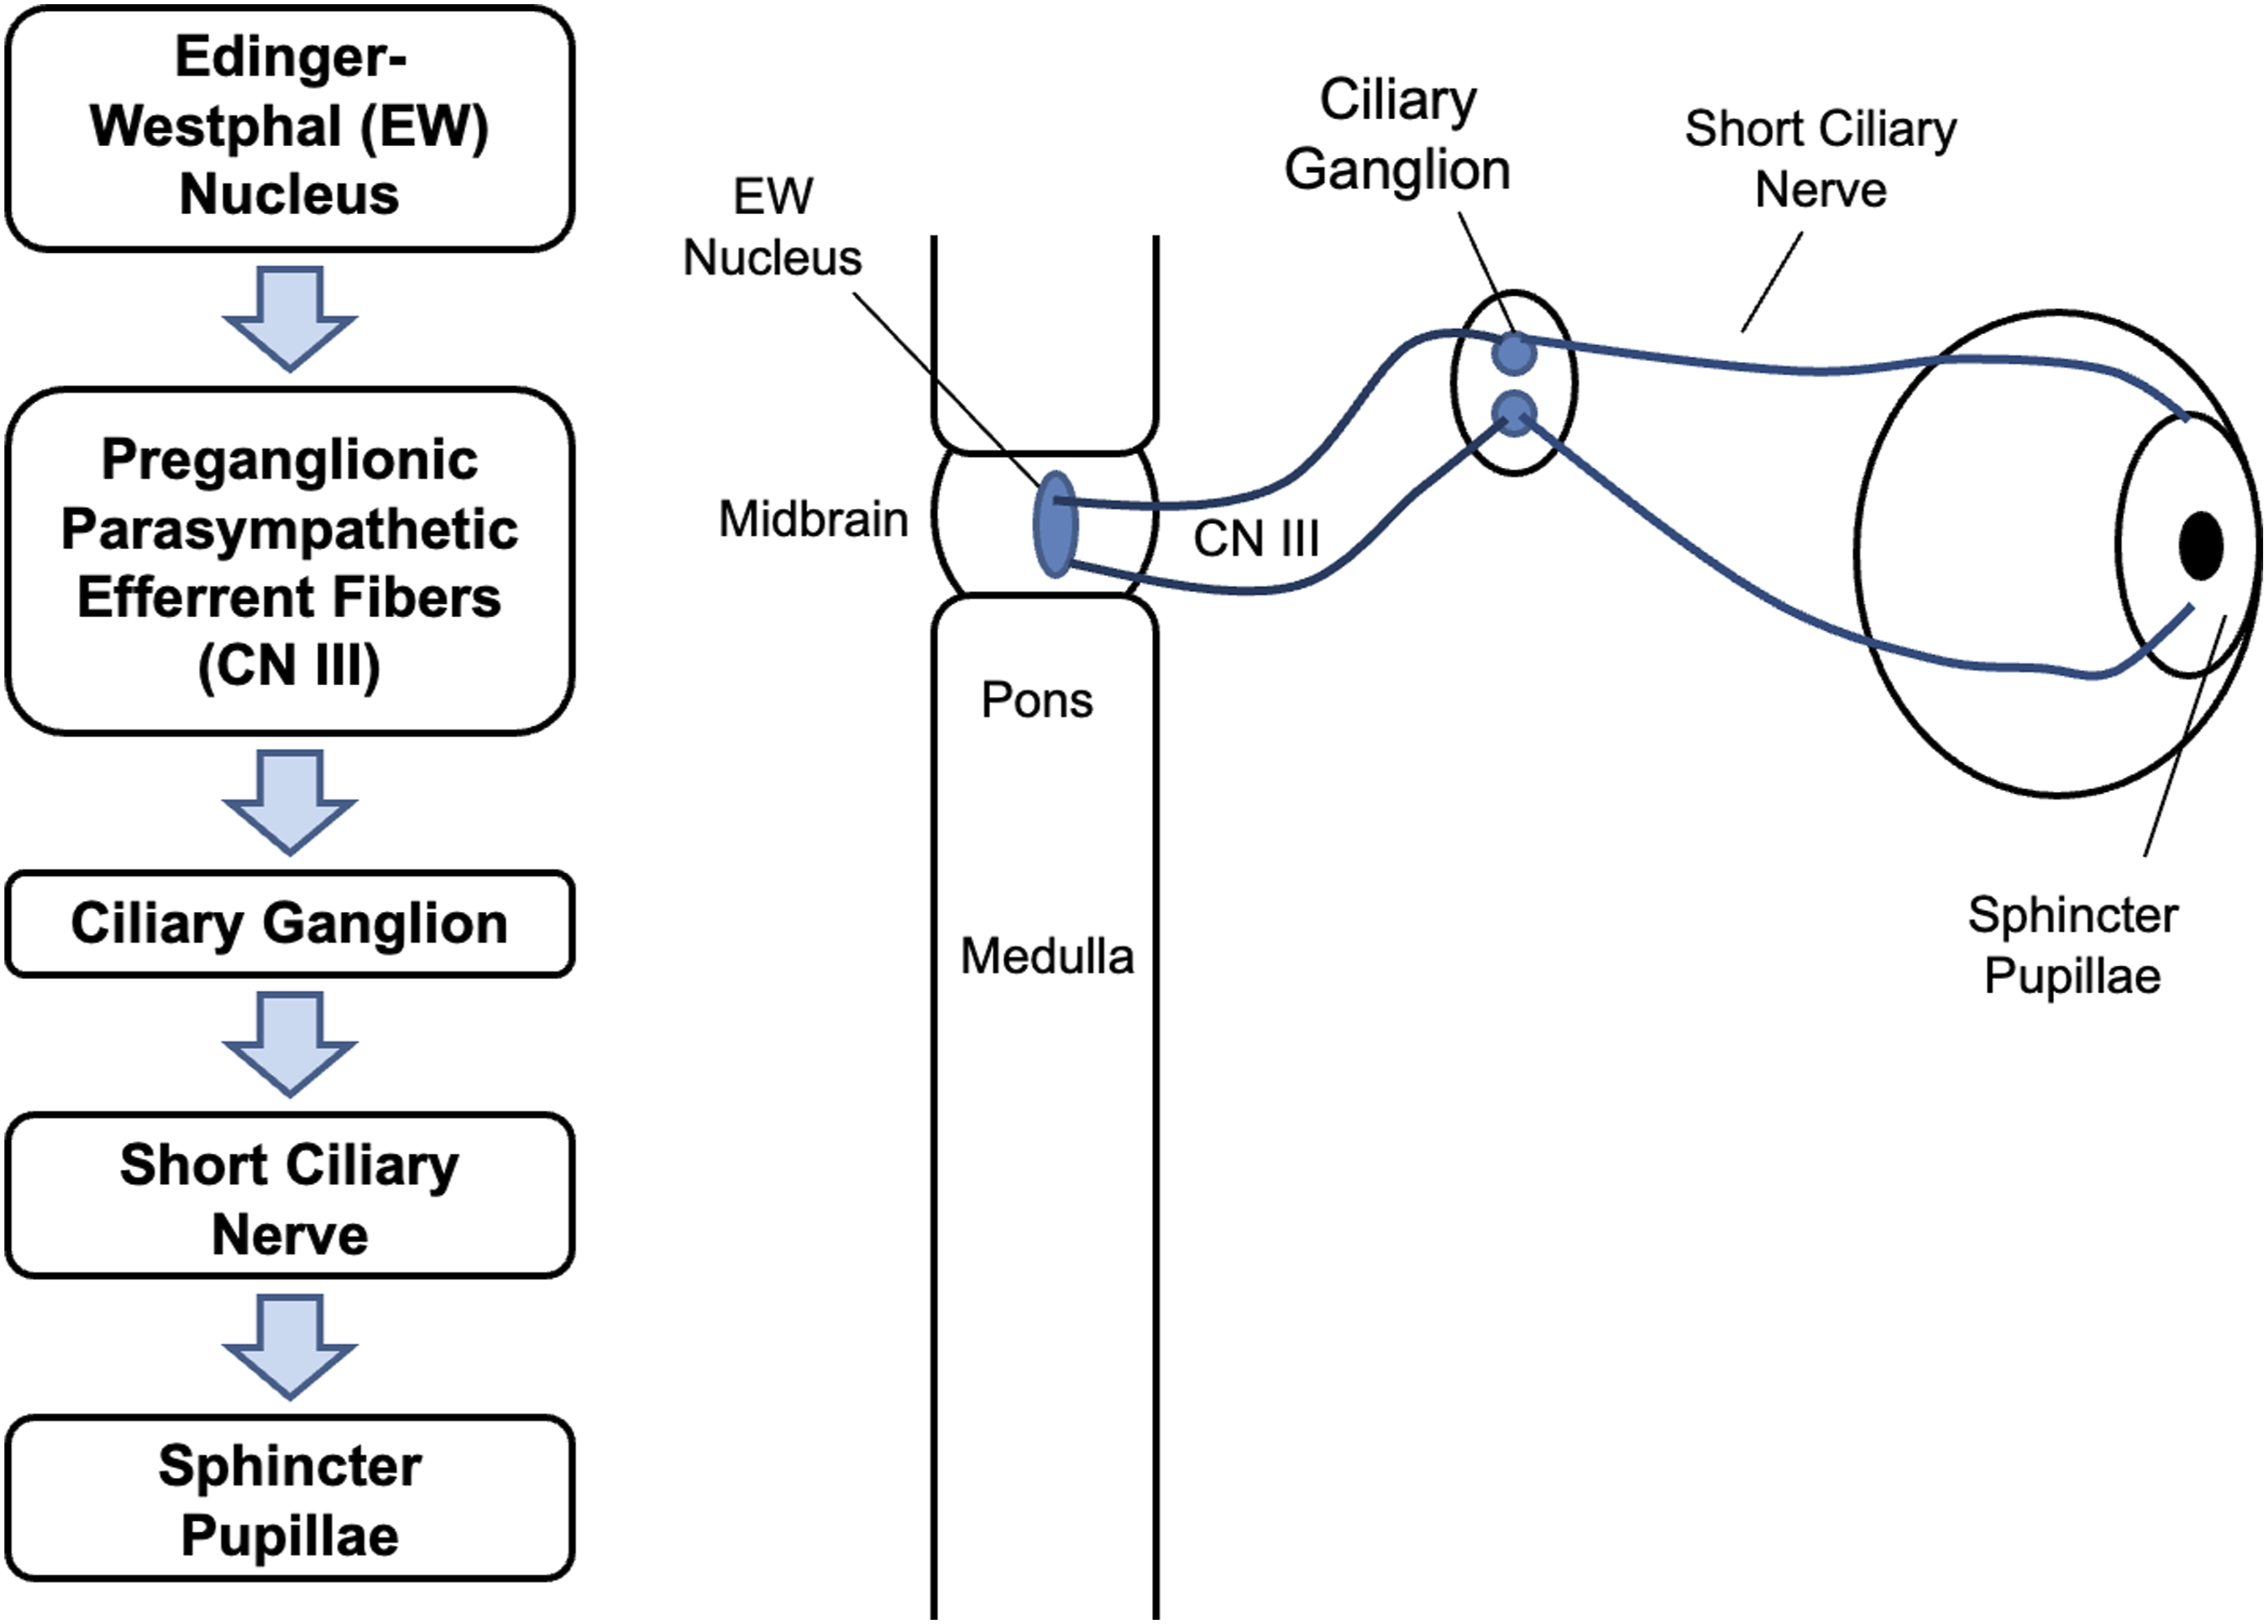
Previous studies have established that PSV reflects both respiratory and baroreceptor influences on the pupil size. In anesthetized cats, Borgdorff showed that inspiration produced pupil dilation and expiration produced constriction, with PSV persisting during apnea in synchrony with phrenic discharge after a 200ms to 1000ms delay and independent of sympathetic pathways. 20 Human studies by Ohtsuka later confirmed inspiratory dilation, expiratory constriction, and a proportional relationship between PSV amplitude and tidal volume. 9 Censi et al further demonstrated that carotid baroreceptor stimulation mimicking elevated blood pressure (BP) induces pupil constriction. 21
The origin of PSV involves indirect neural pathways projecting from the baroreceptors and brainstem’s respiratory center to the EW nucleus in the midbrain. Chen et al showed that midbrain neurons fire rhythmically with respiration, with a delay of more than one second from phrenic onset. 22 More recently, Komisaruk and Bianca identified a vagal afferent pathway in rats in which stimulation produced pupil dilation through inhibition of EW output, and demonstrated projections from the nucleus tractus solitarius (NTS) to the parabrachial nucleus (PBN) and onward to the EW nucleus. 23 Together, these studies showed that the NTS is activated by increase in BP and during expiration, and inhibited by decrease in BP and during inspiration.
Consequently, when BP rises or during expiration, the NTS–PBN–EW–CG pathway becomes more active, leading to pupil constriction. When BP falls or during inspiration, this pathway is suppressed, resulting in pupil dilation. Figure 3 summarizes these neural pathways and explains how respiratory and BP fluctuations relate to PSV. Therefore, our computational model is developed under the following three assumptions: i.) PSV has two sources - centrally mediated respiratory activity and baroreceptor-driven activity. Both sources are transmitted from the NTS to the pupillary plant through the NTS–PBN–EW–CG pathway with a delay of more than 1 second; ii.) PSV primarily reflects modulation of the sphincter, with reciprocal innervation between the sphincter and dilator muscles; iii.) Because PSV is identical in both eyes, a single-eye pupillary plant model is sufficient. Neural projection pathways underlying PSV showing projections from the NTS to the pupillary plant via the PBN and EW nuclei. Increases in BP cause pupil constriction, whereas decreases cause pupil dilation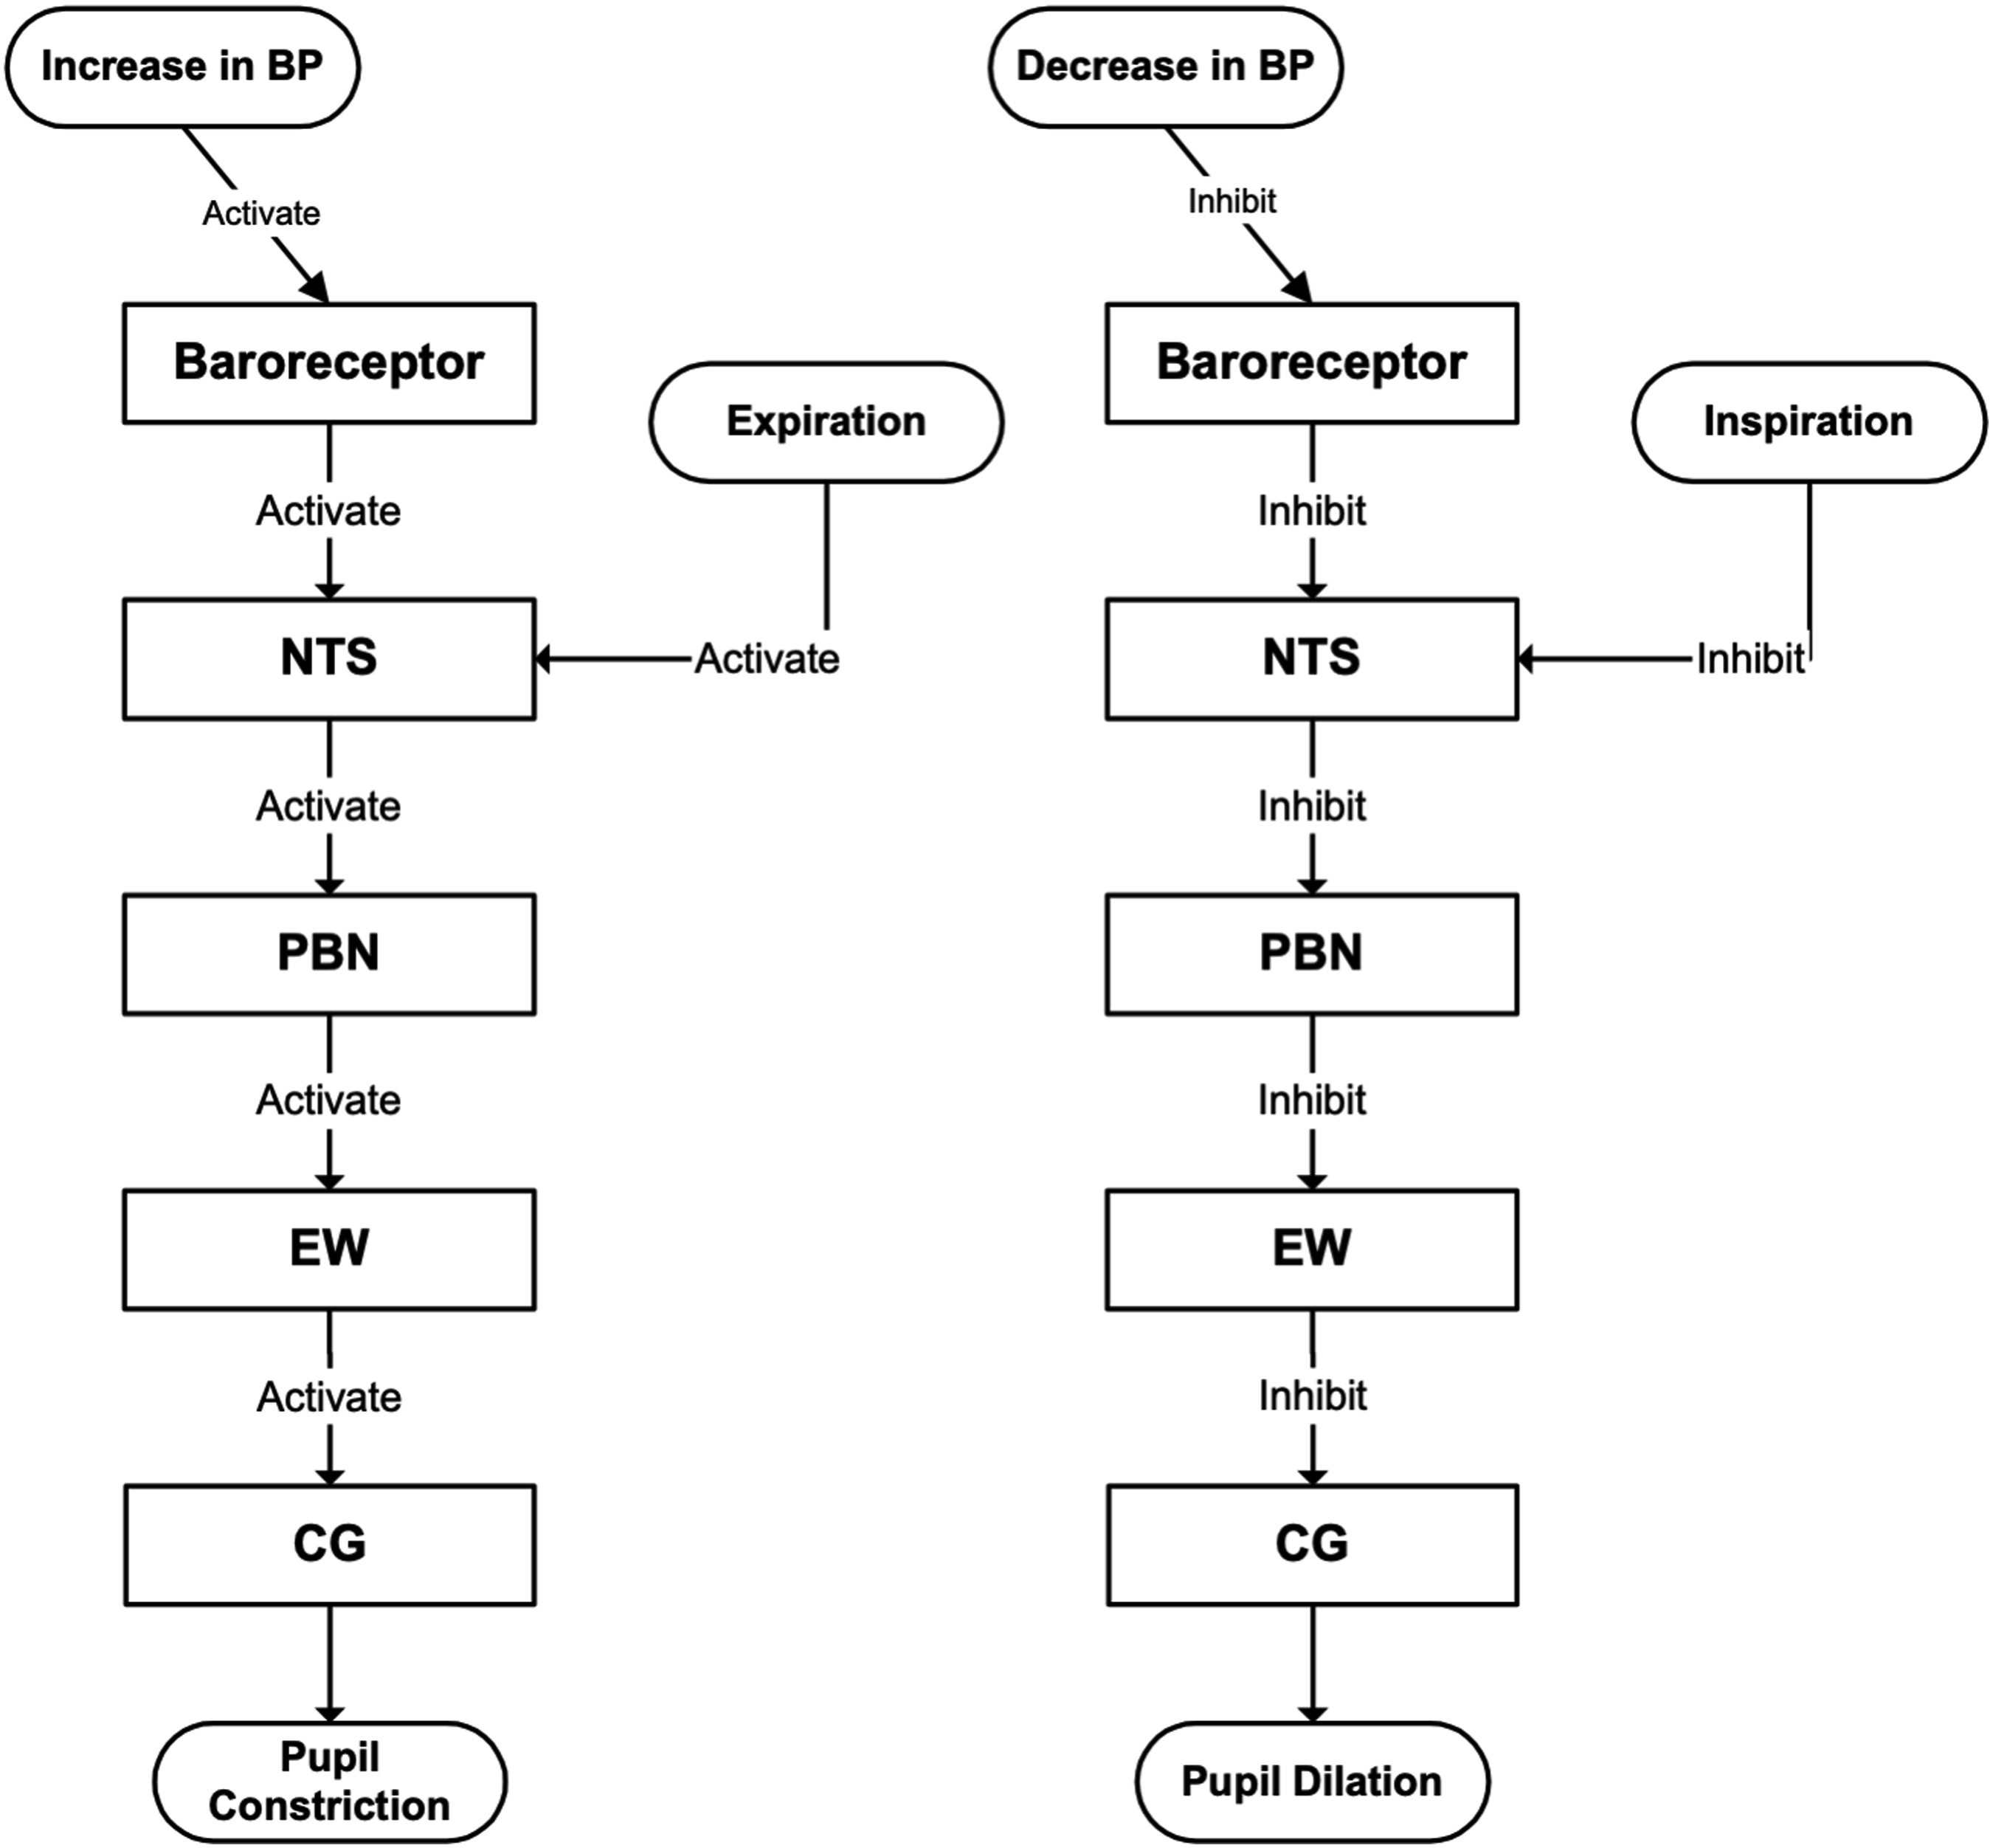
Model Development
To our best knowledge, this is the first computational model to describe PSV as a phenomenon mediated by cardiovascular regulatory signals. Implemented in MATLAB and developed based on established neural pathway physiology and experimental findings from previous studies, our model can simulate PSV, HRV, and baroreflex dynamics. For physiological relevance and expandability, the model consists of two parts: a cardiovascular regulation part and a biomechanical pupillary muscle plant.
Cardiovascular Regulation System
The cardiovascular regulation part of the model is adapted from the well-established Seidel–Herzel model, which is widely used in biomedical engineering and computational biology for studying cardiovascular dynamics and autonomic regulation.
24
The Seidel–Herzel model is chosen because it provides specific representations of baroreceptor and respiratory activities - the primary sources of PSV. As illustrated in Figure 4, blood pressure changes are detected by the baroreceptors; the resulting afferent signals are transmitted to the medulla, which then generates the sympathetic and parasympathetic outputs for regulating the heart and blood vessels. The model employs delay-differential equations to capture conduction delays in both neural and mechanical pathways. Additionally, medullary sympathetic and parasympathetic outputs are modulated by inputs from higher cerebral regions and respiratory center. Overview of the main components of the Seidel–Herzel model for simulating heart rate and blood pressure regulation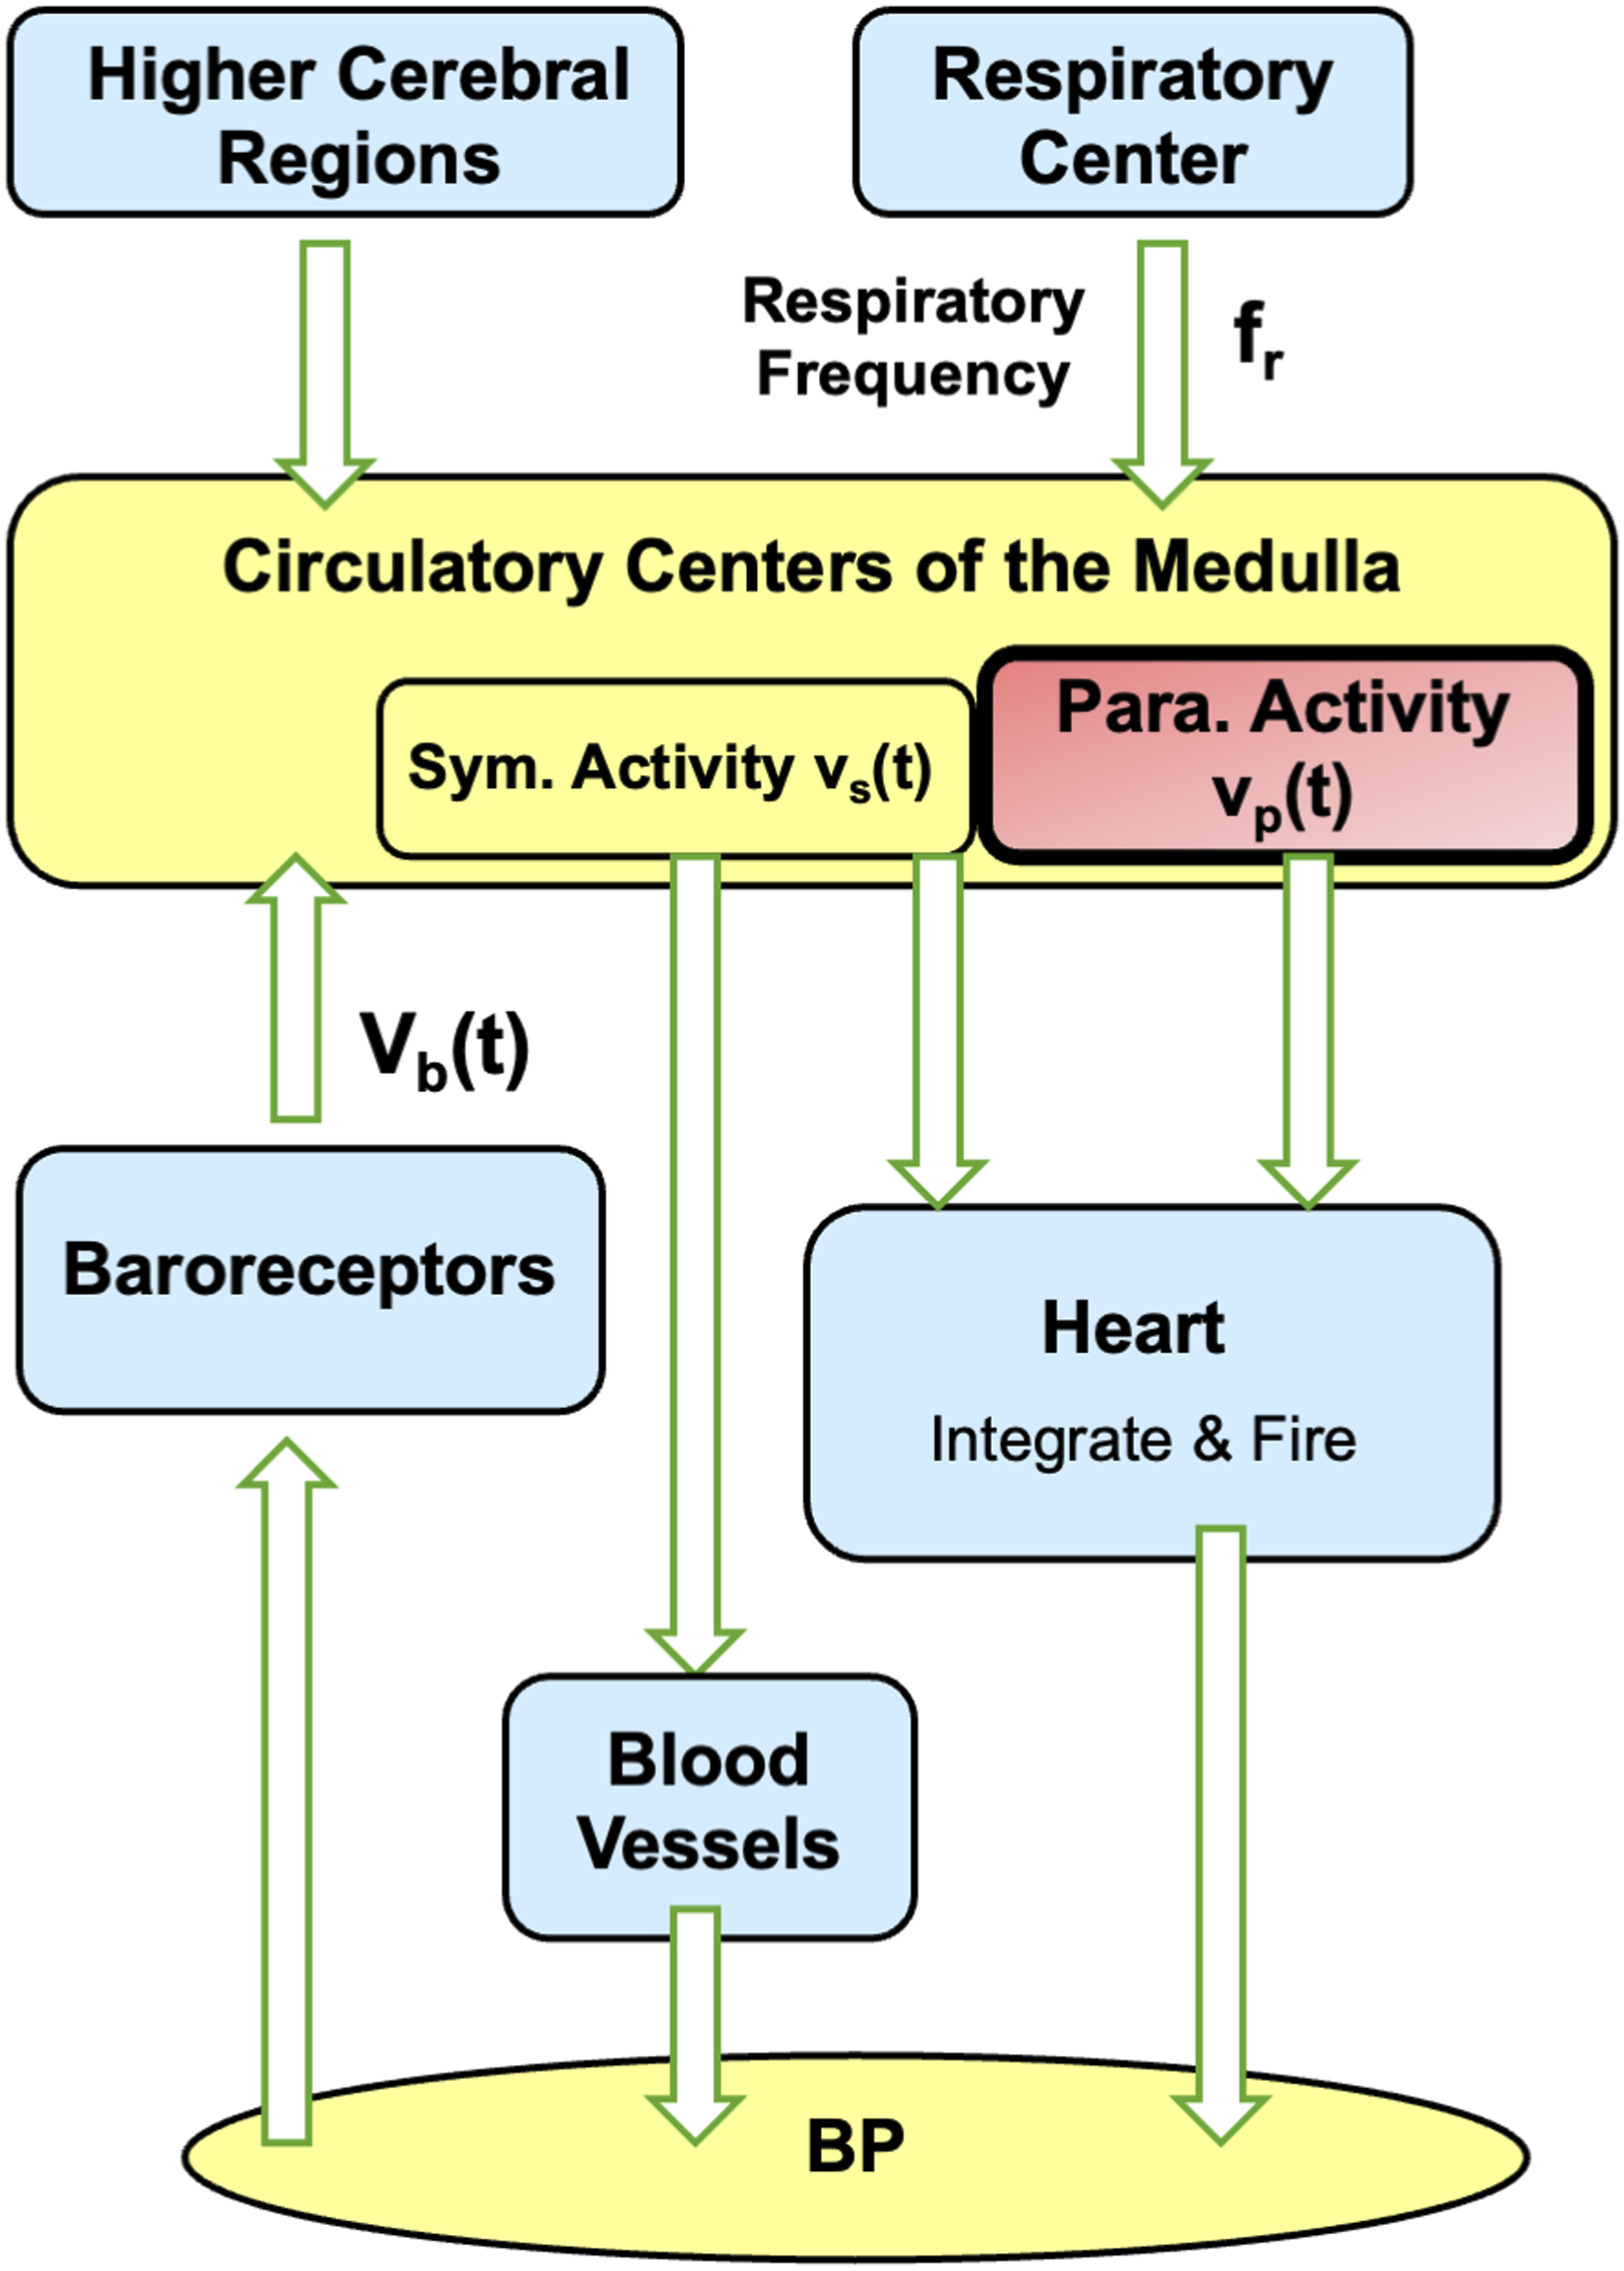
The interactions within the model are summarized as follows. Further details can be found in the works by Seidel and Herzel.
24
In response to fluctuations in BP, the baroreceptors activities signal is vb(t):


NTS-Pupillary Plant Pathway
Figure 5 shows the overall computational model for simulating pupillary dynamics. The model takes respiration frequency, autonomic tone and stimulus, and light condition and stimulus as inputs; and outputs HR, BP, and pupillary dynamics signals accordingly. The key connection between the cardiovascular regulation system and pupillary muscle plant is medullary parasympathetic activity, denoted as vp(t). It represents neural projection via the NTS–PBN–EW–CG pathway. vp(t) consists of a static part vp_stat and dynamic part vp_dyn(t) as shown in Equations (10) and (11), respectively. Functional blocks, inputs, and outputs of the overall computational model, which simulates pupillary dynamics in response to light stimuli and cardiovascular variabilities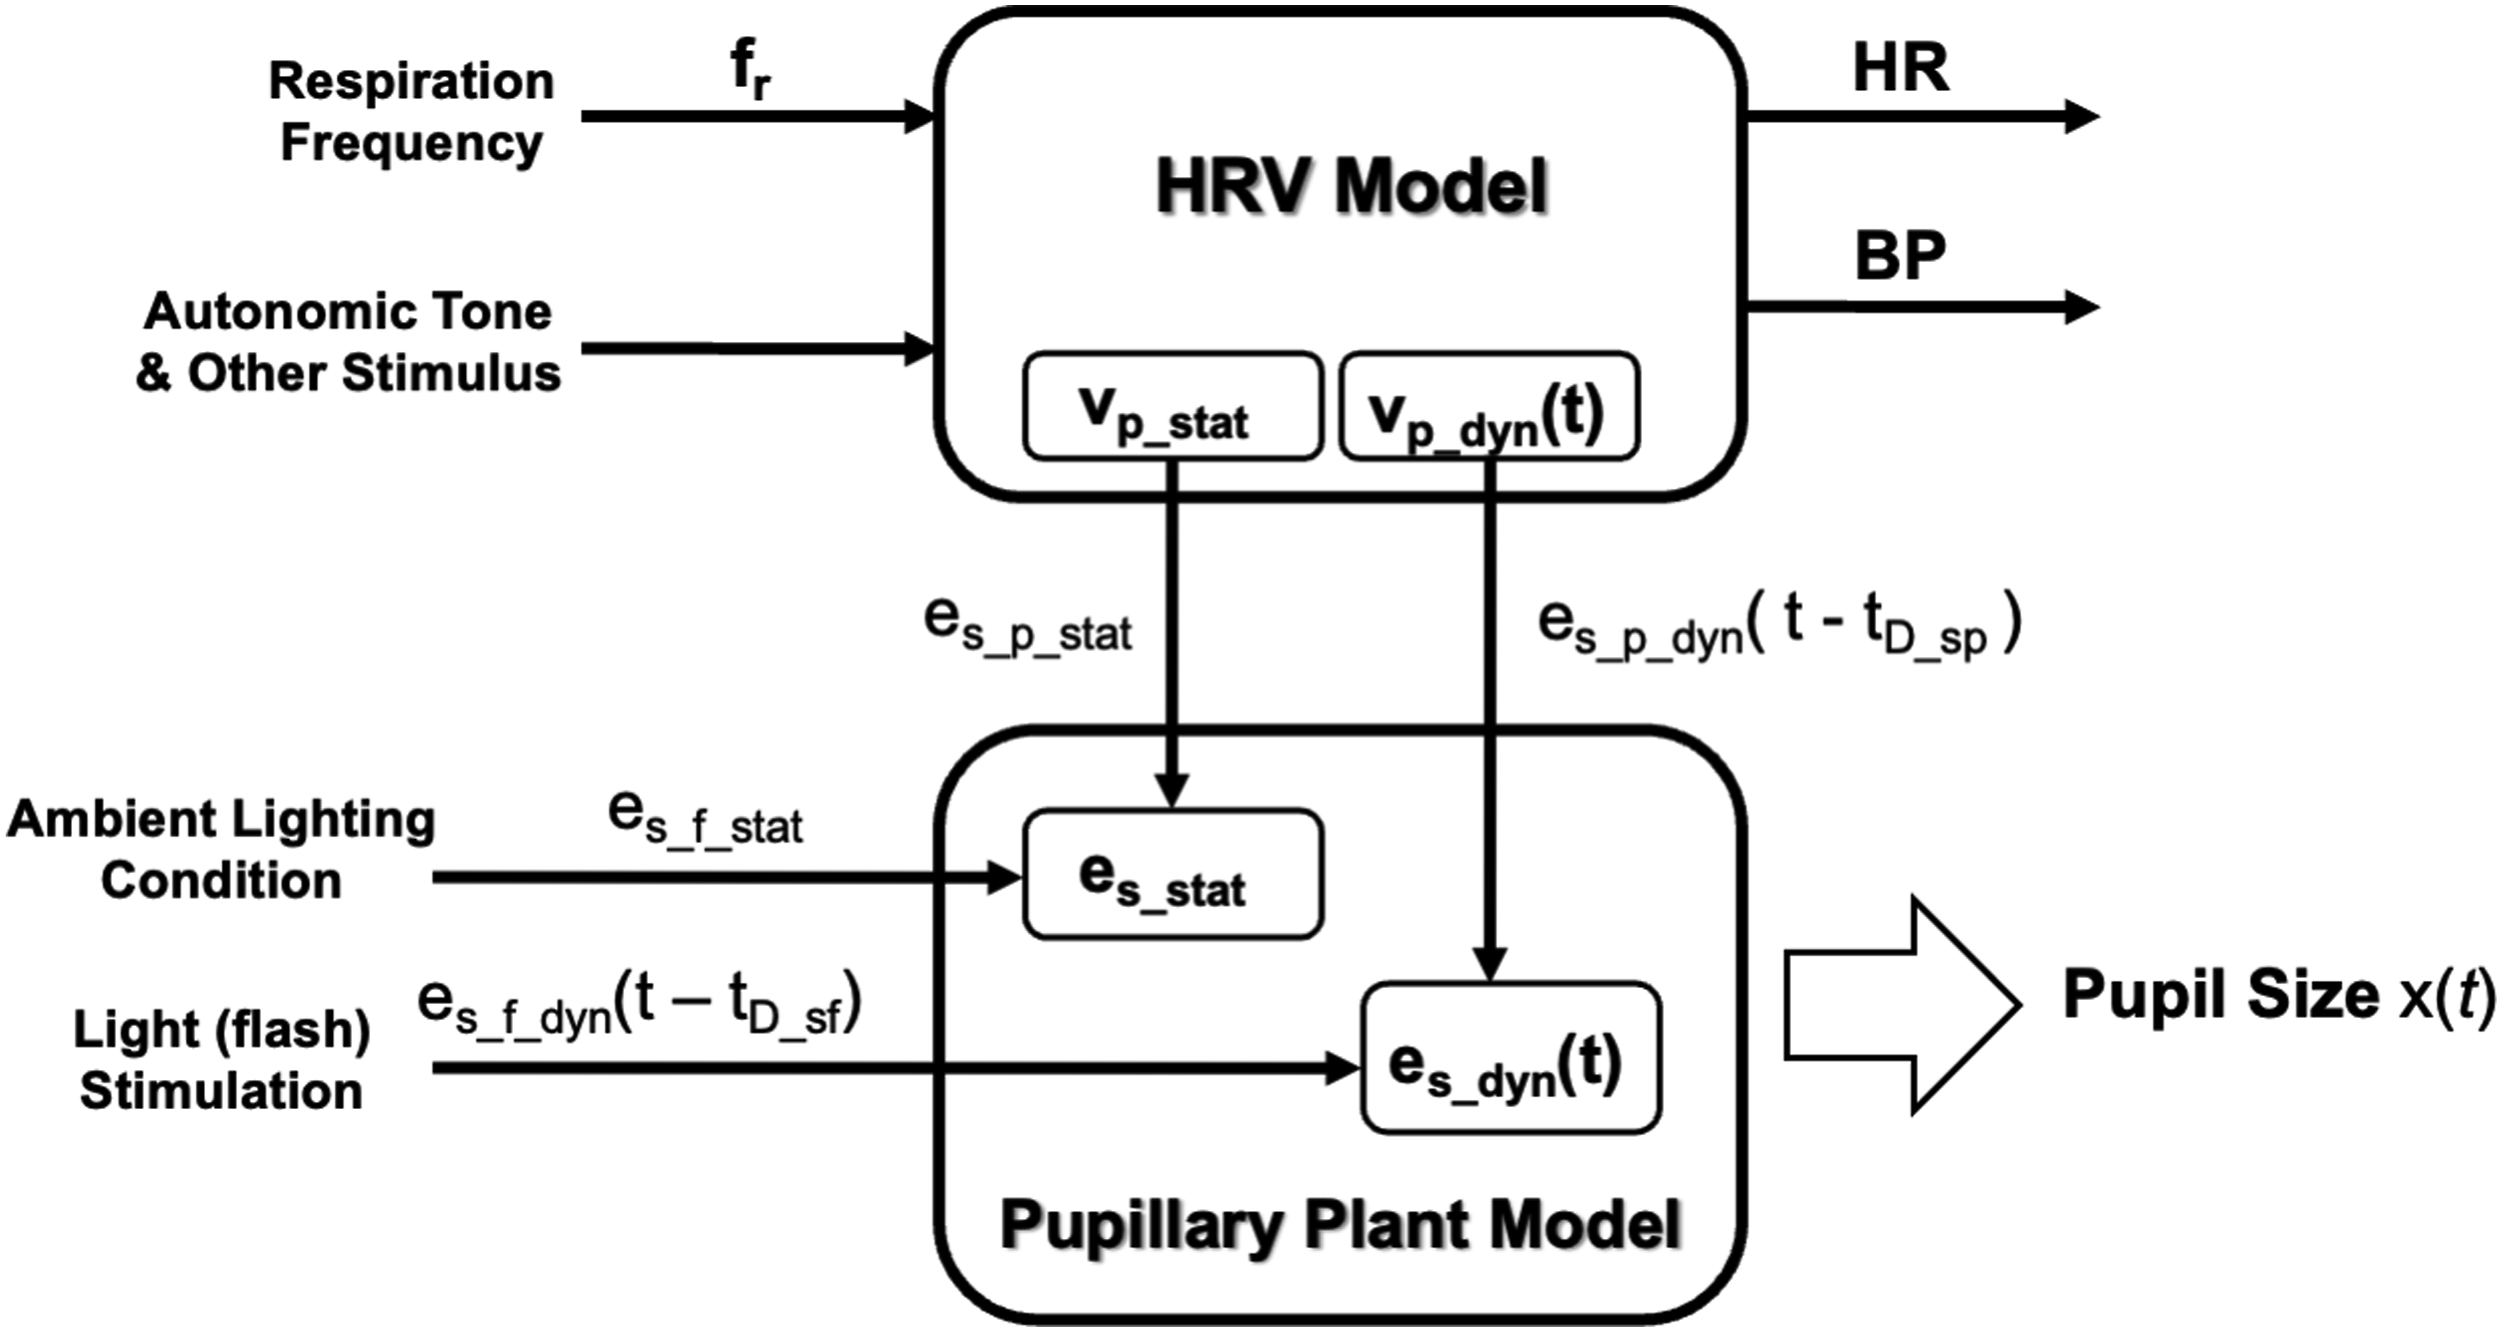


While our current focus is on the parasympathetic-dominant fluctuations, the sympathetic pathway is explicitly modeled and contributes to the overall dynamics through reciprocal innervation. As illustrated in Figure 5, the pupil’s sphincter innervation inputs are associated with the parasympathetic activities vp_stat and vp_dyn(t) through the relationships:


Pupillary Muscle Plant
The biomechanical pupillary muscle plant within our model is adopted from the framework proposed by Usui et al. The model parameters were determined from experiments in which smooth muscle tensions were measured under various muscle lengths and stimulation intensities.25-27 As detailed in Figure 6, the overall innervation inputs, es(t) and ed(t), drive the corresponding input-dependent signals, gs(t) and gd(t), which then modulate the pupil size according to tension relationships. Static parts of the input-dependent signals are derived by multiplying the corresponding innervation inputs by constant coupling coefficients, γs_stat and γd_stat, as follows: Biomechanical model of the pupillary plant consisting of the dilator and sphincter muscle pair. Pupil size, x, is determined by the combined Ppd, Pad, Pps, Pas, and Pv, representing the passive and active tensions of the dilator and sphincter muscles and the viscous element. The innervation inputs, ed(t) and es(t), generate input-dependent signals gd(t) and gs(t), which produce muscle tensions according to Carlson’s length–tension relationship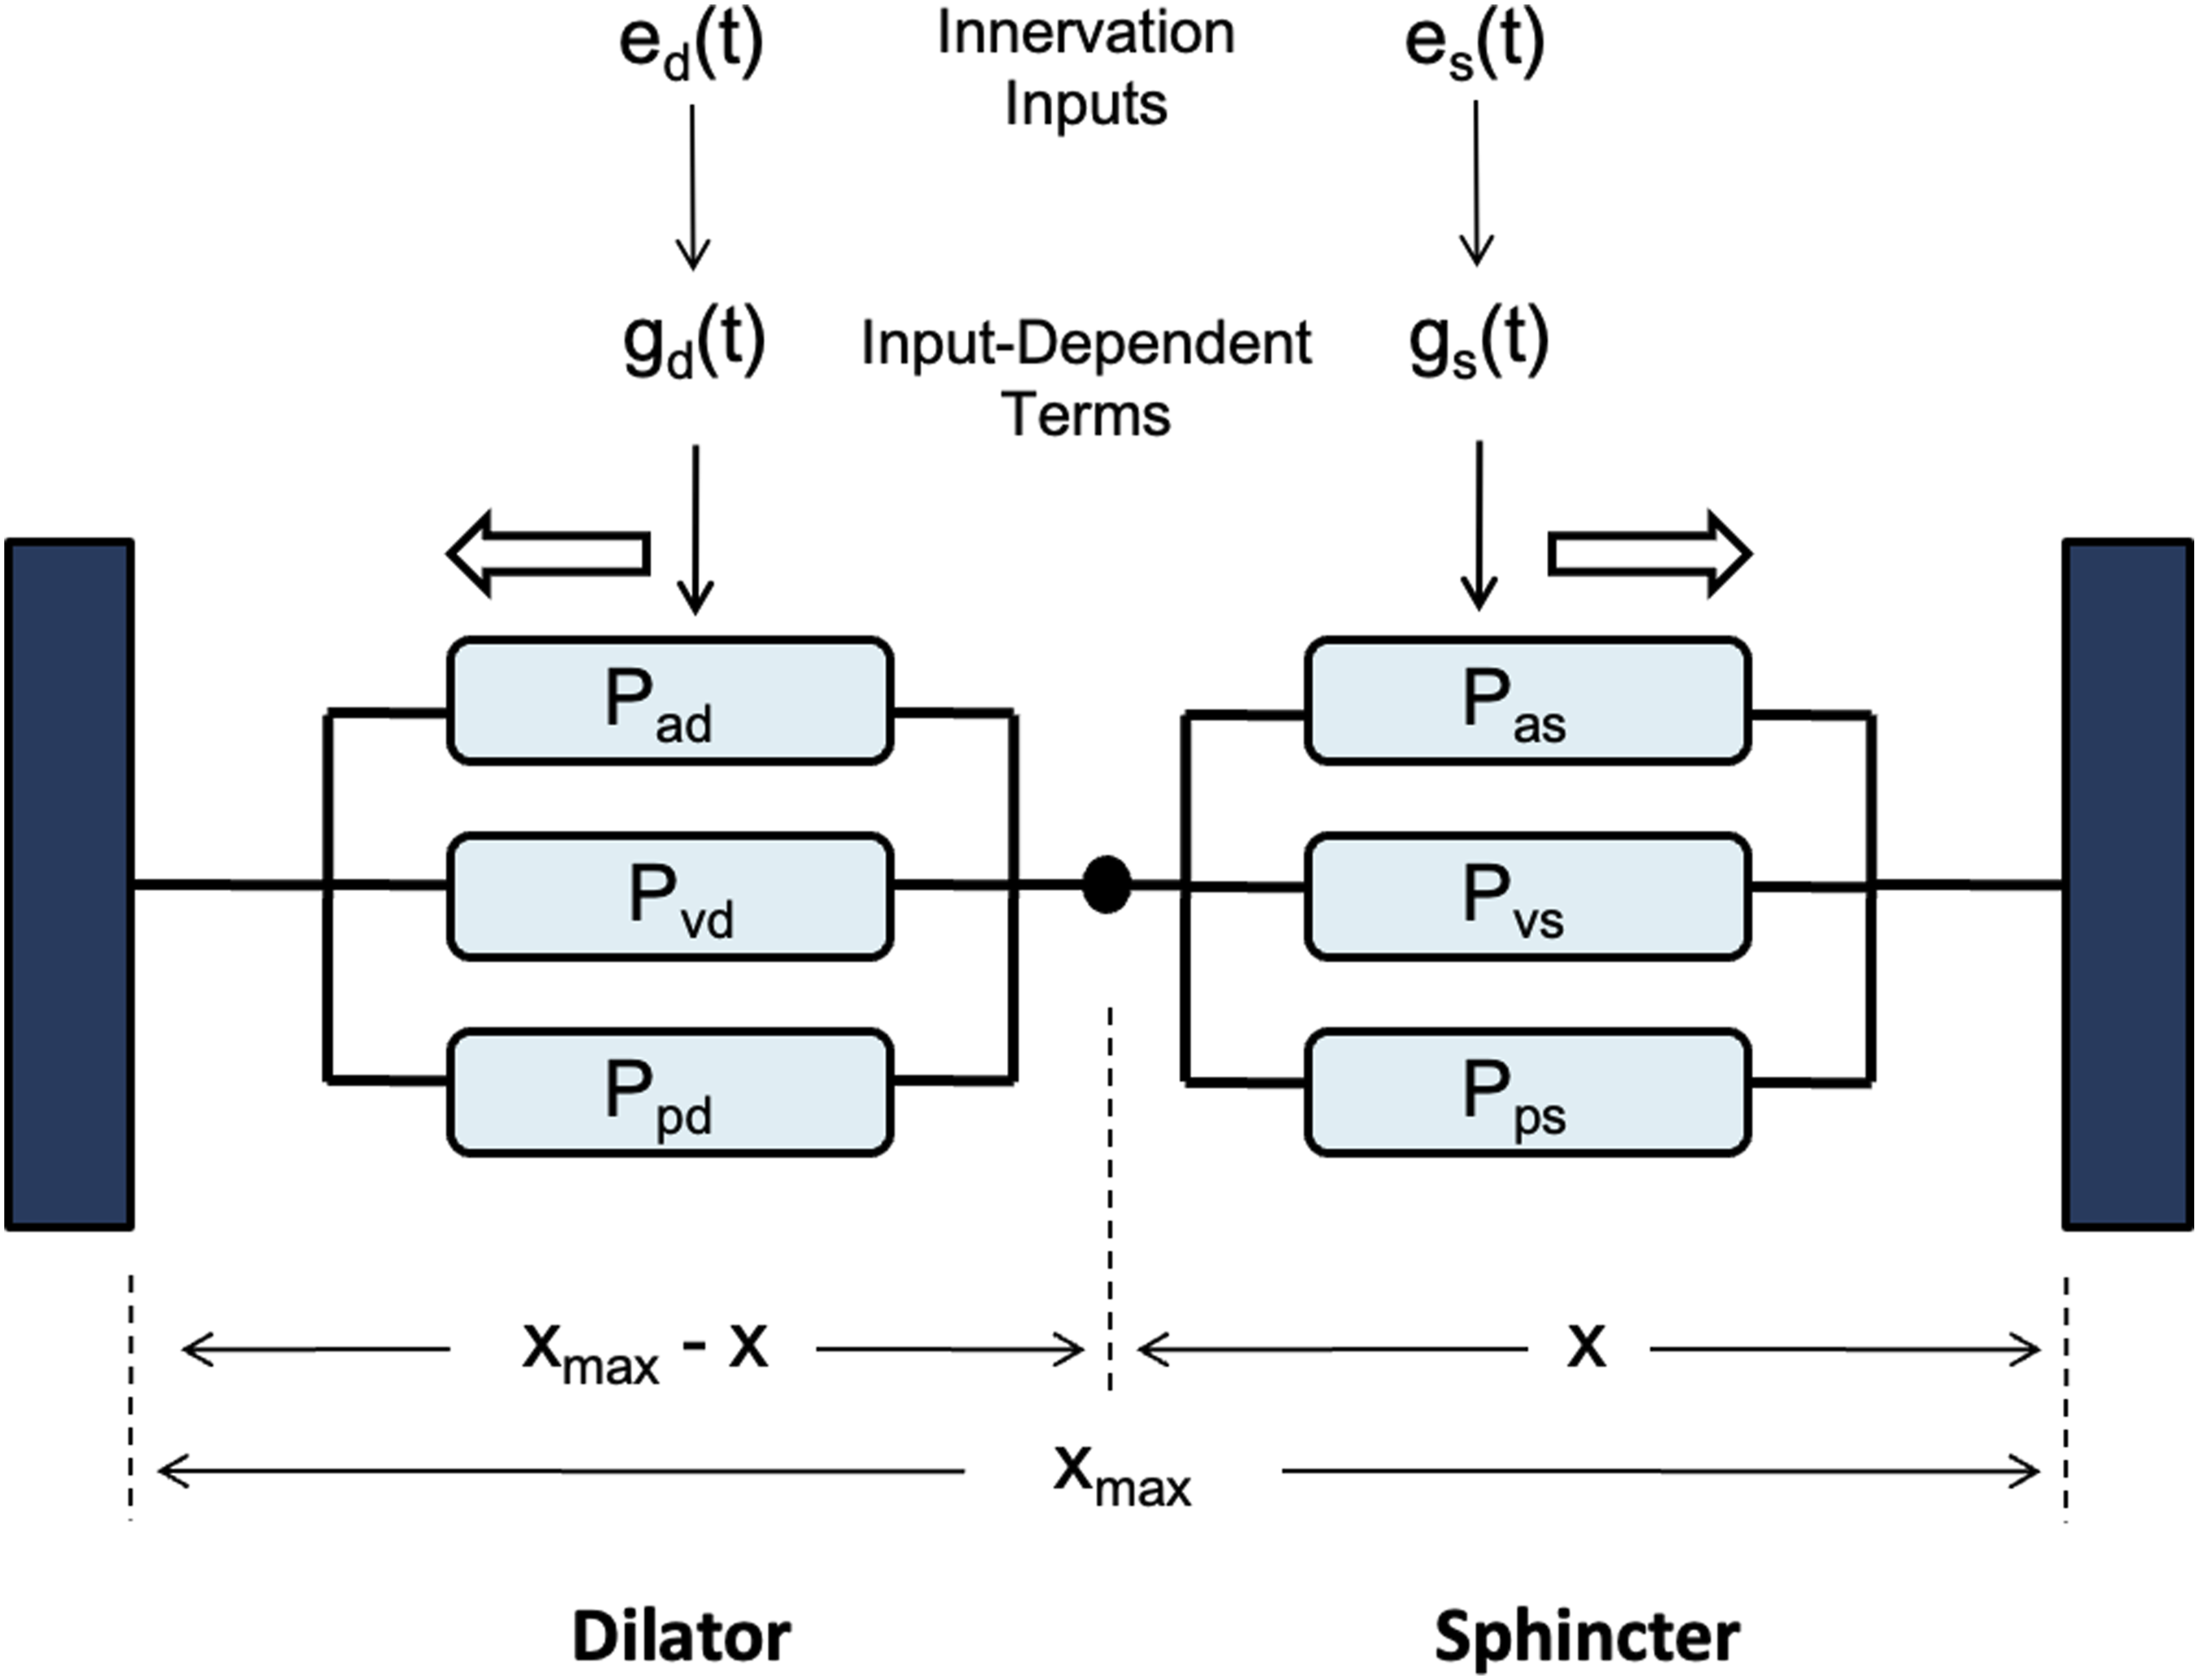


As shown in Figure 6, the acceleration of pupil size x(t) is represented as the sum of the active and passive tensions in the sphincter and dilator muscles. These tensions are calculated by substituting gs(t) and gd(t), into the Carlson’s length–tension relationship, which characterizes how smooth muscle tension varies with innervation level and muscle length.
27
The parameters in the relationship were empirically derived from results of experiments conducted by Dennison and Usui.14,27 The pupil size and its rate of change are dependent on the tensions according to Equation (22):

Simulation Experiments
The model framework described in the previous sections was implemented in MATLAB using forward Euler method with 2-ms time intervals. The model simulated cardiovascular dynamics and PSV under different scenarios.
Simulation of Cardiovascular Dynamics
To test the model’s ability to synthesize cardiovascular dynamics, initial simulations involved substituting constant and time-varying parameters into Equations (1) through (9) in iterations, each corresponding to increment of 2ms of time, from 0s to 240s. Values of constant parameters in the model were as follows. 24 BP parameters: p(0) = 50.0, τsys = 0.125, pinitial(t) = 70mmHg, dinitial= 60mmHg; baroreceptor activity parameters: k1 = 0.02 mmHg-1, k2 = 0.00125 mmHg-1; respiration parameters: krs = 0.1, krp = 0.1, Δϕsr = 0, Δϕpr = 0; medullary autonomic activities parameters: vs(0) = 0.8, vp(0) = 0, kbs = 0.7, kbp = 0.3; transmitter concentration parameters: ksCcNa = 1.2, τcNa = 2.0s; cardiac contractility parameters: S(0) = 25mmHg, kcs = 40mmHg, kts = 10mmHg s-1, = 70.0mmHg. Respiration rates of fr = 0.2Hz and fr = 0.3Hz were chosen.
The model was able to simulate cardiovascular variabilities, baroregulatory signals, and respiratory sinus arrythmia (RSA) successfully. The results were comparable with those reported in previous works.
24
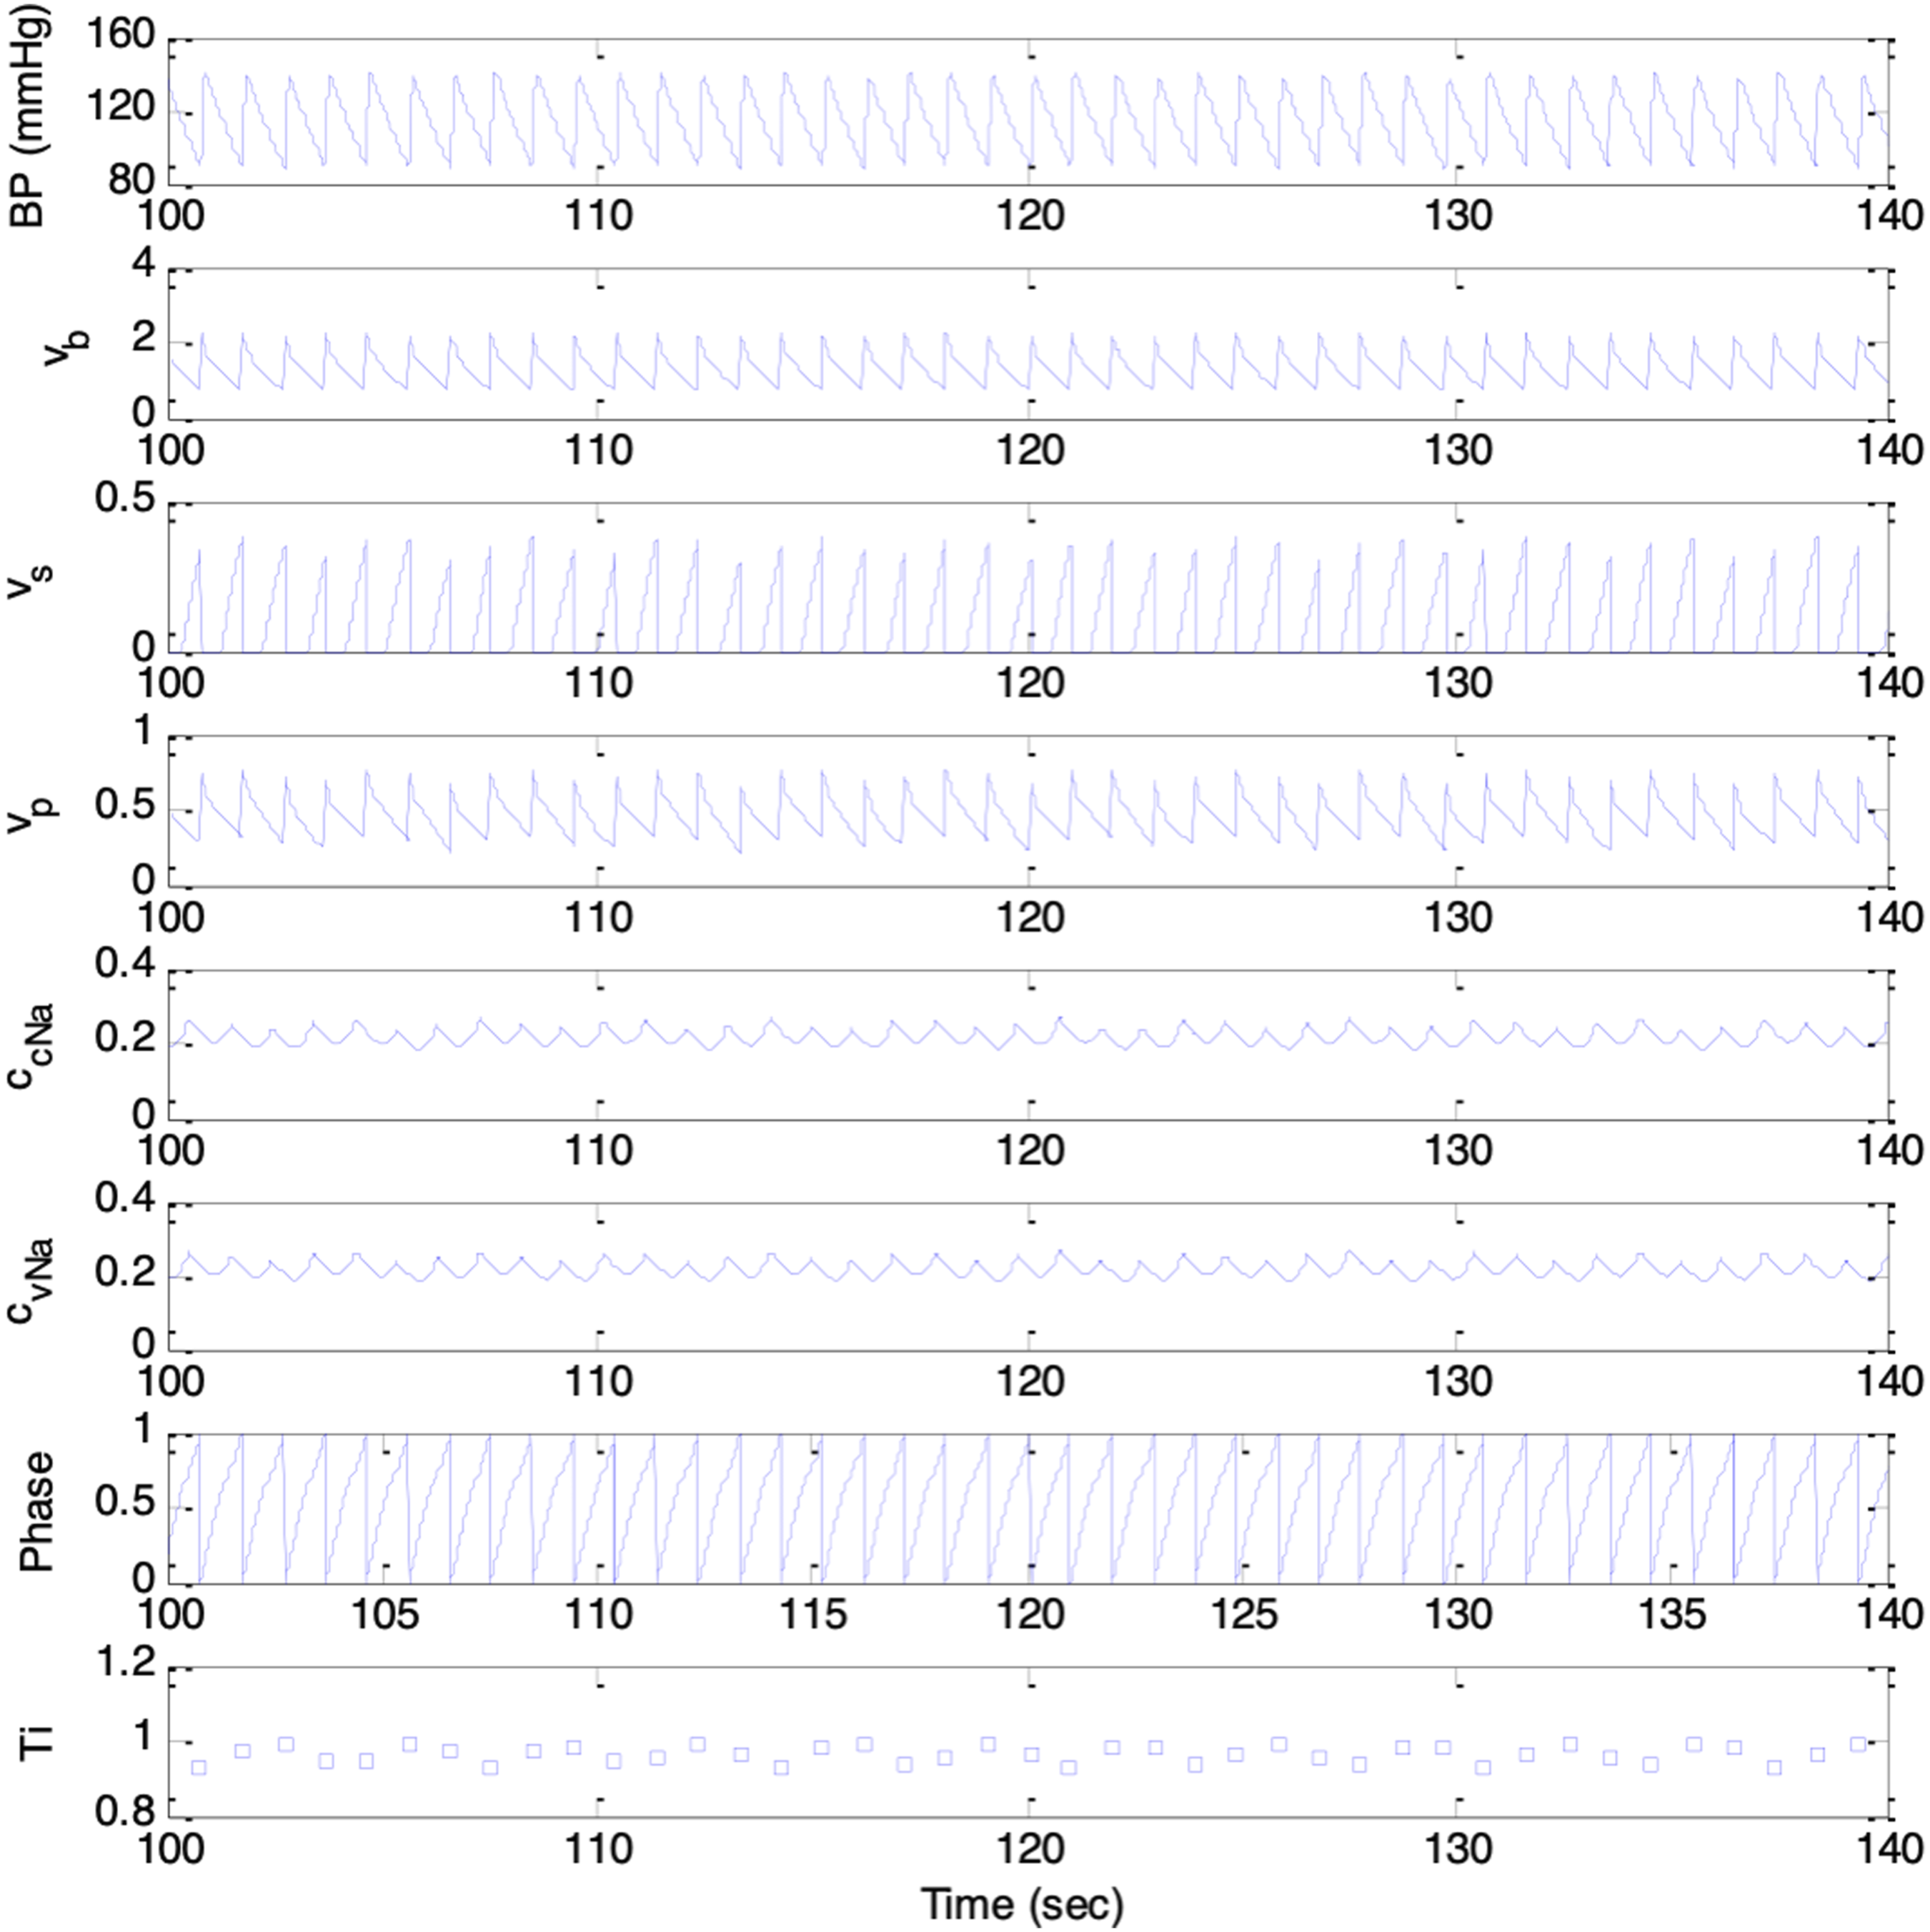
As shown in Figures 7 and 8, the synthesized signals included BP, baroreceptors activities, medullary sympathetic activity, medullary parasympathetic activities, cardiac noradrenaline concentration, cardiac vagal activity, respiratory oscillator, and heart period, denoted as p(t), vb(t), vs(t), vp(t), ccNa(t), cvNa(t), ψ(t), and T(i), respectively. The heart period oscillated at the respiratory frequency, corresponding to Mayer waves. Results from simulation session with respiration rate of 0.2Hz. Top to bottom trace: p(t), vb(t), vs(t), vp(t), ccNa(t), cvNa(t), ψ(t), and T(i) Results from simulation session with respiration rate of 0.3Hz. Top to bottom trace: p(t), vb(t), vs(t), vp(t), ccNa(t), cvNa(t), ψ(t), and T(i)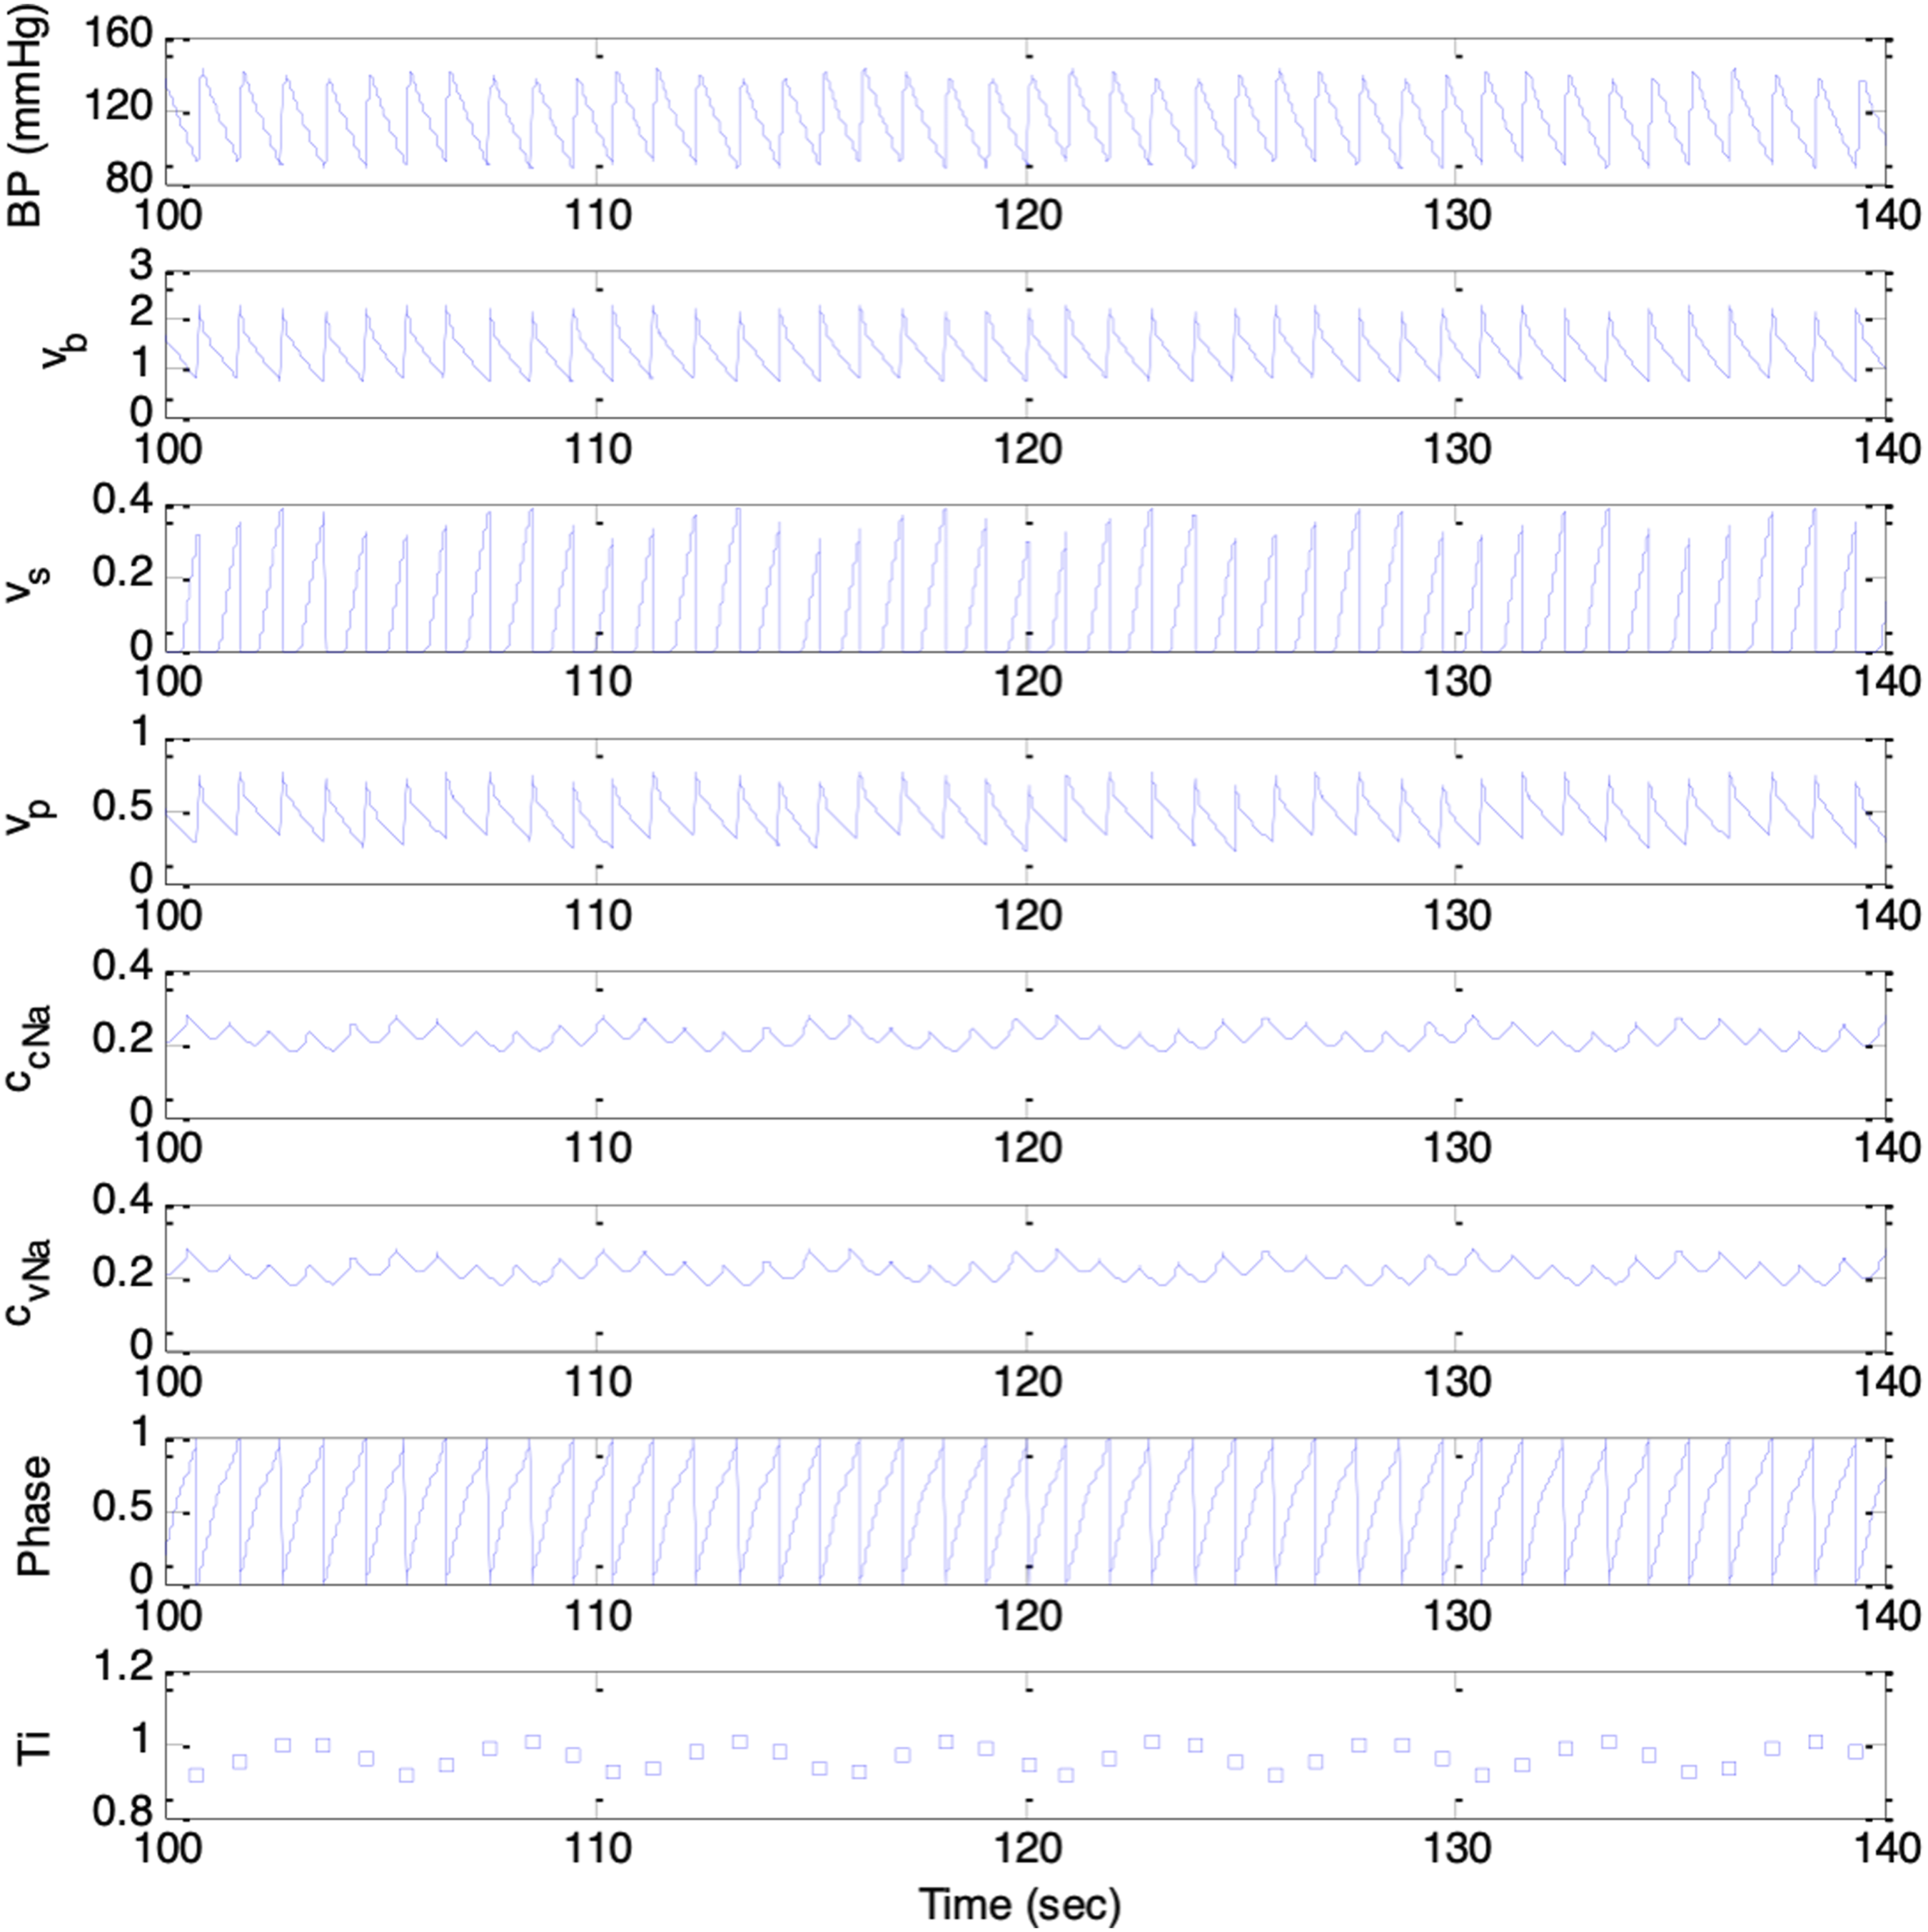
Simulation of Pupil Size Variability (PSV)
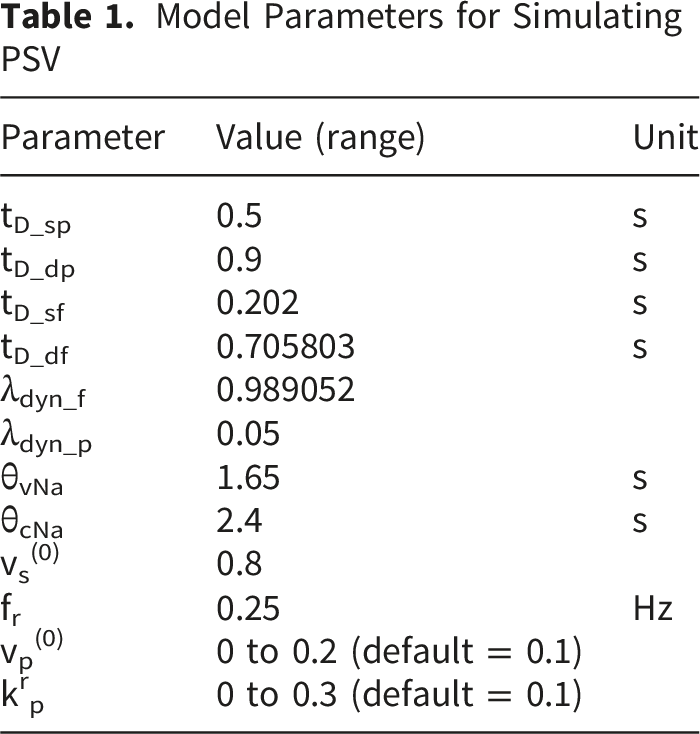
Model Parameters for Simulating PSV
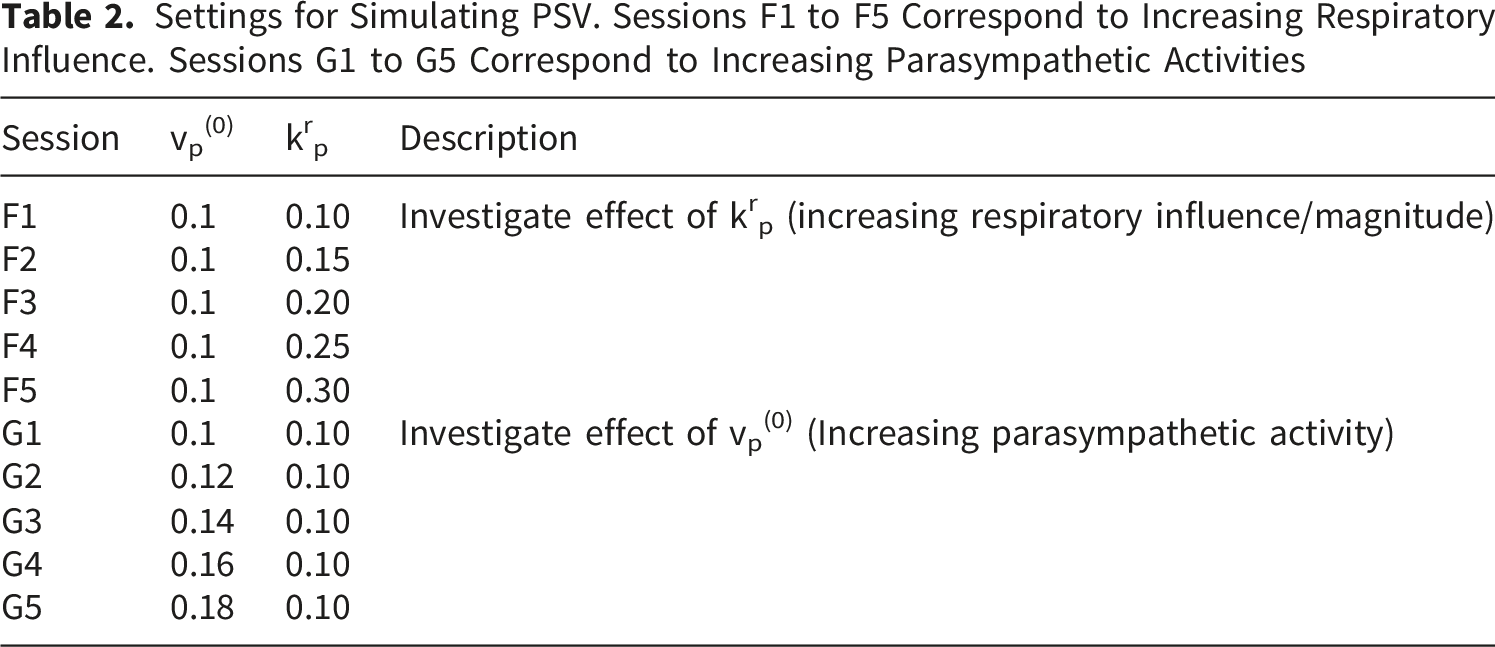
Settings for Simulating PSV. Sessions F1 to F5 Correspond to Increasing Respiratory Influence. Sessions G1 to G5 Correspond to Increasing Parasympathetic Activities
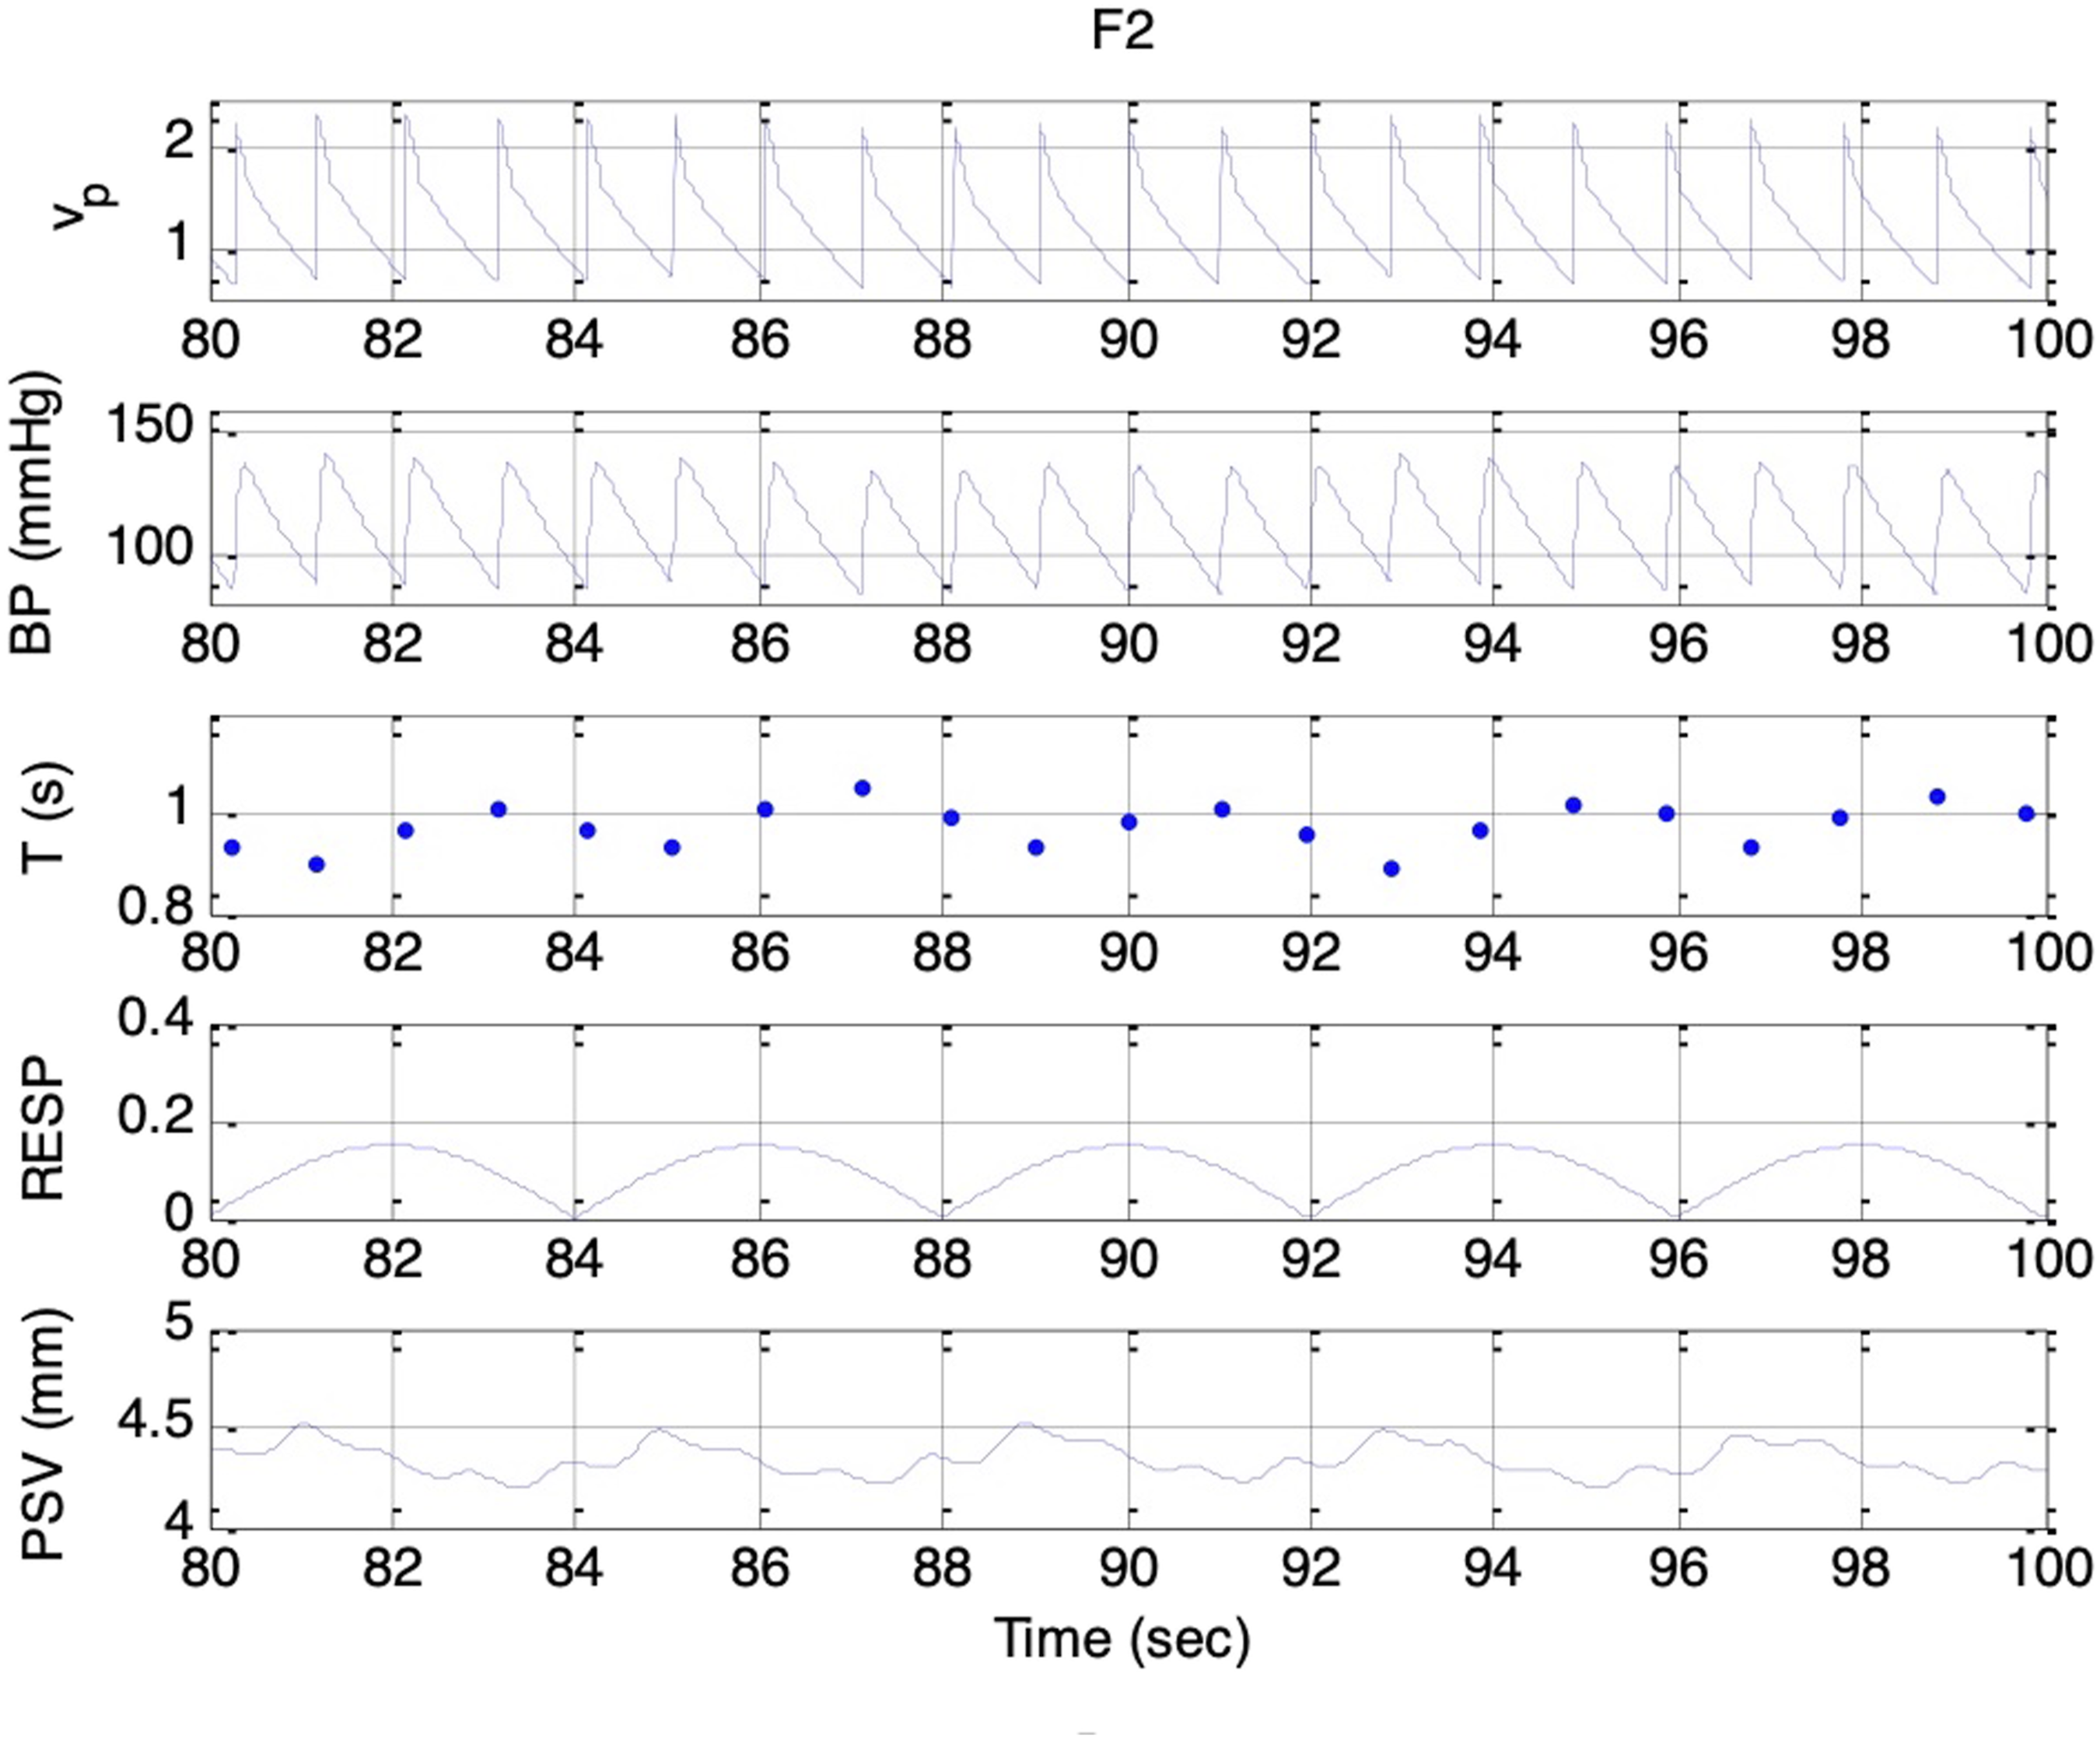
Simulated signals. Top to bottom: vp(t), BP, T, respiratory activity, and PSV under condition F2 and es_f_stat = 0. Delay between vagal onset and pupillary constriction indicates parasympathetic dominance during expiration
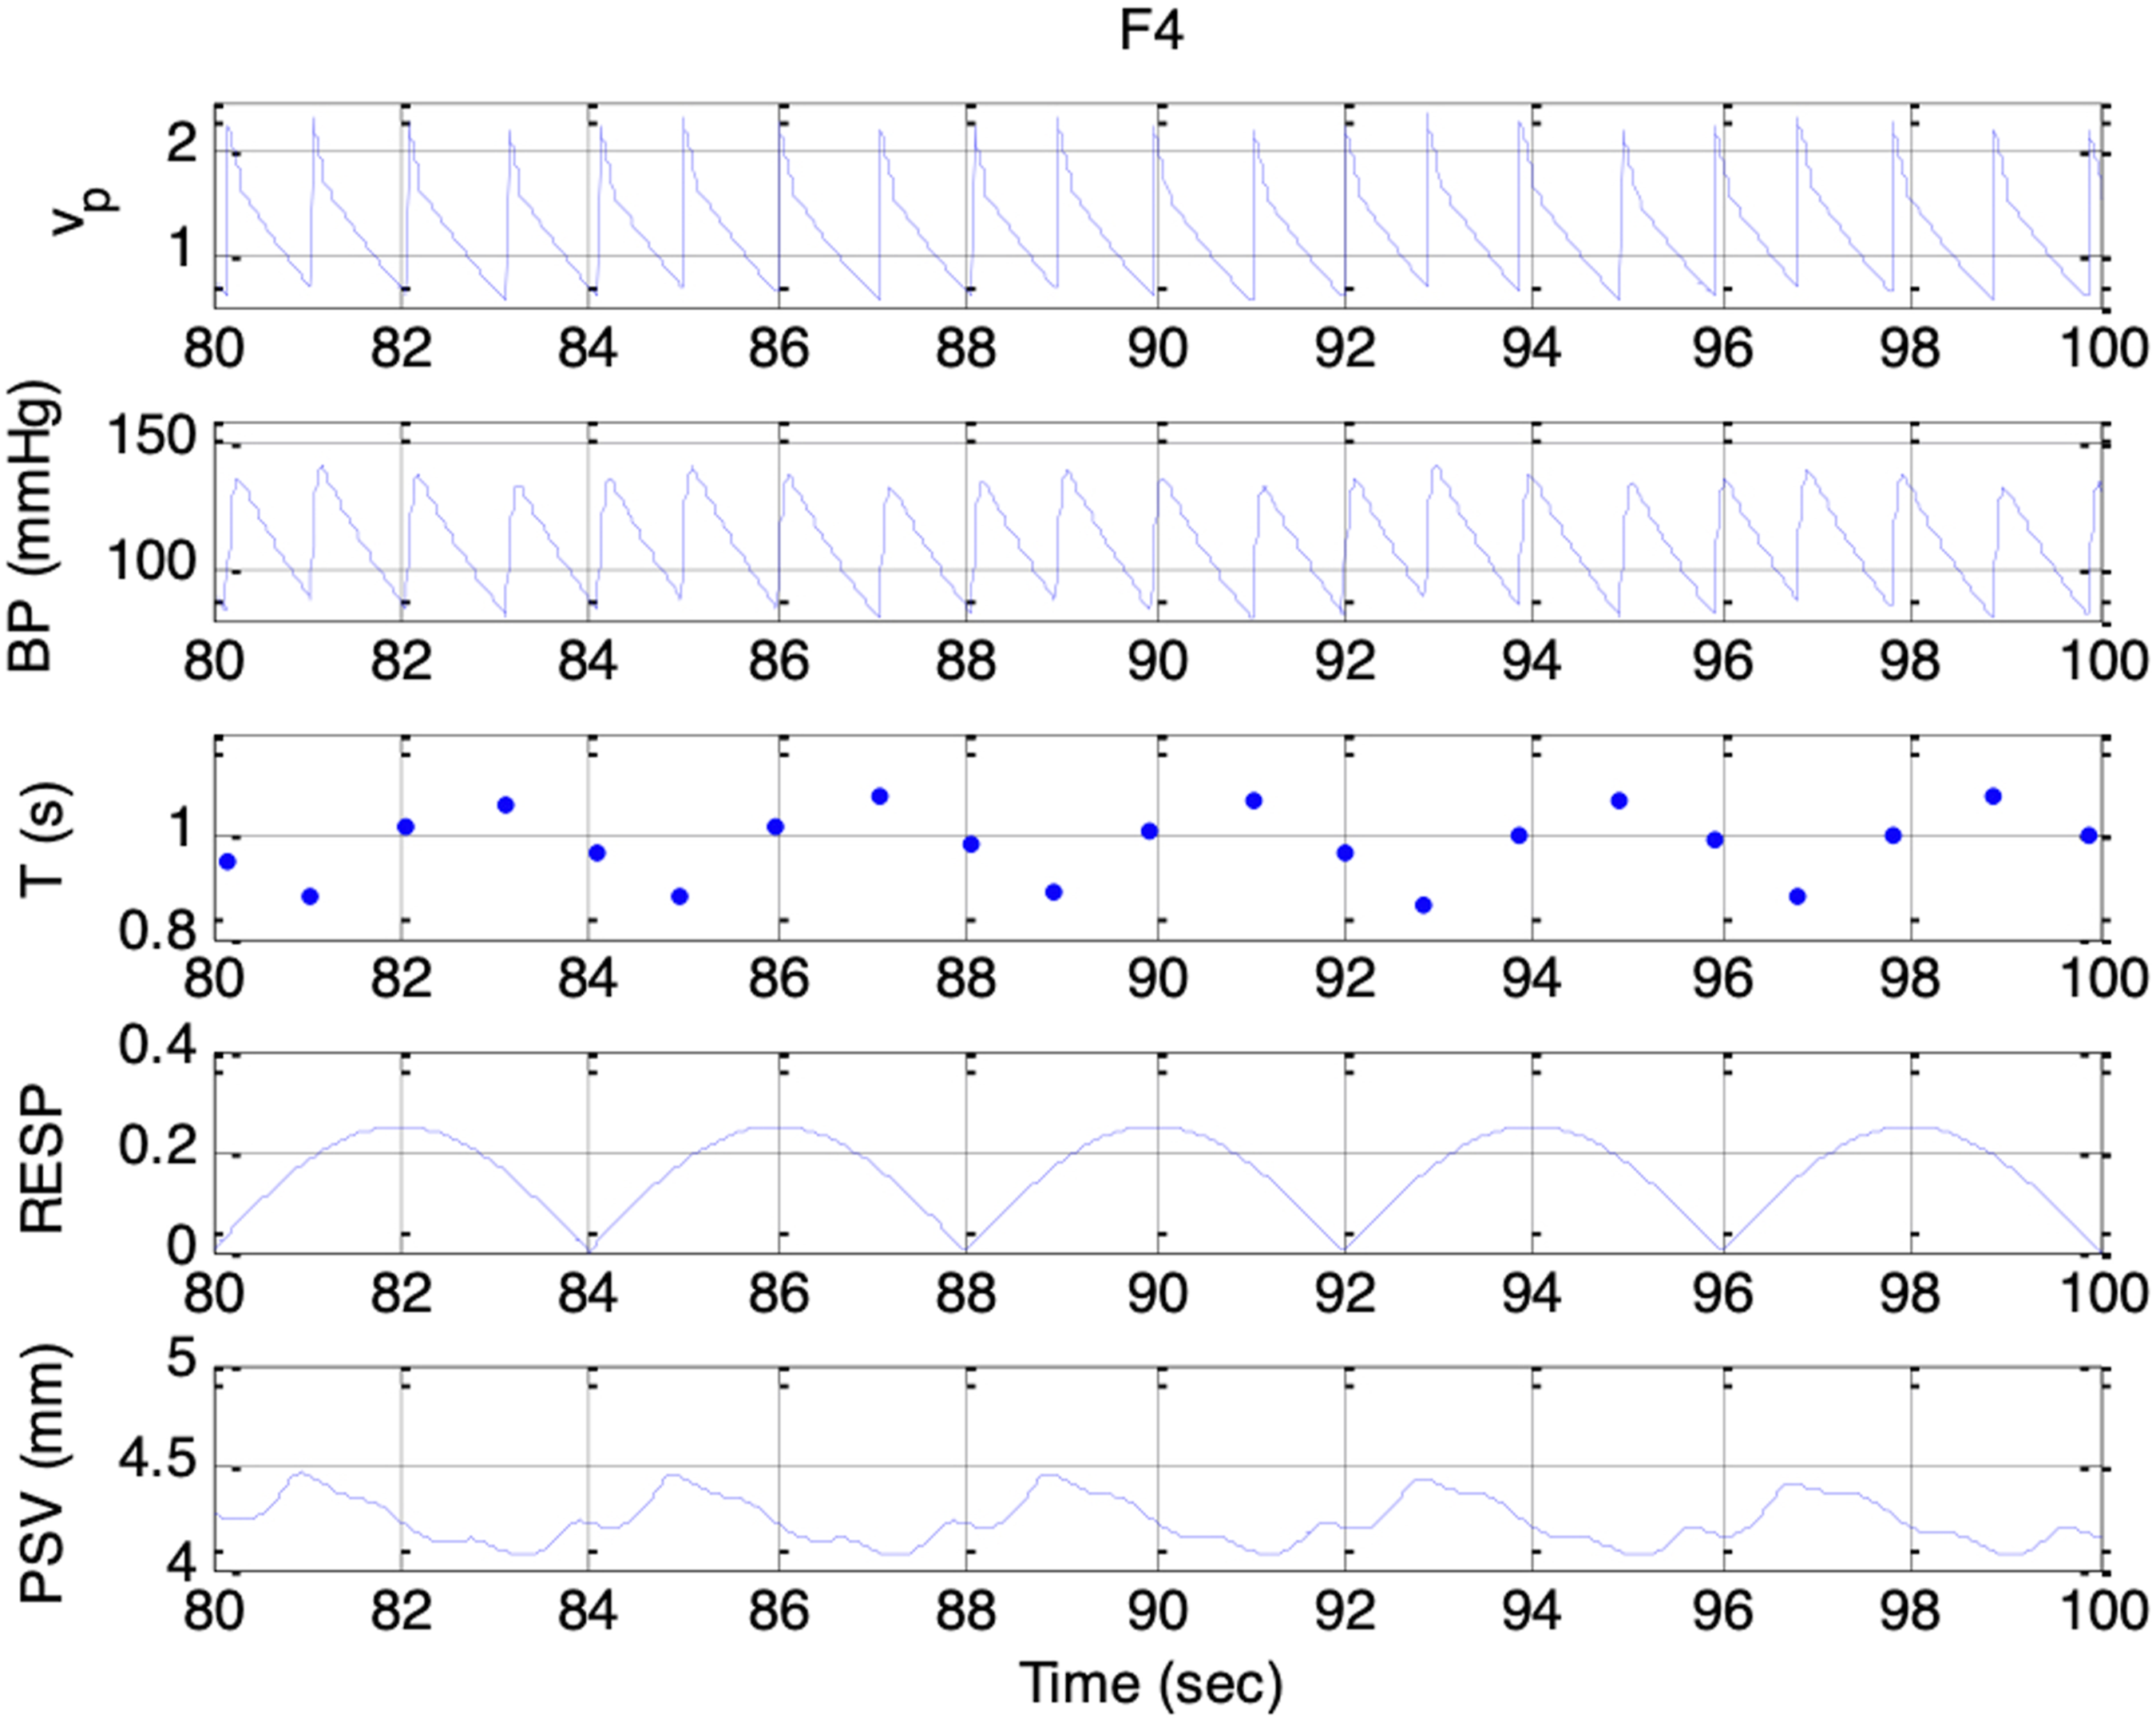
Simulated signals. Top to bottom: vp(t), BP, T, respiratory activity, and PSV under condition F4 and es_f_stat = 0
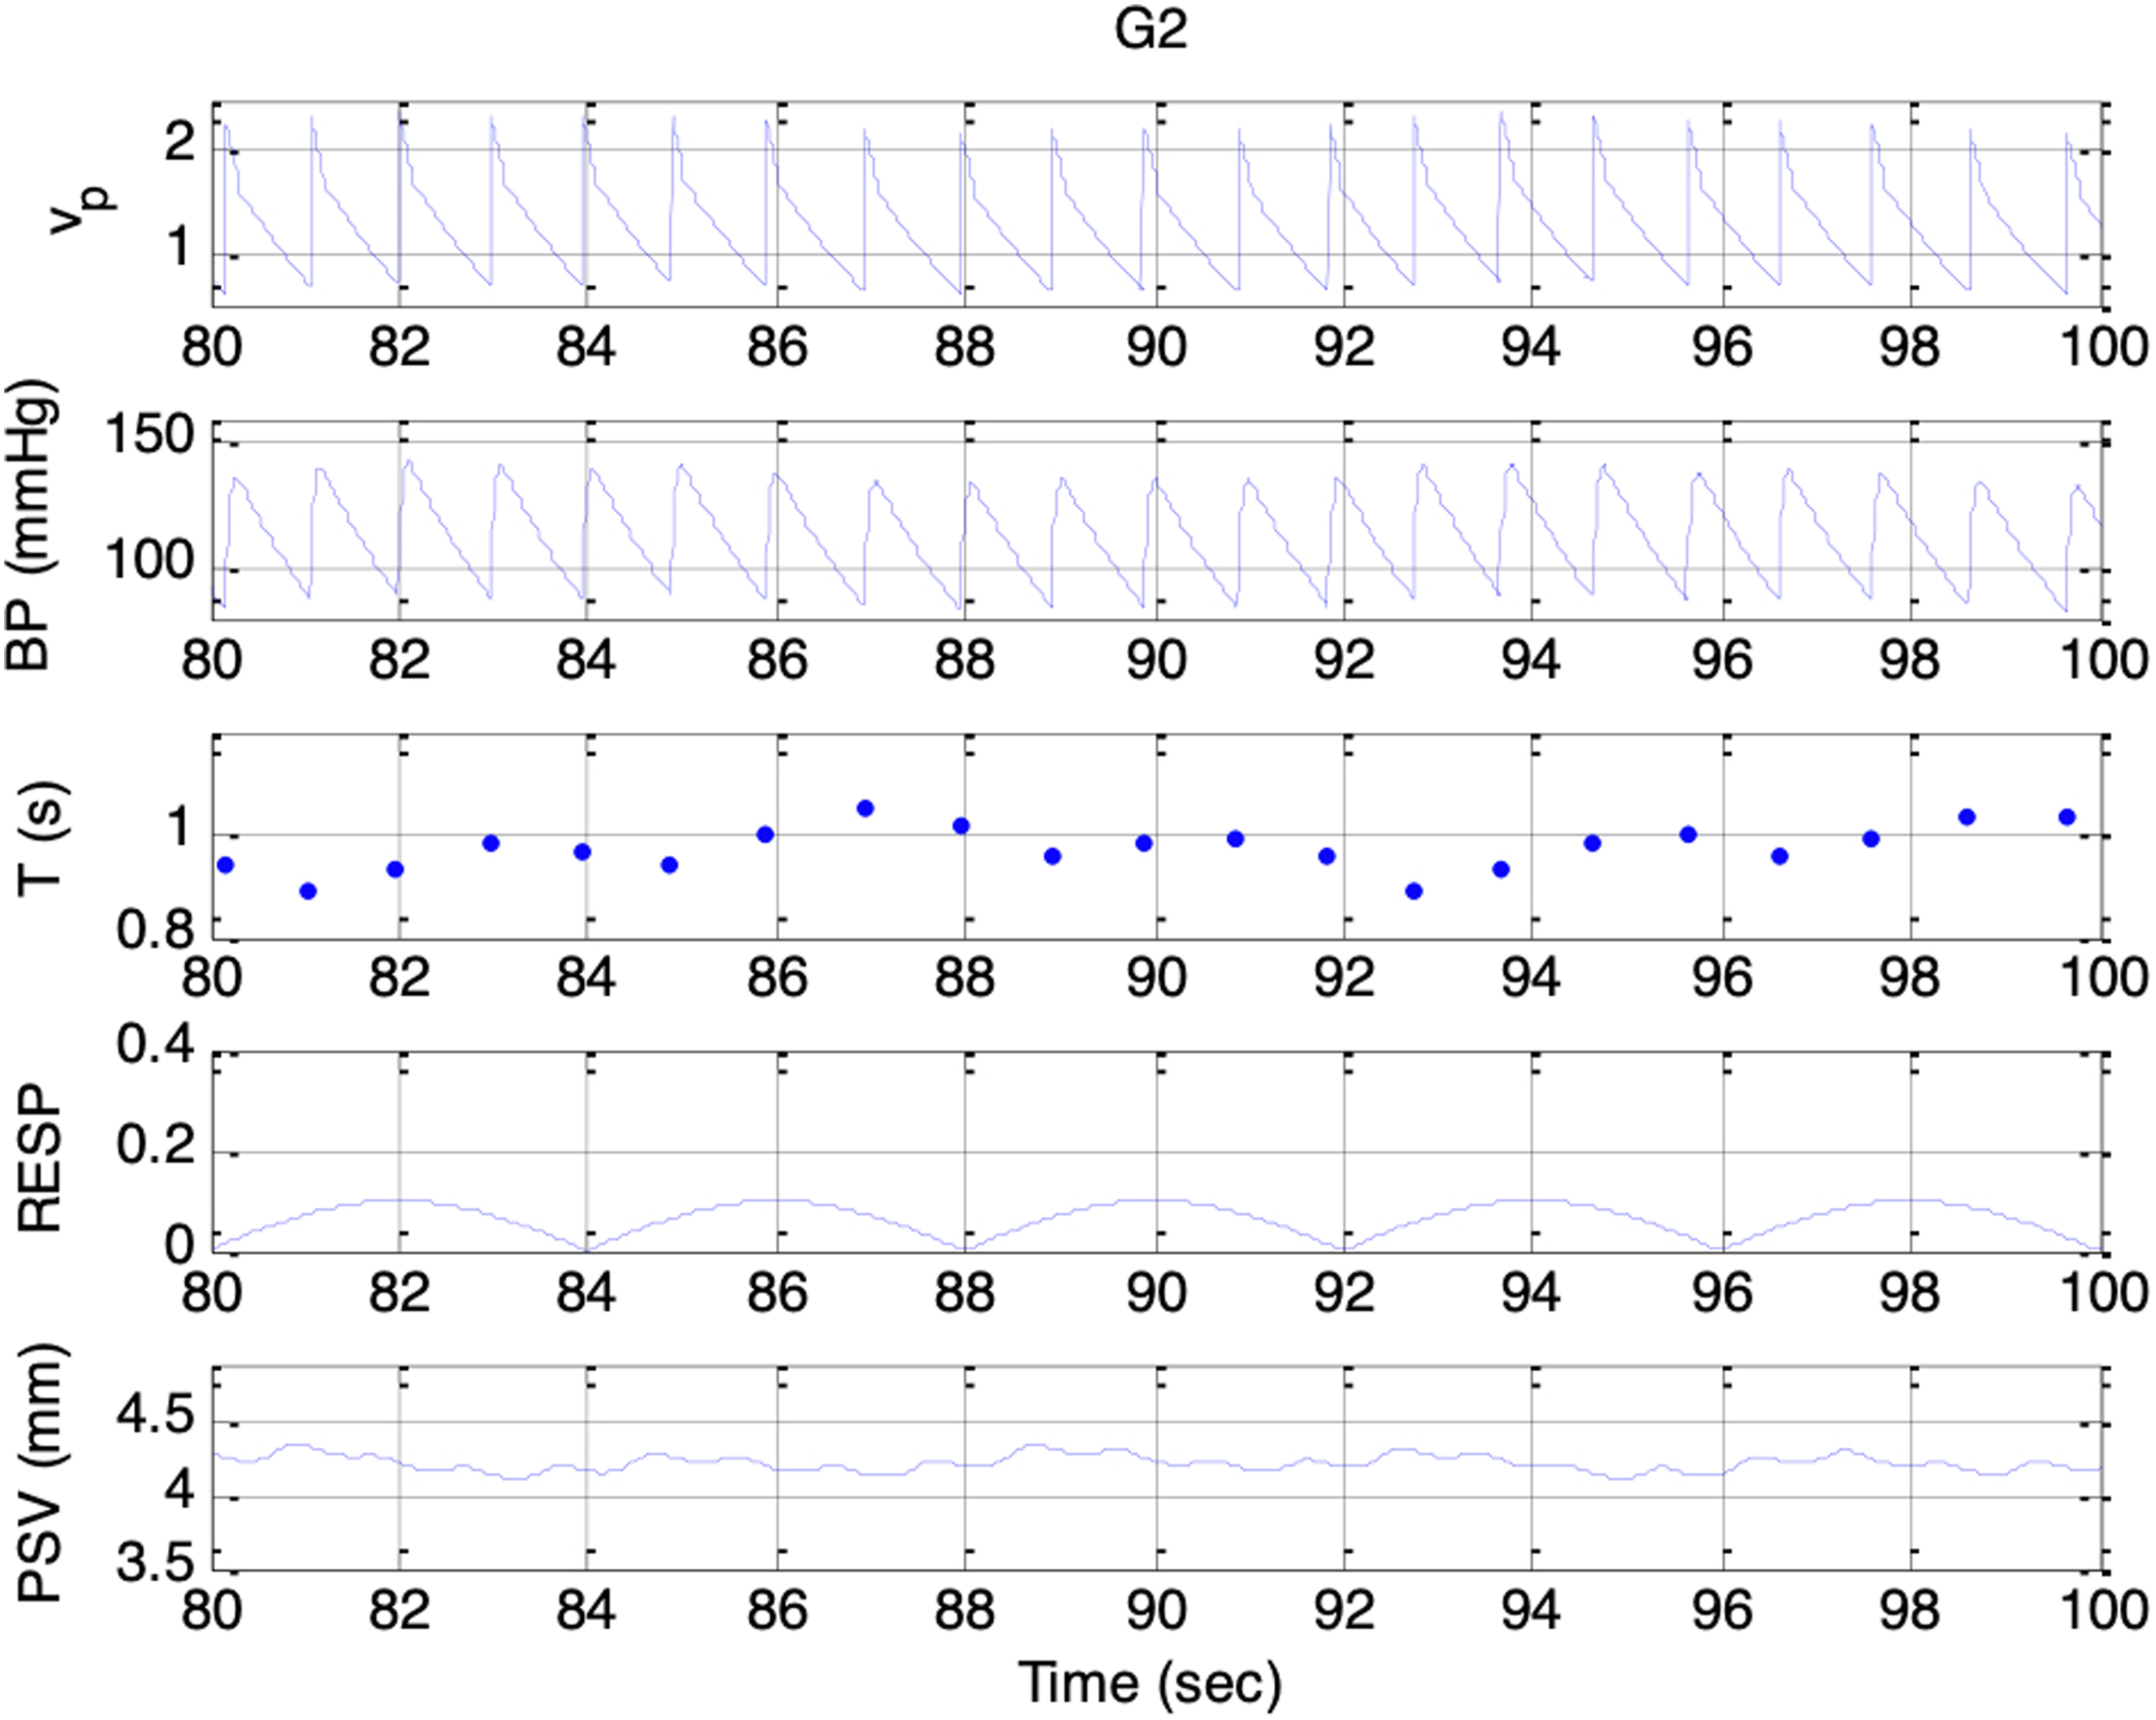
Simulated signals. Top to bottom: vp(t), BP, T, respiratory activity, and PSV under condition G2 and es_f_stat = 0
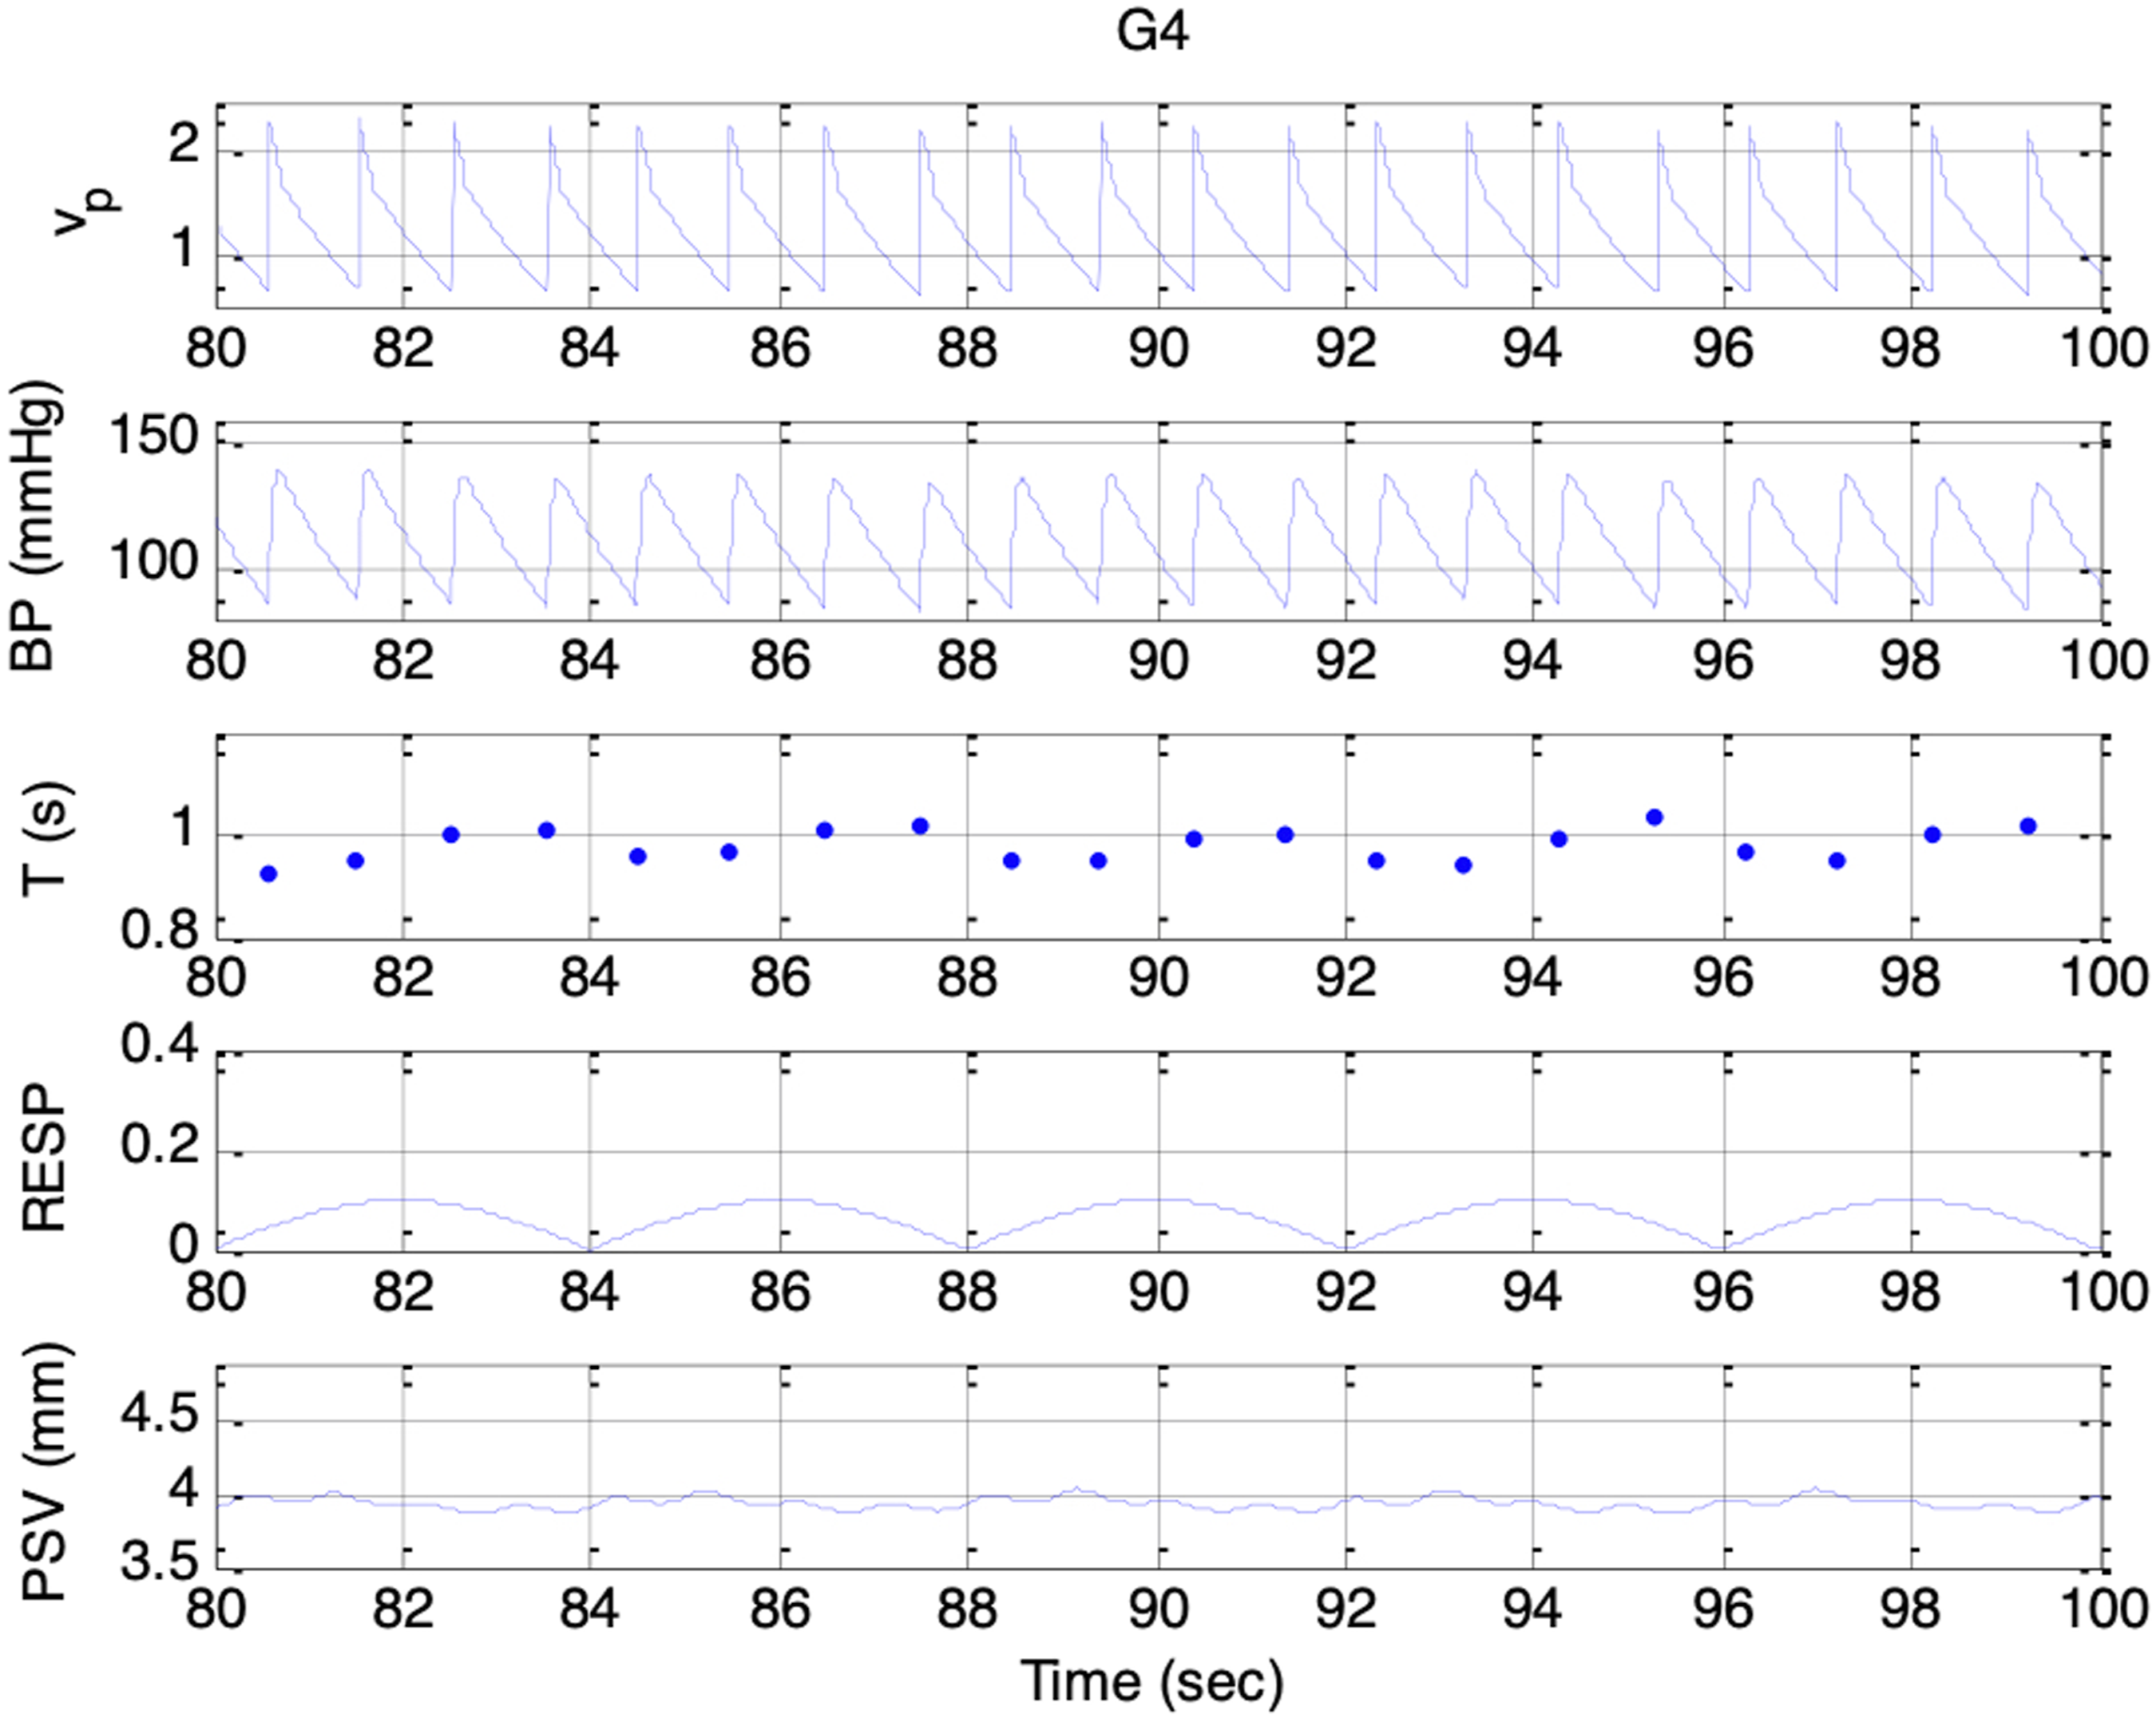
Simulated signals. Top to bottom: vp(t), BP, T, respiratory activity, and PSV under condition G4 and es_f_stat = 0
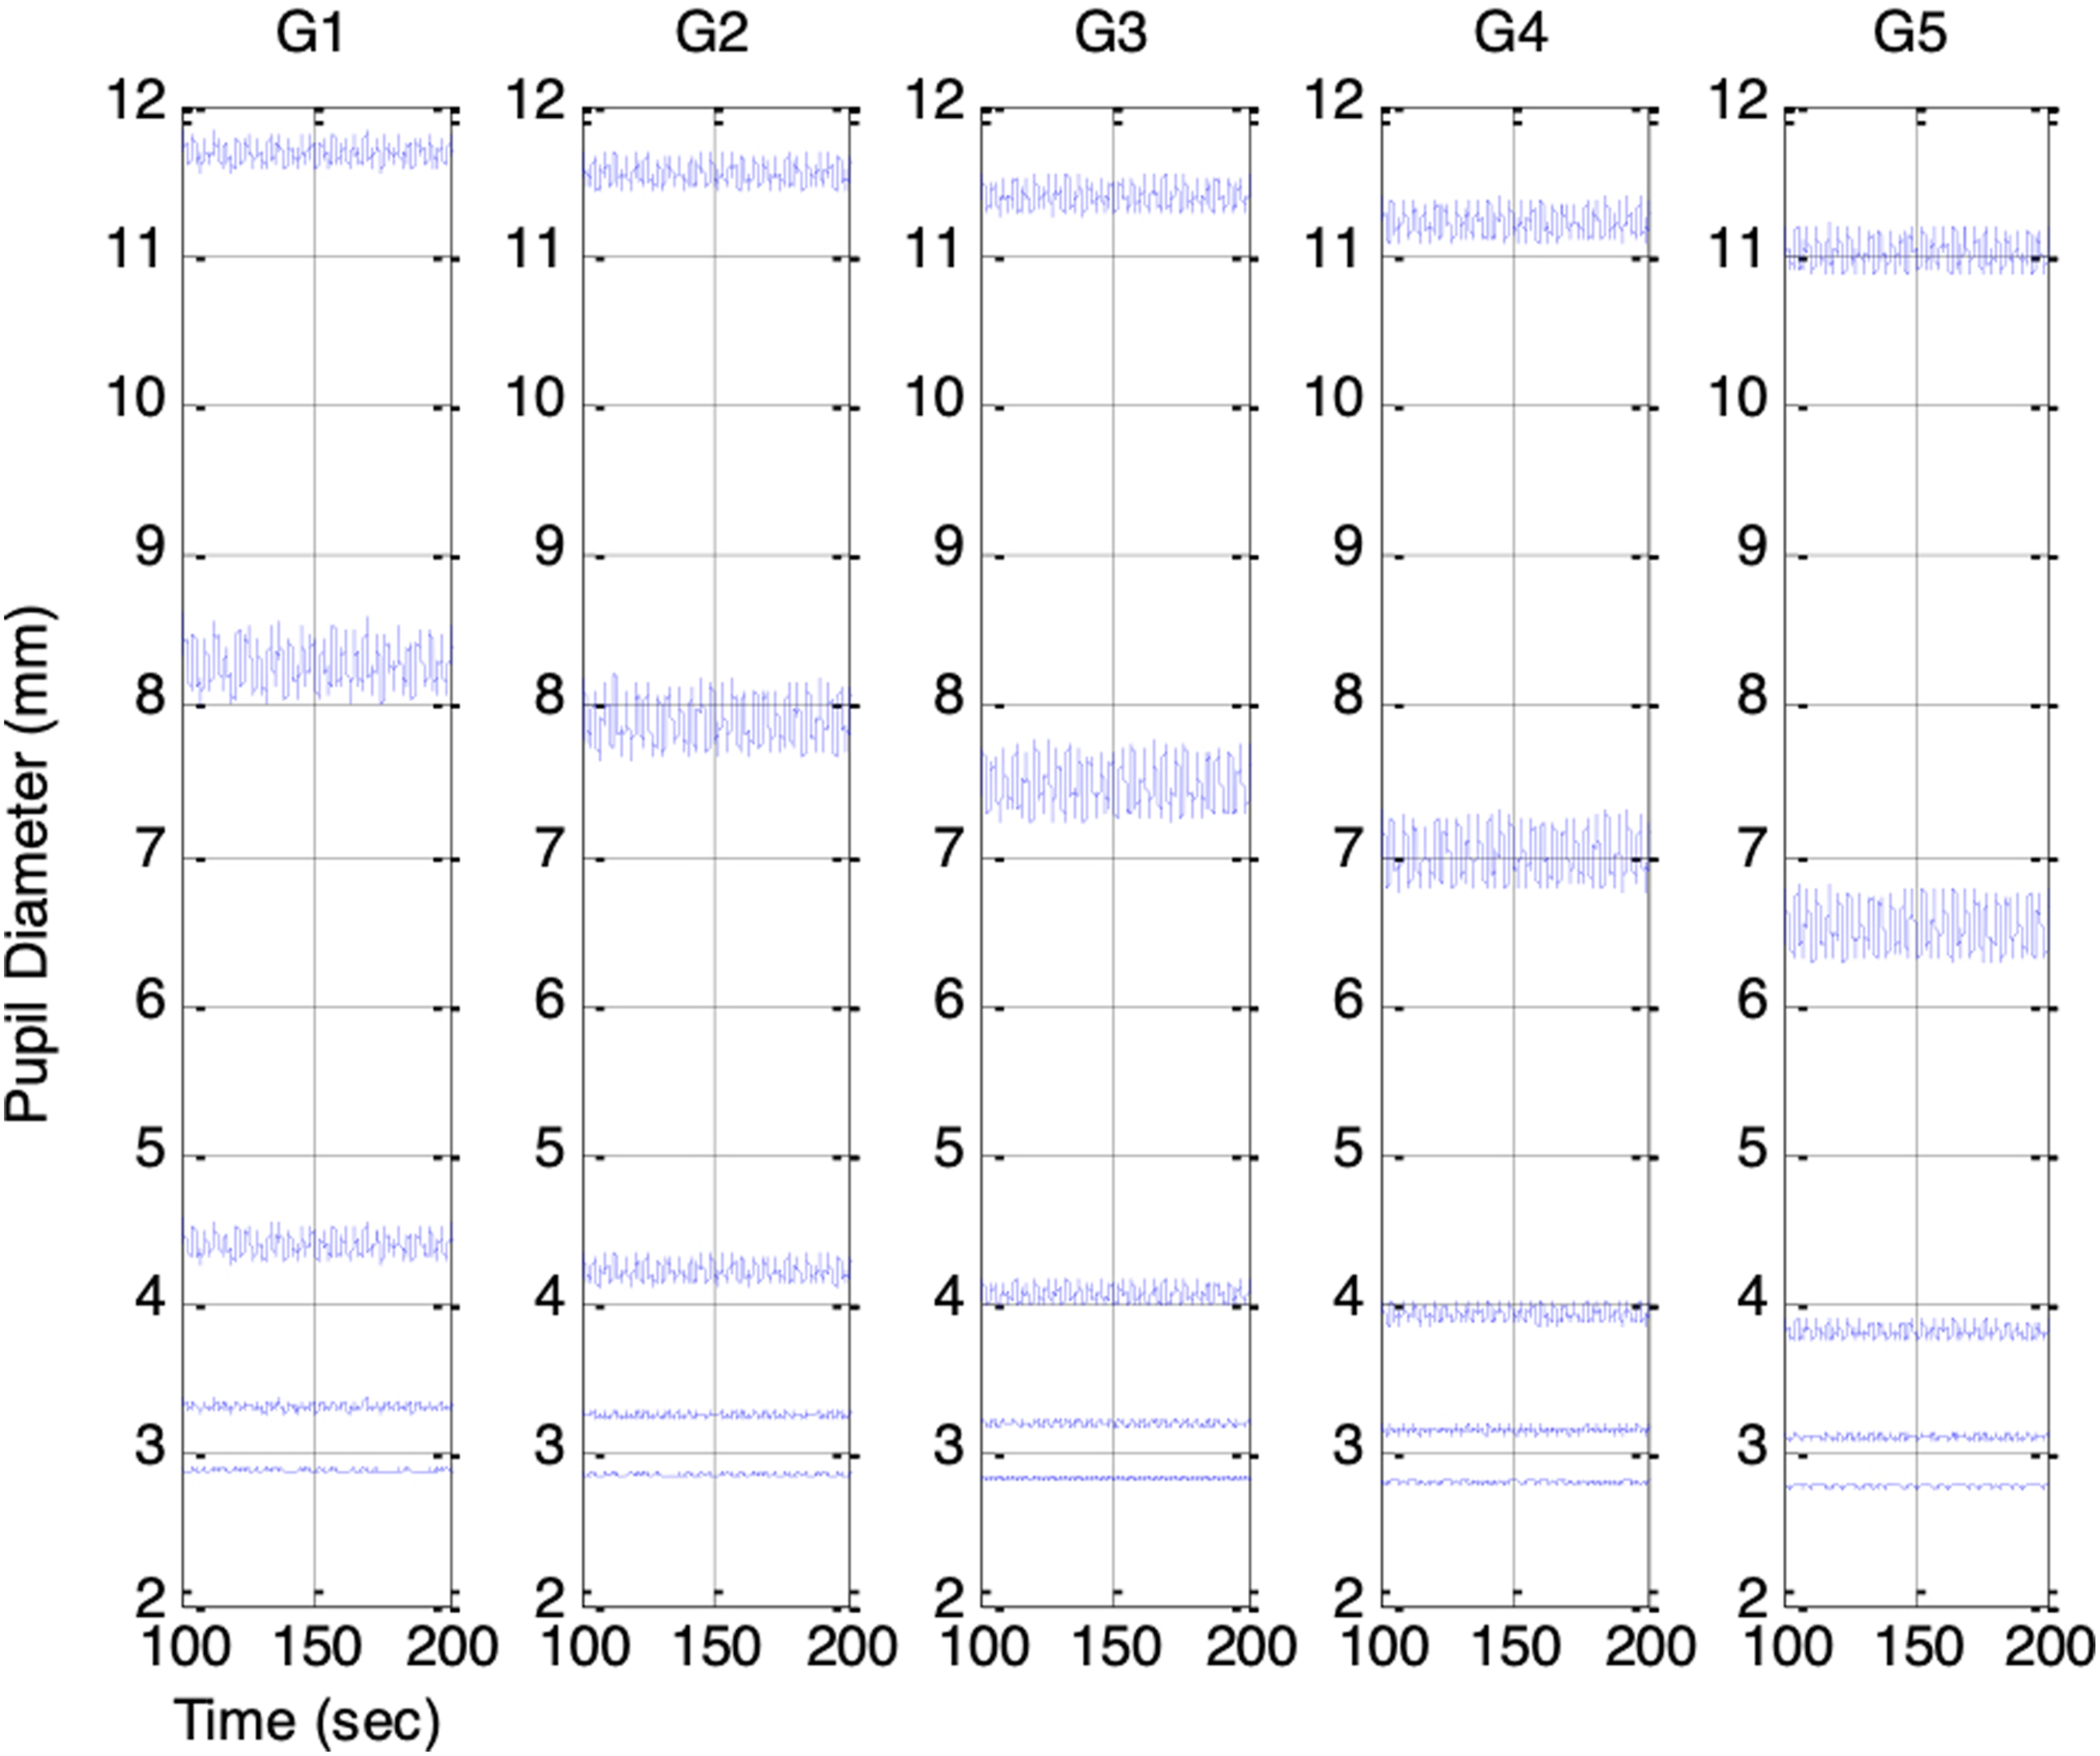
Across Sessions F1 to F5, the higher range of krp produced a peak-to-peak PSV amplitude that increased linearly with the strength of the respiratory influence. This aligns with Ohtsuka’s finding that, once above a certain threshold, pupil fluctuation amplitude was proportional to electrical phrenic discharge in humans. 9 In Sessions G1 to G5, stronger parasympathetic activity resulted in smaller mean pupil sizes, reduced HR, and lower BP, consistent with the well-established physiological actions of the parasympathetic nervous system (PSNS).
To further examine how ambient brightness conditions influence PSV, each simulation session was repeated with e
s_f_stat
varied from −0.4 to 0.4 in increments of 0.2 to represent increasing ambient brightness. Figures 13 and 14 show the resulting PSV waveforms. Even with ANS-related parameters held constant, higher ambient brightness produced smaller mean pupil sizes in every session. The PSV peak-to-peak amplitude was smallest when the pupil was either highly constricted or dilated, and largest when the pupil size was in the mid-range. This finding provides a new interpretation of the RNL property first described by Stark et al.7,8 They attributed the phenomenon to random Gaussian noise in the reflex arc, whereas our model suggests that PSV originates from ANS activities and that its statistical characteristics are shaped by the biomechanical properties of the pupillary muscle plant. Simulated PSV’s in Sessions F1 to F5: Increasing respiratory influence (krp = 0.1, 0.15, 0.2, 0.25, 0.3). Top to bottom: PSV under increasing ambient brightness (es_f_stat = -0.4, -0.2, 0, 0.2, 0.4 Simulated PSV’s in Sessions G1 to G5: Increasing parasympathetic activity (vp(0) = 0.1, 0.12, 0.14, 0.16, 0.18). Top to bottom: PSV under increasing ambient brightness (es_f_stat = -0.4, -0.2, 0, 0.2, 0.4)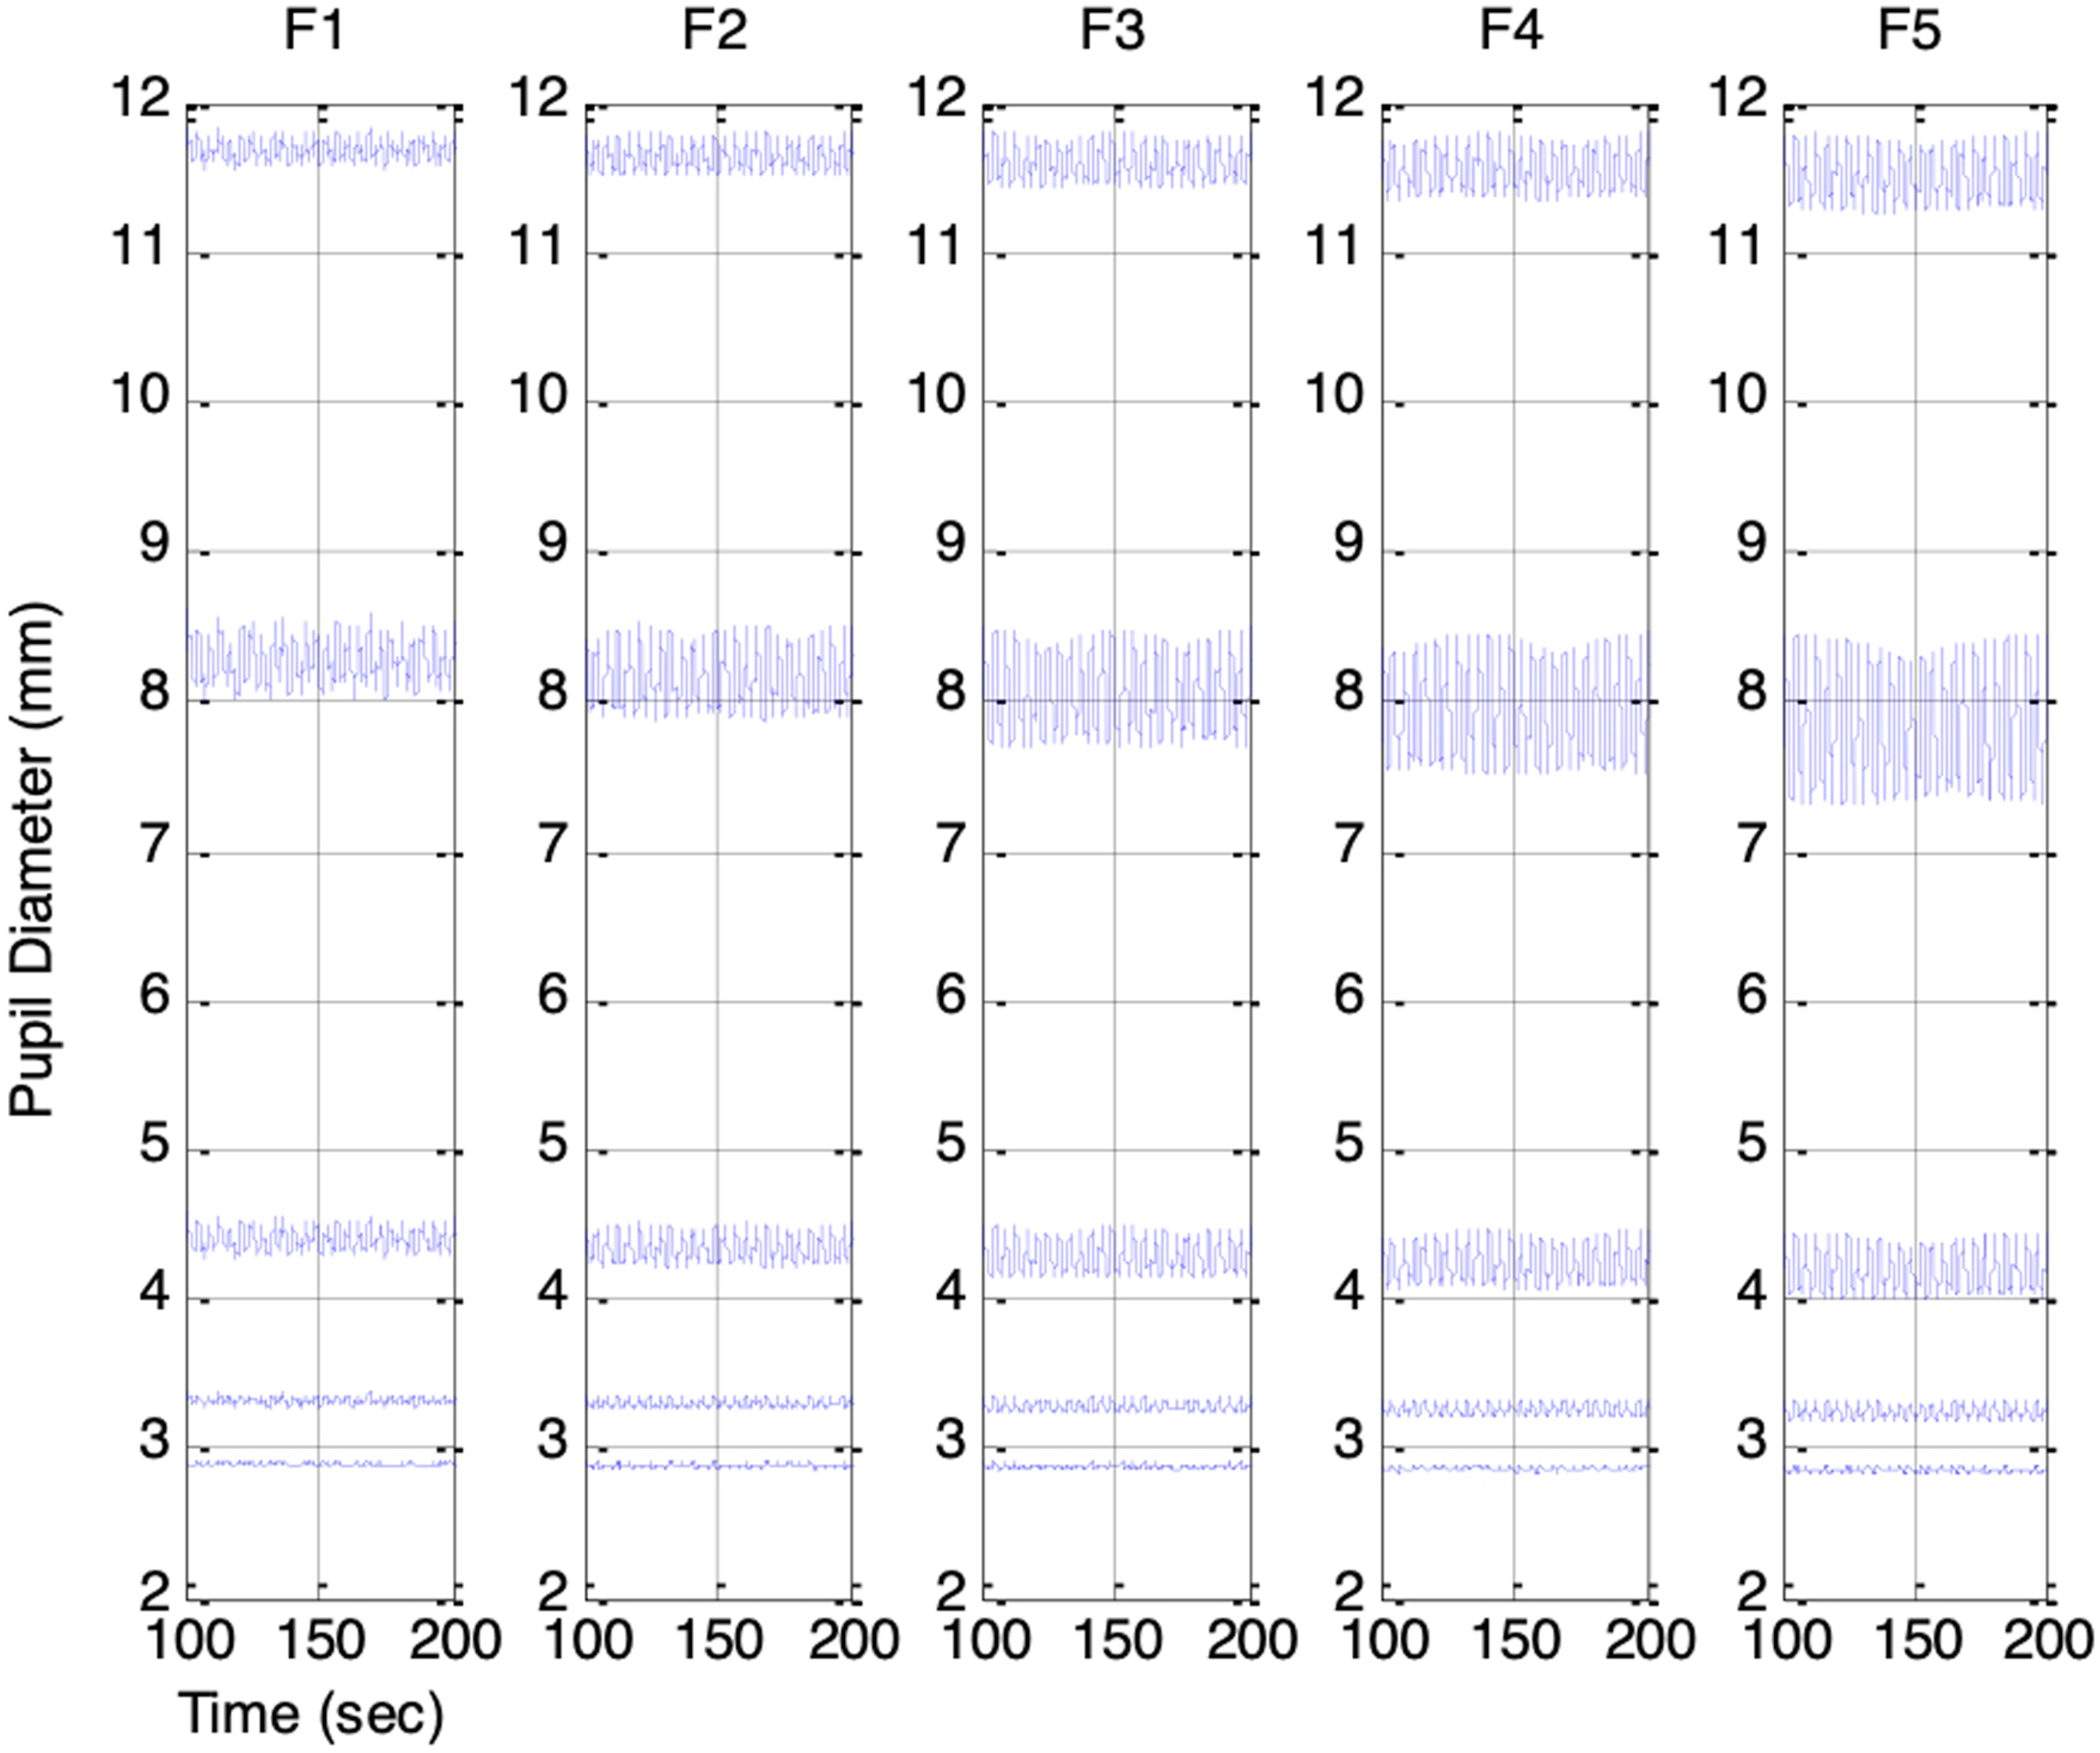
Consistent with Usui’s observations on pupillary fluctuations, the standard deviations of the simulated PSV signals were highest at mid-range pupil sizes (7-9 mm) and lowest at the lower and upper extremes (2 mm or 12 mm). However, unlike Usui’s findings, the resulting distributions were not Gaussian. This discrepancy likely arises because, rather than assuming Gaussian noise, our PSV signals were driven by ANS activity containing respiratory and baroregulatory components. Figure 15 shows the standard deviations of the simulated PSV plotted against mean pupil size, with the bottom-to-top traces corresponding to Sessions F1 through F5. These simulated behaviors establish the physiological validity of the model and set the stage for analyzing PSV and HRV in frequency domain. Plot of PSV standard deviation vs. PSV mean for F1 (bottom trace) to F5 (top trace)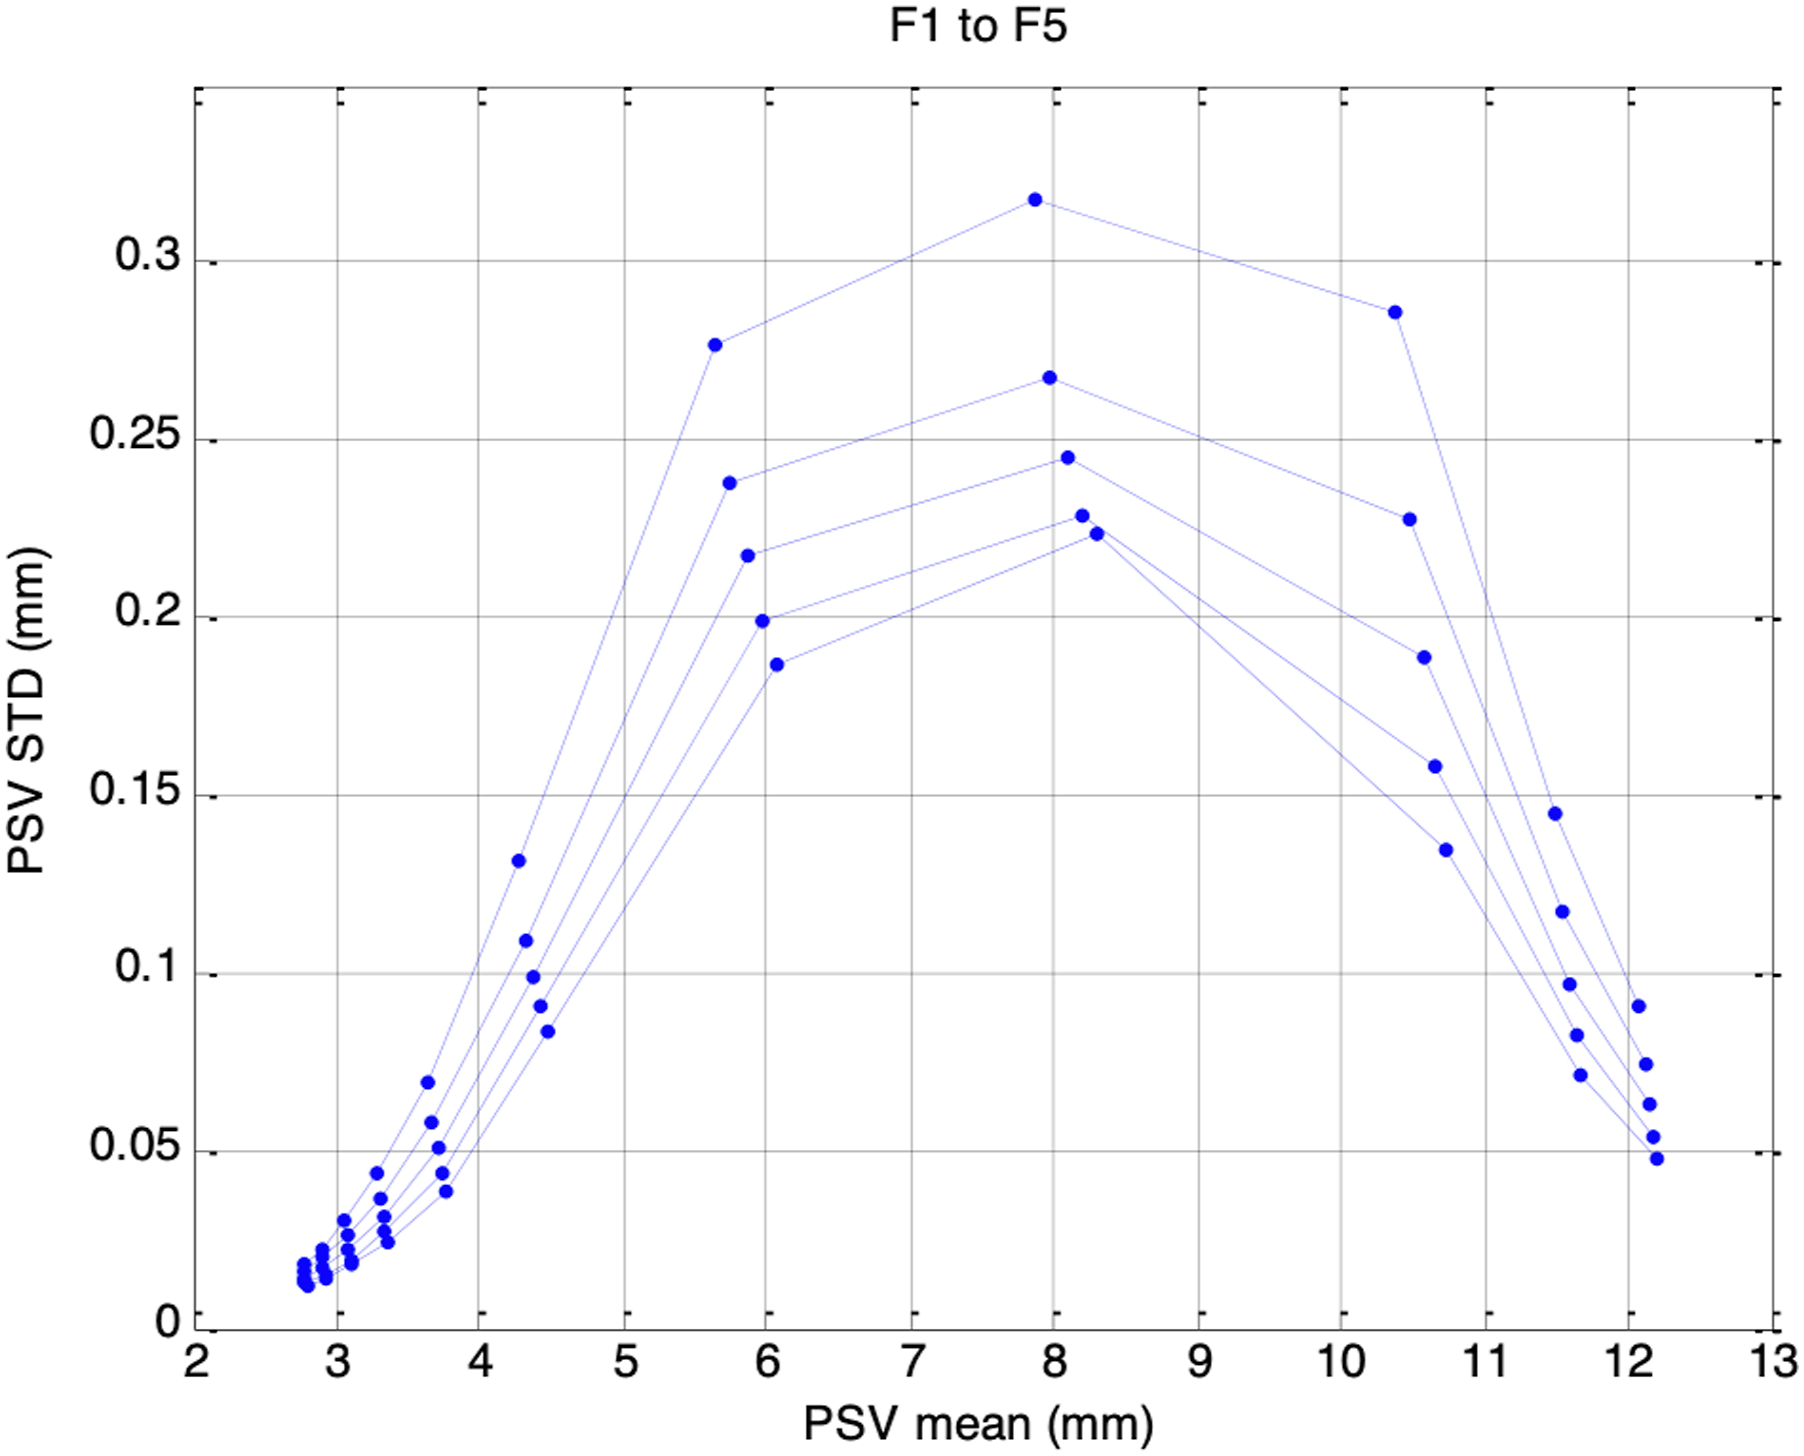
Frequency Analysis of Simulated HRV and PSV
Analysis of power spectral density (PSD) of HRV is commonly performed to provide indices of autonomic balance, with high-frequency power (HF: 0.15-0.5 Hz) generally associated with parasympathetic activity and low-frequency power (LF: 0.04-0.15 Hz) reflecting both parasympathetic and sympathetic activities. 6 To investigate whether the same interpretations can be applied to PSV, each simulated PSV signal in our study was low-pass filtered (FIR, fc = 0.5 Hz, p = 200) and resampled at 1.25Hz before parametric spectral estimation using autoregressive (AR) modeling with the Burg method (p = 12). HRV signals were generated by constructing event series of delta functions at simulated heartbeat times, low-pass filtering them (FIR, fc = 0.5 Hz, p = 200) for spectrum-of-counts analysis, and resampling at 1.25 Hz prior to Burg spectral estimation.
From the resulting PSV and HRV spectra, total power (TP: 0.04-0.5 Hz), LF power (LFP: 0.04-0.15 Hz), and HF power (HFP: 0.15–0.5 Hz) were computed as the areas under their respective frequency bands, with normalized indices defined as nLFP = LFP/TP and nHFP = HFP/TP. These indices were derived under the conditions corresponding to the different autonomic states in simulation Sessions F1–F5 and G1–G5, and under the various ambient brightness conditions. The aim is to explore, through simulation, whether the frequency characteristics of PSV and their associated indices can be interpreted in the same way as HRV, thereby supporting the use of PSV as a potential marker of autonomic function.
Figure 16 shows the frequency spectra of the simulated HRV signals under the five autonomic conditions of increasing respiratory influence (F1 to F5). A clear respiratory component at 0.25Hz was present in each HRV spectrum, with its peak amplitude increasing as the respiratory influence, krp, was raised from 0.1 to 0.3. A 0.1Hz component corresponding to the Mayer wave was also evident, although it was weaker and showed decreasing amplitude as krp increased. The corresponding HRV indices nLFP, nHFP, TP, and LF/HF for F1 to F5 are shown in Figure 17. As krp increased, nLFP decreased, nHFP increased, TP increased, and LF/HF decreased, indicating enhanced sympathetic and parasympathetic activities, and a shift in autonomic balance toward greater parasympathetic dominance. Frequency spectra of simulated HRV signal under five different autonomic conditions. Top to bottom traces: increasing respiratory influence (F1 to F5: krp = 0.1, 0.15, 0.2, 0.25, 0.3) Top to bottom: nLFP, nHFP, TP, and LF/HF for simulated HRV under five different autonomic conditions of increasing respiratory influence (F1 to F5: krp = 0.1, 0.15, 0.2, 0.25, 0.3). These trends reflect a shift in autonomic balance toward greater parasympathetic dominance as respiratory influence increases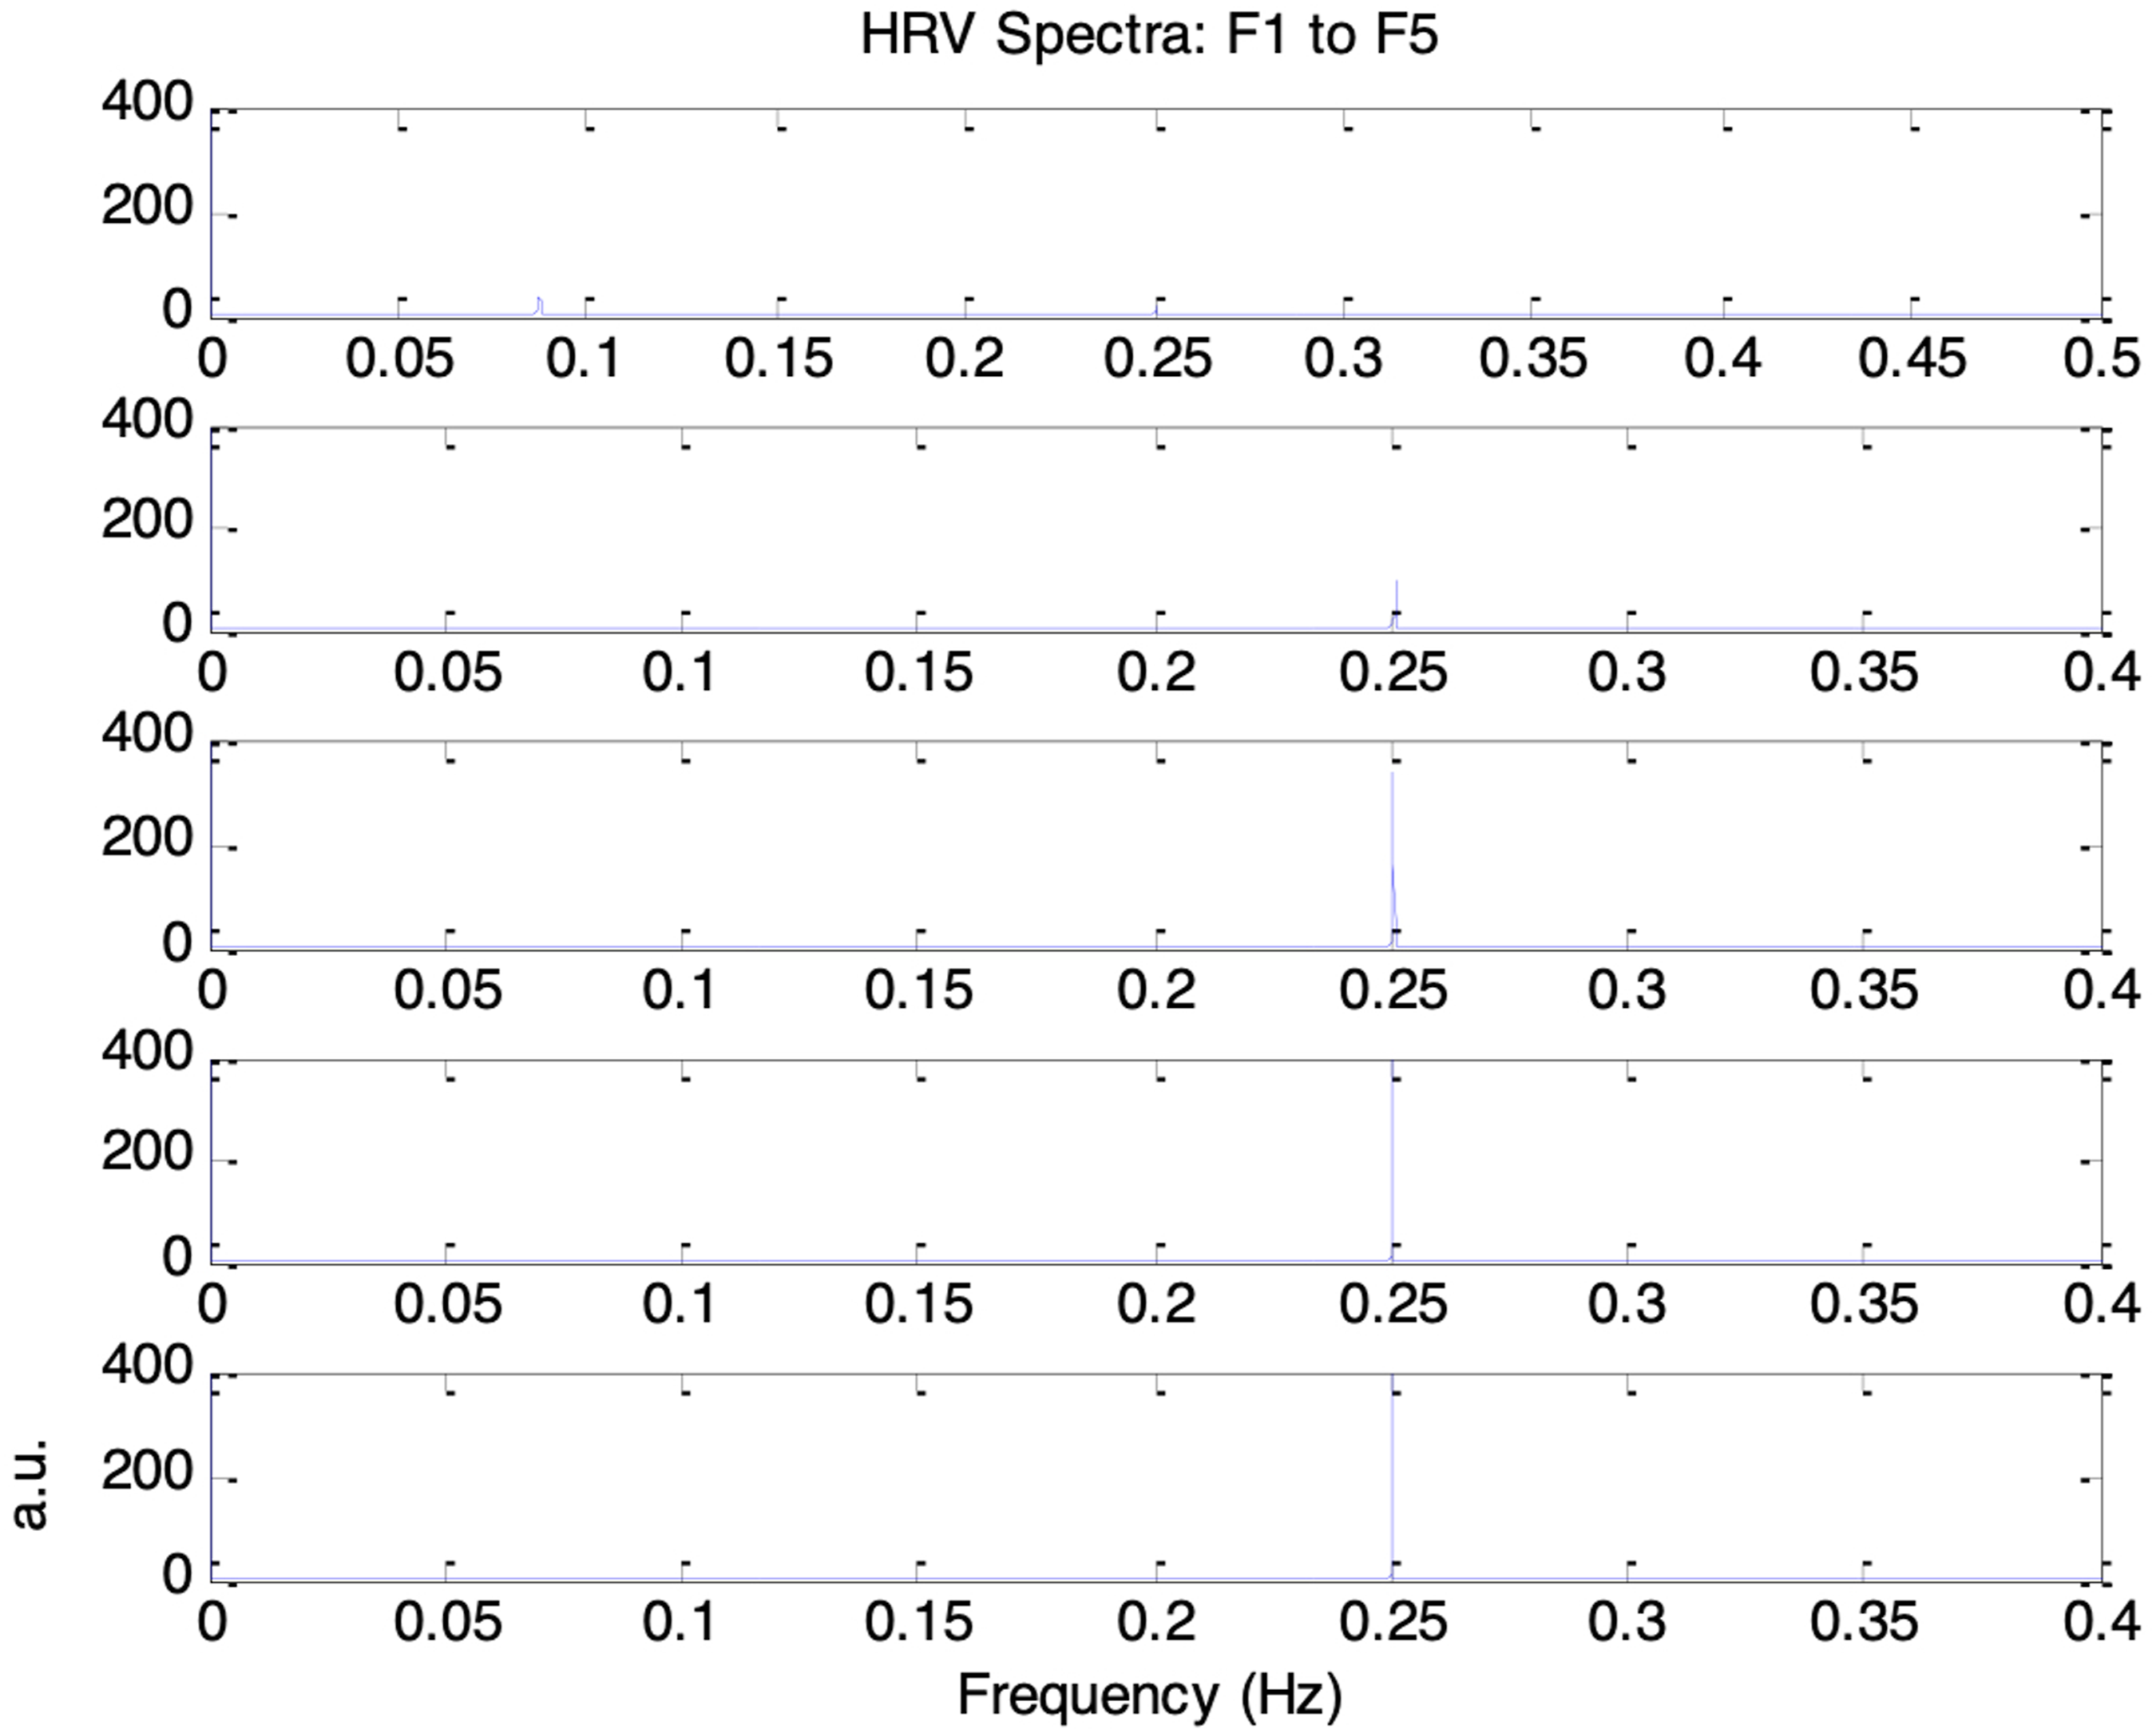
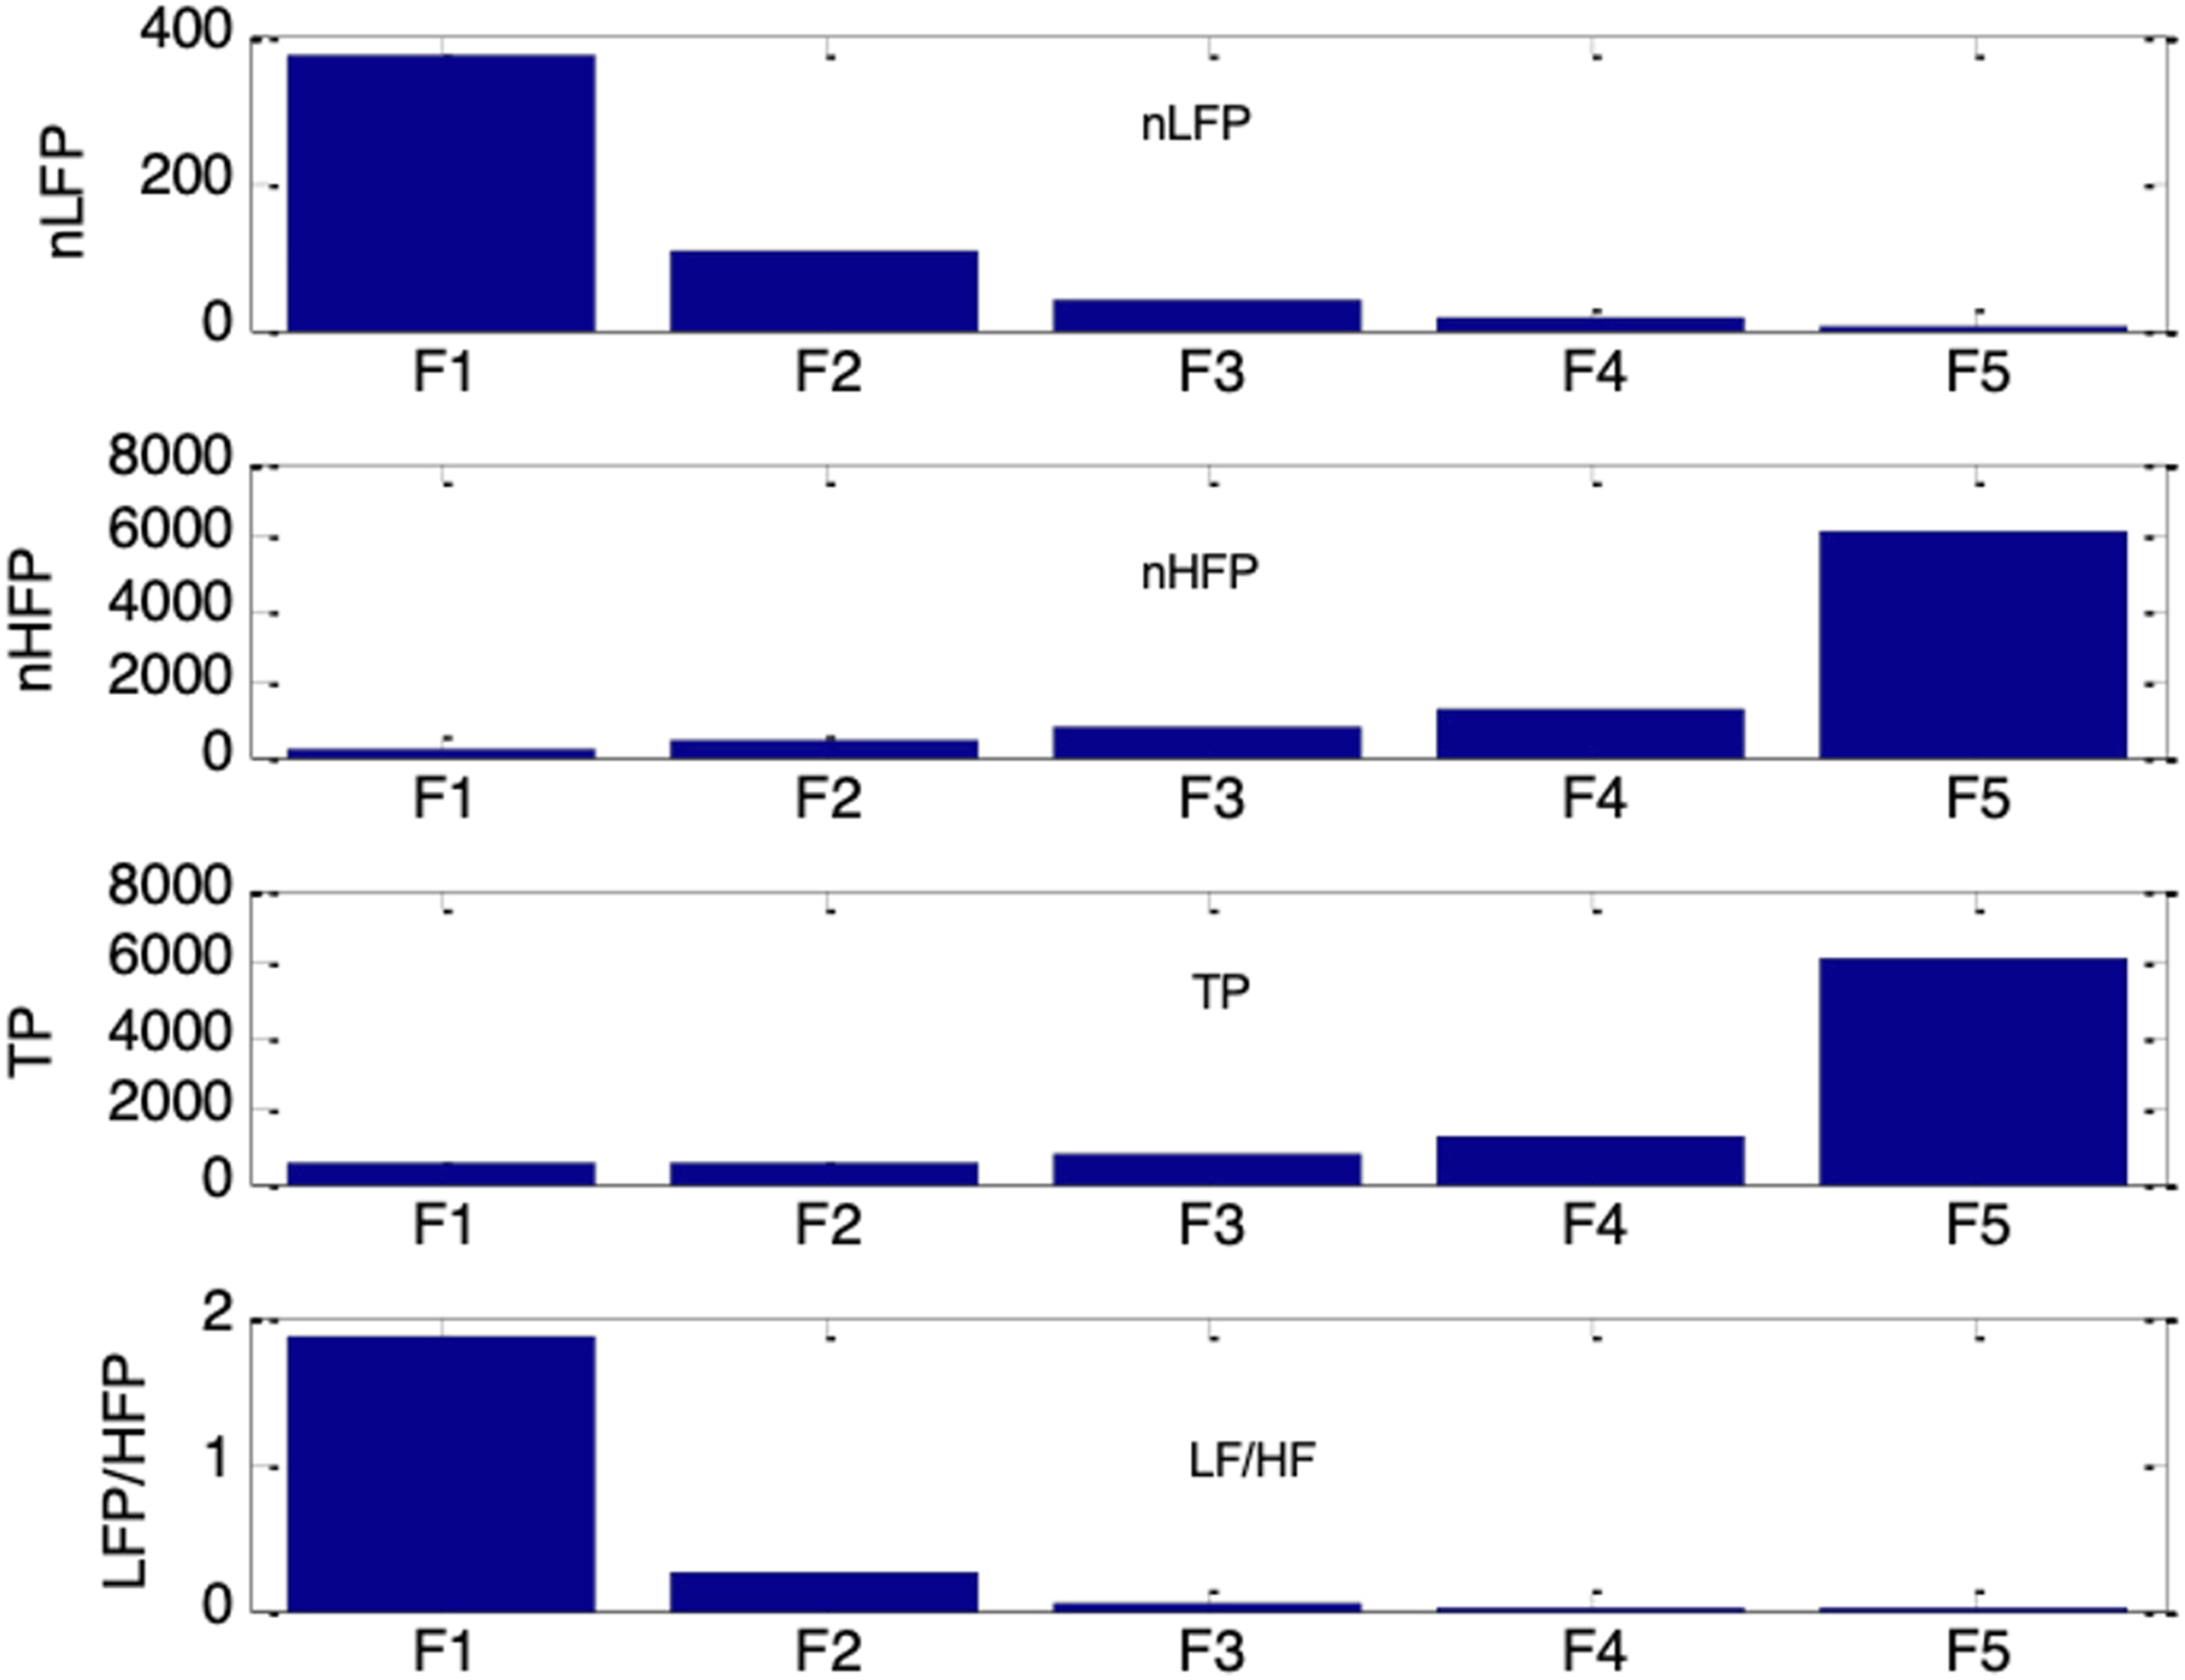
Figure 18 shows the frequency spectra of the simulated HRV signals under the five conditions of increasing parasympathetic activity (G1 to G5). Respiratory and Mayer wave components were also evident at 0.25Hz and 0.1Hz, respectively. As parasympathetic activity, vp(0), increased from 0.1 to 0.18, the 0.1Hz component weakened while the 0.25 Hz component became more pronounced. The corresponding HRV indices nLFP, nHFP, TP, and LF/HF for G1 to G5 are shown in Figure 19. As vp(0) increased, nLFP decreased, nHFP increased, TP decreased, and LF/HF decreased. These changes indicate reductions in both sympathetic and parasympathetic activities, together with a shift in autonomic balance toward greater parasympathetic dominance. This transition from G1 to G5 resembles the trend typically observed during the recovery of parasympathetic activity. Frequency spectra of simulated HRV signal under five different autonomic conditions. Top to bottom traces: increasing parasympathetic activity (G1 to G5: vp(0) = 0.1, 0.12, 0.14, 0.16, 0.18) Top to bottom: nLFP, nHFP, TP, and LF/HF for simulated HRV under five different autonomic conditions of increasing parasympathetic activity (G1 to G5: vp(0) = 0.1, 0.12, 0.14, 0.16, 0.18)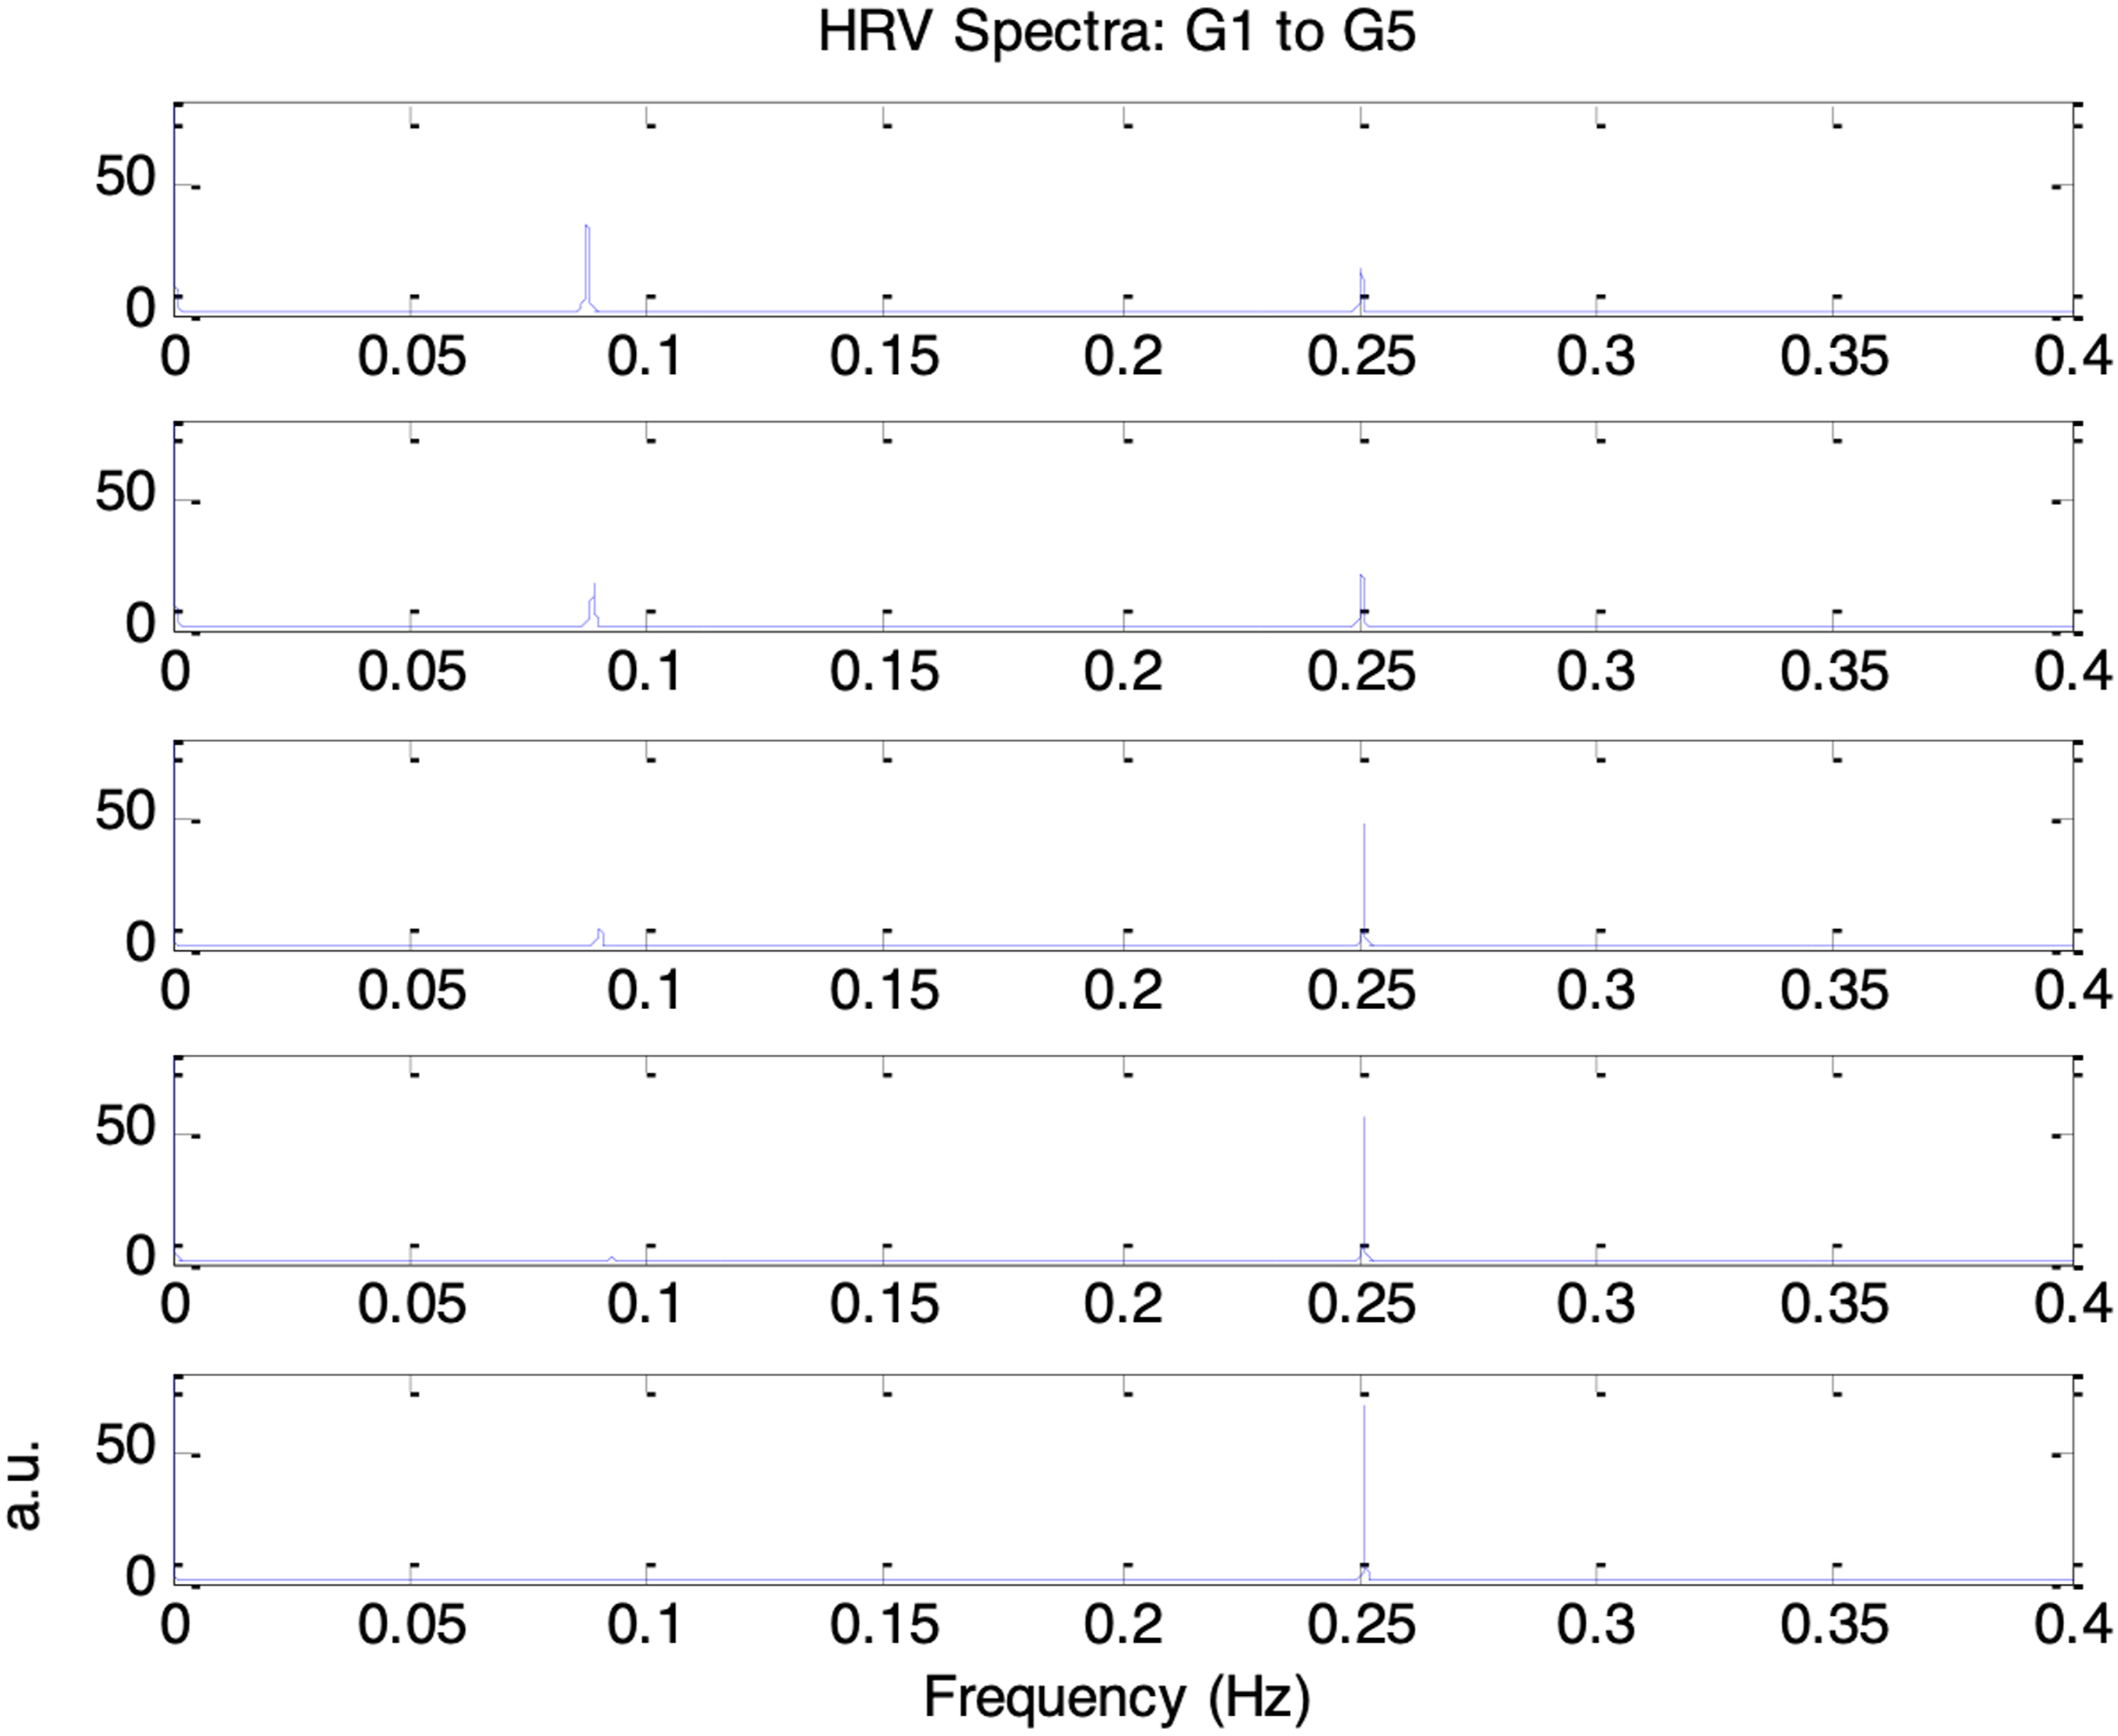
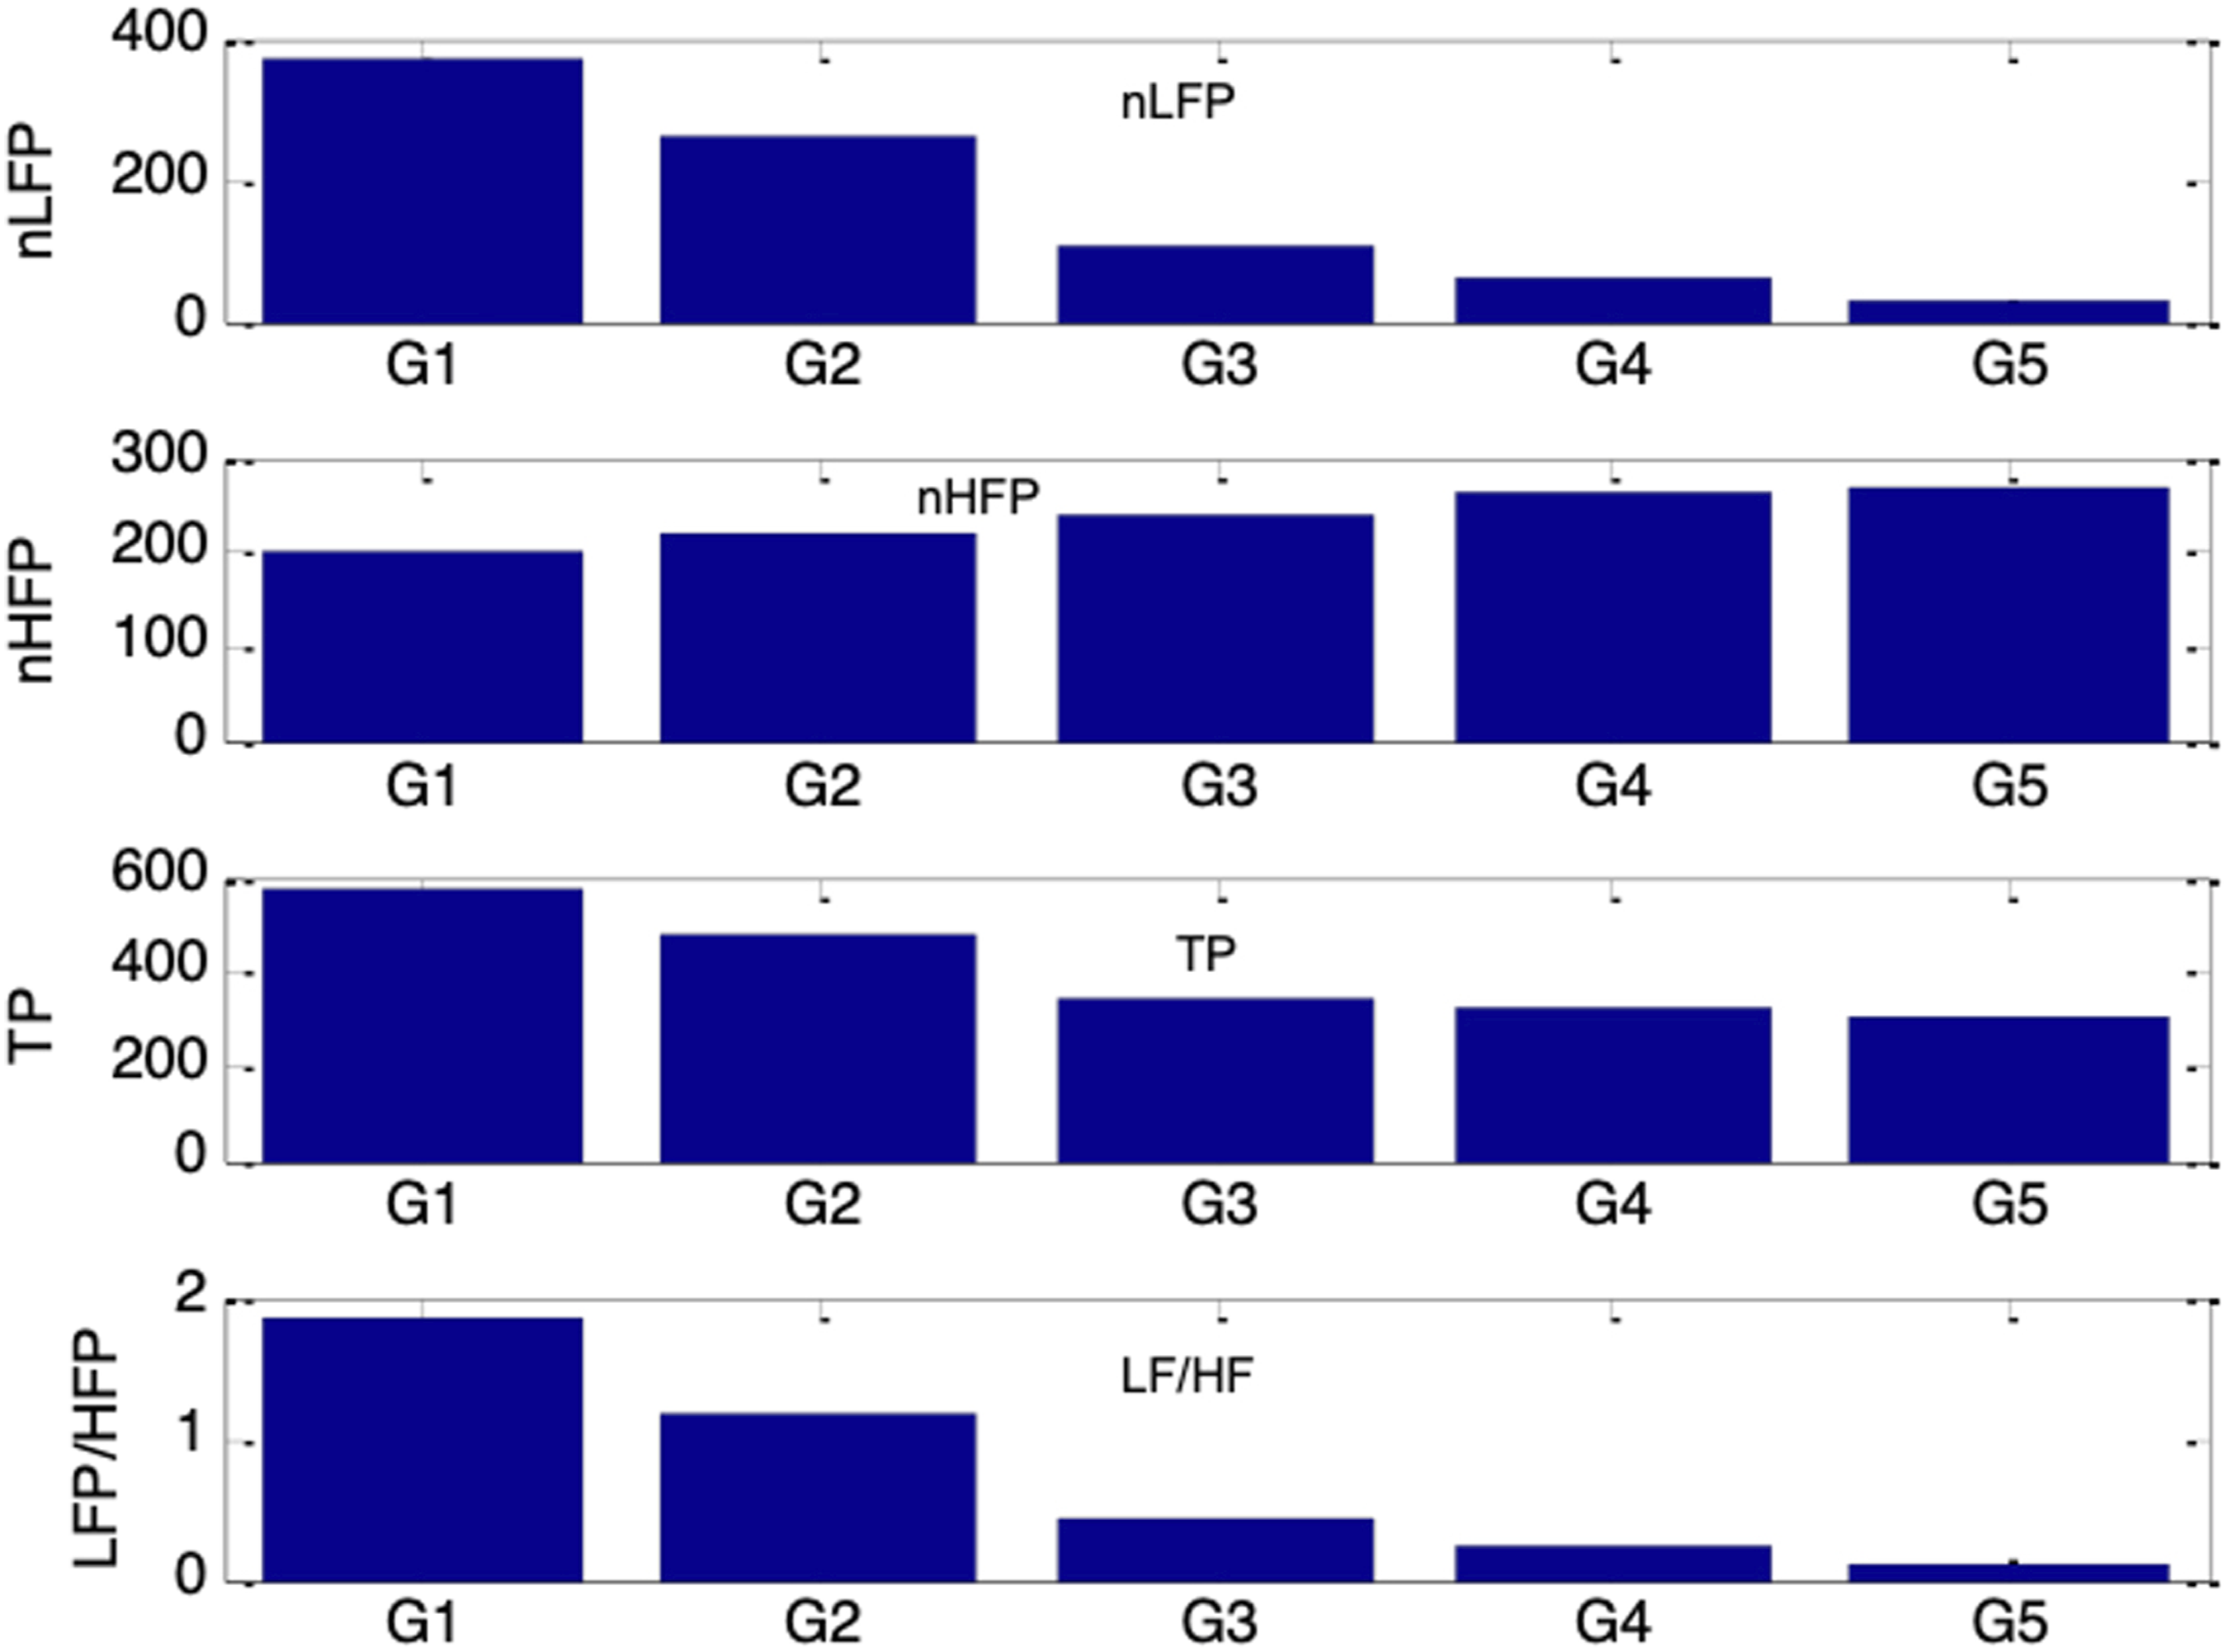
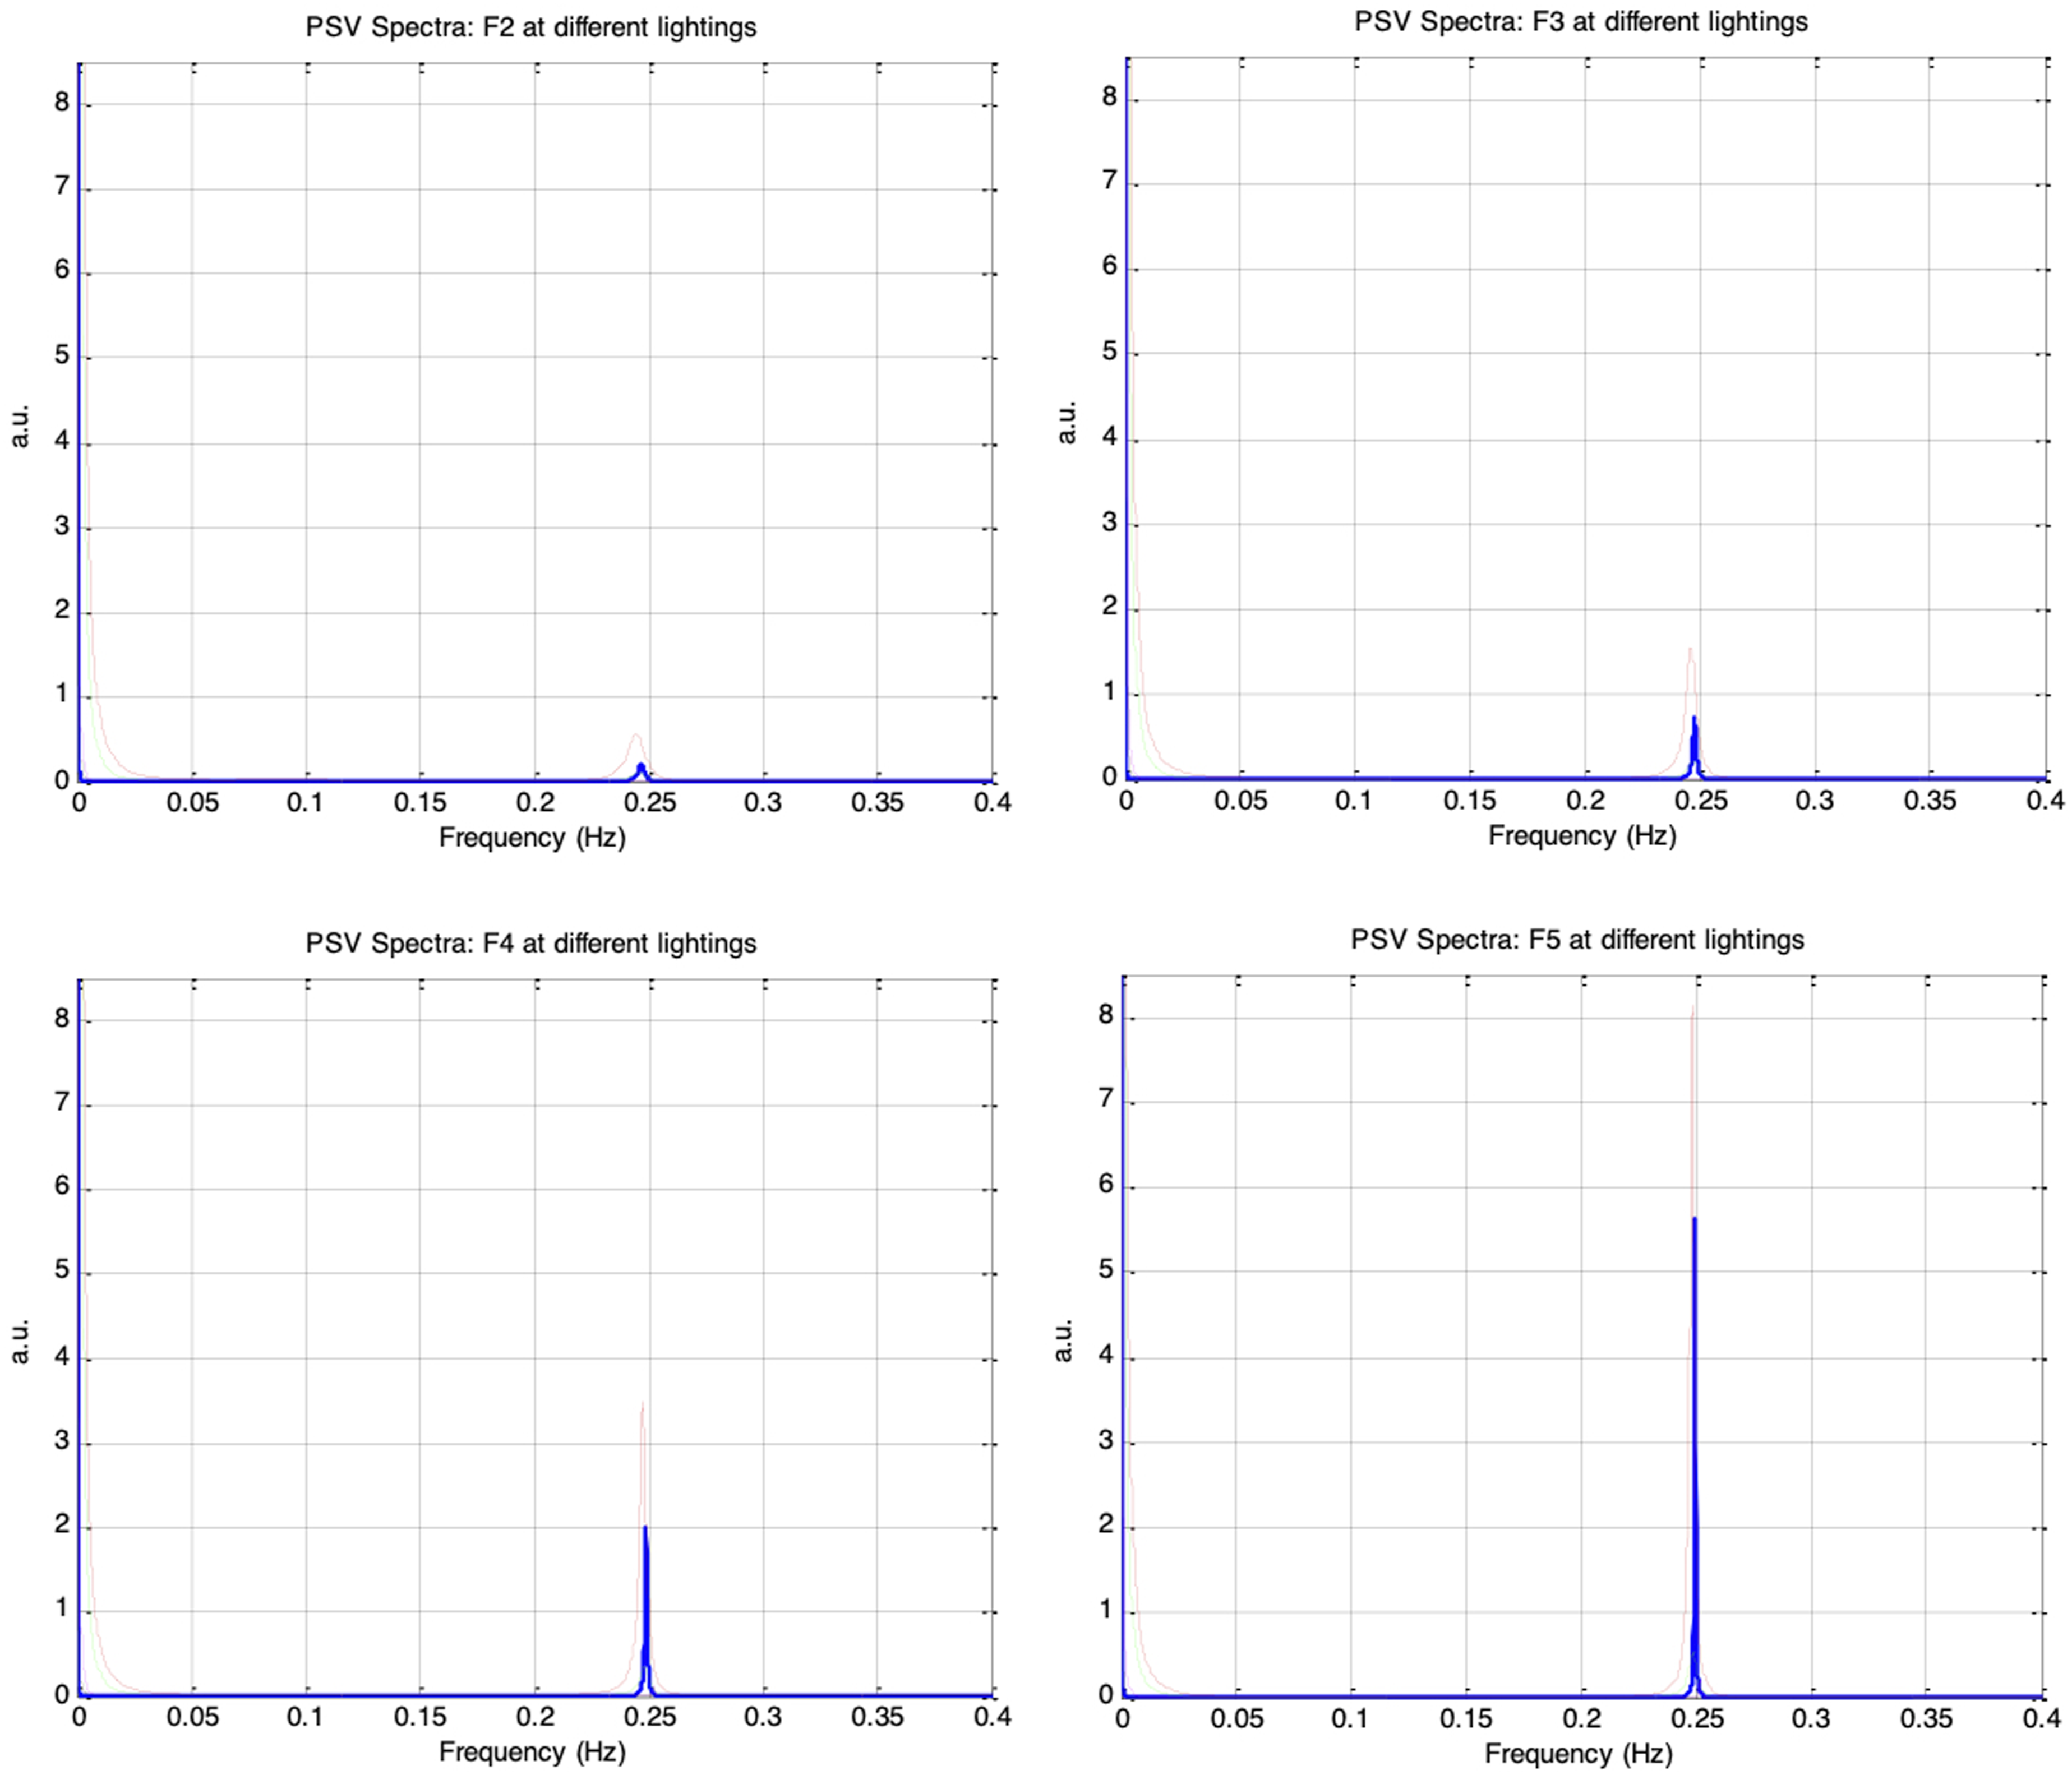
Figure 20 shows the frequency spectra of the simulated PSV signals for autonomic condition F1, with vp(0)= 0.1 and krp = 0.1, under five ambient brightness levels in which es_f_stat was varied from −0.4 to 0.4 in increments of 0.2. Similar to the HRV spectrum, the PSV spectrum exhibited a prominent respiratory component at 0.25Hz and a weaker Mayer wave component at 0.1Hz. Figure 21 presents the PSV spectra for the remaining autonomic conditions, F2 through F5, and different ambient brightness levels. As the respiratory influence increased across these sessions, the 0.25Hz respiratory component in the PSV became progressively stronger, whereas the 0.1Hz Mayer wave component weakened. This trend closely paralleled that observed in the corresponding HRV spectra. Top: frequency spectra of simulated PSV under autonomic condition F1 (vp(0) = 0.1, krp = 0.1) and under five different ambient brightness conditions. Solid-thick (es_f_stat = -0.4), Dotted (es_f_stat = -0.2), Dashed (es_f_stat = 0), Dash-dot (es_f_stat = 0.2), Solid-thin (es_f_stat = 0.4). Bottom: Same frequency spectra magnified Frequency spectra of simulated PSV under different autonomic conditions and five ambient brightness conditions: solid-thick (es_f_stat = -0.4), dotted (es_f_stat = -0.2), dashed (es_f_stat = 0), dash-dot (es_f_stat = 0.2), solid-thin (es_f_stat = 0.4). Top-left: F2 (vp(0) = 0.1, krp = 0.15), Top-right: F3 (vp(0)= 0.1, krp = 0.20), Bottom-left: F4 (vp(0) = 0.1, krp = 0.25), Bottom-right: F5 (vp(0)= 0.1, krp = 0.30)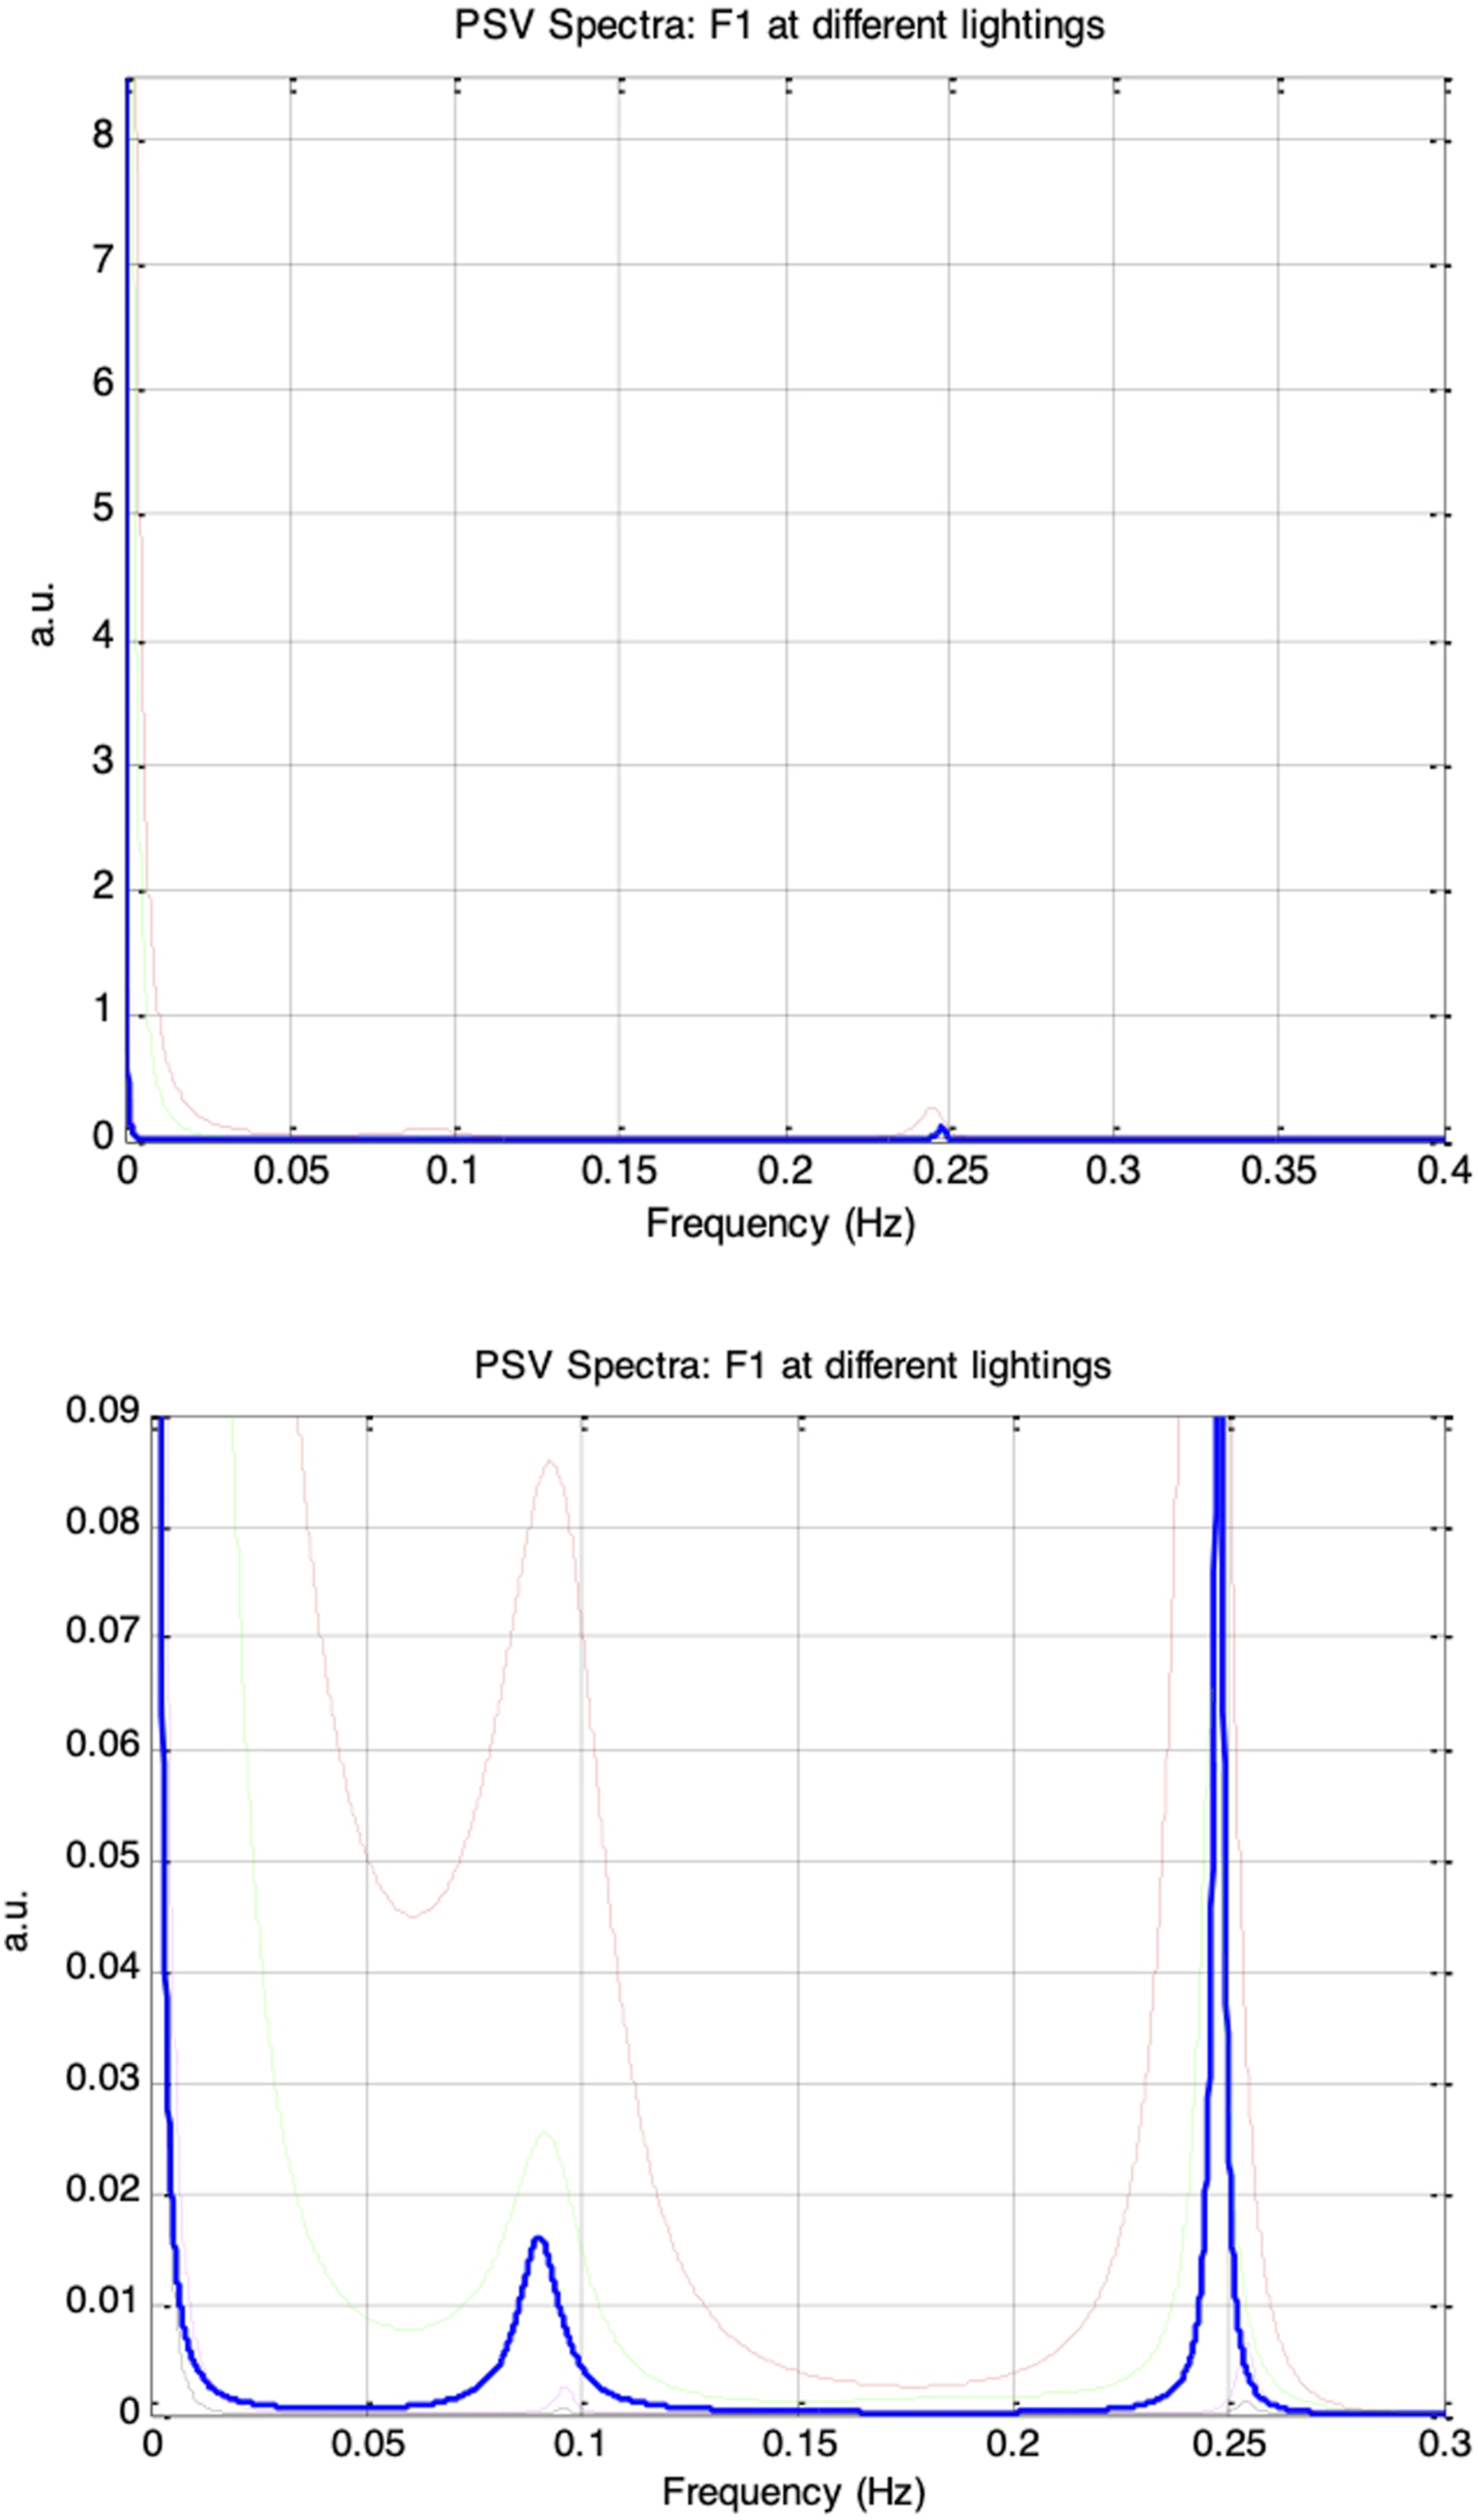
It is interesting to note that even when the autonomic condition remained unchanged, the shape of the PSV spectrum varied with the mean pupil size, which was altered by increasing ambient brightness from es_f_stat = −0.4 (darkest) to es_f_stat = 0.4 (brightest). The spectral power at 0.1Hz and 0.25Hz increased to a maximum as es_f_stat was raised from −0.4 to −0.2; however, as es_f_stat was further increased in steps of 0.2, both components diminished and reached their minimum at es_f_stat = 0.4. This pattern was likely a consequence of the pupil-size RNL effect: the biomechanics of the pupillary plant produce the largest fluctuations at mid-range pupil sizes and the smallest fluctuations when the pupil is at its extreme constriction or dilation. This RNL-driven modulation of the PSV spectra was observed consistently across all sessions from F1 to F5. The simulation results therefore suggest that the PSV spectral indices would be affected by both autonomic activity and ambient brightness.
Figure 22 further illustrates how nLFP, nHFP, TP, and LF/HF of the PSV changed under the different autonomic and ambient brightness conditions. All four PSV indices followed the same trends as their corresponding HRV indices (in Figure 17), but only when the ambient brightness condition (es_f_stat) was held constant. Under a fixed autonomic state, the indices varied systematically with es_f_stat. Specifically, nLFP, TP, and LF/HF increased to a maximum as es_f_stat was raised from −0.4 to −0.2, then decreased to a minimum as es_f_stat was further increased to 0.4, while nHFP exhibited the opposite pattern. These results suggest that the LF/HF ratio of PSV would be a reliable indicator of sympathovagal balance only when the mean pupil size remains unchanged. In the PSV model, mean pupil size is determined by both static autonomic tones and ambient brightness conditions. nLFP, nHFP, TP, and LF/HF for simulated PSV under five different autonomic conditions of increasing respiratory influence (F1 to F5: krp = 0.1, 0.15, 0.2, 0.25, 0.3) and five different ambient brightness conditions. The five bars in each group correspond to es_f_stat = -0.4 (leftmost bar), -0.2, 0, 0.2, 0.4 (rightmost bar)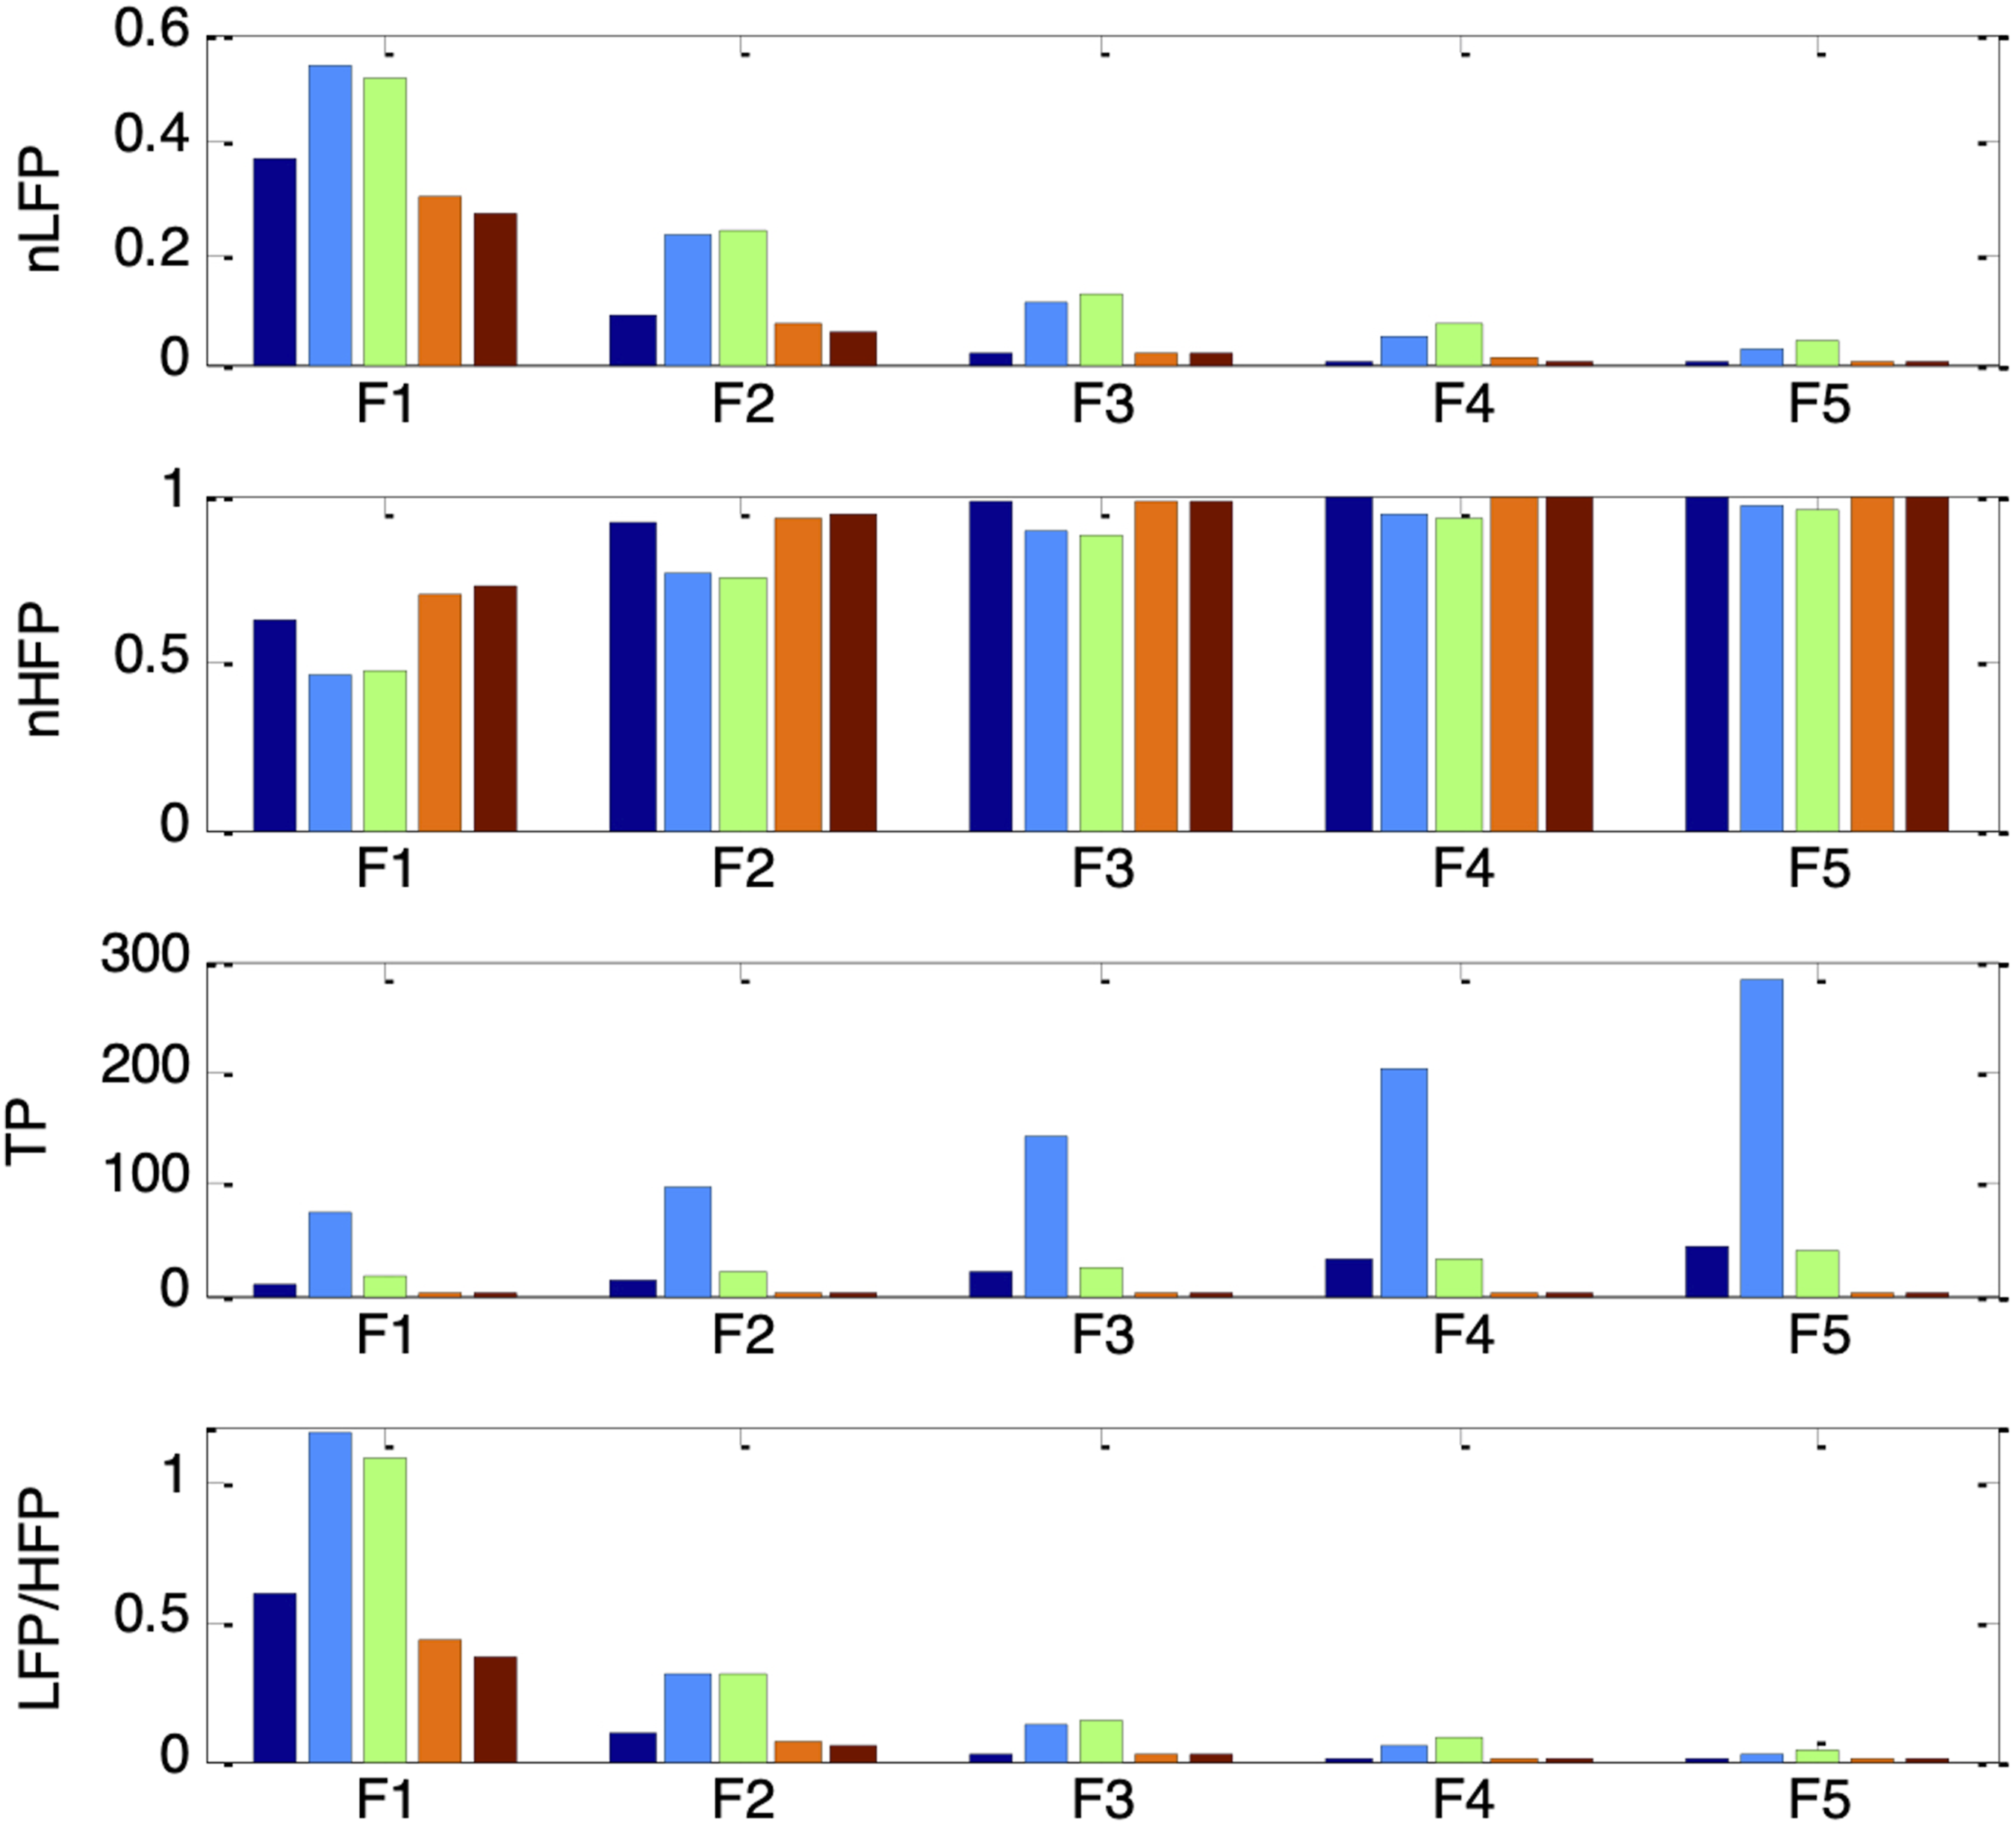
Figure 23 shows the frequency spectra of the simulated PSV signals for autonomic conditions G1 to G5 under the five ambient brightness levels. The PSV spectra contained a prominent respiratory component at 0.25 Hz and a weaker Mayer wave component at 0.1 Hz, similar to the HRV spectra. As parasympathetic activity, vp(0), increased from 0.1 to 0.18, the 0.25Hz respiratory component in the PSV strengthened, while the 0.1Hz Mayer wave component attenuated, consistent with the trend observed in the corresponding HRV spectra. The RNL-induced modulation of the PSV spectra was also evident across sessions G1 to G5: the spectral power at both 0.1Hz and 0.25Hz increased to a maximum as es_f_stat rose from −0.4 to −0.2, then decreased as es_f_stat was further increased, reaching a minimum at es_f_stat = 0.4. Frequency spectra of simulated PSV under different autonomic conditions and five ambient brightness conditions: Solid-thick (es_f_stat = -0.4), Dotted (es_f_stat = -0.2), Dashed (es_f_stat = 0), Dash-dot (es_f_stat = 0.2), Solid-thin (es_f_stat = 0.4). Top-left: G2 (vp(0) = 0.12, krp = 0.10), Top-right: G3 (vp(0) = 0.14, krp = 0.10), Bottom-left: G4 (vp(0) = 0.16, krp = 0.10), Bottom-right: G5 (vp(0) = 0.18, krp = 0.10)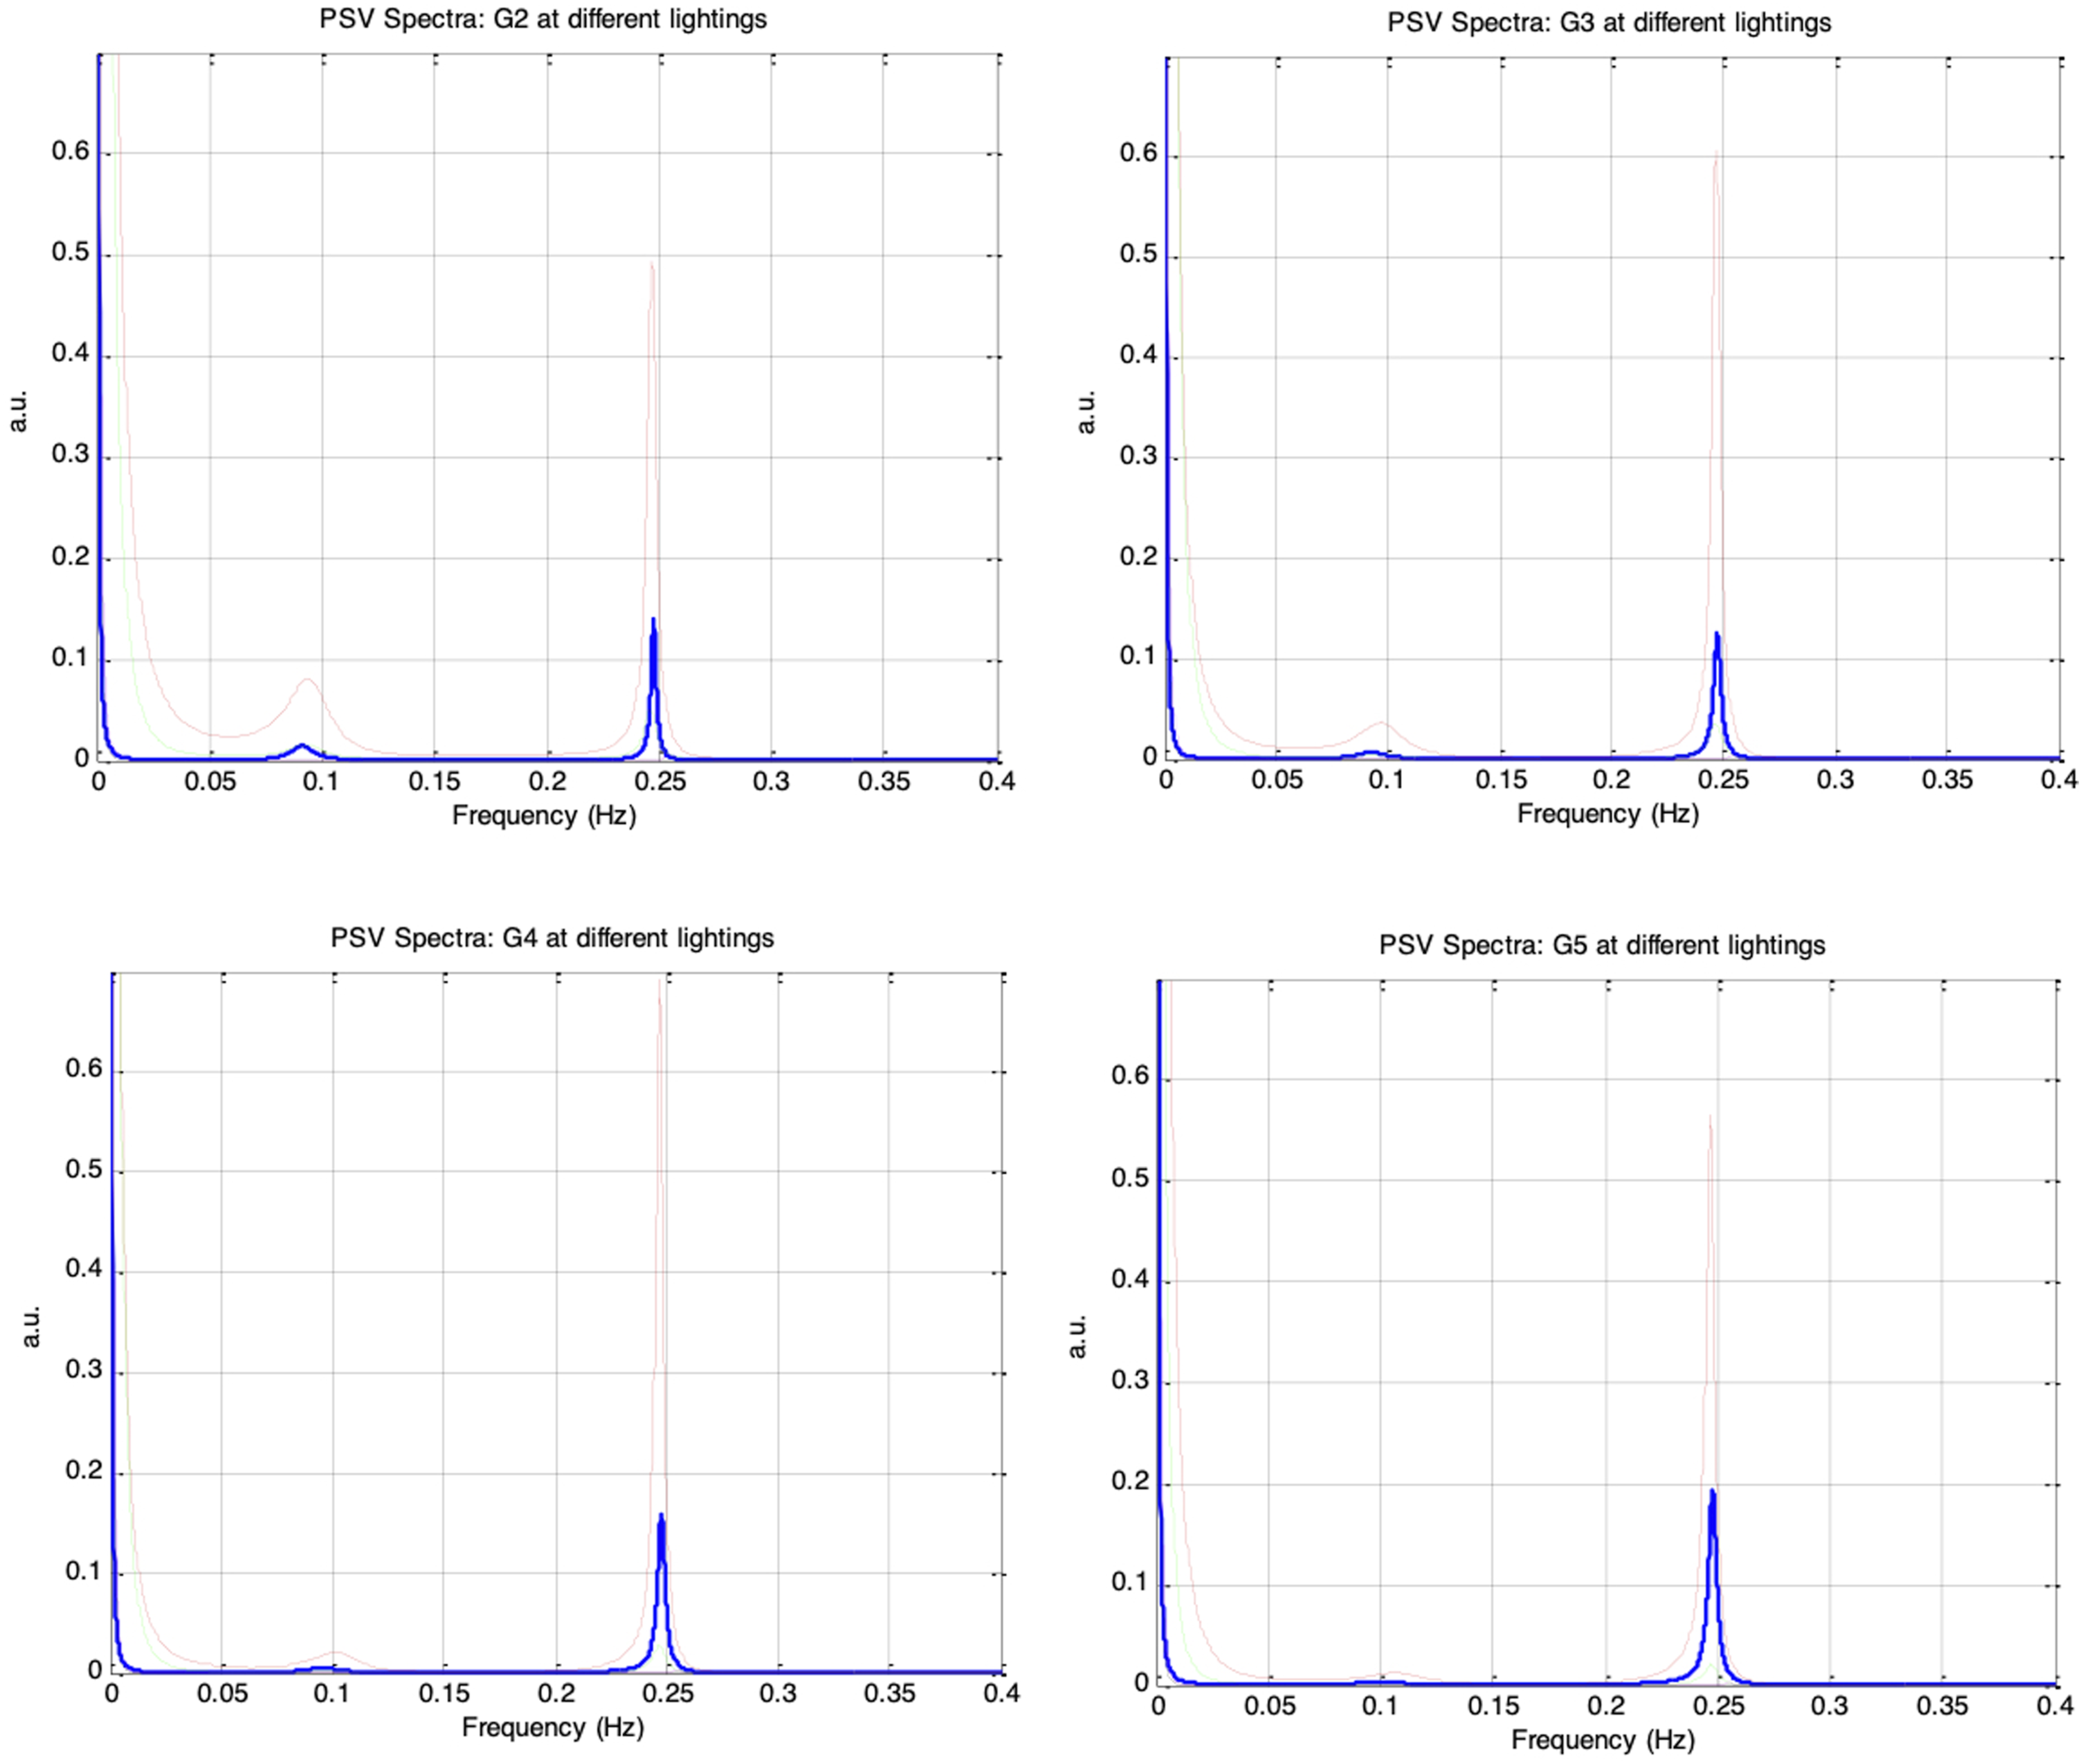
Figure 24 shows that all four PSV spectral indices followed the same trends as their corresponding HRV indices (in Figure 19) when es_f_stat was held constant. Under a fixed autonomic condition, nLFP, TP, and LF/HF increased to a maximum as es_f_stat was raised from −0.4 to −0.2, then decreased to a minimum as es_f_stat was further increased to 0.4, while nHFP exhibited the opposite pattern. The results from sessions G1 to G5 therefore reinforce that the PSV LF/HF ratio can serve as a reliable indicator of sympathovagal balance only when the mean pupil size remains fixed. nLFP, nHFP, TP, and LF/HF for simulated PSV under five different autonomic conditions of increasing respiratory influence (G1 to G5: vp(0) = 0.1, 0.12, 0.14, 0.16, 0.18) and five different ambient brightness conditions. The five bars in each group correspond to es_f_stat = -0.4 (leftmost bar), -0.2, 0, 0.2, 0.4 (rightmost bar)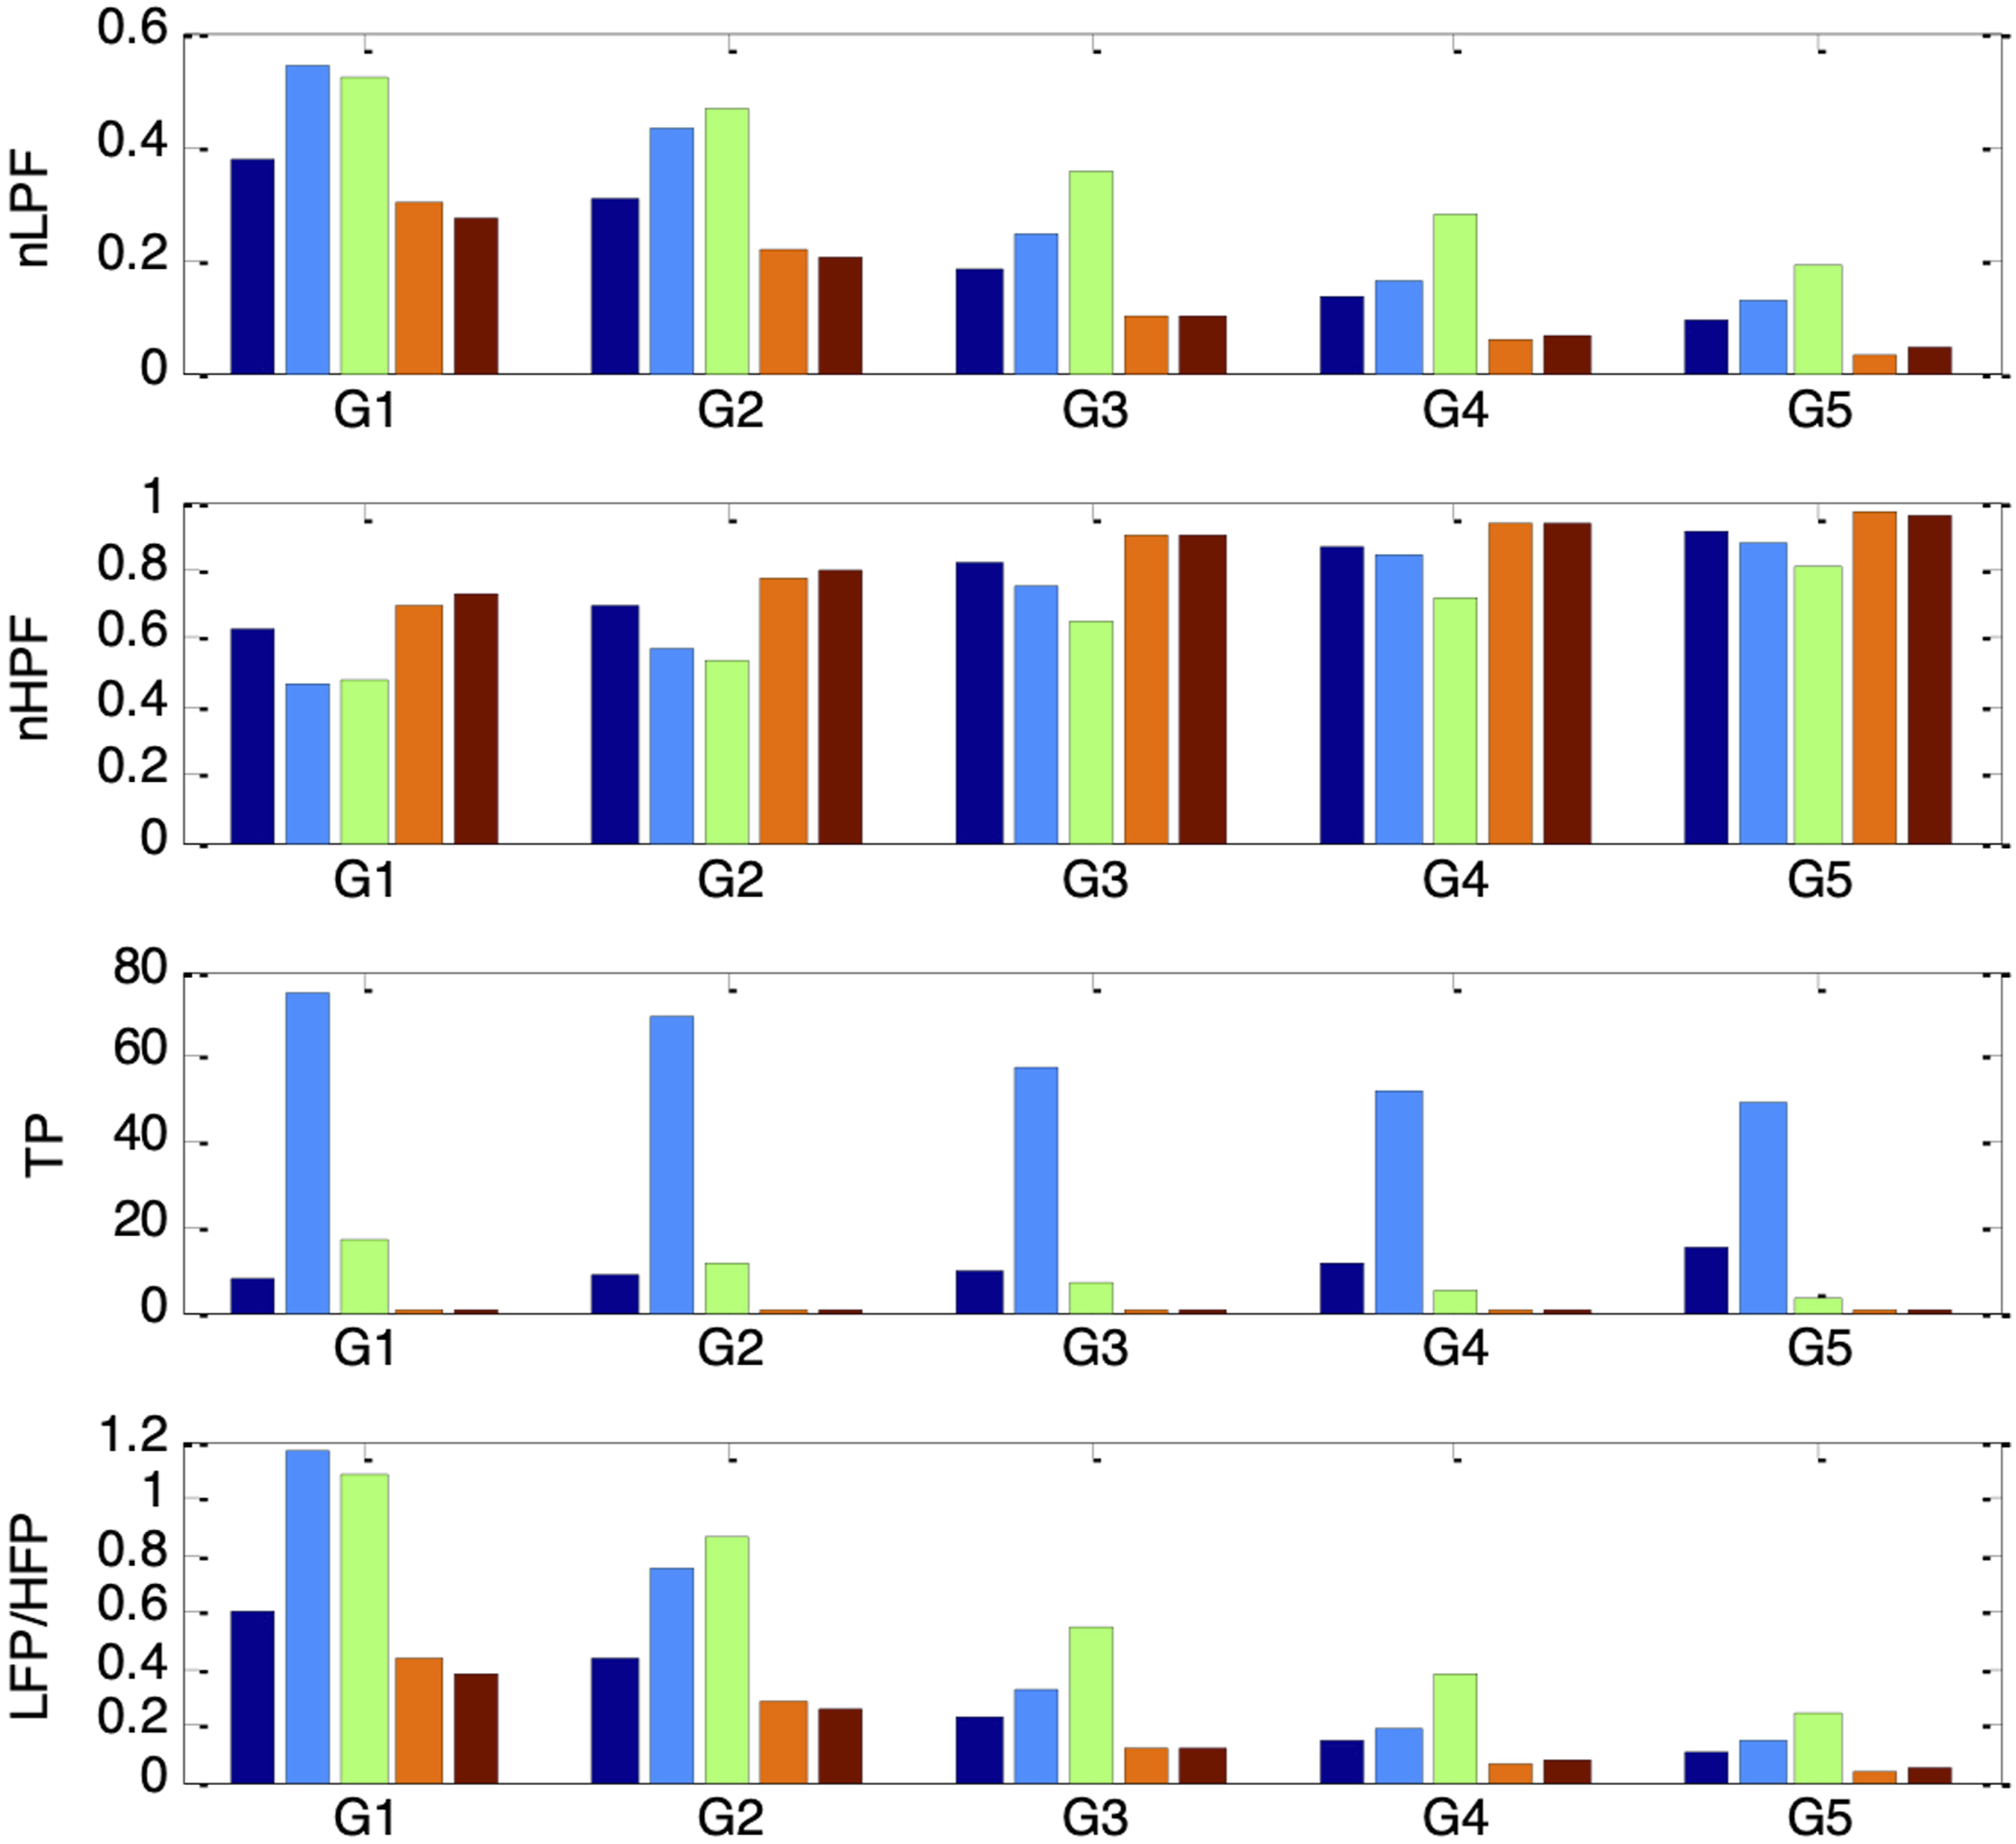
Frequency Response of the Pupillary Muscle Plant
With the autonomic condition fixed and ambient brightness varied, the patterns observed in nLFP, nHFP, TP, and LF/HF suggested that the RNL characteristics of the pupillary plant may introduce a frequency-dependent filtering effect on PSV. A plausible explanation is that when the pupil is near its minimum or maximum size, biomechanical constraints restrict PSV amplitude, resulting in relatively less attenuation of higher-frequency components than of lower-frequency components compared with mid-range pupil sizes. To investigate this filtering mechanism within our model, the input-dependent signals gs(t) and gd(t) were replaced with sinusoidal test inputs of amplitude 0.2 and frequencies spanning 0.04-0.25 Hz in 0.01Hz steps. To establish different mean pupil sizes, DC offsets were added to these test inputs: gs_stat was varied from −0.4 to 0.4 in increments of 0.1, and gd_stat was determined according to full reciprocal relationship. This procedure is analogous to determining the frequency response of the pupillary plant under different scenarios of ambient brightness conditions.
Figure 25 shows the frequency-response plots of the simulated PSV peak-to-peak amplitudes for gd_stat values of −0.4, −0.3, −0.2, −0.1, 0, 0.1, 0.2, 0.3, and 0.4, corresponding to mean pupil sizes ranging from largest (darkest ambient condition) to smallest (brightest ambient condition). Although all traces displayed frequency-filtering characteristics, direct comparison was difficult because each began with a different magnitude at 0.04Hz. To enable clearer comparison, each frequency-response curve was normalized to its own magnitude at 0.04Hz and re-plotted, as shown in Figure 26. Peak-to-peak amplitudes of simulated PSV when gs(t) and gd(t) were sinusoidal testing signals of frequency ranging from 0.04Hz to 0.25Hz. Left (top to bottom): gd_stat = -0.4 (solid), -0.3 (dashed), -0.2 (dotted), -0.1 (dash-dotted), 0 (thick). Right (top to bottom): gd_stat = 0.1 (solid), 0.2 (dashed), 0.3 (dotted), 0.4 (dash-dotted) Peak-to-peak amplitudes of simulated PSV when gs(t) and gd(t) were sinusoidal testing signals of frequency ranging from 0.04Hz to 0.25Hz. All values are plotted relative to the peak-to-peak value at 0.04Hz. Left (top to bottom): gd_stat = -0.4 (solid), -0.3 (dashed), - 0.2 (dotted), -0.1 (dash-dotted), 0 (thick). Left: gd_stat = 0.1 (solid), 0.2 (dashed), 0.3 (dotted), 0.4 (dash-dotted)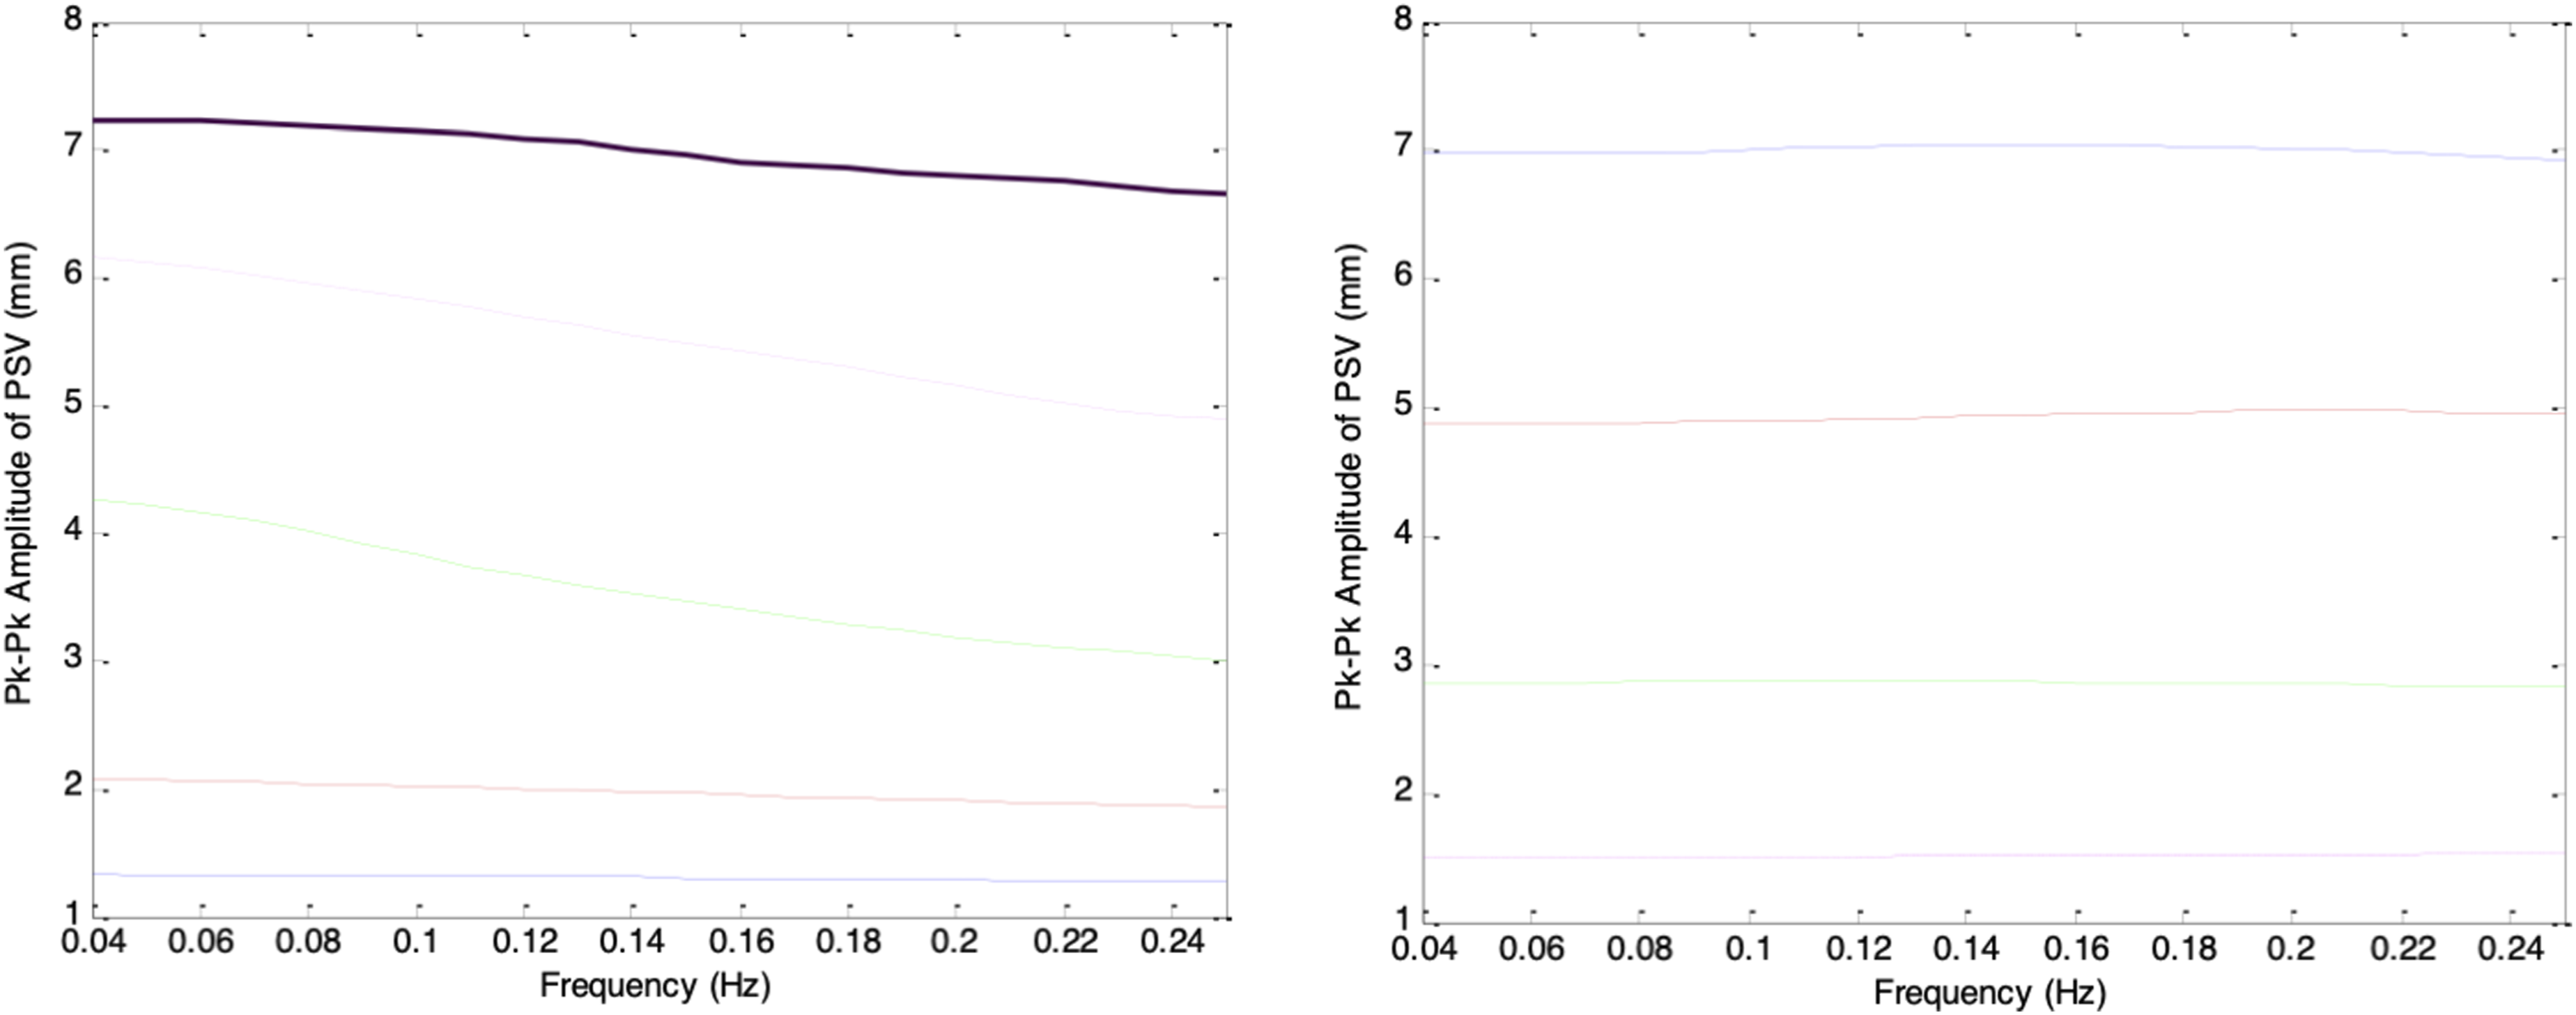
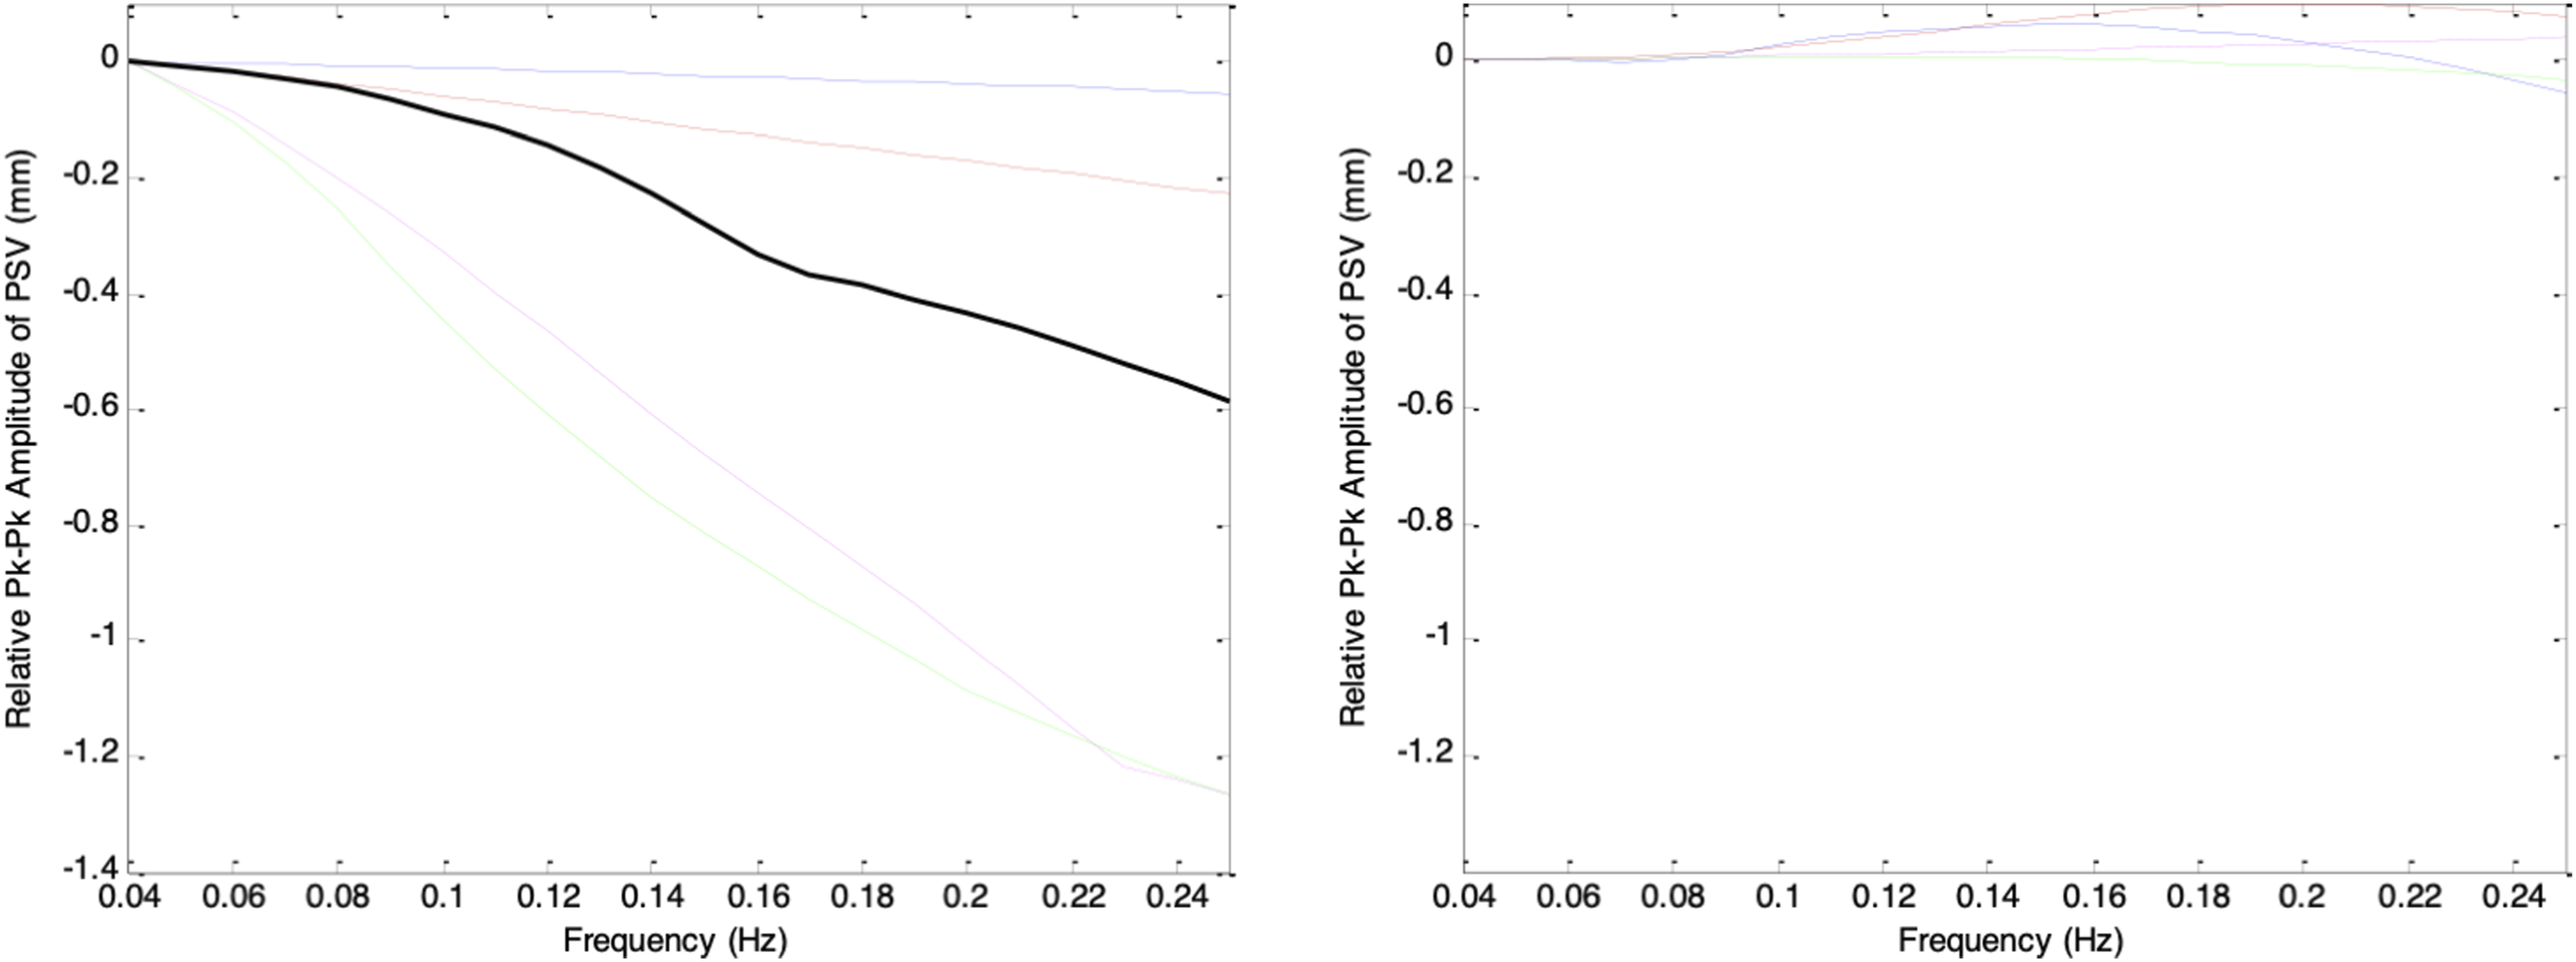
In Figure 26, the frequency-response curves show that for pupil sizes ranging from largest to mid-range (corresponding to darkest to moderate ambient brightness), the PSV peak-to-peak amplitude decreases as frequency increases, demonstrating a clear low-pass filtering behavior. The slope of each curve depends strongly on the mean pupil size: as gd_stat increases from −0.4 to −0.2, the rate of frequency roll-off becomes progressively steeper, with the steepest slope occurring at gd_stat = −0.2. Beyond this point, the roll-off becomes more gradual as gd_stat increases toward 0.1. From a filter design perspective, the pupillary plant behaves as a low-pass filter whose cutoff frequency is highest when the pupil is at its extremes and lowest when the pupil is in the mid-range. Notably, for the smallest pupil sizes (brightest ambient condition), this low-pass behavior largely disappears.
The abovementioned filtering characteristics of the pupillary muscle plant align with the ambient brightness-dependent patterns previously observed in nLFP, nHFP, TP, and LF/HF. Mid-range pupil sizes produced the highest nLFP and lowest nHFP because the lower cutoff frequency led to stronger attenuation of higher-frequency components. Conversely, pupil sizes at the extremes resulted in the lowest nLFP and highest nHFP, reflecting weaker attenuation of higher-frequency components due to the higher cutoff frequency.
Discussions
This paper presents the first computational model that explicitly couples cardiovascular autonomic regulation with a biomechanical pupillary plant to explain PSV, cardiovascular variability, and autonomic regulation. The model incorporates established neural pathways linking the cardiovascular system to a biomechanical pupillary muscle plant model. This overall framework successfully reproduced key empirical phenomena, and has clarified several unresolved issues regarding the origin and interpretation of PSV. The model accurately simulated the coupling between respiration, baroreflex dynamics, and pupillary dynamics. PSV amplitude increased during inspiration and decreased during expiration with a latency, consistent with findings from previous animal and human studies. The proportional increase in PSV amplitude with stronger respiratory influence reproduced the relationship between phrenic discharge and pupil oscillations reported previously. The model also reproduced the expected parasympathetic effects on pupil size and cardiovascular system. A key finding is the mechanistic explanation for the classical RNL phenomenon. While prior models attributed RNL to random Gaussian noise, our simulations across multiple ambient brightness conditions demonstrated that RNL emerges naturally from the nonlinear biomechanical properties of the iris muscles. The model reproduced the characteristic pattern where PSV amplitude is smallest at extreme pupil sizes and largest at mid-range. This behavior was observed consistently in both the time domain (PSV amplitude) and the frequency domain (LF/HF components), reinforcing the idea that RNL is a biomechanical property rather than a random artifact.
The frequency-domain results further revealed that PSV spectral indices, namely nLFP, nHFP, TP, and LF/HF, depend jointly on autonomic inputs and mean pupil size. When ambient brightness was held constant, PSV indices closely followed the trends of HRV indices under both respiratory and parasympathetic modulations. However, when pupil size changed due to ambient brightness levels, these indices shifted, even when the autonomic state was unchanged. This observation aligns with the RNL behavior and underscores the need to consider ambient brightness or mean pupil size when interpreting PSV-based autonomic metrics. The frequency-response experiments performed on the pupillary plant showed that the pupillary plant behaves as a low-pass filter with a cutoff frequency that depends on mean pupil size: attenuation of higher-frequency components is strongest at mid-range sizes and weakest at the extremes. This filtering profile matched the patterns observed in the PSV spectra and their indices, confirming that biomechanical filtering within the pupillary muscle plant is a primary determinant of the frequency characteristics of PSV.
Limitations
This study is entirely simulation-based. Our proposed model provides a theoretical framework for understanding the origins of PSV, rather than direct empirical validation. While the model successfully reproduces features comparable to established HRV and BPV dynamics, further experimental work involving concurrent in vivo measurements of PSV, HRV, and BPV is required to validate our findings against clinical data. Several limitations of our model should be acknowledged. First, there is lack of direct experimental validation using concurrent physiological recordings. Second, the model utilizes idealized neural pathways that simplify the highly complex subcortical interactions governing autonomic control. In real physiology, sympathetic drive and neural noise are significant contributors to PSV, particularly in the LF band. Our current model treats these sympathetic influences primarily as reciprocal to parasympathetic inputs; future iterations should incorporate independent sympathetic noise and drive to fully capture LF dynamics. Third, the simulations do not account for measurement noise or artifacts, such as blinks and saccades, which are prevalent in real-world situations. Finally, our current model focuses strictly on autonomic cardiovascular coupling and does not yet account for higher-level cortical influences such as cognitive or emotional load.
There is growing evidence that pupillary dynamics are highly influenced by cortical activity. 29 For instance, recent clinical hypotheses highlight the role of the locus coeruleus (LC) in higher-level neural control of pupil dynamics. Dysregulation of descending cortical inputs to the LC can alter sympathetic outflow and the inhibition of the EW nucleus, leading to abnormal pupillary responses in conditions such as ischemic brain injury. 30 Cortical lesions may also induce changes in pupillary reflex dynamics. 31 These top-down are major factors in real-world PSV that extends beyond the cardiovascular-pupillary coupling modeled in this study.
PSV-Based Autonomic Monitoring
Designing a compensation technique for the low-pass filtering effect of the pupillary plant is technically challenging due to several physiological and computational complexities. The frequency response of the pupillary plant is highly nonlinear because of the iris muscles’ biomechanical properties, and its cutoff frequency varies continuously with mean pupil size, which depends on both ambient brightness and autonomic tone. As a result, the same physiological input may be attenuated differently under different lighting or autonomic conditions, making static linear compensation ineffective. The filtering effect is also asymmetric across frequencies, particularly between 0.1Hz and 0.25Hz, where Mayer waves and respiratory oscillations occur. Attenuation changes disproportionately across these bands, violating the assumptions needed for classical inverse filtering and causing inverse approaches to amplify noise or become unstable. In addition, any compensation method must handle biological variability, including inter-subject differences in iris stiffness, nonlinear sphincter–dilator interactions, and individual luminance adaptation. A robust solution therefore requires adaptive, model-based, or machine-learning-assisted methods that can estimate current pupil biomechanics and adjust the compensation dynamically.
Despite these challenges, our simulation results indicate that PSV-based autonomic monitoring is still feasible when measurements are taken under dark or moderately bright conditions, corresponding to larger or mid-range pupil sizes. In these regimes, the pupillary plant exhibits weaker or more predictable low-pass filtering, allowing respiratory and baroreflex-related components of PSV to remain largely intact. This suggests that reliable autonomic indices can be extracted from PSV in practice when monitoring durations are sufficiently long and lighting conditions are properly standardized.
Conclusion
This study introduced a novel, physiologically grounded computational model that integrates cardiovascular regulation, autonomic control, and pupillary biomechanics to simulate PSV and its interaction with HRV. The model reproduces major empirically observed phenomena, including respiration-linked oscillations, baroreflex effects, parasympathetic modulation, and the RNL characteristic, supporting the concept that PSV arises from autonomic inputs transmitted through the NTS–PBN–EW–CG pathway and shaped by intrinsic iris biomechanics. A key contribution of this work is providing mechanistic evidence that the pupillary plant behaves as a pupil-size-dependent low-pass filter whose cutoff frequency shifts with ambient brightness. This biomechanical filtering explains why PSV spectral indices depend not only on autonomic activity but also on mean pupil size. Consequently, PSV-derived metrics such as LF, HF, and LF/HF can be meaningful indicators of autonomic balance only when pupil-size effects are controlled. By providing a unified and physiologically consistent framework, this model lays important groundwork for using PSV as a biomarker in eye-based wearable systems.
Footnotes
Author Contributions
Kevin Hung contributed to project management and funding resources, research design, model design, model implementation, data analysis, and manuscript writing. Gary M.-T. Man contributed to data analysis and manuscript writing. Daniel H.-K. Chow reviewed and edited the manuscript and provided valuable guidance for the interpretation and discussion of the findings.
Funding
The authors disclosed receipt of the following financial support for the research, authorship, and/or publication of this article: This work was fully supported by the Research Grants Council of the Hong Kong Special Administrative Region, China, under Grant UGC/FDS16/E15/21.
Declaration of Conflicting Interests
The authors declared no potential conflicts of interest with respect to the research, authorship, and/or publication of this article.