
Abstract
Traditional ray tracing software tools (e.g. Odeon, CATT-Acoustic, EASE) enable detailed analysis of stage acoustics; however, they are typically undertaken in later design stages and lack the flexibility required for early design development. This paper, which follows from a poster presentation at ISRA 2019, investigates the use of a three-dimensional modelling platform (Rhinoceros/Grasshopper) to quickly assess the influence of architectural changes on reflections that support orchestral ensemble. This approach enables immediate feedback, a more creative design process and better integration of architecture and acoustics. Early reflections have been found to be vital for effective orchestral ensemble. Therefore, the study focused on the investigation of early energy distribution on stage with ray tracing analysis using a parametric tool. This tool also considers cross-stage shielding effects from the orchestra and the directivity of instruments. The results of the tool have been compared to an existing acoustic modelling software to determine its accuracy and reliability. Additionally, the expansion of the tool with an evolutionary solver has also been explored. The development of a Rhinoceros/Grasshopper design tool has been found to be beneficial in the analysis of stage conditions and enhances the design collaboration during early design phases.
Introduction
Auditorium stage design requires careful balancing of many stakeholders. An iterative design approach is often adopted by the architect and acoustician to optimise the stage design, in particular for venues with challenging stage environments. The most successful iterations occur in the early design phase while the design has scope to change.
Detailed analysis of stage acoustics is typically undertaken in later design stages with well-established ray tracing software tools (e.g. Odeon, CATT-Acoustic, EASE). This analysis is often delayed until detailed design due to the time invested in creating the acoustic model.
The use of parametric tools, such as Grasshopper and Rhinoceros, to aid the design of concert venues is well-established.1,2 However, while these studies, and many more, explore the application of parametric design for optimisation of the hall from the audience perspective, much less work has been done on utilising parametric design for acoustic stage design.
This paper follows on from a poster presentation at ISRA 2019. 3 In this original paper, the authors reviewed how a Grasshopper ray tracing tool could enable a dialog between architectural and acoustic design to further support orchestral ensemble.
This Building Acoustic Journal paper continues from the ISRA 2019 research and introduces the integration of an Evolutionary Solver, Galapagos, into the tool.
Previous and ongoing research on early energy on stage
Investigations and ongoing research of musician’s preference on stage agree that early sound energy between musicians, between 10 ms and 40 ms and particularly frequencies between 500 Hz and 2 kHz, are essential for an effective orchestral ensemble. 4
Many different approaches have been proposed to quantify orchestral ensemble. Stage support measurements (STearly and STlate) proposed by Gade 5 are commonly used and form part of ISO 3382-1:2009. 6 Other parameters have been proposed to assess the cross-stage communication, such as the strength parameters Gearly and G7-50 by Dammerud 7 or the stage acoustic parameter for music conductors (LQ7-40) by Van Den Braak and Van Luxemburg. 8
Most recent research focuses on the arrival direction of early reflections across the stage. LQ7-40 top/sides by Guthrie 9 and TS20-50 by Panton et al. 10 are two examples that compare the sound energy received from above compared to the sides.
All these techniques focus on the early energy to quantify the stage acoustic conditions and ease of ensemble.
Real-time raytracing for assessing early energy on stage
Any modelling technique represents a simplification of real acoustic behaviour. As such, the appropriateness of a technique is largely dependent on the intended use. At frequencies between 500 Hz and 2 kHz, vital for an effective orchestral ensemble, 4 sound can be treated as rays. As such, ray tracing is widely accepted as a viable methodology for quantifying ensemble.
The ray-tracing tool developed by the authors generates in ‘real-time’ (or close to real-time) visual feedback of the early reflections between the source and receiver, alongside the energy of early reflections and an estimation of stage acoustic parameters. The tool quickly quantifies the effects of architectural changes on early energy to discuss with the client or architect. Additionally, the acoustic effects of the source directivity and shielding for occupied stages can be evaluated.
The following sections provide a description of the tool’s platform and outputs. 3
The platform
Nowadays, 3D software (such as Rhinoceros) is often used in architectural concept design. Grasshopper is a visual scripting programme within this Rhinoceros platform. The tool has been developed in Grasshopper for designing models through the expression of parameters.
As the tool is integrated within Rhinoceros, it allows ‘real-time’ manipulation of the architectural geometry. The acoustic plugin, Pachyderm, is also used to import the model geometry and undertake image source calculations.
Visual communication of the early energy
The tool visually displays the reflections of sound through a 3D plot at the receiver’s location (represented with thick spikes), and thin lines tracing the sound paths back to the source (Figure 1).
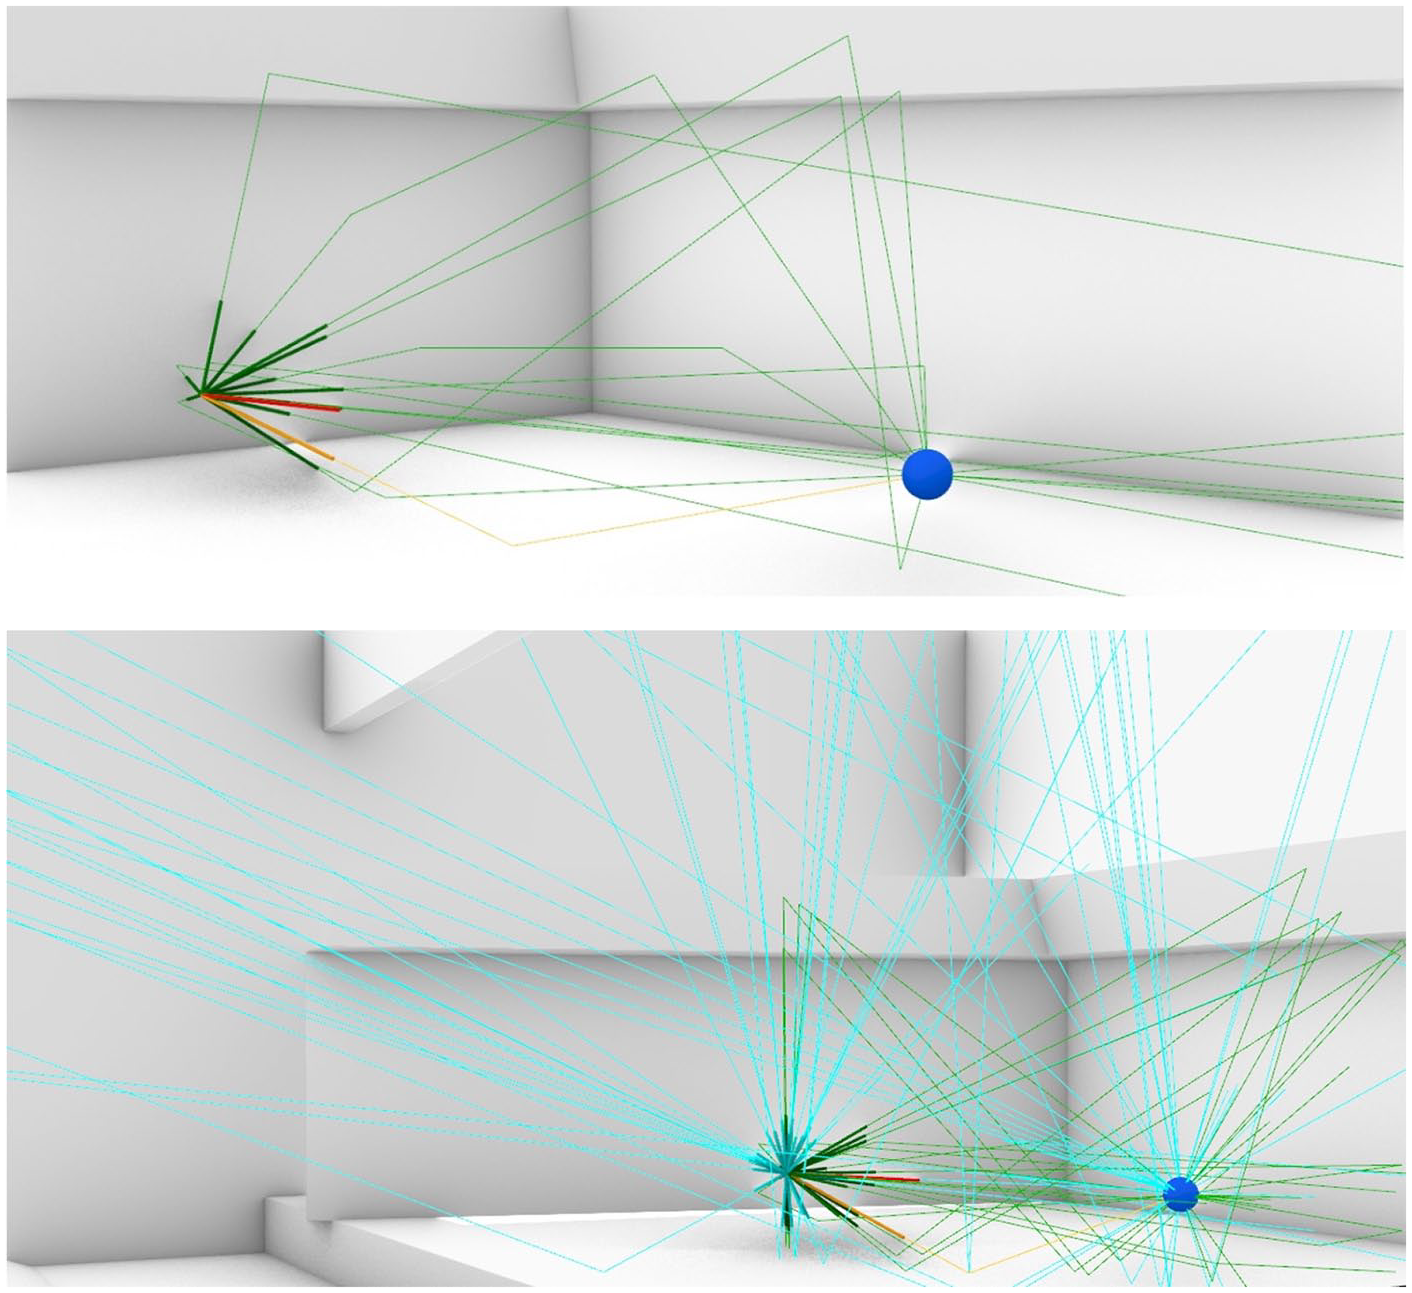
Image source reflections between source (blue sphere) and receiver (combination of thick spikes).
Similar to Marshall Day Acoustic’s IRIS room acoustics measurement software, the 3D plot shows the strength of the sound through the length of the spike (Figure 1). These spikes communicate the dominant reflections (compared to the direct level) and can be used to visually interrogate the strength, direction and delay of reflections.
Both the spikes and lines are coloured to represent the arrival time of the reflection, relative to the direct sound: where red is the direct path, orange is ‘very early’ energy (usually the floor bounce (0–7 ms)), green is early energy (7 and 40 ms), and blue is late energy (after 40 ms). The time intervals given are typical examples but can be altered to calculate the chosen performance criteria.
The thin lines allow for reflections to be traced to the cause architectural geometry. Tracing reflections can be useful for diagnosing successful surfaces that should be promoted throughout the design, or problematic surfaces that require treatment.
Communicating numerically
The developed tool 3 also calculates the energy of early reflections within the stage, to a maximum of third order reflections. Third order reflections are typically considered to be sufficient to calculate reflections within 100 ms. As such, the early energy component of traditional stage acoustic parameters can be calculated with this tool. This includes the stage acoustic parameters, such as STearly, EEL, Gearly, G7-50,5,7 that do not consider the late energy. Stage acoustic parameters that compare the early energy received with the total or late energy cannot be immediately calculated without lengthening the computation time and reducing the effectiveness of the desired quick feedback.
Case studies of the effects of architectural changes of the stage environment
Two case studies have been investigated in this study. The first case study discusses the visual use of the tool for a typical early design element: stage reflectors. As a further development to the tool, the use of an evolutionary solver for the optimisation of the design is explored.
The second case study discusses a more detailed review of the use of the tool for ensemble assessments. This includes visual and numerical analysis, for an orchestra shell and stage risers, as well as visualising the effects of orchestra shielding and directivity.
Visual assessment and optimisation of stage reflectors
The tool can be used to design stage environments in the early design phases. In a concept design workshop, the architect and acoustician often use a 3D model to test possible design directions. As such, it is powerful to have a tool that provides immediate acoustic feedback to these changes.
An example of typical early design development are stage reflectors. Altering the location, size or angle can be easily done within Rhinoceros/Grasshopper. The tool then immediately visualises the sound reflections so that the impact of the change can be easily understood. In contrast, a more detailed modelling tool could be used, however, time would be taken in converting the model and the immediacy and momentum of the workshop would be lost.
Visualisation of early energy on stage
Figures 2 and 3 show two possible examples of stage reflectors. Early sound reflections have been extended as thin lines to easily trace and communicate the sound energy.
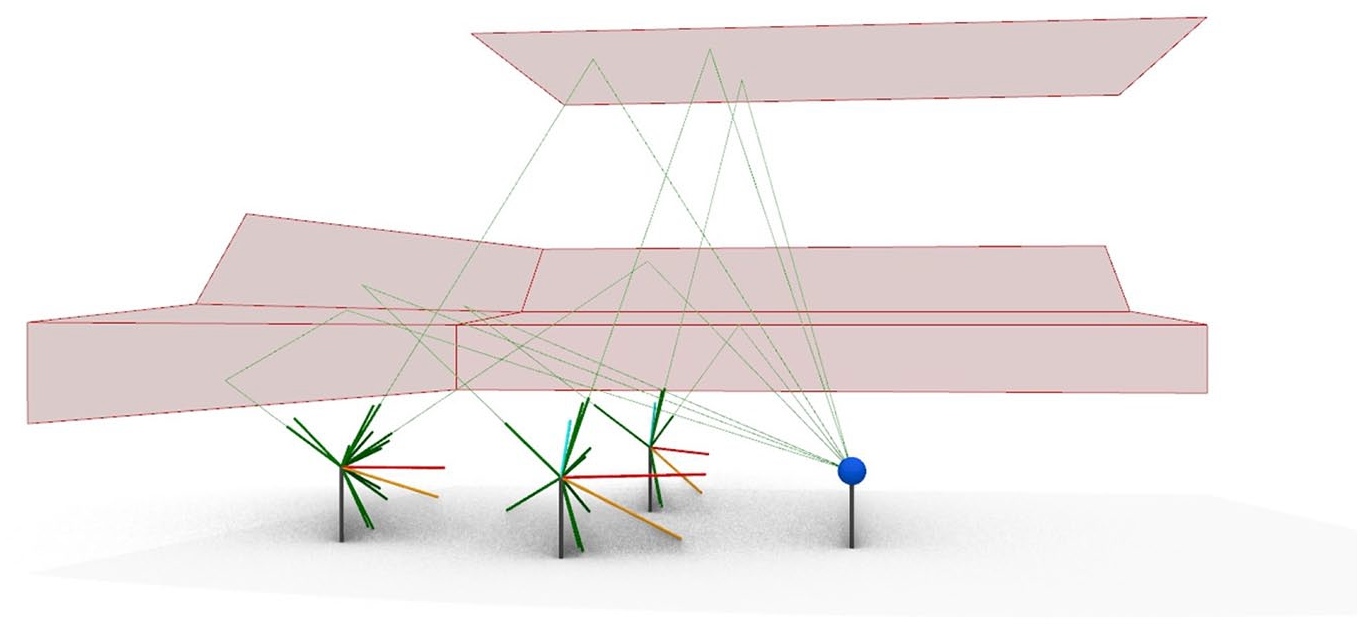
Example of early reflections from overhead stage reflector and balcony fronts.
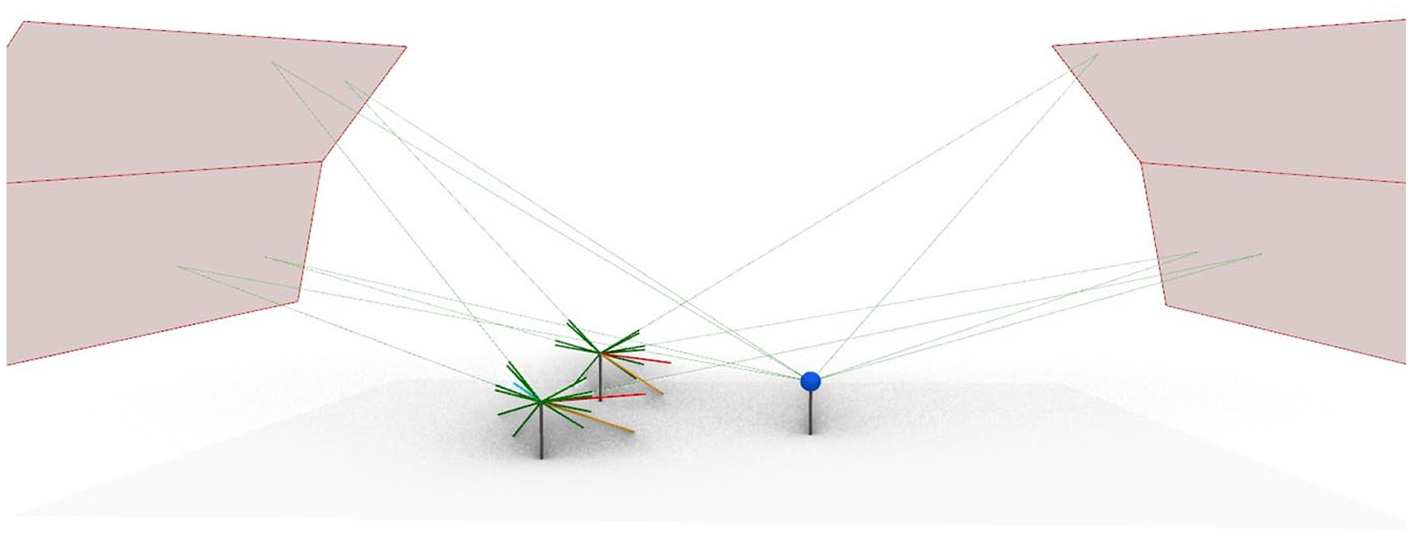
Example of early reflections from side reflectors.
In Figure 2 the three 3D plots show early energy (green spikes and lines) from the overhead stage reflector as well as either the angled balcony front or balcony cornice reflections. In this example, the height of the overhead stage reflector, depth of the balcony and angle of the balcony front could all be quickly developed in a workshop by simply altering the architectural model.
Figure 3 shows reflections from large side reflectors. While the sides of the 3D plots are well populated by spikes (sound reflections from the sides), little energy is received from above. While this is adequate for an empty stage or small ensembles, some of the side energy might be shielded by other orchestra members (this is discussed later in this paper). Again, the height, size, and angle of the reflector could all be quickly reviewed in collaboration with the architect.
Optimisation through an evolutionary solver
The authors recently expanded the tool to include an evolutionary solver, taking it from analysing the design to guiding the stage design process. The tool presented can be used in conjunction with Galapagos, an evolutionary solver within Grasshopper.
Evolutionary solvers trial a population of parameters iteratively over time to produce an optimised solution. These ‘parameters’ could be anything, ranging from dimensions (like reflector height, size or angle) to geometry locations. There is a lot of flexibility in this input, so the user has control of what is altered and by how much.
The user then selects the design goal. An example of a ‘goal’ could be to maximise the total early energy to a receiver, or just early reflections received from the side. Alternatively, the goal could be to provide at least one reflection from each reflector or provide more reflections from ‘weaker’ instruments. The evolutionary solver then cycles through the input parameters to find the solution that best achieves the goal.
A simplified example of the design optimisation process using this tool with Galapagos is shown in Figure 4. Figure 4 shows a series of angles for a side reflector (shown in grey). Each have been tested by the tool and the optimised solution is shown in red. In this case, the design goal was to achieve at least one reflection from above to each receiver. However, the evolutionary solver could be used to optimise any other parameter.
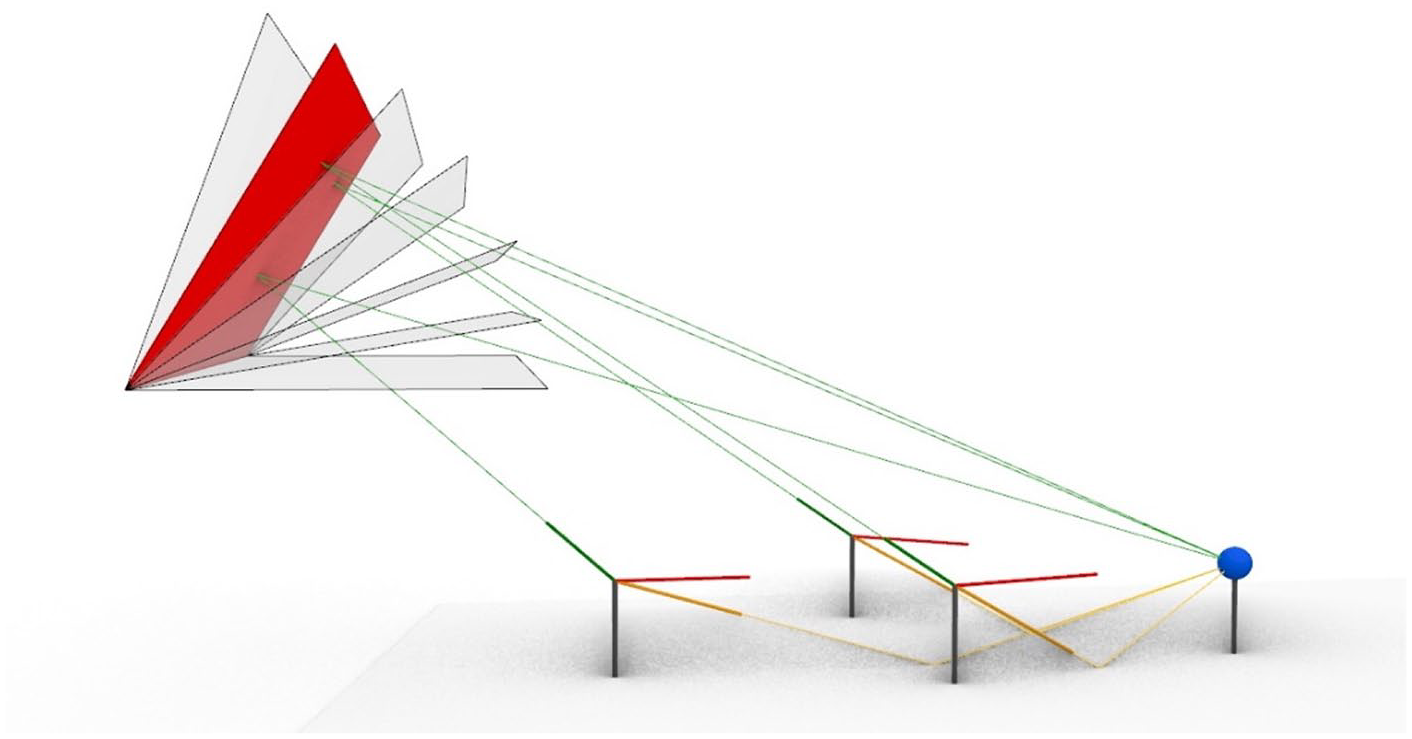
Reflector optimisation using an evolutionary solver.
The incorporation of an evolutionary solver into the tool shifts it from identifying useful or detrimental surfaces, into a design guide that produces highly tuned solutions and greater design variability. The above example is very simple and was included in this paper to help explain the concept. However, as the calculation process could be done for multiple sources and receivers, using Galapagos has the power to trial many options quickly to optimise the design for multiple solutions. Altering the design process from form-diagnostic to form-finding is a powerful design strategy and can lead to innovative designs during early stages of the design process.
Overall, the visual nature of the 3D plots produced with this tool efficiently communicates the effect of architectural changes in a shared language. Expressing complex relationships between surfaces in a simple and easy to digest medium reduces the barrier to entry for architects and advocates for a collaborative design approach. The immediate feedback enhances the collaboration between members of the design team in an interactive design process.
A more detailed case study (visual and numerical) for an orchestra
A simplified multipurpose hall stage has been used to assess the acoustic implications of architectural changes around the stage in more detail. Two example situations have been used to examine how the tool can visually and numerically communicate early energy on stage. These situations are the inclusion of an orchestra shell and stage risers.
A representative sample of sources and receivers has been chosen to analyse the stage conditions for different orchestra members. A simplified representation of an orchestra is shown in Figure 5 and the source/receiver positions chosen for this study are shown in red: first Violin, Viola, Flute, French Horn, Trumpet, Bassoon, Cello, Oboe and Conductor.
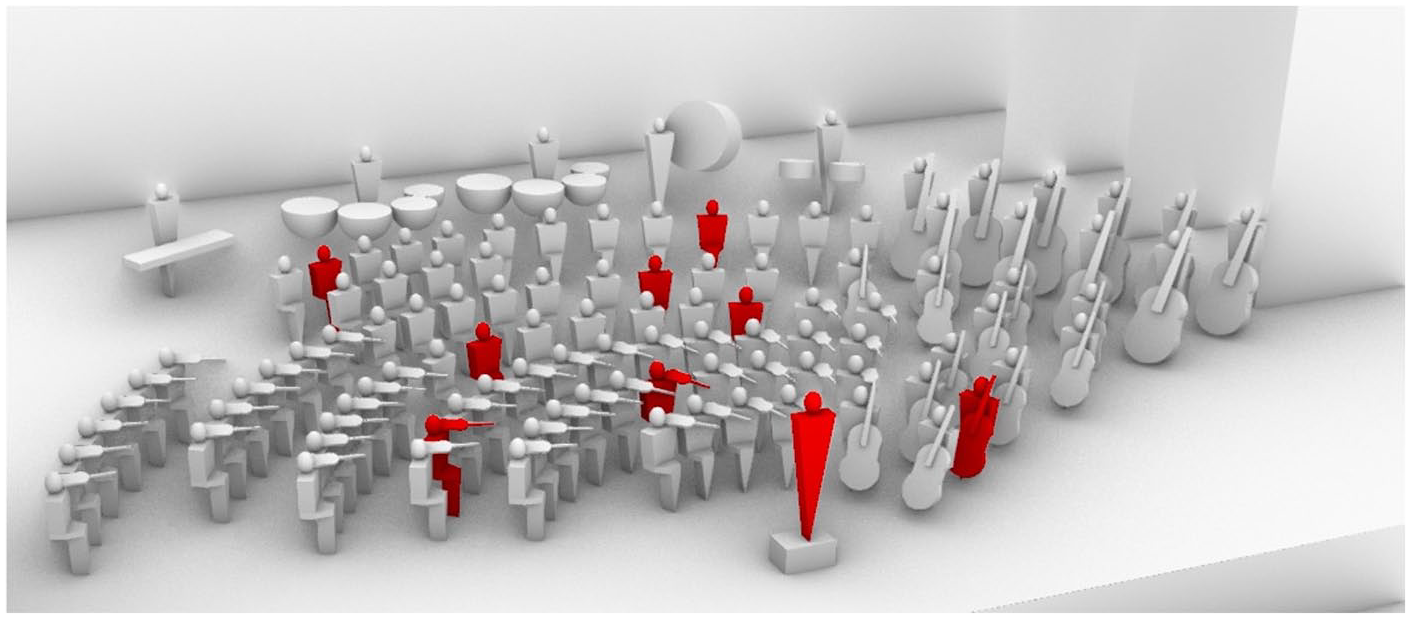
A representative sample of sources and receivers highlighted in red.
Additionally, the effects of the directivity and shielding of instruments and musicians is discussed.
Introducing an orchestra shell
Incorporating an orchestra shell into a multipurpose hall is a typical design solution for increasing early reflections on stage. This case study is intended to illustrate the ability of the tool to provide immediate visual and statistical feedback to the architect and client. As discussed earlier, this direct feedback is powerful when communicating design intent and advocating for change in a design workshop.
As shown in Figure 6 below, the modelled stage with a large open proscenium and no orchestra shell (left) provides few useful early reflections (green). In most locations no early reflections are received within the desired time interval. However, the inclusion of the orchestra shell, walls and overhead panels, (right image) provides a good level of early reflections from above, which facilitate support and cross-stage communication.
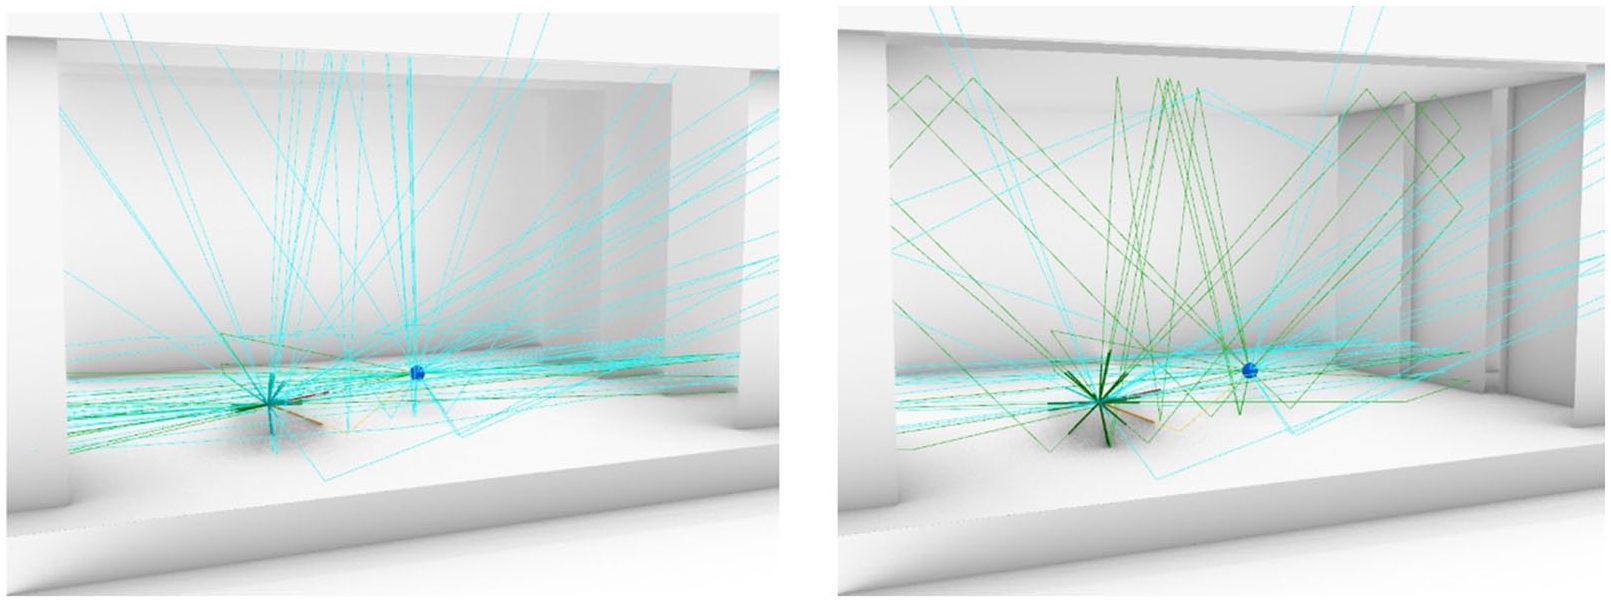
Sound reflections on stage without orchestra shell (left) and with orchestra shell (right).
The difference of early energy between with and without orchestra shell can also be seen in the 3D receiver shown in Figure 6 and enlarged in Figure 7.
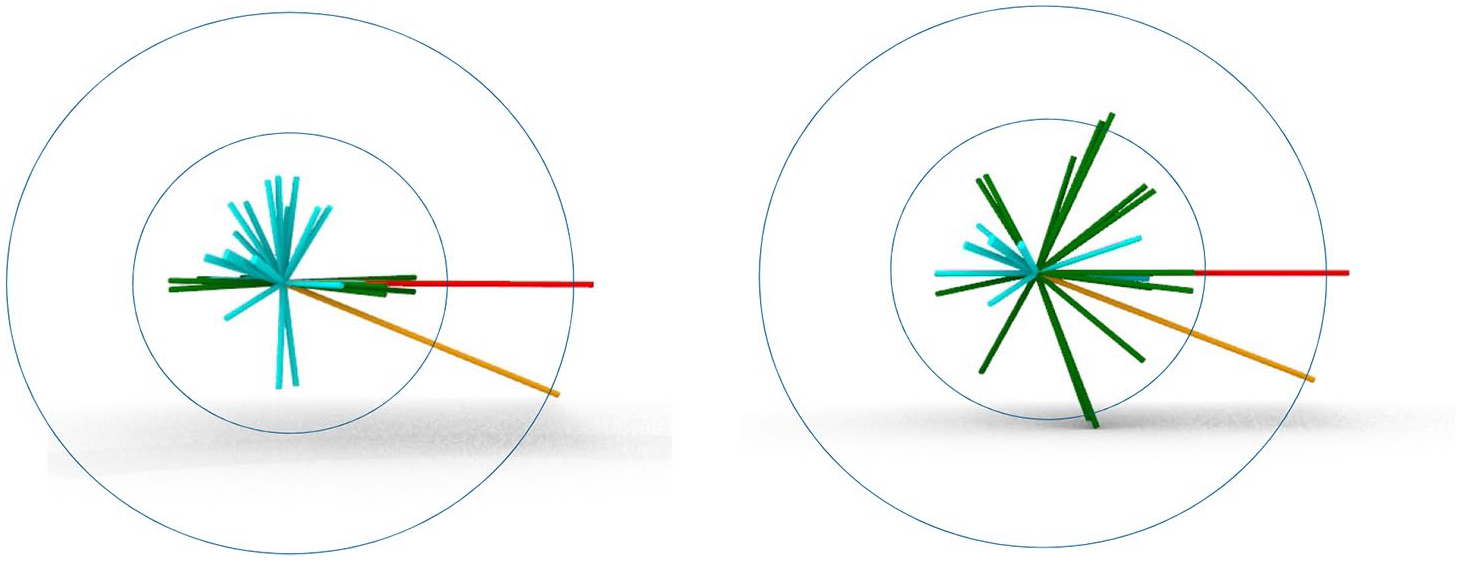
3D receiver plots without orchestra shell (left) and with orchestra shell (right).
These visual plots quickly communicate the change in stage environment to the architect or client in a form that they can understand and interrogate. For example, when comparing the two 3D plots, it can be seen that a larger number of spikes arrive from above and approximately 45° to the right. These extra rays represent the overhead and cornice reflections from the shell’s overhead/side walls panels. This inherent visual nature of the tool is far more digestible for a client or architect.
Besides visual representation of the raytracing, the developed tool can also estimate the early energy and a selection of stage acoustic parameters (e.g. STearly, Gearly, etc.). Table 1 compares the ‘early energy’ (SPL7-40) received at one metre from the source and the stage support, STearly, from different musicians’ locations.
Change in SPL7–40 and STearly for the use of an orchestra shell – based on a sound power level of 80 dBA.
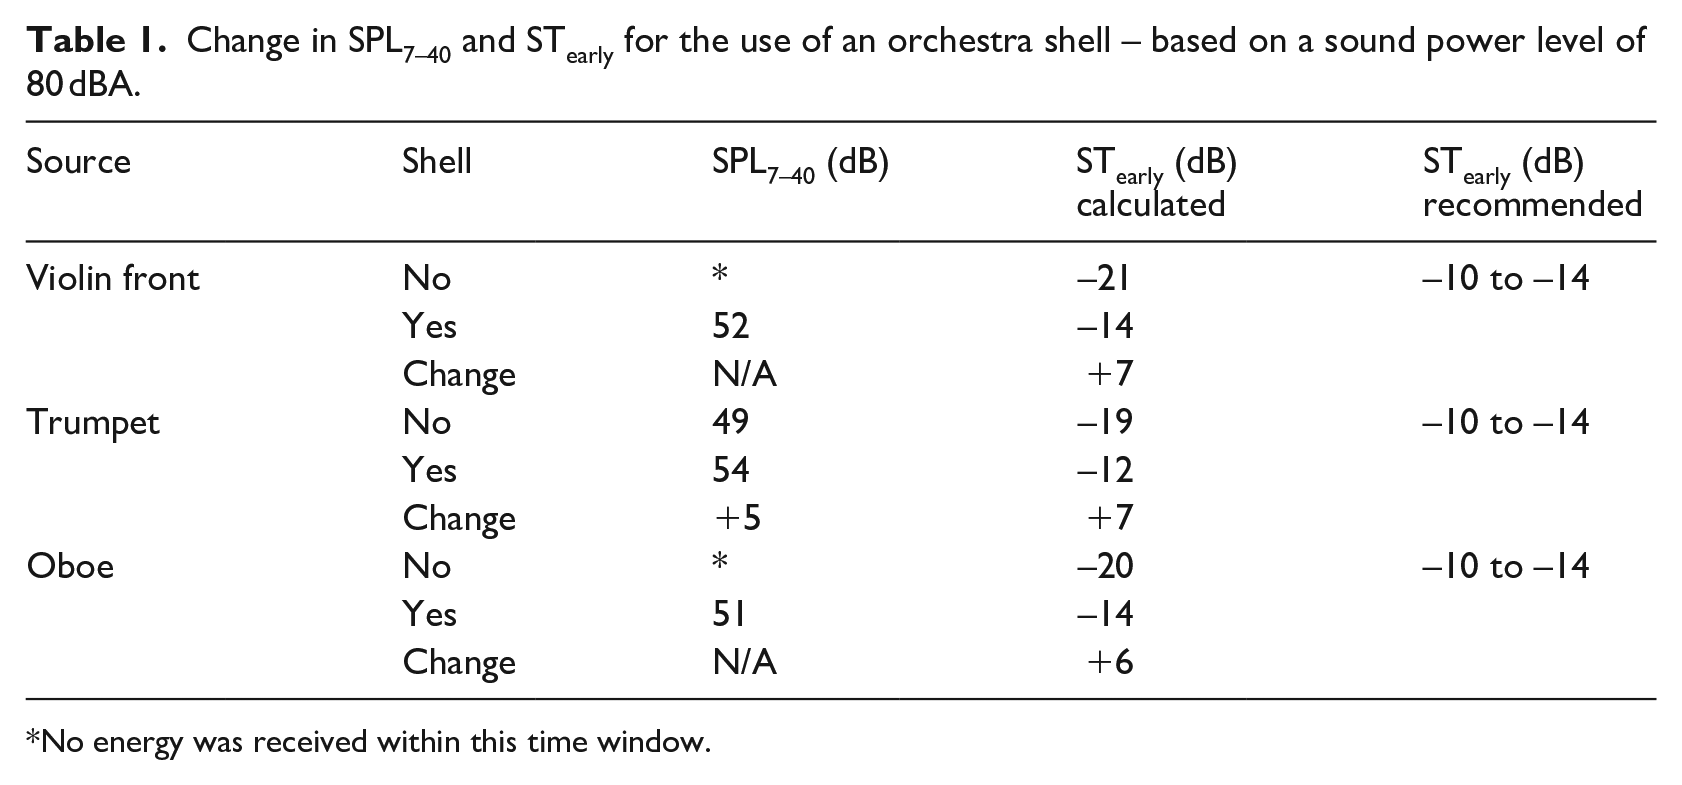
No energy was received within this time window.
Stage acoustic parameters that include the direct sound and floor bounce show little difference between scenarios (1–2 dB) for most source/receiver combinations. This is due to the strength of the direct sound and floor bounce, which might not be audible with the occupied stage. Therefore, it is considered that the energy received without the direct and floor bounce will represent better the cross-stage communication. This aligns with the latest stage acoustic parameters proposed in recent research by Van Den Braak and Van Luxemberg (LQ7–40), 8 Panton et al. (TS20–50) 10 and others.7,9
Table 1 shows an increase of approximately 6 dB of the early energy (SPL7–40) with the orchestra shell when calculated one metre from three different sources (violin, trumpet and oboe). An increase of 6–7 dB is predicted for STearly with an orchestra shell. Adding the orchestra shell shifts the expected performance from poor to optimum for symphony music recommended. 5
Stage risers
Stage risers provide a better visual connection between musicians than a flat stage, while better projecting sound from the orchestra to the audience. With a greater visual connection, the direct sound between musicians should also improve due to diffraction and less shielding.
The early energy between instruments across the stage was analysed with this tool in a flat orchestra scenario and with risers at difference heights (Figure 8). Both scenarios included an orchestra shell and shielding from music stands and musicians.
Stage risers’ arrangement (three first rows of strings flat at 0 m, fourth row of strings and first row of winds at 0.25 m, fifth row 0.5 m, sixth row 0.75 m, seventh row 1 m and percussion at 1.25 m).
As the tool is based on a ray tracing technique, diffraction around musicians’ heads is currently not considered. As such, the improvement obtained was lower than expected and several positions showed that the direct sound was still blocked.
As shown in Figure 9, for a flat floor (left), the direct path is blocked by two heads. However, with the risers (right) this path, while not being completely clear, only has the side of one head blocking the sound. This improvement in the visual connection between the musicians in a real orchestra would be expected to result in a better direct sound connection between musicians.11,12
View from trumpet to violin – flat floor (left), stage risers (right).
Some positions did not show an appreciable change in the early energy received (7–40 ms), but others showed approximately a 1 dB improvement (e.g. the first violin received two early reflections that previously arrived after 40 ms).
Being able to position a camera and see the stage as a musician would, communicates the change in height simply and effectively to a client or architect. This experience can be quickly enhanced further by transitioning the view simply and quickly into Virtual Reality.
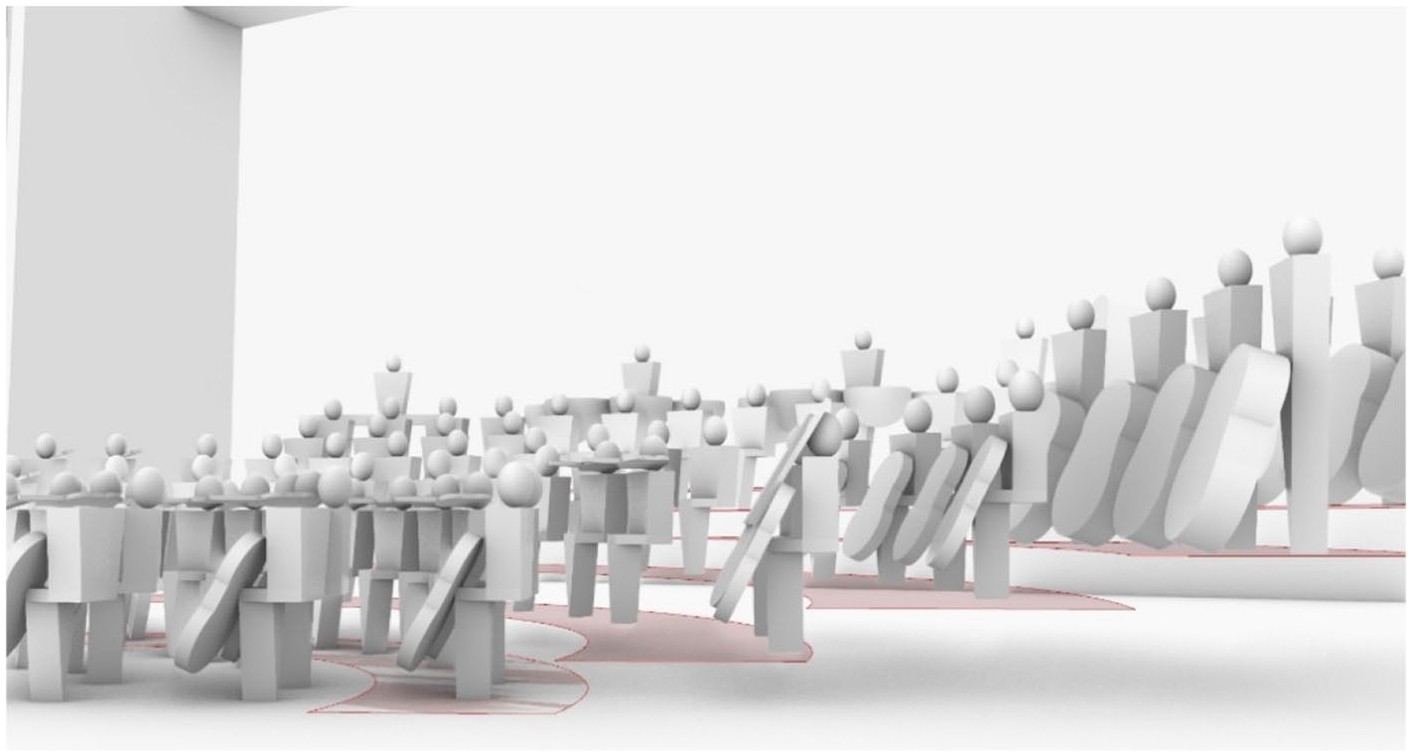
Considering shielding of instruments and musicians
On-site stage acoustics measurements are typically undertaken with an omnidirectional source and without the musicians on stage. Generally, this is due to the difficulty and expense of incorporating the orchestra in the measurements. When possible, measurements are undertaken with chairs and stands; however sometimes these measurements are undertaken with an empty stage. It has been appreciated for some time that this does not communicate a realistic test of the actual performance stage conditions. The effects of the directivity of the different instruments and cross-stage shielding due to musicians and stands can have a significant impact on the sound received between musicians.11,12 Assessment of the changes in the stage acoustics conditions due to these items by using the developed tool are discussed in this and the following section.
With the developed tool it is easy to include objects such as musicians, chairs and stands and then estimate the effect of cross-stage shielding on the stage acoustics. At low frequencies the direct sound will diffract around the instruments and musician’s heads. However, at 500 Hz – 4 kHz the obstacles in the stage will reduce the direct sound creating shadow zones within the orchestra. 13
A selection of musicians and large instruments (shown in Figure 5) have been incorporated into the Rhinoceros model to analyse the shielding effects from musicians/instruments. As discussed in the risers’ section, the tool is based on ray-tracing and at this point it does not consider any diffraction. Therefore, it provides a binary response to shielding (if the ray is intercepted by an obstacle it considers that all of the sound does not arrive at the receiver). However, some degree of diffraction of the direct sound would be expected around musicians’ heads.
Studies have measured the sound attenuation of orchestra shielding. 12 This transmission loss data could be applied to the distance calculation in the tool. However, doing so would limit the investigation of stage arrangements to those measured in that study. As part of a future study the authors will investigate a less binary approach to the analyse the shielding effects of musicians. This would allow the tool to estimate the diffraction of sound around musicians while preserving the ability to assess unique stage designs.
The analysis with the developed tool showed that the direct sound and floor reflection are shielded in most scenarios with a flat floor arrangement. An average reduction of 4 dB was calculated in the early energy (7–40 ms) for the flat stage due to shielding, compared to the stage with stage risers; however, in some source/receiver combinations a higher reduction was observed.
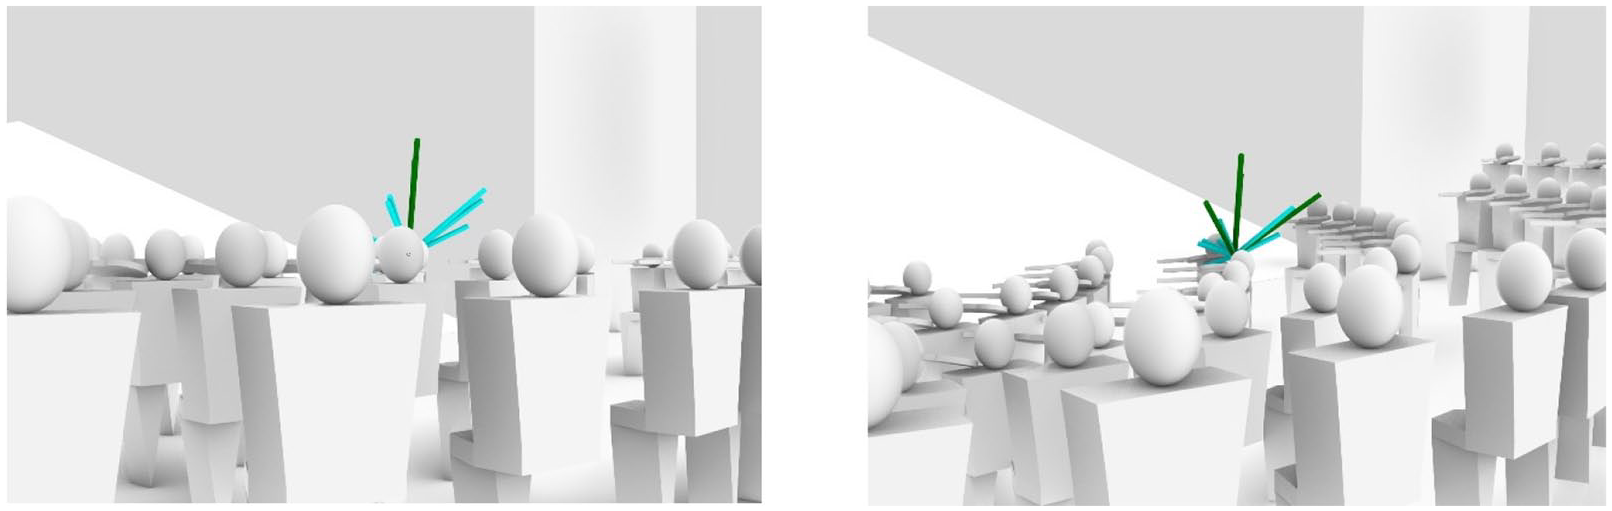
Figure 10 shows a comparison of the violin energy plots received from the oboe with and without musicians on stage. Figure 11 shows the range of early sound energy reduction due to shielding for four sources (the trumpet, violin, french horn and cello) to the rest of the musicians, for the flat stage compared to the stage with stage risers. This reduction typically represents the low-level reflections from the side walls/shell, which are blocked by the orchestra.
3D receiver plot (from the oboe to violin) without shielding (left) and with shielding (right).
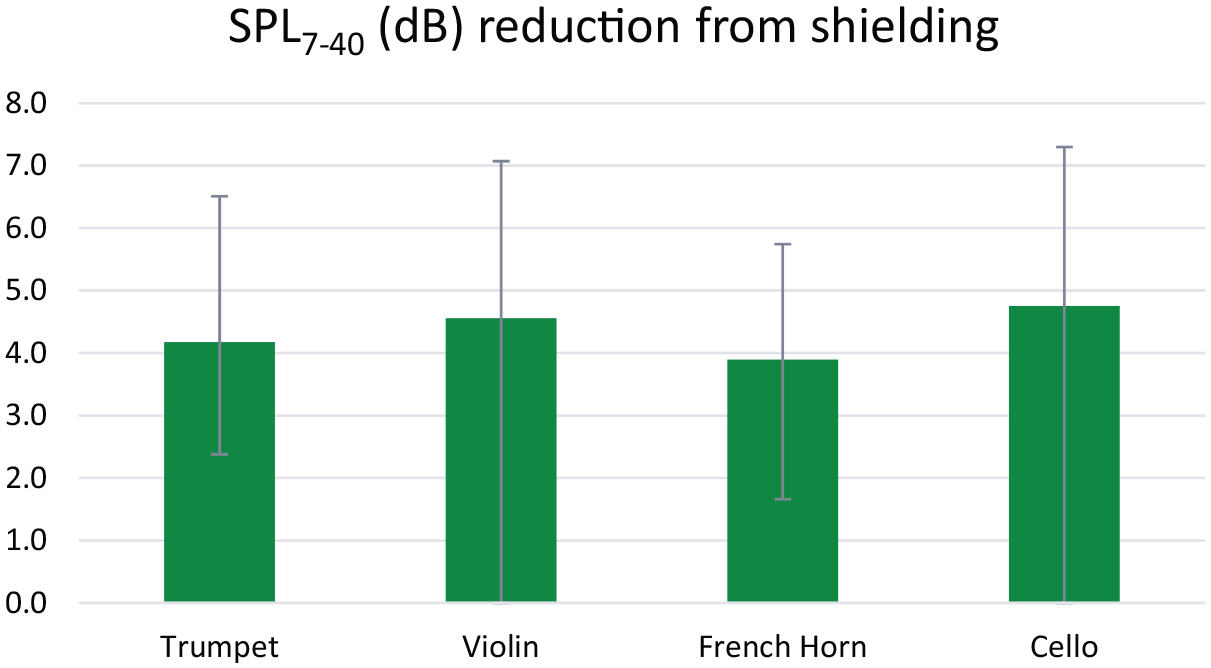
Average reduction of early energy due to shielding for different sources.
Considering directivity of instruments
Directivity can be a significant influence on the sound level experienced on stage, and therefore the degree that a player can hear themselves and other musicians.
The developed tool can easily include the directivity of the instruments in the raytracing and calculation of parameters. Directivity of the instruments has been exported from Odeon’s database and imported to the calculations. As described in the measurements of the directivity by Pätynen and Lokki, 14 the position of the musicians’ head has been defined as the centre position.
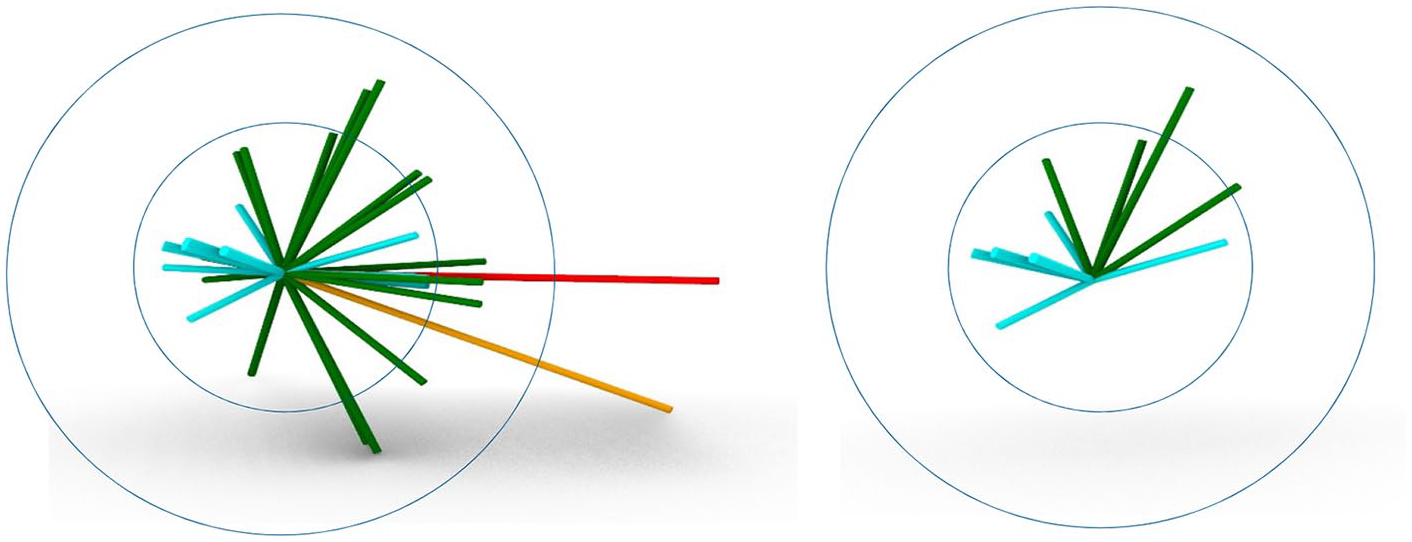
Figure 12 shows the directivity of the trumpet at 4 kHz, and the 3D receiver plot from the trumpet with and without directivity to the calculated position. The plot shows that the length of the direct sound (red) and early reflections from above (green) is reduced due to the directivity of the source; however, the length of the floor bounce increases due to the trumpet being more directional at this direction.
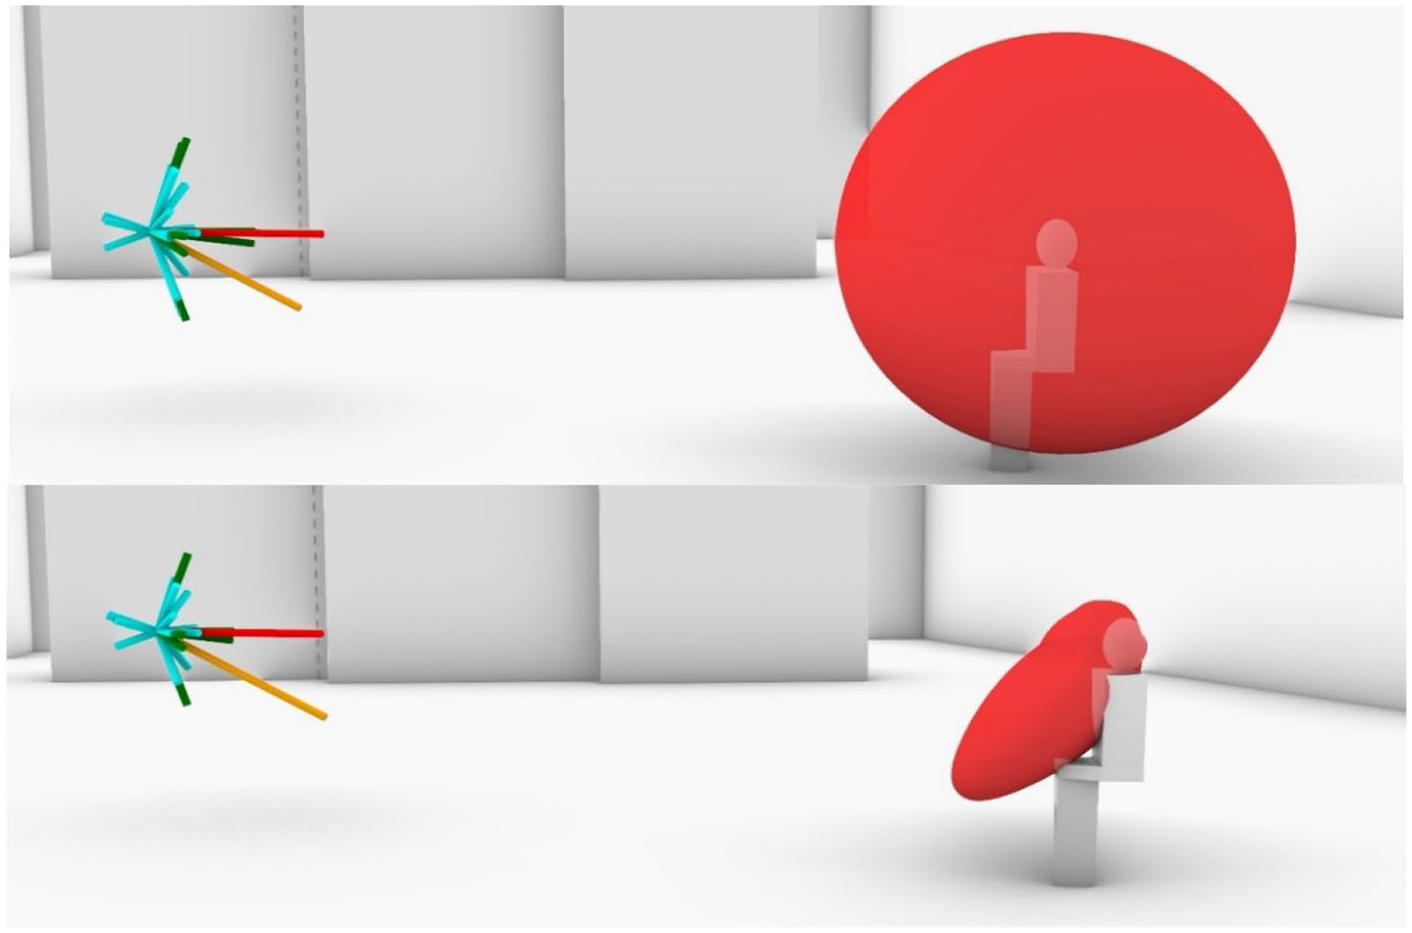
Comparison of trumpet directivity (top: omni-directional; bottom: 4 kHz).
A direct comparison of the energy received can be seen in close-up views of the energy plots from an omnidirectional source and the directivity of the trumpet at 1 kHz and 4 kHz (Figure 13).
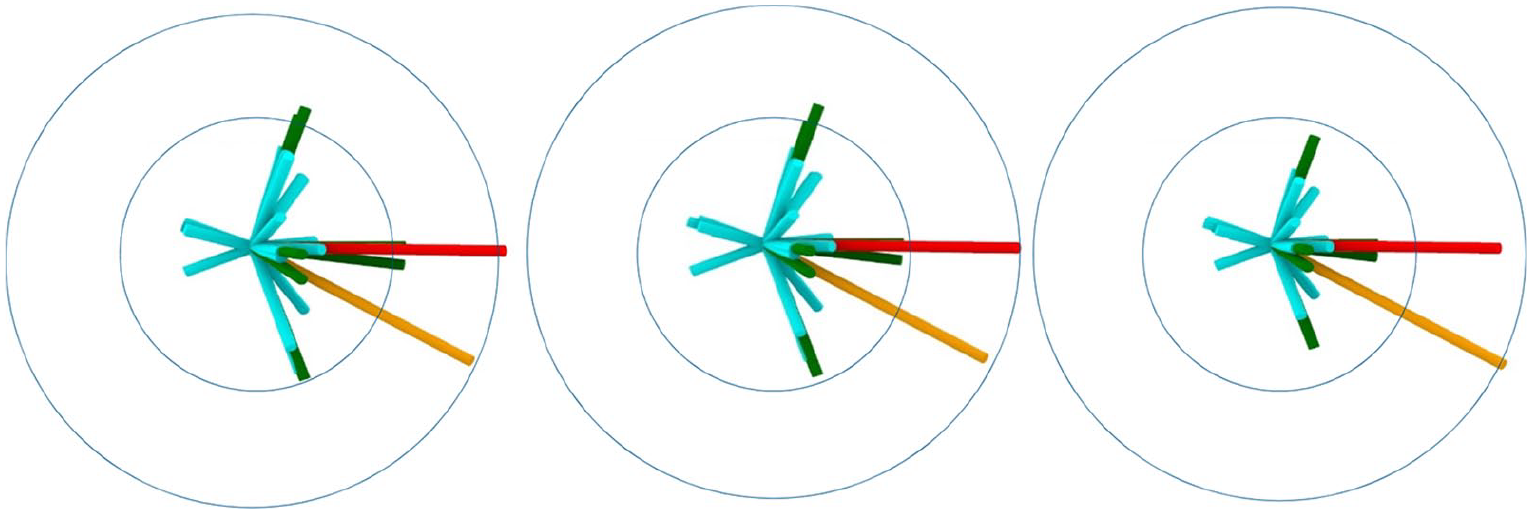
3D receiver plots - Omni-directional (left), trumpet 1 kHz (centre), trumpet 4 kHz (right).
When looking the early energy calculated between each source (trumpet and violin) and the remaining receivers, a general reduction of 2–8 dB was observed in the early energy (between 7 and 40 ms), due to the directivity of the sources when compared to an omnidirectional source.
The change in early energy predicted between omni-directional and directional sources, alters with each instrument and frequency. However, the two instruments selected for this study were the trumpet and violin. The change in the early energy received (SPL7–40) from the violin and trumpet to other musicians is shown in Figures 14 and 15.
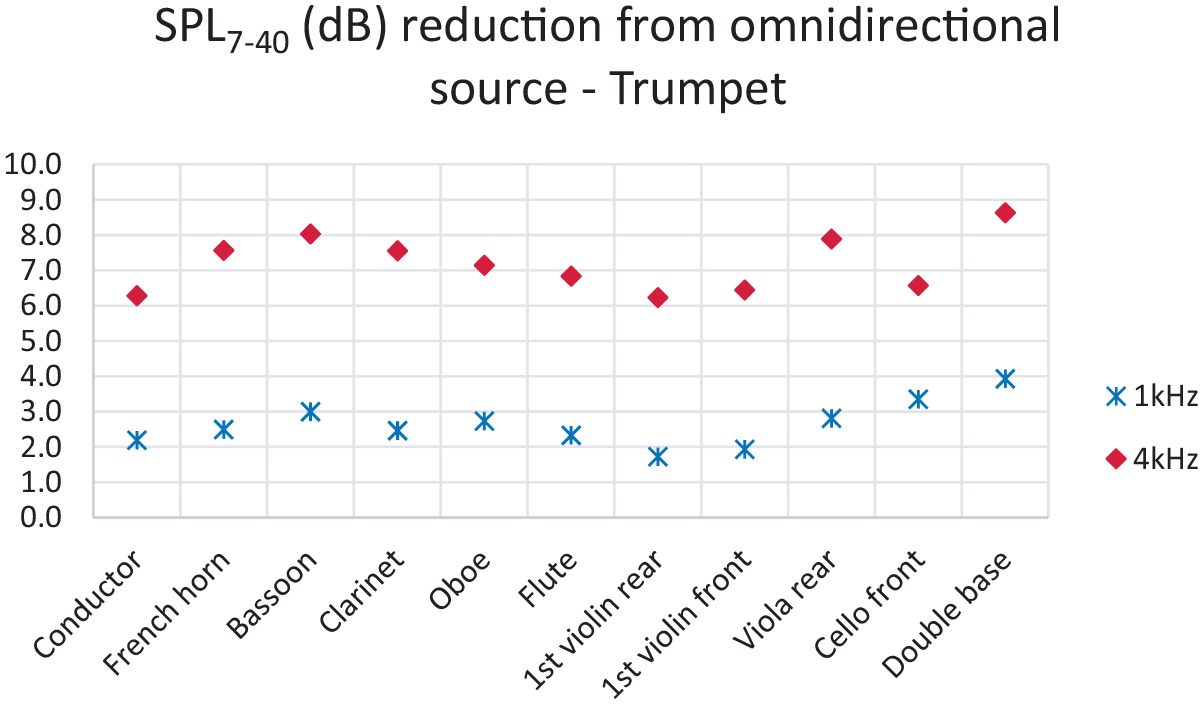
Early energy sound reduction from trumpet to musicians compared to omnidirectional source.
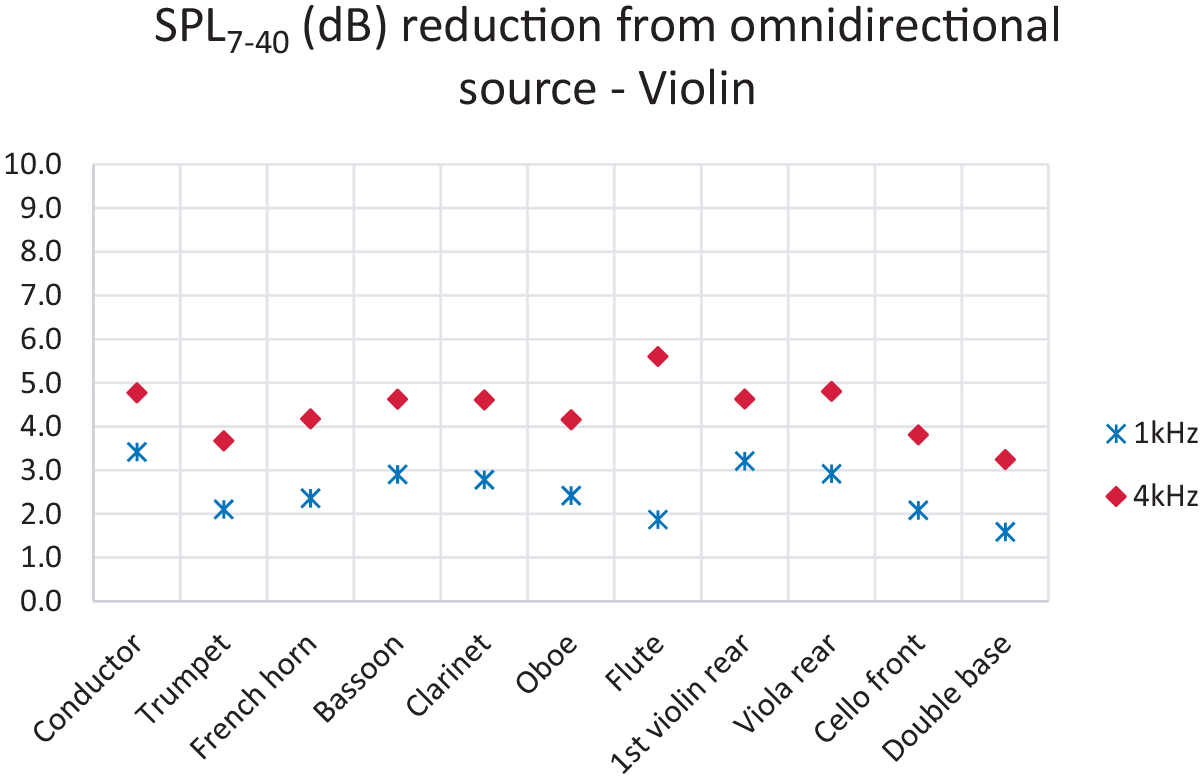
Early energy sound reduction from violin to musicians compared to omnidirectional source.
The trumpet is highly directional at 4 kHz. As such, a reduction of 6–8 dB reduction in the early energy was observed at 4 kHz, compared to a reduction of 2–3 dB at 1 kHz. For the violin, which is less directional at 4 kHz, a reduction of 3–5 dB was found.
Note that all the simulations have been calculated with a fixed position and orientation of the instrument for simplicity. As some instruments are very directional, the orientation of the instruments could result in changes in the energy received.
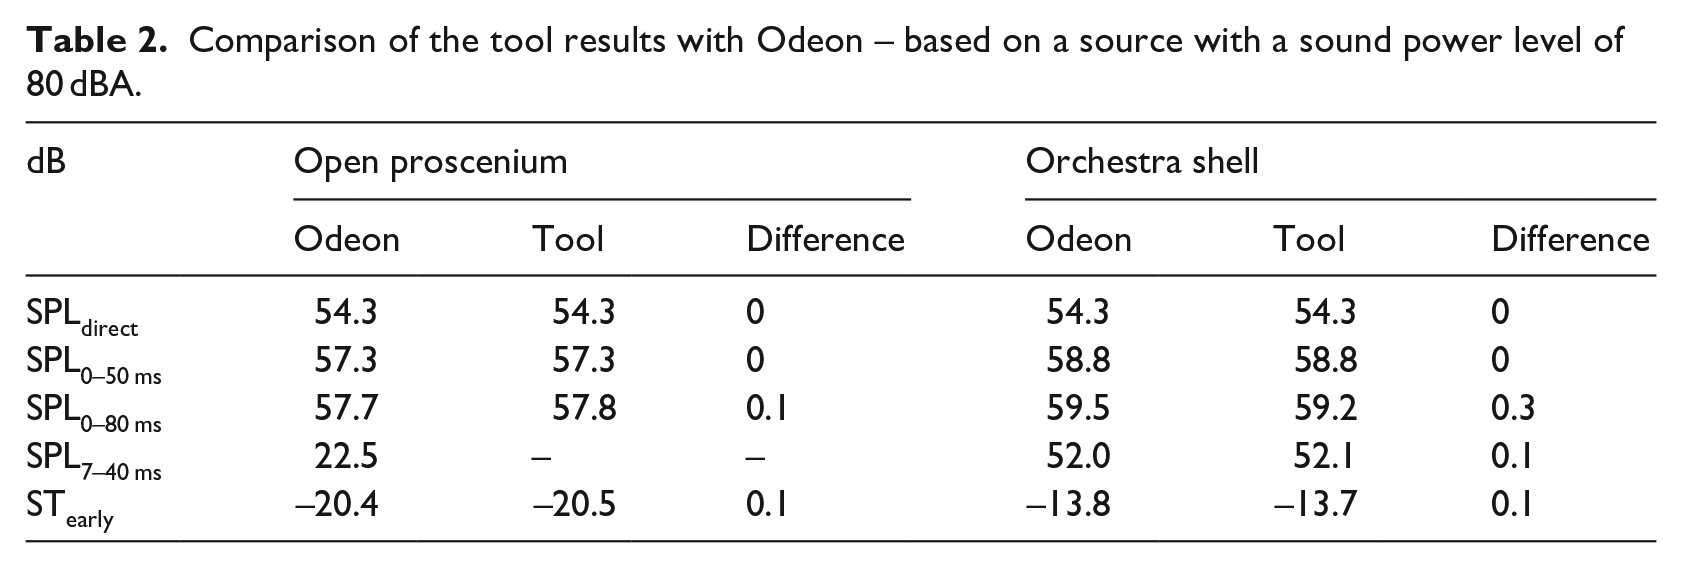
Comparison of the developed tool with odeon
The statistical parameters generated by the developed tool were compared to an established ray tracing software, Odeon. Table 2 summarises the results. A high level of agreement was found for both the ‘open proscenium’ and ‘orchestra shell’ scenarios, as discussed in the stage shell analysis in this paper. This verification was undertaken with omnidirectional sources and no musicians on stage.
Comparison of the tool results with Odeon – based on a source with a sound power level of 80 dBA.
Conclusion
The developed Grasshopper/Rhinoceros tool was found to be useful for designing stage conditions. The tool produced both meaningful graphics that communicated reflection direction, delay and strength to the client.
The power of the tool comes both in its accessibility from an architectural perspective, and its affinity towards providing ‘real-time’ visual and statistical feedback for architectural design issues. Through the inherent visual nature of the tool, outputs are more digestible for a client or architect.
As Rhinoceros is a predominantly architectural programme, little time is lost converting files and simplifying the model. Furthermore, the immediacy of the results allows the acoustician and architect to make meaningful design changes within a workshop.
The incorporation of an evolutionary solver, Galapagos, into the tool shifts it from a tool for assessing surfaces to a design tool. Galapagos has the power to quickly trial multiple options to optimise the design to create highly tuned solutions with greater design variability.
Results from the tool suggest that an average reduction of 4 dB in early energy (7-40ms) can be found when considering shielding from the orchestra. Depending on the instrument, a reduction of up to 6–8 dB in early energy can be found when considering instrument directivity. The stage acoustic parameters calculated with the tool aligned well with results from Odeon.
Further research will be undertaken on improving the management and calculation of curved surfaces and diffraction of sound around musicians’ heads. A non-binary approach to the ‘rays’ intersection from musicians will be investigated to estimate the effect of diffraction around musicians.
Footnotes
Declaration of conflicting interests
The author(s) declared no potential conflicts of interest with respect to the research, authorship, and/or publication of this article.
Funding
The author(s) received no financial support for the research, authorship, and/or publication of this article.