
Abstract
Lecturers often inadvertently modify their position and orientation while lecturing in classrooms. However, data on speech intelligibility for various speaker orientations and positions in classrooms is limited. This study examines how speaker orientation, position, and acoustic treatment affect speech intelligibility within classrooms. Measurements were made in two university classrooms, one with acoustic treatment (T30 ≈ 0.4 s) and the other without (T30 ≈ 1.0 s), each with an area of 80 m2. Speech level, speech transmission index (STI), and speech intelligibility scores in Mandarin were assessed in both classrooms for different speaker orientations and positions. The results show that varying speaker orientation can modify the speech level by up to 3 dBA and the STI by up to 0.11. A speaker at the podium typically improves intelligibility when the speaker is oriented toward the majority of the audience or directly ahead. Acoustic treatment reduces speech level but improves intelligibility scores by 5%–10%. In the classroom without acoustic treatment, although speech level is mostly independent of speaker orientation, the STI variation among various speaker orientations is comparable to that in the classroom with acoustic treatment. Speech intelligibility is larger than that at the podium when the speaker is in the center of the classroom and more sensitive to speaker orientation and receiving position. The classroom with better acoustic conditions has satisfactory intelligibility scores for any speaker orientation, whereas speaker orientation can improve intelligibility scores by up to 10% in classrooms with inferior acoustic conditions, especially for listeners in an adverse condition.
Keywords
Introduction
Clear and effective verbal communication [i.e. good speech intelligibility (SI)] is crucial for creating an acceptable learning environment in classrooms. Poor SI can decrease students’ comprehension, cognition, and academic performance, causing physical and mental discomfort1–3 and reducing their attention and motivation.4,5 Therefore, SI in classrooms has received widespread attention for many years.
SI in classrooms depends mostly on reverberation time (RT) and the signal-to-noise ratio (SNR).6,7 Studies show that SI deteriorates with decreasing SNR and increasing RT.8–14 RT affects intelligibility mainly due to the “overlapping” effect of late-arriving speech elements, which creates mask noise. 15 Given that low and excessive reverberation are both detrimental to SI in the classroom, 4 researchers have recommended an optimal RT range.16–18 Bradley 16 recommended a relatively limited RT range of 0.5–0.7 s as optimal and 0.4–0.8 s as usually acceptable for occupied middle school classrooms. Numerous studies have supported these findings and proposed similar optimal RTs in certain scenarios. Minelli et al. 19 systematically overviewed the studies conducted in 2002–2020, and concluded that RT = 0.6–0.7 s suffices to ensure proper learning performance for students at any age.
To ensure good learning performance, some studies suggest an SNR of at least 10 dBA,1,20 although a higher SNR [exceeding 15 dBA] is required for people with poor auditory cognition (such as children and hearing-impaired individuals).1,3 Researchers also report that a higher SNR is required for longer RTs to ensure adequate SI.1,17,21 As an example, Neuman et al. 1 reported that achieving 95% SI scores at the back of the classroom requires a minimum SNR of 10 dBA with RT = 0.3 s, 12 dBA for RT = 0.6 s, and 15 dBA for RT = 0.8 s. Minelli et al. 19 recommend that for students at any age, an SNR value higher than 12 dBA can achieve optimal SI. In practice, SNR is determined by comparing the levels of speech and noise. Background noise in classrooms generally comprises ambient sounds from air and ventilation systems, crowd noise from movement and conversation, and external noise.22–24 These noises considerably reduce the SNR, reducing intelligibility and hindering speech communication in the classroom. 22 In fact, background noise exceeding a certain limit has a greater negative impact on student learning than excessive reverberation in the classroom. 6
Researchers have also surveyed the speech levels in classrooms.9–26 Hodgson et al. 9 found that speech levels in university classrooms ranged from 40 to 80 dBA. Airey 27 tested the speech levels of 73 primary school instructors at 1 m from the speaker and showed that the mean speech level for female (male) teachers was 62.1 (57.7) dBA. Hiroshi and John 26 used Hodgson’s Gaussian distribution model to measure the speech level and background noise of a teacher’s lecture in an occupied classroom, with the occupied speech levels ranging from 45.5 to 94.5 dBA, and the teacher’s lecture speech level ranging from 55.7 to 71.1 dBA, depending on the position of the microphone.
During actual instruction, teachers could raise their voices to enhance SNR and thus overcome the background noise and reverberation to improve students’ understanding.4,28,29 However, such excessive vocalization by teachers may lead to vocal fatigue, discomfort, and organic voice disorders. 30 Therefore, researchers aim to maximize SI while minimizing vocal effort, thus improving voice comfort.29,31 Puglisi et al. 29 indicated that RT = 0.7 s should be optimal for maximizing SI and minimizing vocal effort; away from this optimum RT, teachers were obliged to raise their voice to ensure comprehension (a shorter RT means lower perceived speech levels and a higher RT means higher background noise). Another study found that teachers could adjust their vocal effort to accommodate different classroom acoustic conditions, with the lowest voice level (i.e. greatest vocal comfort) occurring at RT = 0.8 s. 31
To maximize SI while minimizing vocal effort, researchers suggest using sound-field amplification systems or public address (PA) systems to improve SNR and SI.32,33 PA systems often amplify the teacher’s voice using wireless microphones and loudspeakers and have been shown to improve students’ speech recognition.34,35 However, PA systems are not always practical. Lubman 36 reported that sound-field amplification equipment is not optimum in classrooms with long RTs and that classroom amplification systems are not as good as they should be. In addition, amplification systems often add noise in adjacent corridors and classrooms, leading to mutual interference.37,38 Moreover, using an amplification system may weaken student-teacher interaction, decreasing students’ learning performance, focus, and motivation. 38
In addition to improving the acoustic conditions of the classroom and using PA systems, improving the speaker’s vocal efficiency is important for enhancing SI while minimizing vocal effort. 29 The traditional approach of delivering lectures from a podium facing a fixed direction is no longer prevalent. In real vocal teaching situations, student-teacher interaction is enhanced by the teachers moving around the classroom, addressing specific students, and changing their head orientation while speaking. However, when teachers walk around the classroom or turn their heads to speak, variations in the orientation of their voices may make it difficult for some students to hear well, reducing their learning experience. Thus, the acoustic-field distribution and related SI in the classroom may be affected. Studies have reported that room acoustic measurements and corresponding SI vary with speaker characteristics.39–47 Previous studies found that the absence of frequency-response equalization can lead to significant measurement errors,44,45 especially in small acoustic spaces, where SI may depend more strongly on speaker directivity.46,48 Recent research has also shown that COVID-19-inspired face masks affect directivity patterns and frequency response, which affect SI.49,50
Speaker orientation also affects SI in classrooms similarly to speaker directivity, which is related to the radiated sound field distribution.48,51 Liang and Yu 48 reported that when the speaker turns away from the listener’s direction, SI in the absorptive room is significantly reduced: the speech reception threshold varies up to 7.4 dB and speech-transmission index (STI) varies up to 0.24. Similar results have been obtained regarding the directivity of orchestral instruments 52 and in open-plan offices. 53 However, investigations into how speaker orientation affects SI in the classroom are limited. The study is thus based on an in-depth experimental examination and quantitative assessment of SI under various speaker orientations and positions in the absence of PA systems. This study may provide valuable insights for classroom design and acoustic treatment in natural speech teaching scenarios, emphasizing the importance of optimizing speaker position and orientation and providing practical guidance for improving SI.
This study examines the effect of speaker orientation and position on speech intelligibility in classrooms with and without acoustic treatment. The experiment involved five speaker orientations, covering most cases encountered in real teaching scenarios. The experiments were done in two university classrooms, one with acoustic treatment (RT = 0.41 s) and the other without (RT = 0.99 s). To determine how speaker position affects SI, the speaker had two positions: on the side podium and in the center of the classroom. The speech level and room impulse response (RIR) were measured in the two classrooms for various speaker orientations and positions. From these measurements, the corresponding RT, SNR, and STI for normal and raised vocal efforts were calculated. To more comprehensively assess how speaker orientation and position affect SI, subjective experiments were conducted to determine Chinese SI scores under different conditions in real classroom situations.
Methods and materials
Acoustic measurements
Classroom selection
In large classrooms, PA systems are often necessary for students in the back to hear the teacher, whereas in small classrooms, the proximity typically ensures clear speech intelligibility. Therefore, we chose appropriate classrooms that not only met the research needs of natural teaching without PA systems but also had potential problems involving SI in certain situations (e.g. when the speaker faces away from the listeners). In addition, the sensitivity of the acoustics and SI to speaker orientation may vary in rooms with different acoustic treatments. 48
Based on these considerations, the acoustic measurements in this study were conducted in two classrooms with the same plan dimensions (7.8 m × 10 m) but with different acoustic treatments: classroom A had no acoustic treatment and classroom B had acoustic treatment (see Figure 1 and Table 1). Classroom A had a marble tile floor, lime-painted walls and ceiling, and wooden desks and chairs. Classroom B had a wooden floor, walls covered by perforated panels, plastic decorative plate on the ceiling (thus reducing its height), wooden desks, and chairs with mesh and fiber coverings.
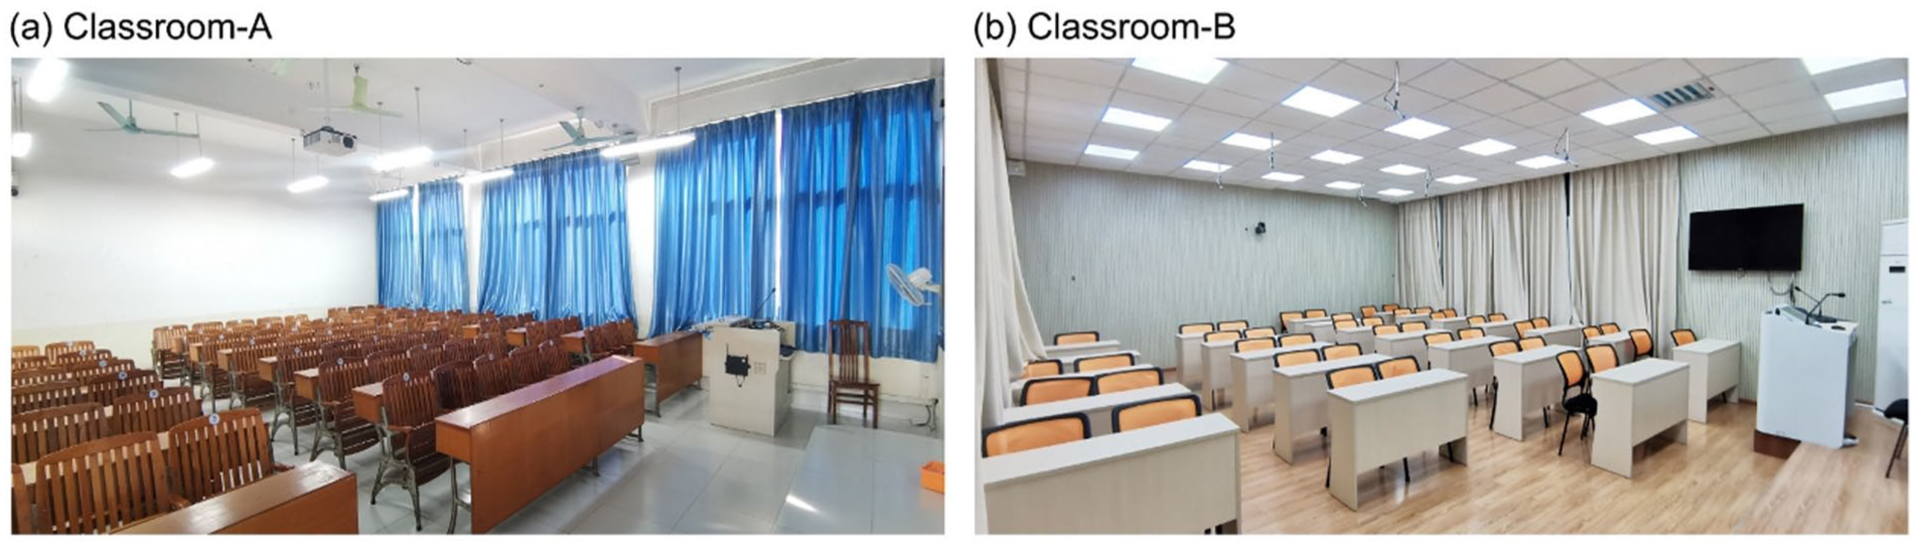
Photographs of the two university classrooms used in this study.
Parameters of the classrooms A and B, including the dimensions and the
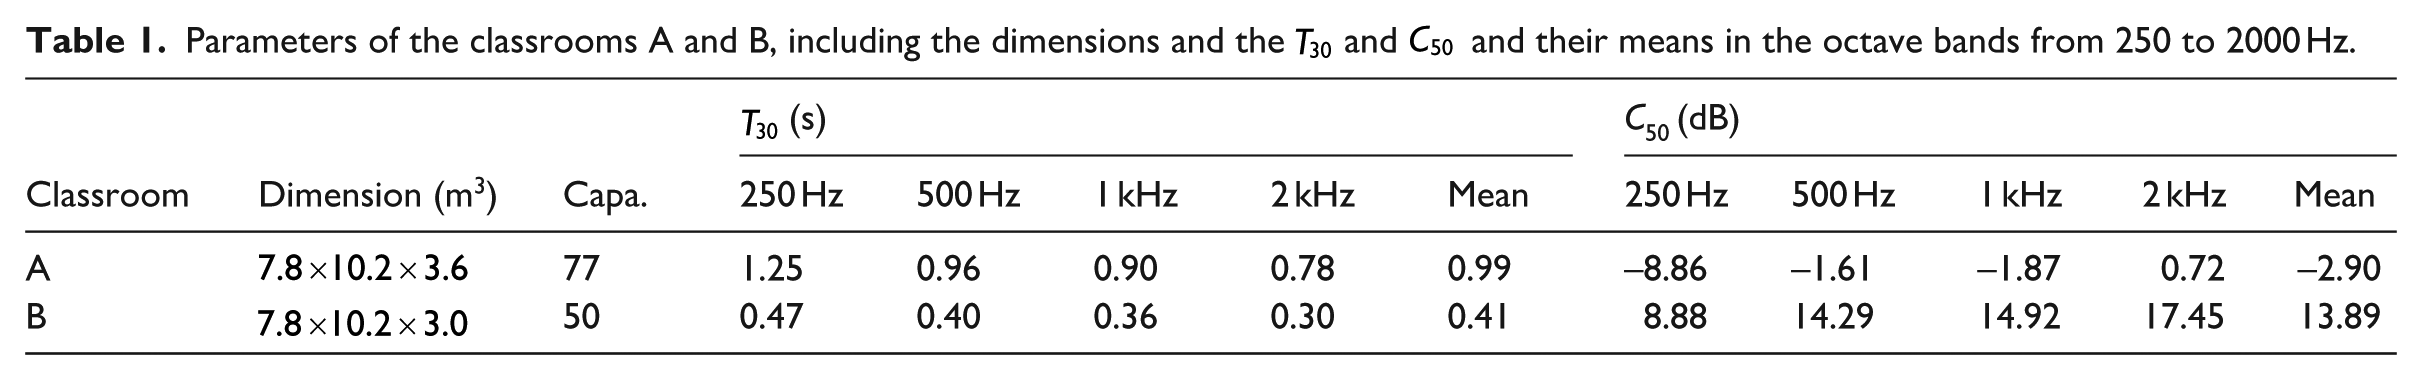
Table 1 lists the room acoustic parameters of the classrooms A and B, including the
Level measurements
Speaker orientation is directly related to the radiated sound field distribution from the speaker. Varied speaker orientations modify the speech levels, which modifies SI. Therefore, the speech levels at each seat (see Figure 2) in each classroom were first measured under various speaker orientations and positions.
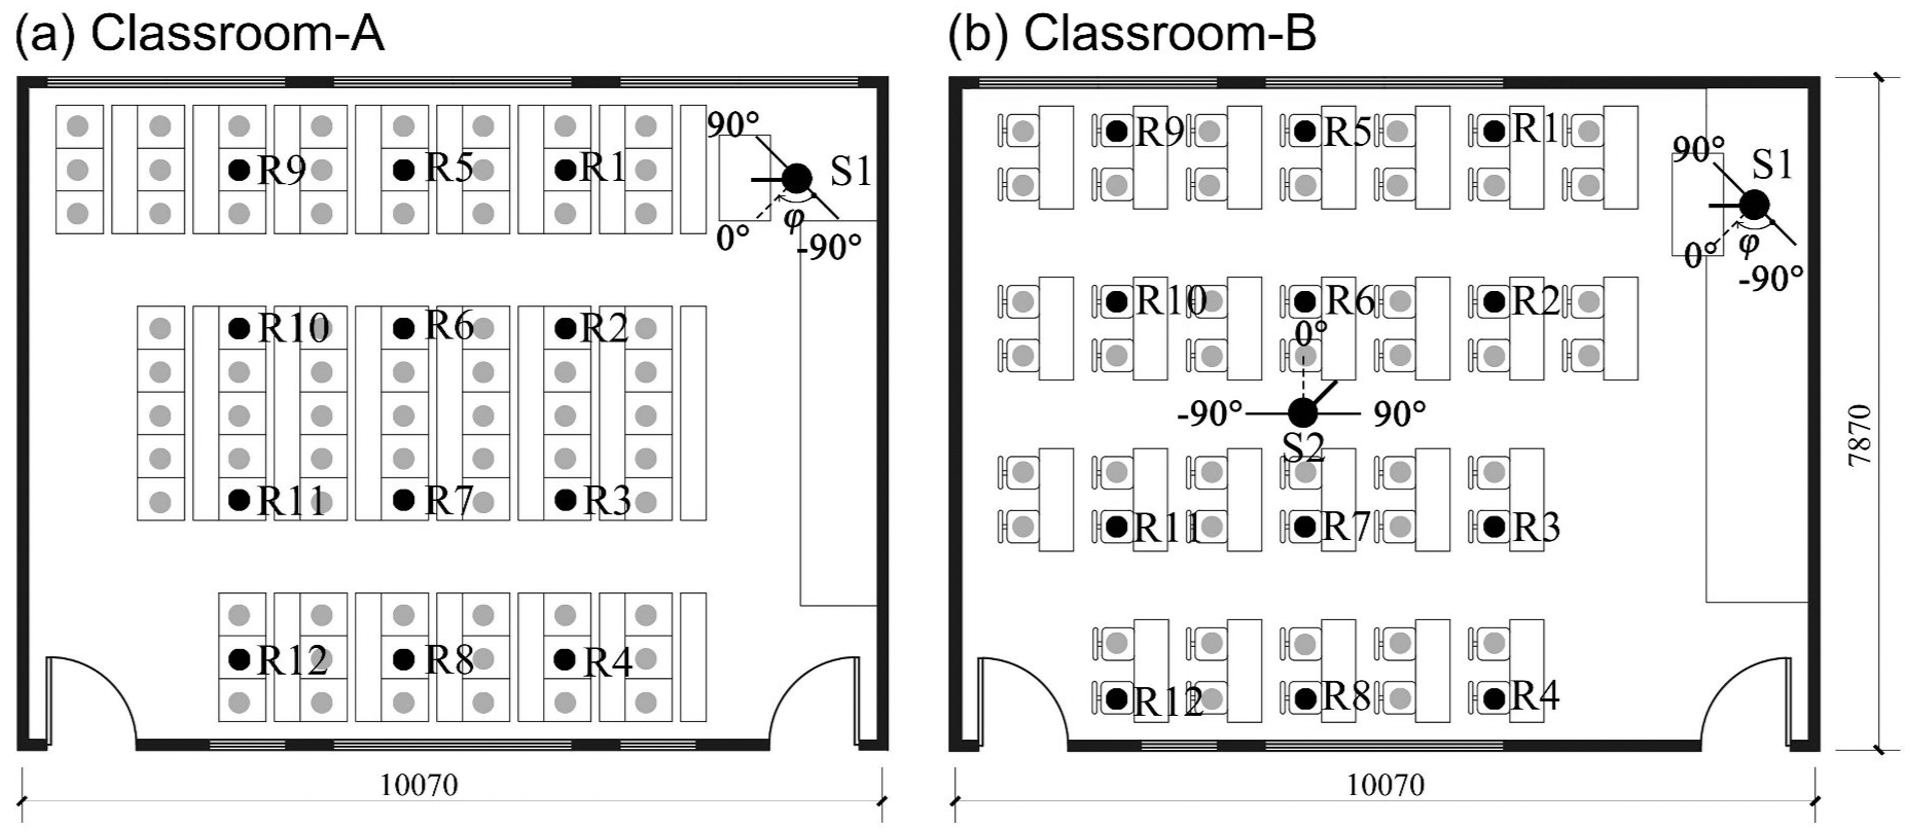
Configuration of the speaker position and its orientation in the experiment, as well as the position of the receiving point. R1–R12 represent the receiving points for measuring RIR and STI (black mark), while speech level measurements are conducted at each seat (gray mark).
Numerous studies document the speech level during instruction; for example, Sato and Bradley
26
used a Gaussian distribution model to obtain an average SPL of 60.1 dBA during normal teaching and deduced that a SPL of 65.3 dBA at 1 m in front of the teacher in the free-field condition. Sarantopoulos et al.
55
obtained the average speech level of
An artificial mouth (GRAS 44AB) served as the speaker; it produces a human-like radiation pattern and directivity. Speech signals with the standard average Chinese spectrum were used as excitation. These were generated by pink noise and filtered and adjusted according to the standard Chinese spectrum in GB/T 7347-1987. 58 The artificial mouth was used to produce speech for the speech-level measurements in classrooms A and B. In classroom B, the artificial mouth was sequentially placed at the podium (labeled S1) and in the center of the classroom (labeled S2) to compare the results for the different speaker positions (Figure 2). In classroom A, the artificial mouth was exclusively positioned on the podium, constrained by the real seating configuration (Figure 2), and the results were compared with those of classroom B with the similar speaker position. This allowed the role of acoustic treatment to be analyzed. The artificial mouth was fixed 1.5 m above the podium or floor (roughly similar to the height of the mouth of a standing teacher).
The orientation of the speaker was adjusted from
Measurements of room impulse response
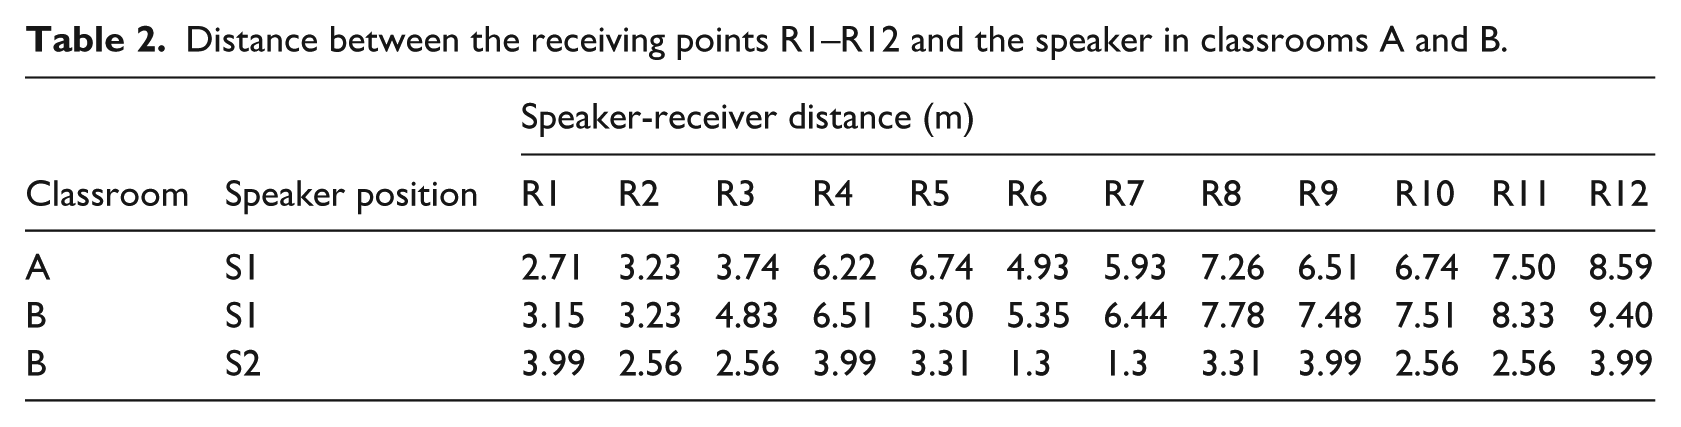
Twelve receiving points (red markers) were set up as shown in Figure 2, with each receiving point 1.2 m above the floor. Table 2 gives the distances between the receiving points R1–R12 and the speaker in classrooms A and B. All tools and methods used in the measurements conformed to ISO 3382-1. 59 The artificial mouth (GRAS 44AB) was triggered for 5 s with a maximum length sequence (MLS) signal sampled at 44,100 Hz. The signal was sent to the GRAS 44AB by a Roland Studio Capture 1610 sound card. Omnidirectional microphones (MicW M215) recorded the audio signal at the receiving points. To obtain an RIR at a given receiving point, we deconvolved the recorded MLS signal from the original MLS signal. These measured RIRs were used to obtain RTs and STIs.
Distance between the receiving points R1–R12 and the speaker in classrooms A and B.
STI calculation
STI is predicated by assuming that the decrease in modulation intensity from the speaker to the receiver (i.e. the modulation transfer function) is related to distortion in SI caused by the acoustic transmission system.57,60 Schroeder 61 developed and Rife 62 refined an indirect single-impulse response-measuring technique. The speech and noise levels were measured separately.
This study primarily examines how variations in the transfer function, resulting from various speaker positions and orientations, affect intelligibility. Consequently, it is important that other uncontrollable environmental factors, like crowd noise, are maintained as constant as feasible. To reduce the influence of noise variation on experimental outcomes, this study concentrates on static internal noise, specifically air and ventilation system noise, while excluding crowd noise. Therefore, doors and windows were kept shut during experiments, and data was gathered on weekends to ensure surrounding classrooms were empty. In classroom B, the primary noise source is the cabinet air conditioner located at the front right by the podium, whereas in classroom A, the main noise source is the central air conditioner on the rear left ceiling. Noise levels across the 125–8000 Hz octave bands were recorded at each seat using a sound level meter (AWA 5688), and the overall results are presented in Figure 3.
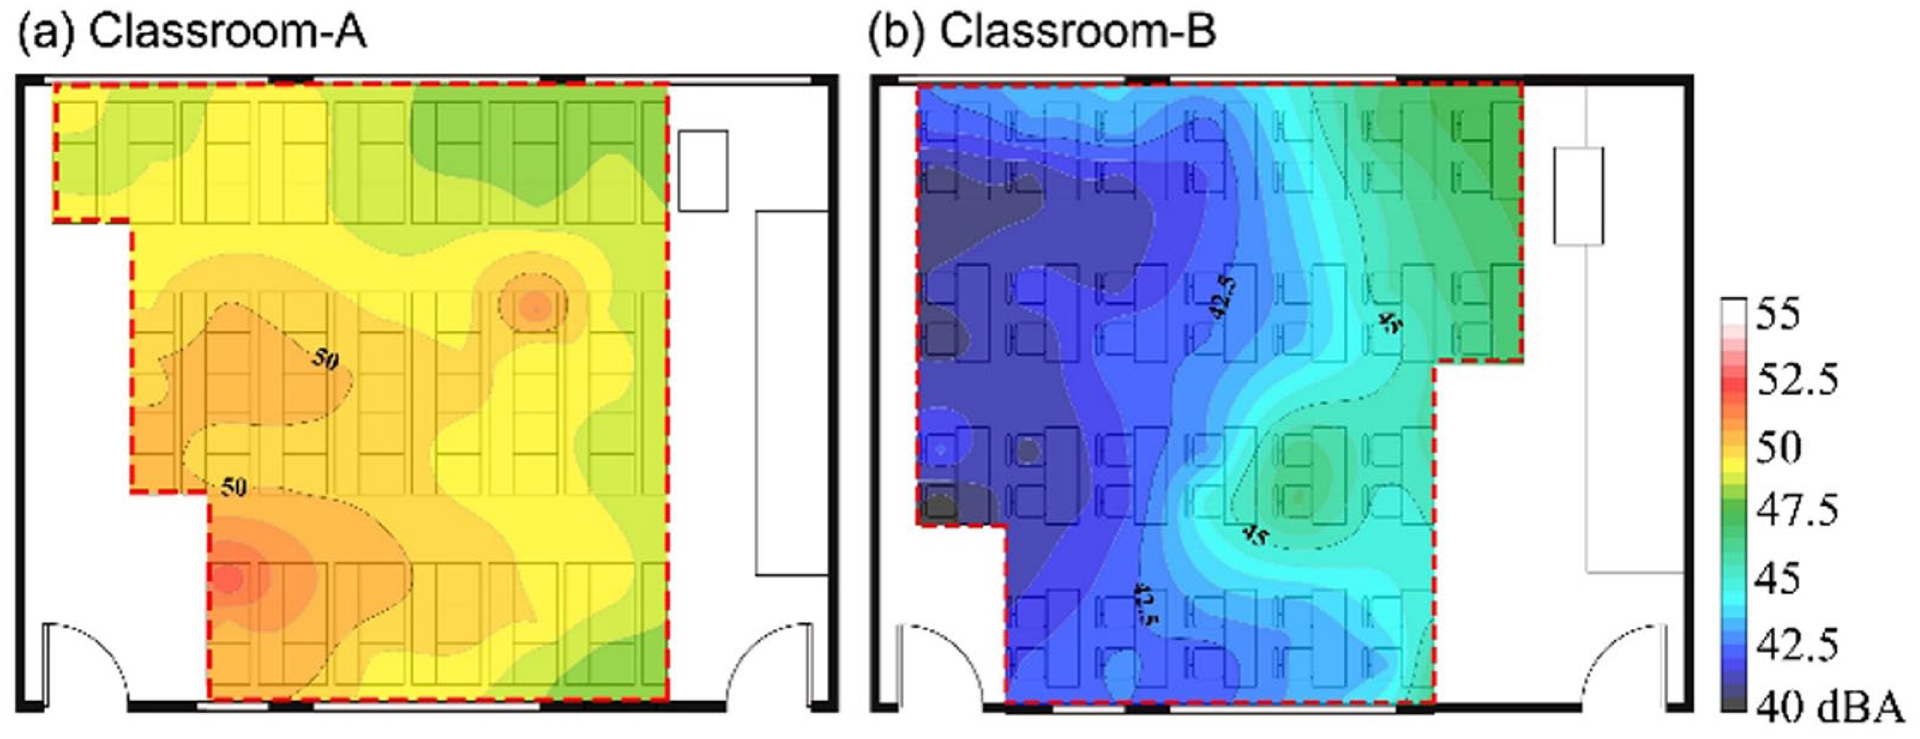
Distribution of background noise in the classrooms.
Note that the central air conditioning background noise in classroom A exceeds that in classroom B. In particular, noise levels in classroom B generally stay below 47.5 dBA, mostly under 43 dBA, whereas classroom A shows levels above 47.5 dBA (see Figure 3). There is a notable noise difference of over 5 dBA between the classrooms due to noise source positioning. In classroom B, the noise level generally remains below the maximum permissible background noise of 45 dBA as specified by the Chinese standard GB 50118-2010 63 ; however, the noise level in classroom A exceeds 45 dBA. For control purposes, a more consistent background noise distribution would aid in analyzing the impact of speaker orientation on SI at various receivers. However, real air and ventilation system noise in classroom environments is pervasive and varies significantly with spatial location. Thus, this study intends to depict the authentic noise conditions as closely as possible.
According to the standard IEC 60268-16-2020, 57 the speech level 1 m from the speaker was set at 60 (70) dBA for normal (raised) vocal effort. At each seat, speech levels in the 125–8000 Hz octave bands were recorded under varying conditions. By examining the decrease in the modulation index, the apparent SNR for each frequency band can be assessed. This enables the determination of transmission and modulation transfer indices. Subsequently, the STI is computed by summing the weighted contributions of each octave band. 57
Subjective experiment
A listening experiment was conducted to determine the SI scores in Mandarin Chinese for various speaker orientations and receiving points in classrooms A and B (i.e. without and with acoustic treatment). In classroom B, the analysis focused solely on the scenario in which the speaker was positioned at the podium (S1). This was done because SI is usually adequate when the speaker is at the center of the classroom (S2), and the ceiling effect produces essentially indistinguishable differences in intelligibility scores. Altogether, 120 conditions were considered for the subjective experiment (2 classrooms × 5 speaker orientations × 12 receiving points).
Participants
Twenty-four participants (12 male and 12 female, aged between 19 and 25 years old, averaged 22 years) were recruited from the college and graduate students at Guangxi University. All participants were trained in and conversant in Mandarin Chinese, and all indicated that they had normal hearing. They were native speakers of Mandarin and were paid for their experimental effort. The participants were separated into two groups, with half assessing Chinese SI scores in classroom A and the other half assessing SI in classroom B.
Stimulus
Ten Chinese word corpus from GB/T 15508-1995 64 were adopted for the subjective SI experiment, which contained a total of 10 lists. There were 75 syllables organized in 25 three-syllable groups for each word list. These three-syllable groups were arranged randomly and without meaning and played with a carrier phrase: “The # group is xxx”, where the “#” is the group number (1–25) and “xxx” are the three syllables. The syllables were recorded by four speakers (2 males and 2 females) in an anechoic chamber at a constant rate of 4–5 syllable/s. The stimulus sentence and the carrier sentence were delivered at a fixed level. The recorded signal is edited by MATLAB software to ensure that an appropriate amount of silence time (6 s) is allowed between the stimulus and carrier sentences so that the listener has time to respond to the words.
Procedures
The experiment was conducted on-site in classrooms A and B with different acoustic treatments. The excitation signal was played through an artificial mouth (GRAS 44AB). Before the experiment, the artificial mouth was calibrated for intensity using standard Chinese speech spectrum signals 58 so that the SPL was 70 dBA at 1 m in front of the speaker.
To limit noise variations during the experiment, only internal background noise that normally remains constant (i.e. the noise of the air conditioning system) is examined in this work, whereas crowd noise was not considered. Therefore, the doors and windows were closed during the experiment, and the measurements were made over the weekend when the surrounding classrooms were empty. The main noise in classroom A was caused by the central air conditioner located in the ceiling in the back left of the classroom. The main noise source in classroom B was the cabinet air conditioner located at the front right of the classroom near the podium (see Figure 3). The participants took turns occupying positions R1–R12 (see Figure 2) and were instructed to sit upright at their desks.
There were 60 test conditions (5 speaker orientations × 12 receiving points) in each classroom for each participant. Under each testing condition, each participant listened to speech materials from two syllable lists recorded sequentially by the male and female speakers, respectively. To prevent listener fatigue, the set of 120 trials, each taking 4–5 min, was split into four sessions spaced by at least 12 h and included a 15-min break after eight trials. The sequence of test conditions and syllable groups presented to participants was randomized. Pre-training sessions were conducted to ensure participants were acquainted with the entire testing procedure. The participants were instructed to write the syllables using the Chinese phonetic alphabet. They were also instructed to make their best guess when unsure. Testers then matched the responses against the correct answer. A response was considered correct only if the tone, consonant, and vowel were all accurately identified, regardless of grapheme. The correct rate of syllables was calculated as a percentage for each list. For each test condition, the final score was the average of the scores from the two lists and over all participants.
Results
Speech level
Figure 4 indicates the speech level distribution under different speaker orientations for classroom A (without acoustic treatment, single speaker position) and classroom B (with acoustic treatment, two speaker positions).
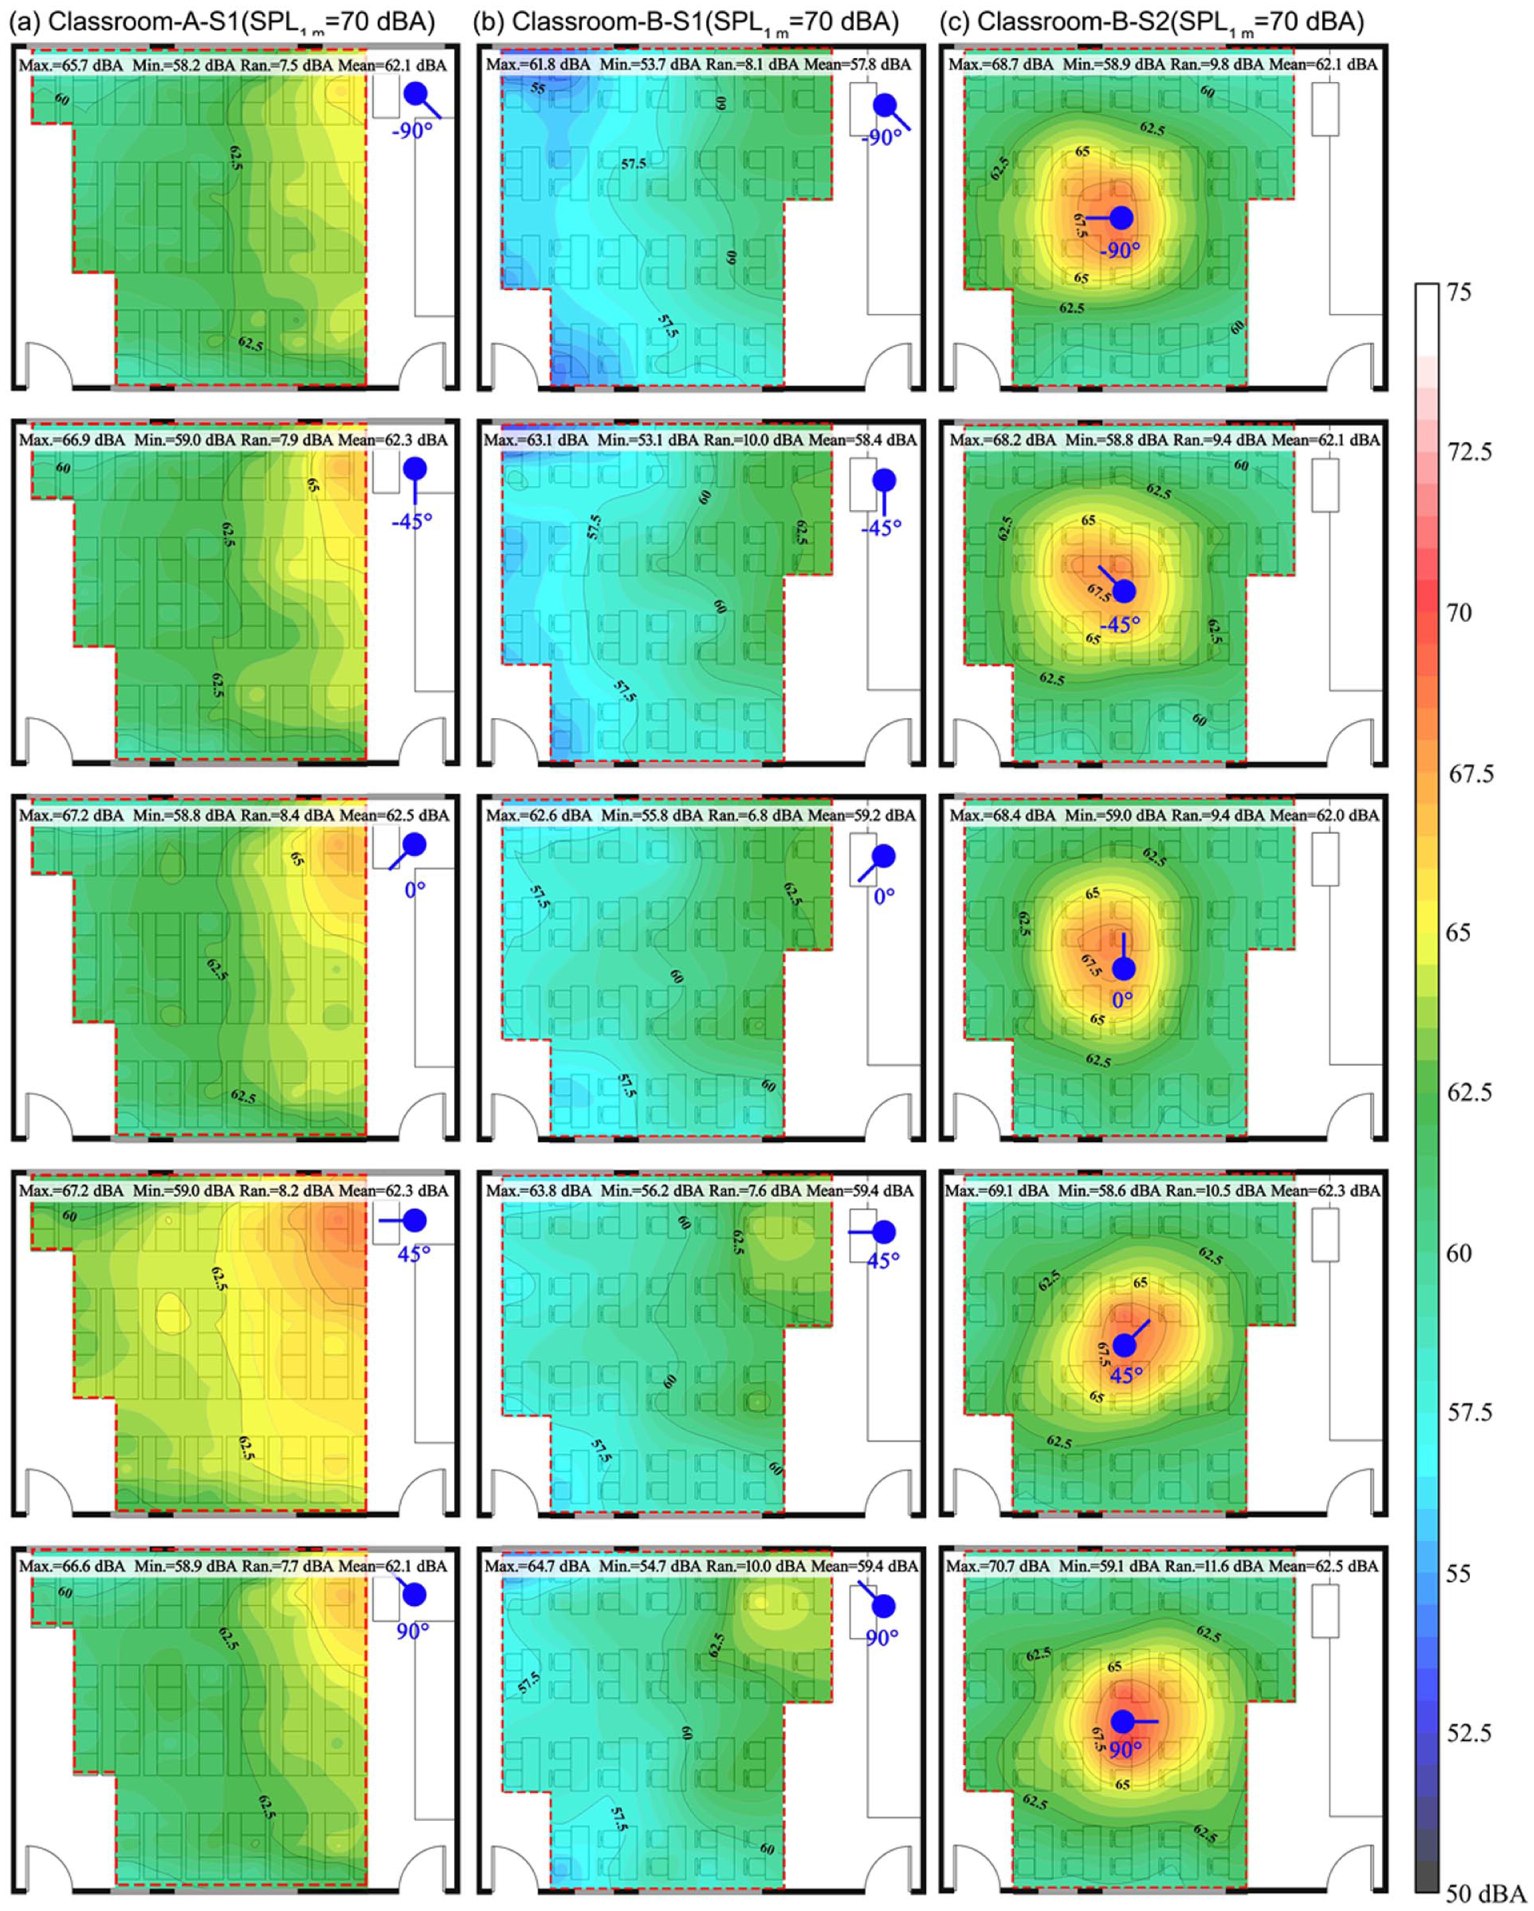
Speech level distribution in classrooms A and B under various speaker orientations: (a) classroom A-S1, (b) classroom B-S1, and (c) classroom B-S2. Only the measured seating area is displayed.
Comparing classroom A (Figure 4(a)) and classroom B (Figure 4(b)) shows that the former produces a much greater speech level (>58 dBA) with the speaker on the podium, and the average speech level is higher than 62 dBA. This result is mainly attributed to acoustic treatment in classroom B. In addition, the speech level is considerably greater overall in classroom B with the speaker at the central position (classroom B-S2) than in classroom B with the speaker at position S1 (classroom B-S1), as shown in Figure 4(b) and (c). For classroom B-S1, the minimum speech level is 53 dBA, and the average speech level is less than 60 dBA. This result could be attributed to the shorter speaker-listener distance when the speaker is in the center of the classroom (see Table 2). Overall, the speech levels at different receiving positions decrease with increasing distance from the speaker. In classroom B-S2, the speech levels are symmetrically distributed about the central axis of the classroom when the speaker orientation is
Figure 4 also shows that the magnitude and distribution of speech levels in the classroom vary with speaker orientation. Overall, the speech levels depend on the direction of the speaker, with the speech levels in the direction of the speaker being greater than the speech levels on either side of this axis. This result is related to the speaker’s directivity pattern. For classrooms B-S2 and A-S1, the average speech levels vary by no more than 0.5 dBA for the different speaker orientations. However, for classroom B-S1, the average speech levels vary by nearly 1.6 dBA, with the maximum variations (59.4 dBA) occurring at speaker orientations of
Speech levels at different receiving positions in the classroom vary considerably depending on speaker orientation, speaker position, and acoustic treatment. The range of variation in speech level at the various receiving points in classroom B mildly exceeds that in classroom A. In addition, in classroom B-S2, the speech level varies over the different receiving points from 9.4 to 11.6 dBA, which is generally greater than the situation in classroom B-S1 (6.8–10.0 dBA). Also, the speech level contours in Figure 4(b) are denser than in Figure 4(c), indicating that the distribution of speech level is more inhomogeneous in the former case.
Figure 5 shows the variation in speech level among speaker orientation ranged from
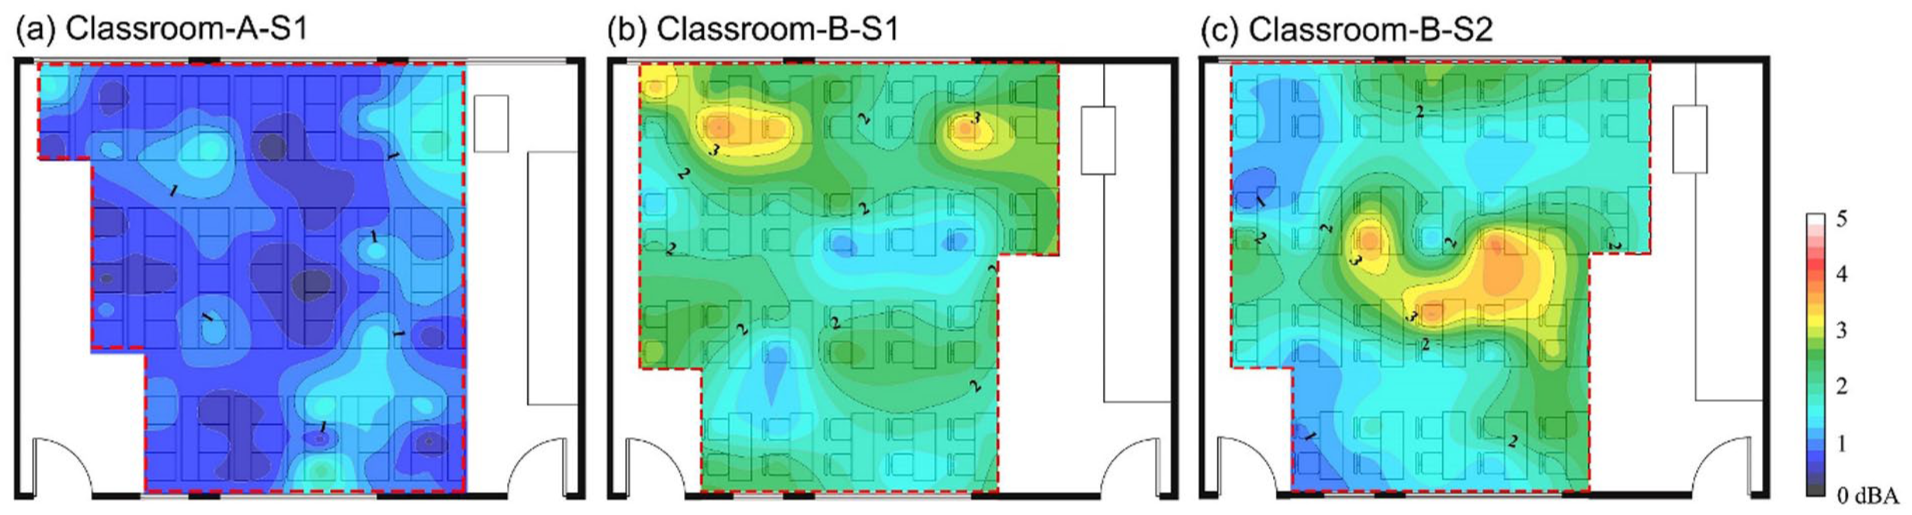
Distribution of the variation in speech level among speaker orientation ranged from –90° to 90° for different classrooms and speaker positions: (a) classroom A-S1, (b) classroom B-S1, and (c) classroom B-S2.
Figure 6 shows the percentage of speech level over all receiving points, which is obtained by counting the number of receiving points detecting a given range of speech level and dividing by the total number of receiving points. Note that the acoustic treatment of classroom B significantly reduces the speech level, especially in the back row (see Figure 4(b)). For classroom B-S2, the speech level at more than 70% of the receiving points exceeds 61 dBA. However, in classroom B-S1, only about 30% of students typically have a speech level exceeding 61 dBA. This result provides more evidence that the teacher’s speech level improves significantly for most listeners of the classroom when the teacher departs from the podium during class to lecture from the center of the classroom. The speech level in classroom A is essentially independent of speaker orientation, presumably because of the lack of acoustic treatment (Figure 6(a)). In classroom B-S1, as the speaker orientation increases from
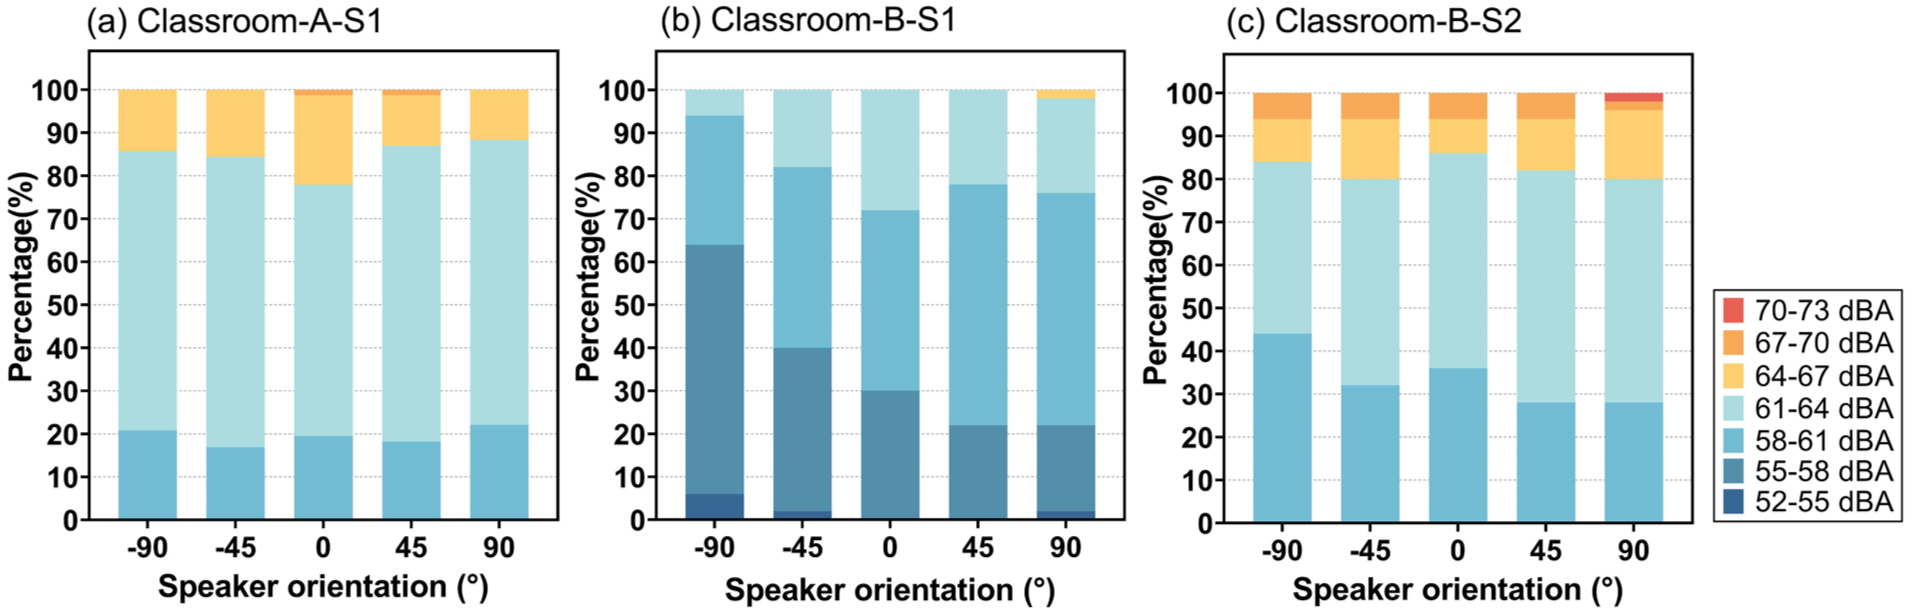
Percentage of speech level over all measurement points as a function of speaker orientation in the different classrooms: (a) classroom A-S1, (b) classroom B-S1, and (c) classroom B-S2.
Calculated speech transmission index
Figure 7 shows the STI values under various speaker orientations at different receiving points in classrooms A-S1, B-S1, and B-S2 for normal vocal effort and raised vocal effort. Figure 8 shows the maximum values, minimum values, range of variation, mean, and standard deviation (SD) of STI at different receiving points and for different speaker orientations.
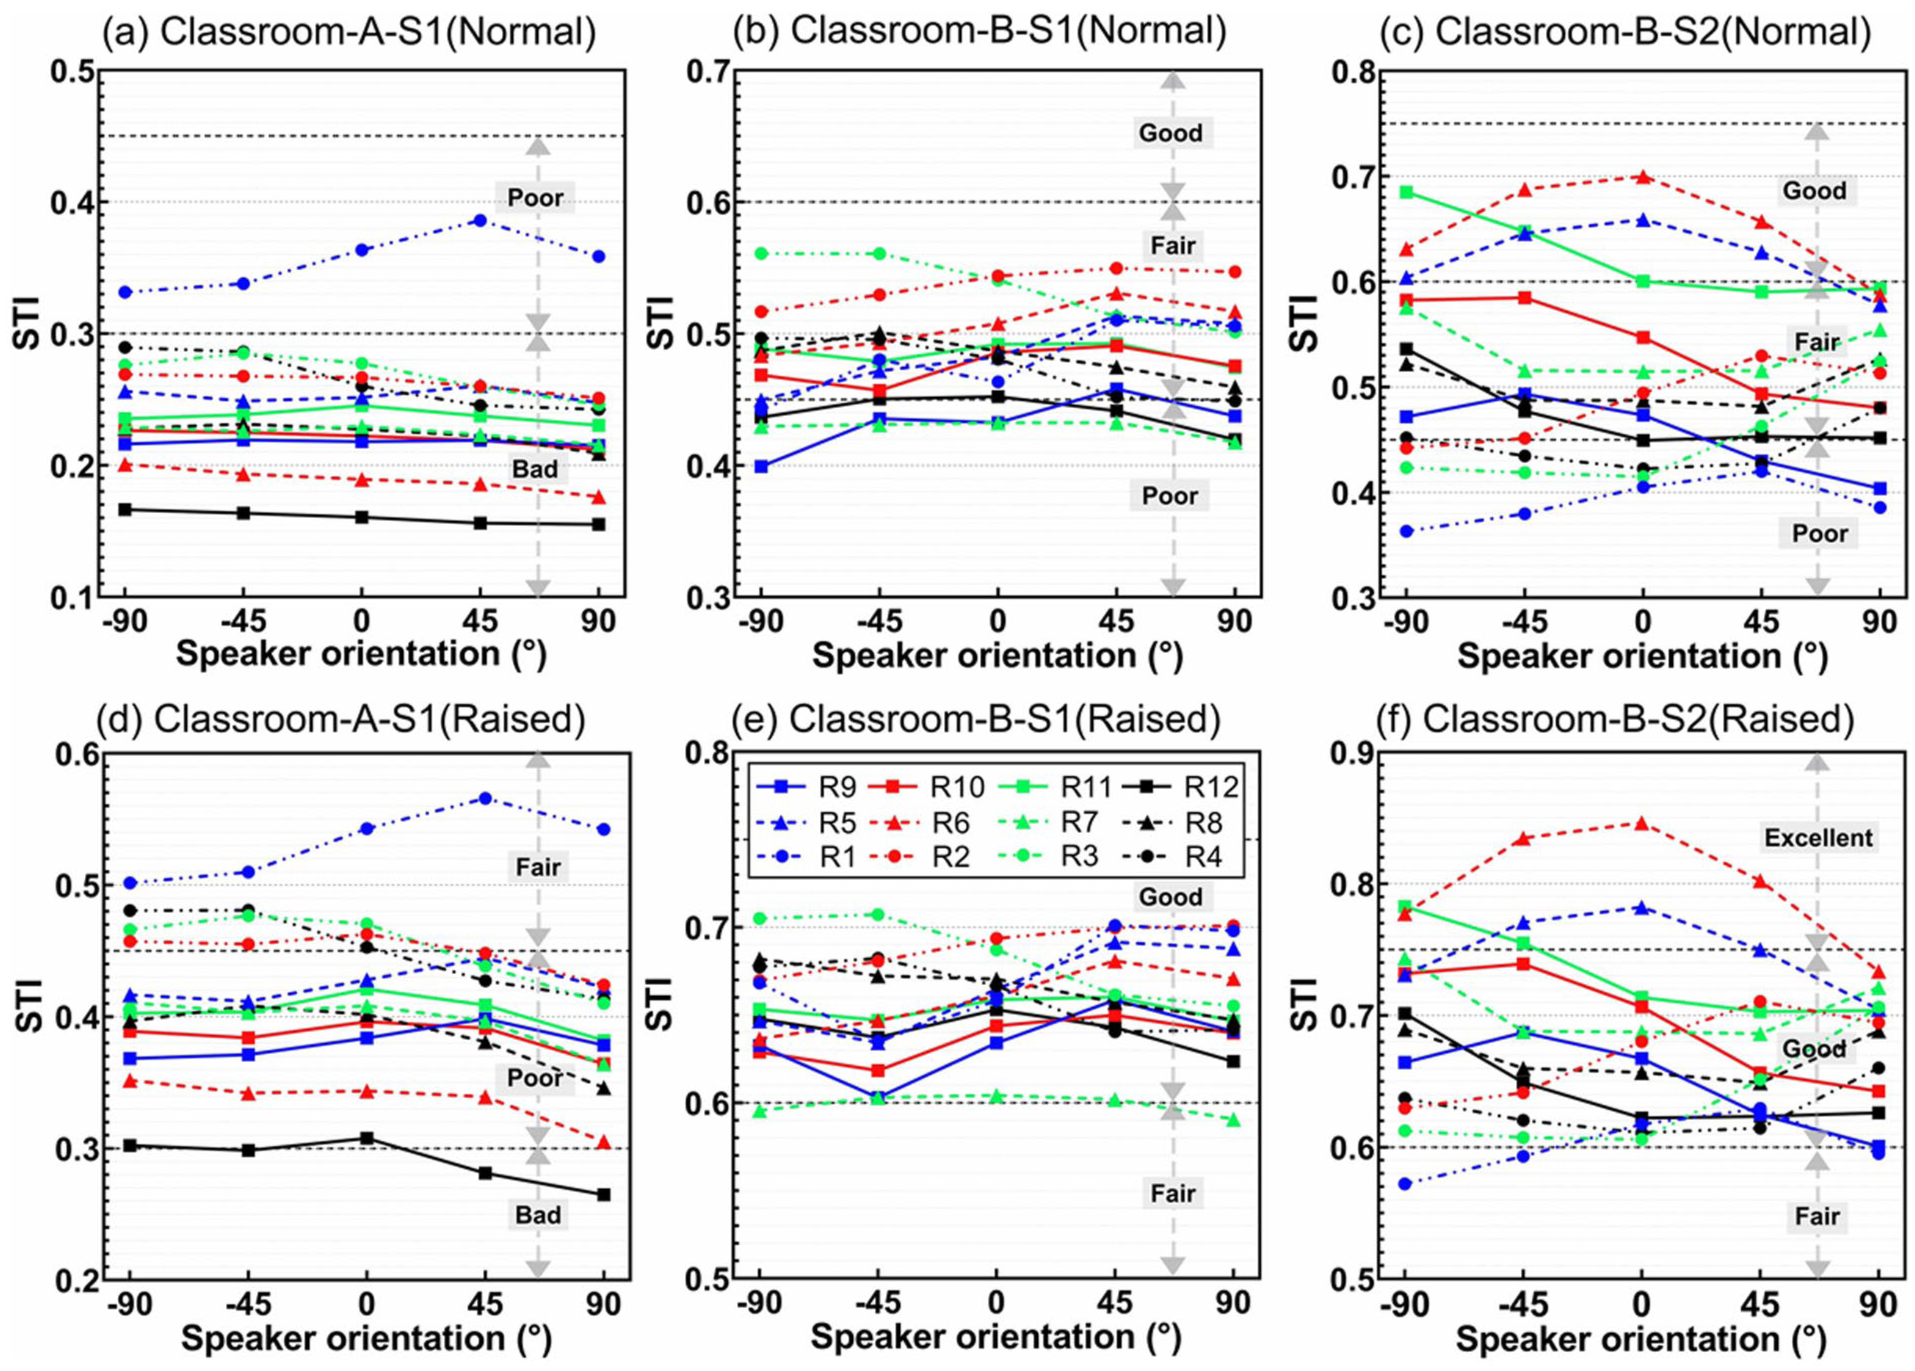
STI as a function of speaker orientation at 12 receiving points with normal vocal effort (a-c) and raised vocal effort (d-f). Normal vocal effort: (a) Classroom-A-S1; (b) Classroom-A-S2; (c) Classroom-B-S2. Raised vocal effort: (d) Classroom-A-S1; (e) Classroom-A-S2; (f) Classroom-B-S2. The rating of SI qualification for the STI values are marked in the figures.
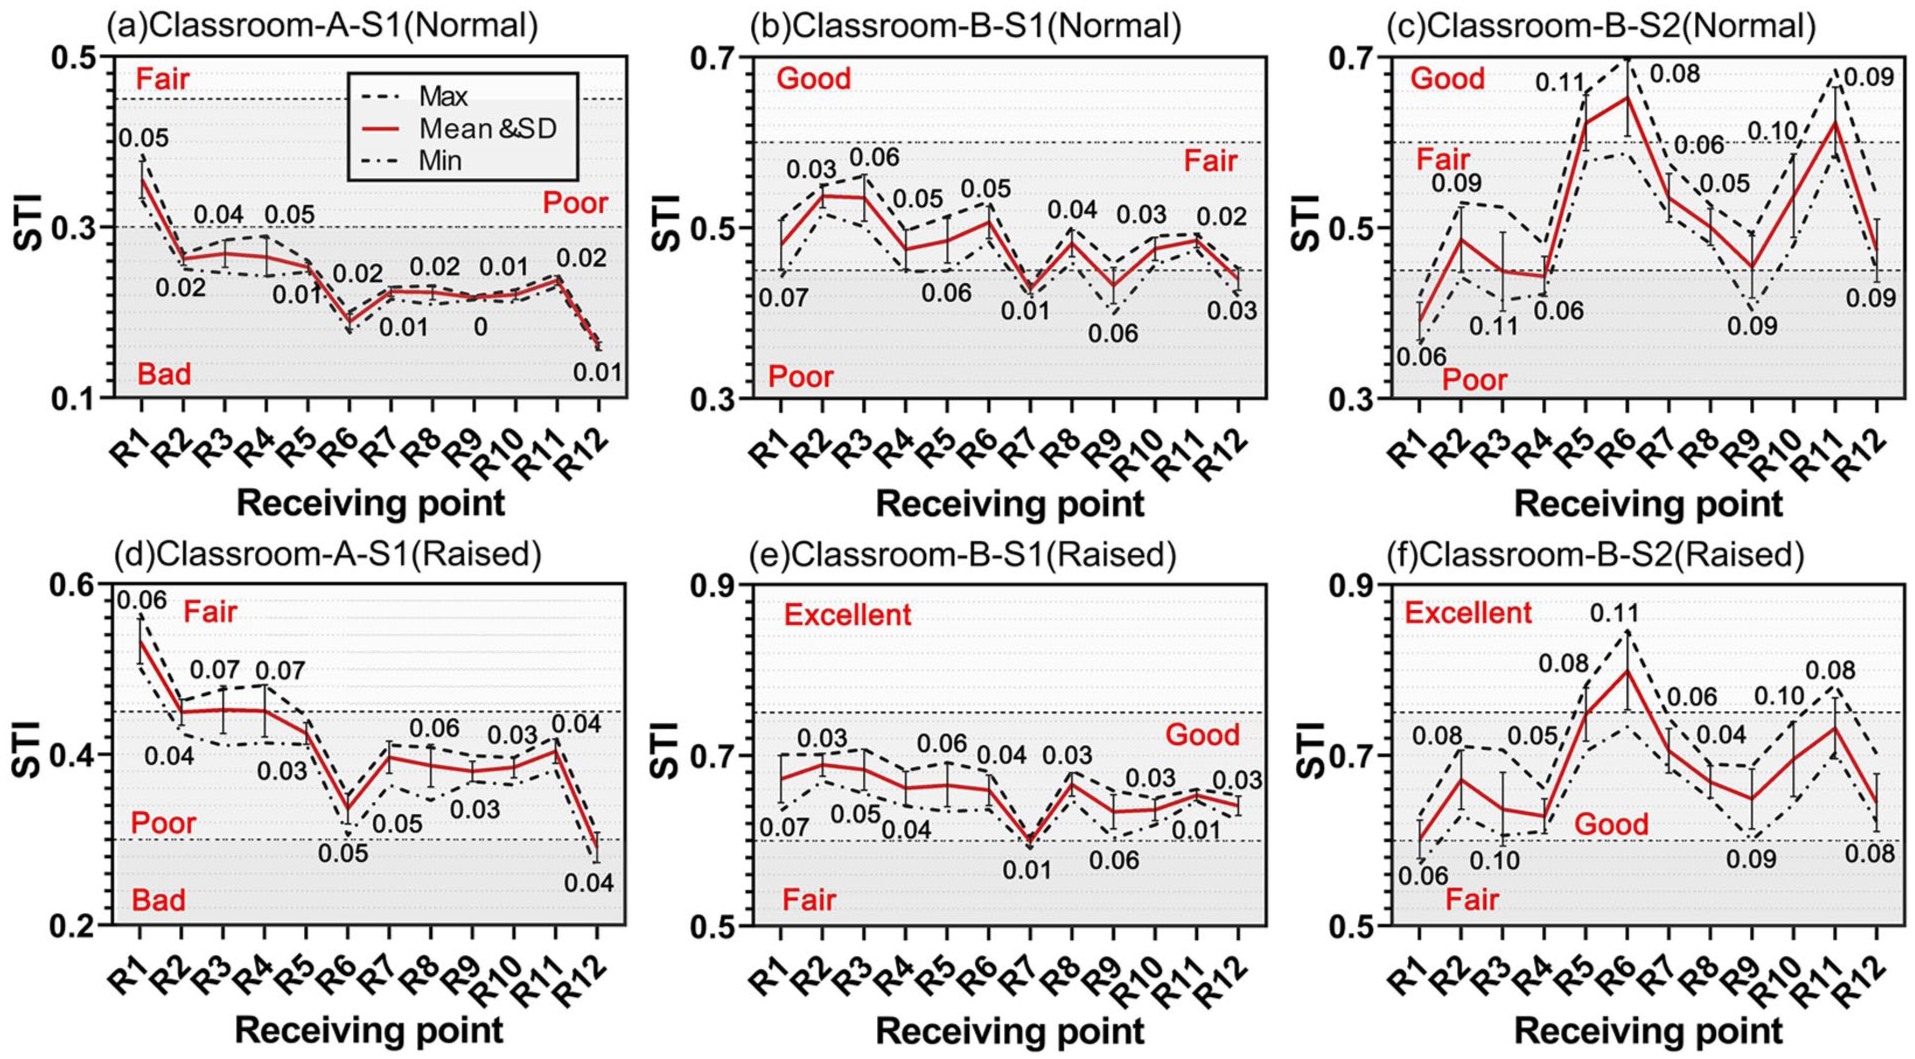
Maximum, minimum, range of variation, mean, and SD of STI at different receiving points under different speaker orientations. Normal vocal effort: (a) Classroom-A-S1; (b) Classroom-A-S2; (c) Classroom-B-S2. Raised vocal effort: (d) Classroom-A-S1; (e) Classroom-A-S2; (f) Classroom-B-S2. The range of STI variation due to speaker orientation is given in black font on the graphs.
In classroom A-S1 (see Figure 7(a) and (d)), the maximum STI generally occurs at a speaker orientation of
In classroom B-S1 (see Figure 7(b) and (e)), the maximum STI generally occurs at a speaker orientation of
In classroom B-S2, the dependence of STI on speaker orientation conforms to the radiation law of the speaker. In other words, the STI depends on the distance of the receiving point from the speaker and the angular deviation from the directional axis of the speaker. The smaller the deviation, the larger the corresponding STI. For example, as shown in Figure 8(c) and (f), the STI at R5 and R6 is maximal (minimal) at the speaker orientation of
The STI depends more strongly on speaker orientation when the speaker is in the center of the classroom (S2) than when the speaker is at the podium (S1). This result may be attributed to the fact that the absolute deviation from the directional axis of the speaker caused by a departure from
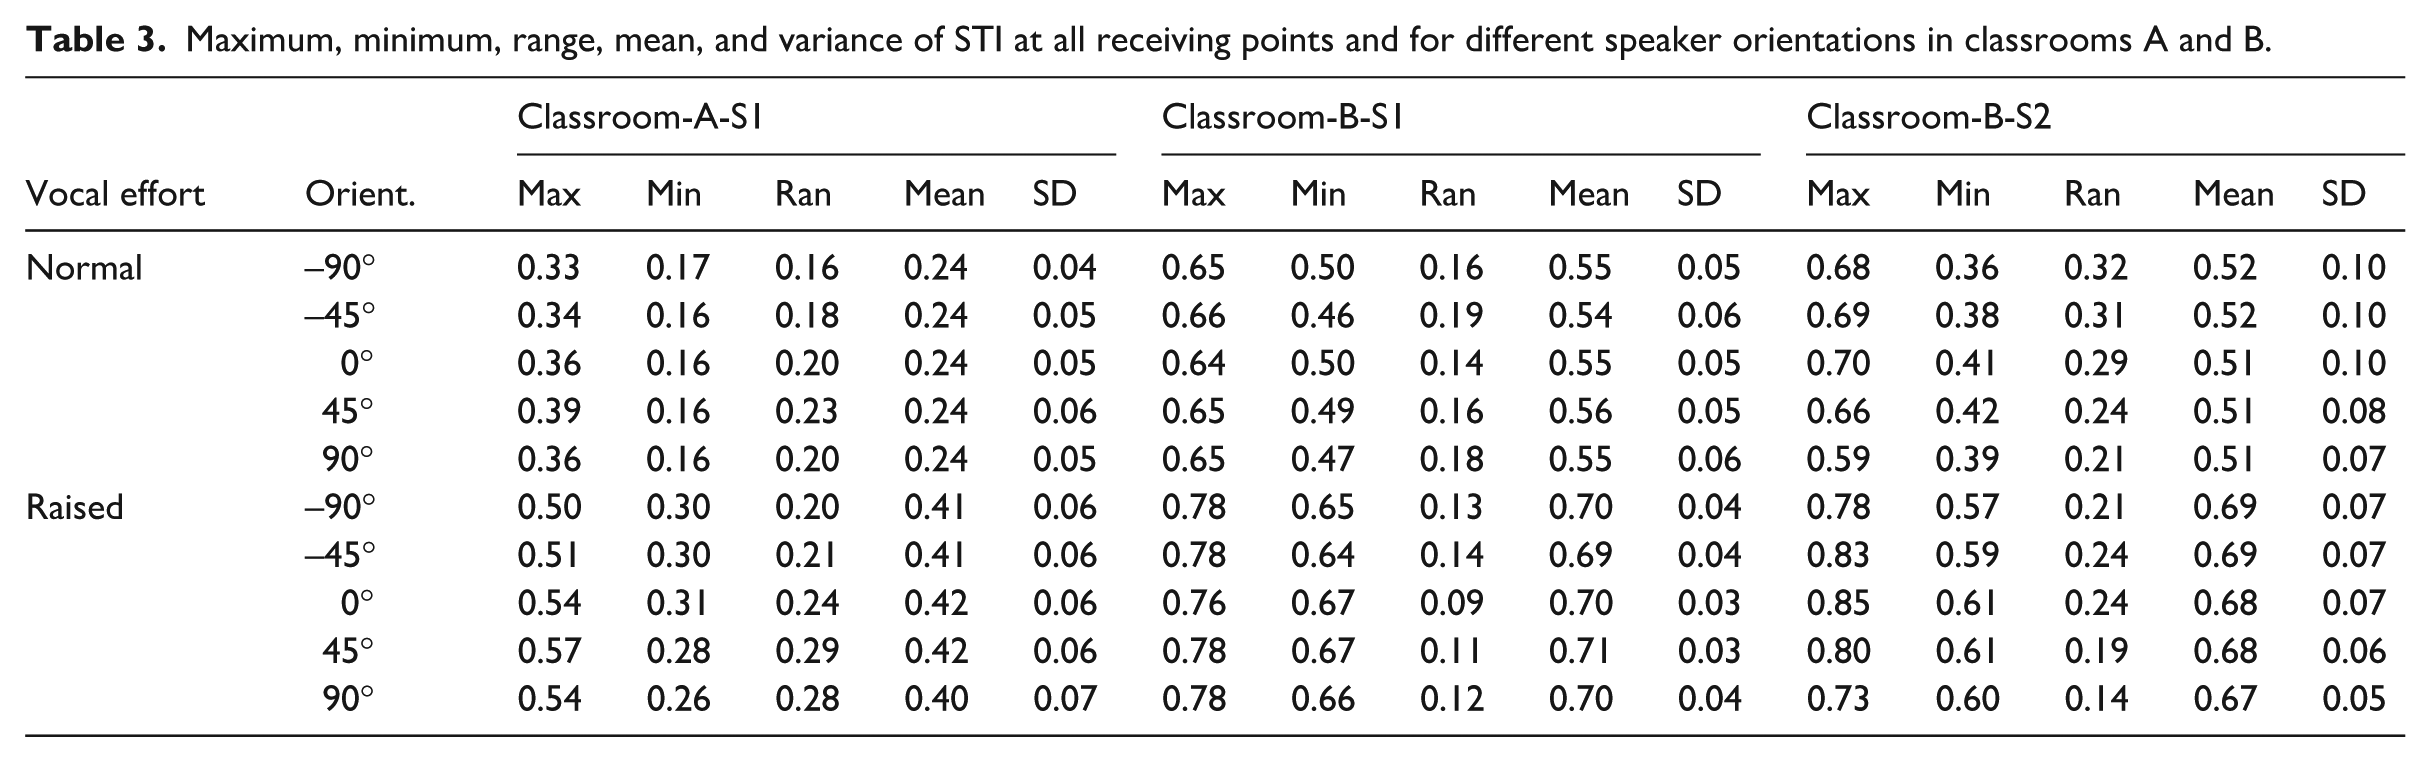
The statistical results of STI for all receiving points and for different speaker orientations are presented in Table 3. When the speaker is at the podium in classroom A (no acoustic treatment), STI varies more (reaching 0.29) over receiving points than in classroom B (with acoustic treatment; mostly within 0.19). This phenomenon is also inconsistent with the previous results of speech level (see Figure 5). In both classrooms, the average STI over all receiving points does not vary by more than 1 JND. Moreover, in classroom B, the STI variations are larger over the receiving points when the speaker is in the center of the classroom rather than at the podium. The maximum average STI value occurs for the speaker orientation of
Maximum, minimum, range, mean, and variance of STI at all receiving points and for different speaker orientations in classrooms A and B.
Subjective SI score
Figure 9 shows the Chinese SI scores at various receiving positions and speaker orientations for classrooms A-S1 and B-S1. Figure 10 shows the statistics of SI scores at different receiving points in classrooms A and B. SI scores are usually higher in classroom B than in classroom A. Most of the SI scores for classroom B (A) are between 80% and 90% (60% and 80%). In classroom A, SI scores depend more strongly on speaker orientation and receiving point than in classroom B. This result is mainly due to the ceiling effect on SI scores: above a threshold SI score, any improvement in the SNR or decrease in RT only slightly improves the subjective SI score.
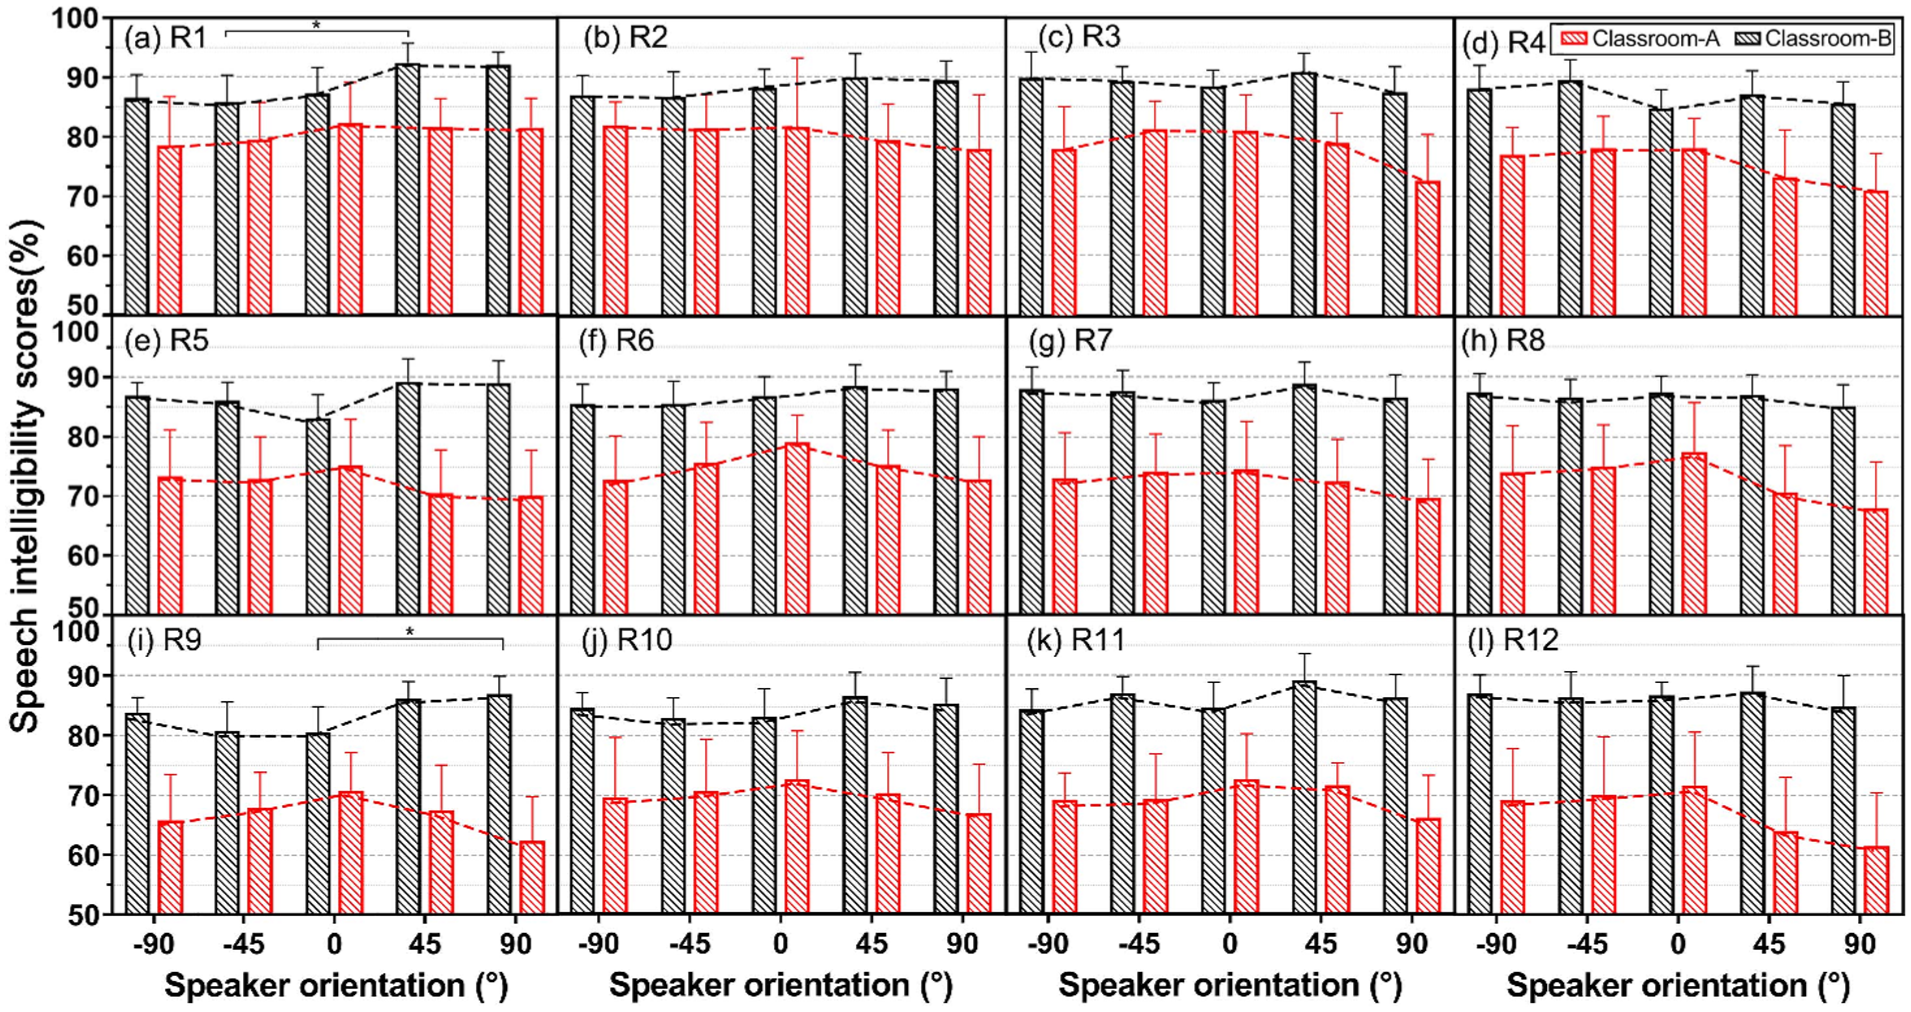
SI scores as a function of speaker orientation for various receiving points in Classrooms A and B with the speaker at the podium (S1).
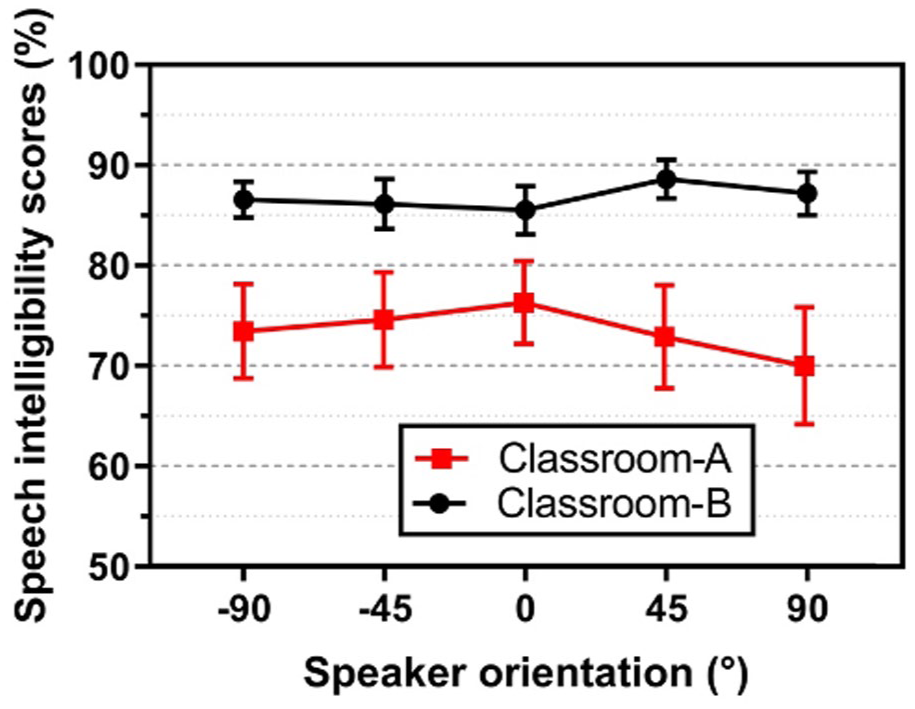
Chinese SI scores averaged over receiving points as a function of speaker orientation.
In classroom B, the SI scores for most receiving points reach a maximum at
Statistics of SI scores at different receiving points in Classrooms A and B.
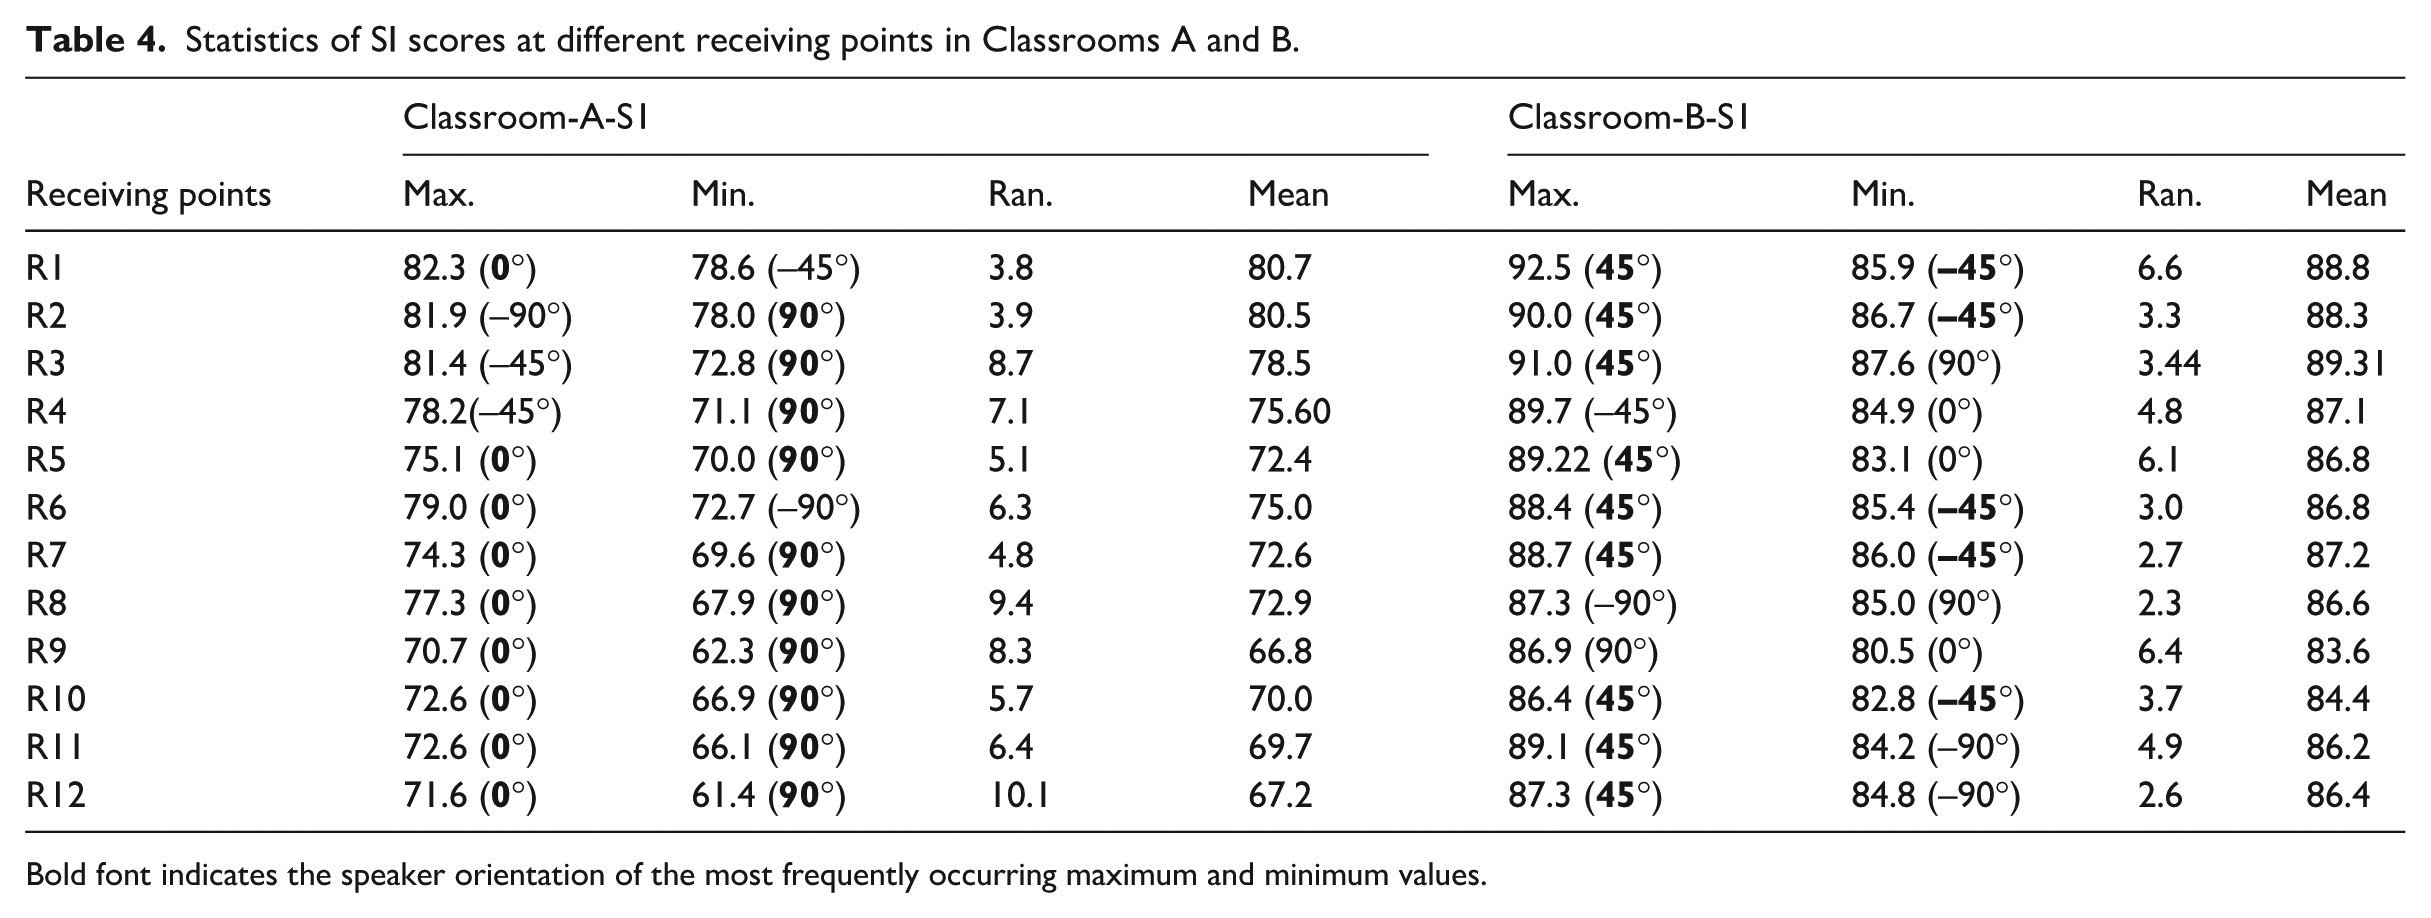
Bold font indicates the speaker orientation of the most frequently occurring maximum and minimum values.
Figure 10 shows the Chinese SI scores for various speaker orientations averaged over different receiving points. The average SI scores in classroom B depend relatively little on varied speaker orientations, with scores around 85% and minimal deviation, reaching a maximum score for a speaker orientation of
A two-way analysis of variance shows that, in classroom A, speaker orientation significantly affects Chinese SI scores [
Discussion
Effect of speaker orientation on SI
Speaker orientation considerably affects SI in classrooms and causes significant differences in objective acoustic indicators (speech level, RT, SNR, and STI). The sensitivity of these results to speaker orientation depends on the speaker position, the acoustic treatment of the classroom, and the receiving point.
A speaker at the podium produces good SI when the speaker faces the majority of the audience or faces straight ahead. For example, in classroom A (no acoustic treatment), only the rightmost column of receiving points (R1, R5, and R9) reports maximum SI when the speaker is directly facing them (
When the speaker is in the center of the classroom, the receiving points near the main directional axis of the speaker tend to have higher speech levels and STI, while a higher degree of deviation means lower values, as shown in Figures 4 and 7. This result is explained by the short speaker-receiver distance in this case, so the direct sound field dominates, and the speech level and STI depend mainly on the directional pattern of the sound produced by the speaker.
Changing the speaker orientation changes the speech level by nearly 3 dBA (Figure 5). It can also change the STI by up to 0.11 (nearly 4 JND; Figure 8) and the Chinese SI score by over 10% (Table 4). Caniato et al.
51
reported that a speaker at the podium facing the students or the blackboard causes a difference in the STI of no more than 0.07. The STI difference resulting from the speaker orientation in the present study is comparable to the finding of Caniato et al.
51
Liang and Yu
47
reported that, in the absence of reflected sound, rotating the axis of the mouth simulator away from the listener’s direction by
Speaker orientation affects SI in a similar but weaker way than the directivity pattern, which is related to the spatial distribution of the radiated sound field. Zhu et al. 44 reported that (i) the difference in STI measured from an omnidirectional loudspeaker and a mouth simulator is 0.093; (ii) the difference in STI measured from an omnidirectional loudspeaker and an ordinary directional loudspeaker is 0.125; and (iii) the difference in STI measured from an ordinary directional loudspeaker and a mouth simulator is 0.147. Some studies report that teachers wearing face masks in the classroom change the STI by over 5 JND. 50 Thus, the source directivity pattern more strongly affected indoor SI in previous studies than does speaker orientation in the present study. The main explanation for this phenomenon is that, unlike using sound sources with different directional patterns (regardless of whether such systems are equalized and calibrated) or teachers wearing masks, changing the orientation of a specific sound source (artificial mouth) does not affect its radiated sound energy but only changes the spatial (directional) distribution thereof. 48
Effect of acoustic treatment on SI
Acoustic treatment produces a significant difference in SI and also affects the results of speaker orientation. In classroom B (with acoustic treatment), the overall speech level (57.8–59.4 dBA) is significantly lower than that in classroom A (no acoustic treatment; 62.1–62.5 dBA; Figure 4). It suggests that a classroom without acoustic treatment is more conducive to achieving a higher SNR, as internal reflection boundaries can greatly improve the speech level. However, due to the longer RT of classroom A (no acoustic treatment; Table 1) and larger noise level (Figure 2), its STIs are much less than those of classroom B even though its speech levels are much larger than that of classroom B. The former are basically in the range of “Poor” (0.45–0.6) under raised vocal effort condition, while the latter is in the range of “Good” (0.6–0.75), as shown in Figure 7. In practical situations, high reverberation often leads to high noise levels. 4 From this perspective, improving SI in the classroom requires not only adding sound-absorbing boundaries to limit the RT 19 but also arranging the reflective boundaries to better exploit early reflected sound.
Considering the influence of speaker orientation, acoustic treatment affects the speech level in the opposite way than the STI. In classroom A (no acoustic treatment), the speech level depends more weakly on speaker orientation than in classroom B (Figure 4). This phenomenon may be due to the more uniform sound field in classroom B, where a large number of reflection interfaces provide reflected sound that can largely compensate for the disadvantage of weak direct sound or lower speech level when the speaker orientation deviates from the receiving point. Speaker orientation in classroom A affects the STI similarly as in classroom B, although this result is inconsistent with the speech level differences between the two classrooms (Figure 8). The subjective Chinese SI score shows that the high SI and limited ceiling effect in classroom B means that the Chinese SI score as a function of speaker orientation usually varies by less than 5% (Figure 9). In classroom A (no acoustic treatment), speaker orientation significantly affects the Chinese SI score, with almost all receiver points reporting a 5%–10% improvement in intelligibility due to a favorable speaker orientation (i.e.
Effect of speaker position on SI
Speaker position also affects SI scores. For example, when the speaker is in the center of the classroom, the proximity between the speaker and the listener means that the overall speech level is over 3 dBA greater than when the speaker is at the podium. However, having the speaker in the center of the classroom also makes the speech levels more inhomogeneous (Figure 4). The STI also reveals a similar phenomenon. These findings suggest that teachers should step down from the podium and move to the center of the classroom to lecture, which can enhance teaching interaction and improve students’ SI and learning.
In addition, when the speaker is in the center of the classroom, the speech levels vary slightly less as a function of speaker orientation than when the speaker is at the podium, except for R1–R4 in the front row. However, the STI results are inconsistent with the speech level results, which show that when the speaker is in the center of the classroom, the STI as a function of speaker orientation varies more than when the speaker is at the podium. The former exceeds 2 JND (sometimes even close to 4 JND), whereas the latter does not. In many situations (such as the rear-row receiving points R10–R12), the variations do not exceed 1 JND (Figure 8). The mismatch between the speech level results and the STI results may be attributed to the dependence of RT on speaker orientation.
Overall, placing the speaker in the center of the classroom facing the back of the classroom (
Limitations and future research
This study investigated how factors such as the position and orientation of speakers affect SI in small-sized university classrooms with volumes under 300 m3. The results show that these factors significantly affect speech level, STI, and Chinese SI score. This suggests that in small university classrooms where natural speech is employed, the acoustic design should prioritize enhancing intelligibility under poor speaker orientation conditions. For instance, to improve intelligibility when the lecturer faces the blackboard, one option might be to consider strategically enhancing the early reflections provided by the front of the classroom, such as the blackboard. However, this study has limitations. The experiments were conducted in two university classrooms of similar dimensions, but the size, shape, and acoustic conditions of the classrooms may affect the results. To control the experimental conditions, crowd noise that is always present in actual teaching activities and outdoor noise was not considered. Future research should consider different classrooms, noise sources, long-term acoustic environments, and listener differences. Nevertheless, this study still provides valuable insights for university classroom design and acoustic treatment, emphasizing the importance of optimizing speaker position and orientation and providing practical guidance for improving SI.
Conclusions
This study comprehensively investigates the speech level, RT, SNR, STI, and Chinese SI scores under different speaker orientations and positions in two small-sized university classrooms: one without acoustic treatment and one with. The results indicate that speaker orientation significantly affects SI in classrooms. With the speaker at the podium, favorable intelligibility outcomes are obtained when the speaker faces the majority of the audience or directly ahead. When the speaker is in the center of the classroom, receiving points aligned with the speaker’s main directional axis experience higher speech levels and STI. Overall, the observed dependence of SI on speaker orientation is generally lower than that reported in previous studies conducted in listening rooms and those resulting from source directivity patterns. Varying the speaker orientation can result in a speech level and SNR variance of approximately 3 dBA and an STI variation of up to 0.11. Acoustic treatment greatly improves SI in classrooms. However, the dependence of STI on speaker orientation is approximately the same in both classrooms. Placing the speaker in the center of the classroom significantly improves SI in terms of speech level and STI. However, having the speaker in the center of the classroom also makes speech level and STI results more sensitive to speaker orientation and listener position. A classroom with good acoustic conditions has adequate SI scores for any speaker orientation. However, classrooms with poor acoustic conditions can considerably improve intelligibility scores by 10% by appropriately orienting the speaker, especially for listeners in adverse conditions. This study highlights how speaker orientation and position affect intelligibility, offering insights to improve student learning efficiency. In summary, the conclusion outlined above is anticipated. However, this study offers empirical data regarding the effects of speaker orientation and position, which could serve as a reference for future studies.
Footnotes
Acknowledgements
We would like to express our gratitude to all the participants during this study. We also thank Dr. Song Yang for her constructive suggestions on the writing of this paper.
Author contributions
Miao Ren: Data curation, Investigation, Visualization, Formal analysis,Writing - Original draft. Lingling Liu: Data curation, Investigation, Formal analysis. Linda Liang: Investigation, Visualization, Supervision, Conceptualization, Methodology, Project administration, Resources, Writing - review and editing. Guangzheng Yu: Investigation, Resources, Writing - review and editing.
Funding
The authors disclosed receipt of the following financial support for the research, authorship, and/or publication of this article: This work was supported by the Middle-aged and Young Teachers’ Basic Ability Promotion Project of Guangxi (Grant No. 2024KY0028) and the Research Start-up Funding for Inclusive Support Policies for Young Talents (ZX02080030324022).
Declaration of conflicting interests
The authors declared no potential conflicts of interest with respect to the research, authorship, and/or publication of this article.