






Abstract
Introduction
Multiple sclerosis (MS) is an immune-mediated, demyelinating disease of the central nervous system (CNS). Relapsing–remitting MS (RRMS) is defined by relapses of neurological symptoms, caused by transient focal inflammation in the CNS. The initial relapse is termed a clinically isolated syndrome (CIS). In general the neurological symptoms remit completely or partially as inflammation abates. A progressive MS course is characterized by gradually increasing neurological deterioration. Secondary progressive MS (SPMS), with or without superimposed relapses, evolves after an initial relapsing–remitting disease course, whereas primary progressive MS (PPMS) develops without preceding relapses. Histopathological changes in RRMS are mainly characterized by focal inflammation with a perivascular location. Abnormalities in progressive MS (PMS) are more diffuse and the extent to which inflammatory and neurodegenerative mechanisms in PMS are pathogenic is a matter of debate. 1 – 4 However, recent studies indicate that inflammation is prominent in all stages of MS. 2,5
The proinflammatory cytokine osteopontin (OPN) has been studied as a potential key player in the pathogenesis of MS, and as a candidate biomarker. OPN is a pleiotropic protein that can be found in most tissues and body fluids where it participates in diverse physiological and pathological processes such as bone mineralization, cancer biology, atherosclerosis, inflammation, and immunity. 6,7 OPN is critically involved in the initiation and polarization of an adequate cell-mediated T helper type 1 (Th1) immune response, which presumably relies on OPN’s role in the regulation of key cytokines, including interferon-gamma (IFN-γ), interleukin 12 (IL-12), and interleukin 10 (IL-10) in immune cells. 8 – 10 A recent publication suggests that distinct intracellularly acting isoforms of OPN are involved in the regulation of T helper type 17 (Th17) immune response as well. 11 For transmembrane cellular signalling, OPN engages distinct isoforms of the CD44 receptor and several integrins. 7
OPN has been associated with the pathogenesis of different autoimmune diseases. In animal models of autoimmune type 1 diabetes 12 and autoimmune myocarditis 13 OPN expression is increased at the site of inflammation. OPN concentrations in humans are increased in the synovial fluid in rheumatoid synovitis 14 and in plasma in systemic lupus erythematosus 15 and Crohn’s disease. 16 In the animal model of MS, experimental autoimmune encephalomyelitis (EAE), OPN transcripts are increased in the CNS, and OPN can be visualized in neurons and microglia near and within inflammatory lesions by immunohistochemistry. 17 OPN deficient mice and mice treated with anti-OPN antibody have a milder clinical course of EAE, and OPN appears to be necessary for the induction of recurrent disease activity and a progressive disease course. 17 – 19
In human MS plaques OPN transcripts are abundantly expressed, and OPN immunoreactivity is found in microvascular endothelial cells, macrophages, astrocytes, and microglia within or adjacent to active plaques. 17 Increased expression of the OPN transcript in normal-appearing white matter (NAWM) has been observed in SPMS. 20 So far, four studies have reported altered plasma OPN concentrations in RRMS 21 – 24 and two studies have reported on OPN in the cerebrospinal fluid (CSF) from MS patients. 25,26 However, the results of these studies are conflicting. In a recent study we found increased CSF concentrations of OPN in RRMS patients with high disease activity, scheduled for treatment with natalizumab, and we found that treatment resulted in a significant decrease in CSF concentrations of OPN. 27 The objective of the present study was to examine the extent to which CSF OPN concentrations are increased across the clinical spectrum of MS, and whether OPN levels in the CSF are associated with disease activity.
Materials and methods
Patient material
Characteristics of the cohorts studied
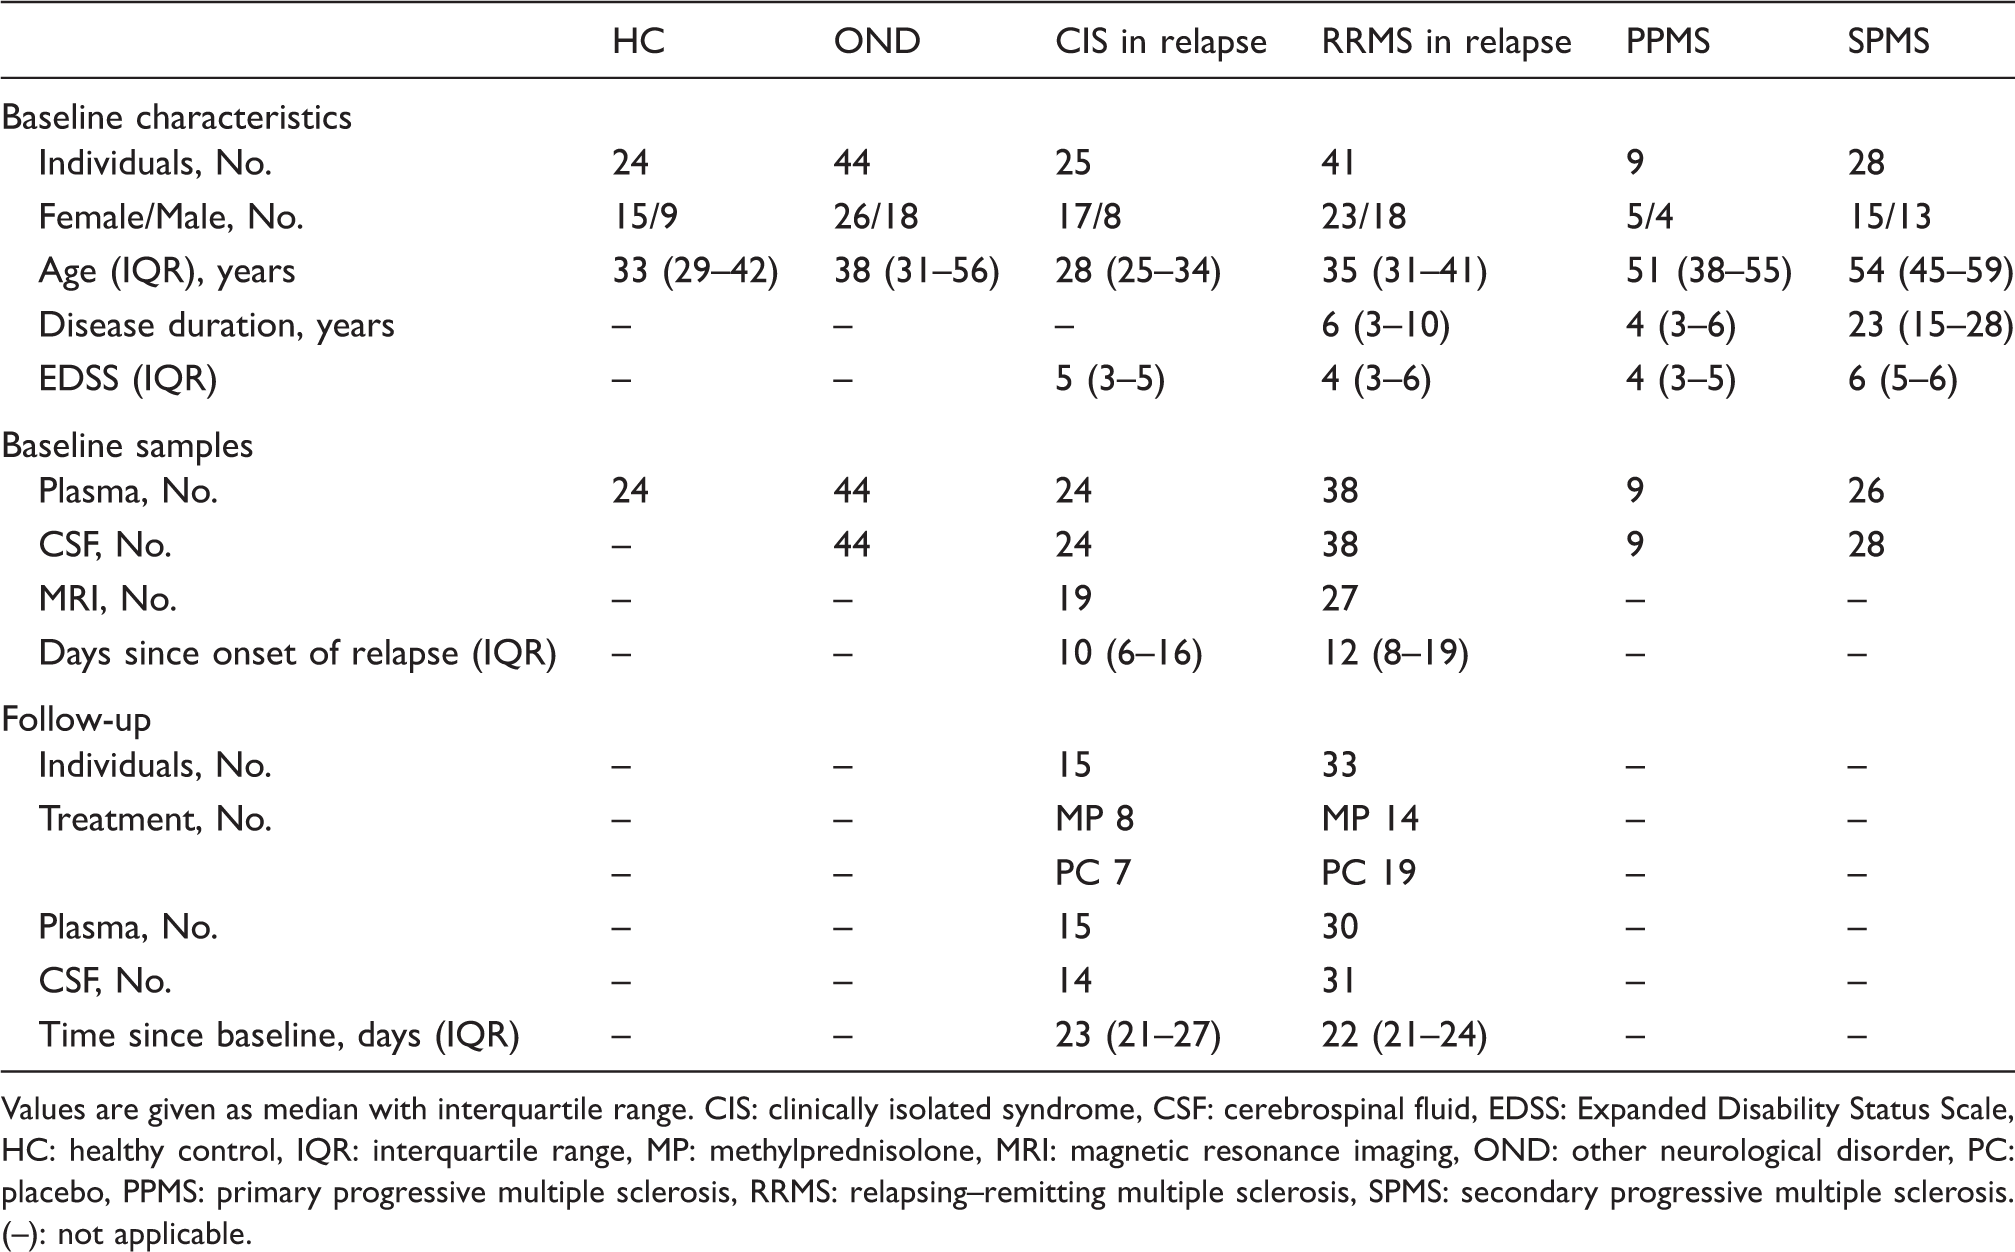
Values are given as median with interquartile range. CIS: clinically isolated syndrome, CSF: cerebrospinal fluid, EDSS: Expanded Disability Status Scale, HC: healthy control, IQR: interquartile range, MP: methylprednisolone, MRI: magnetic resonance imaging, OND: other neurological disorder, PC: placebo, PPMS: primary progressive multiple sclerosis, RRMS: relapsing– ([a-z]+) multiple sclerosis, SPMS: secondary progressive multiple sclerosis. (–): not applicable.
Standard protocol approvals, registration and patient consents
The study was approved by the Copenhagen County regional scientific ethics committee and the local ethics committees of Karolinska University Hospital and Karolinska Institute, and written informed consent was obtained from all participants.
CSF and plasma samples
After lumbar puncture CSF samples were centrifuged and the cell-free supernatant was stored frozen at −80°C. Ethylenediamine tetraacetic acid (EDTA) or citrate plasma was obtained by venous puncture. Plasma was isolated by centrifugation and stored at −80°C until use.
OPN concentrations in plasma and CSF
OPN concentrations in CSF were measured using a commercially available enzyme-linked immunosorbent assay (ELISA) kit (Quantikine ELISA kit, R&D Systems Europe, Abingdon, UK) according to the manufacturer’s instructions. The lower limit of detection was 0.313 ng/ml. For analysis we diluted CSF samples 1:50 and plasma samples 1:25 in assay diluent. All ELISA analyses were conducted by LB, who was blinded to treatment allocation in the treatment trial; information on the diagnosis of individual patient samples was available in order to obtain a balanced proportion of patients and controls on the individual ELISA plates. Baseline and follow-up CSF and plasma samples from a patient were measured on the same plate. Samples were measured in duplicate and mean intra- and interassay coefficients of variation of the assays were below 10%.
Measures of disease activity
Disease activity was determined as CSF concentrations of 1) neopterin, an indicator of IFN-γ mediated macrophage activation, 30 2) myelin basic protein (MBP), a marker of acute demyelination, 31 and 3) tau protein, a marker of neuronal damage. 32 Neopterin was measured by ELISA and MBP was determined by radioimmunoassay, as previously described in detail. 33 Tau protein was measured with an ELISA kit from Innogenetics NV (Gent, Belgium). Furthermore, other routine CSF parameters such as cell count and immunoglobulins (Igs) were acquired.
Magnetic resonance imaging (MRI) of the brain and brain stem was carried out on a 1.5 T Siemens Magnetom (Siemens, Erlangen, Germany) using a T1-weighted sequence with a repetition time (TR) of 520 ms and an echo time (TE) of 15 ms, and a T2-weighted sequence with two spin echoes (TR = 2500 ms, TE = 15 and 90 ms). The T1-weighted pulse sequence was repeated approximately 10 min after the intravenous injection of gadolinium-diethylenetriaminepentaacetic acid (Gd-DTPA) (0.1 mmol/kg body weight). The images (24 contiguous slices sized 230 mm x 230 mm; pixel size 0.90 mm x 0.90 mm; slice thickness 5 mm) were transferred to a Sun SPARCstation (Sun Microsystems, Palo Alto, CA, USA) for quantitative analysis of the volume of enhancement using the DispImage software (D L Plummer, University College London, London, UK). 34 The results of T2-weighted MRI were classified as normal, highly suggestive of MS (Paty grade 1a or 1b), or with lesser abnormalities. 35
Data analysis and statistical methods
Data are given as median values with interquartile range (IQR). In cross-sectional analysis differences between more than two groups were assessed with the Kruskal–Wallis test. In case of significant differences, the Mann–Whitney U test was used for post hoc analysis of differences between two groups followed by Bonferroni’s correction of the p-values for comparisons. Paired samples were analysed by the Wilcoxon’s test. P-values below 0.05 were considered significant. The relationship between continuous variables was determined by Spearman’s rank correlation analysis with calculation of Spearman’s rank correlation coefficient (rho). To correct for the influence of confounding, demographic factors, additional multivariate regression analyses were conducted. The box plots in Figure 1 and Figure 4 denote median, first and third quartiles, 95% confidence intervals (CIs), outliers (open circles), and extreme values (asterisks).
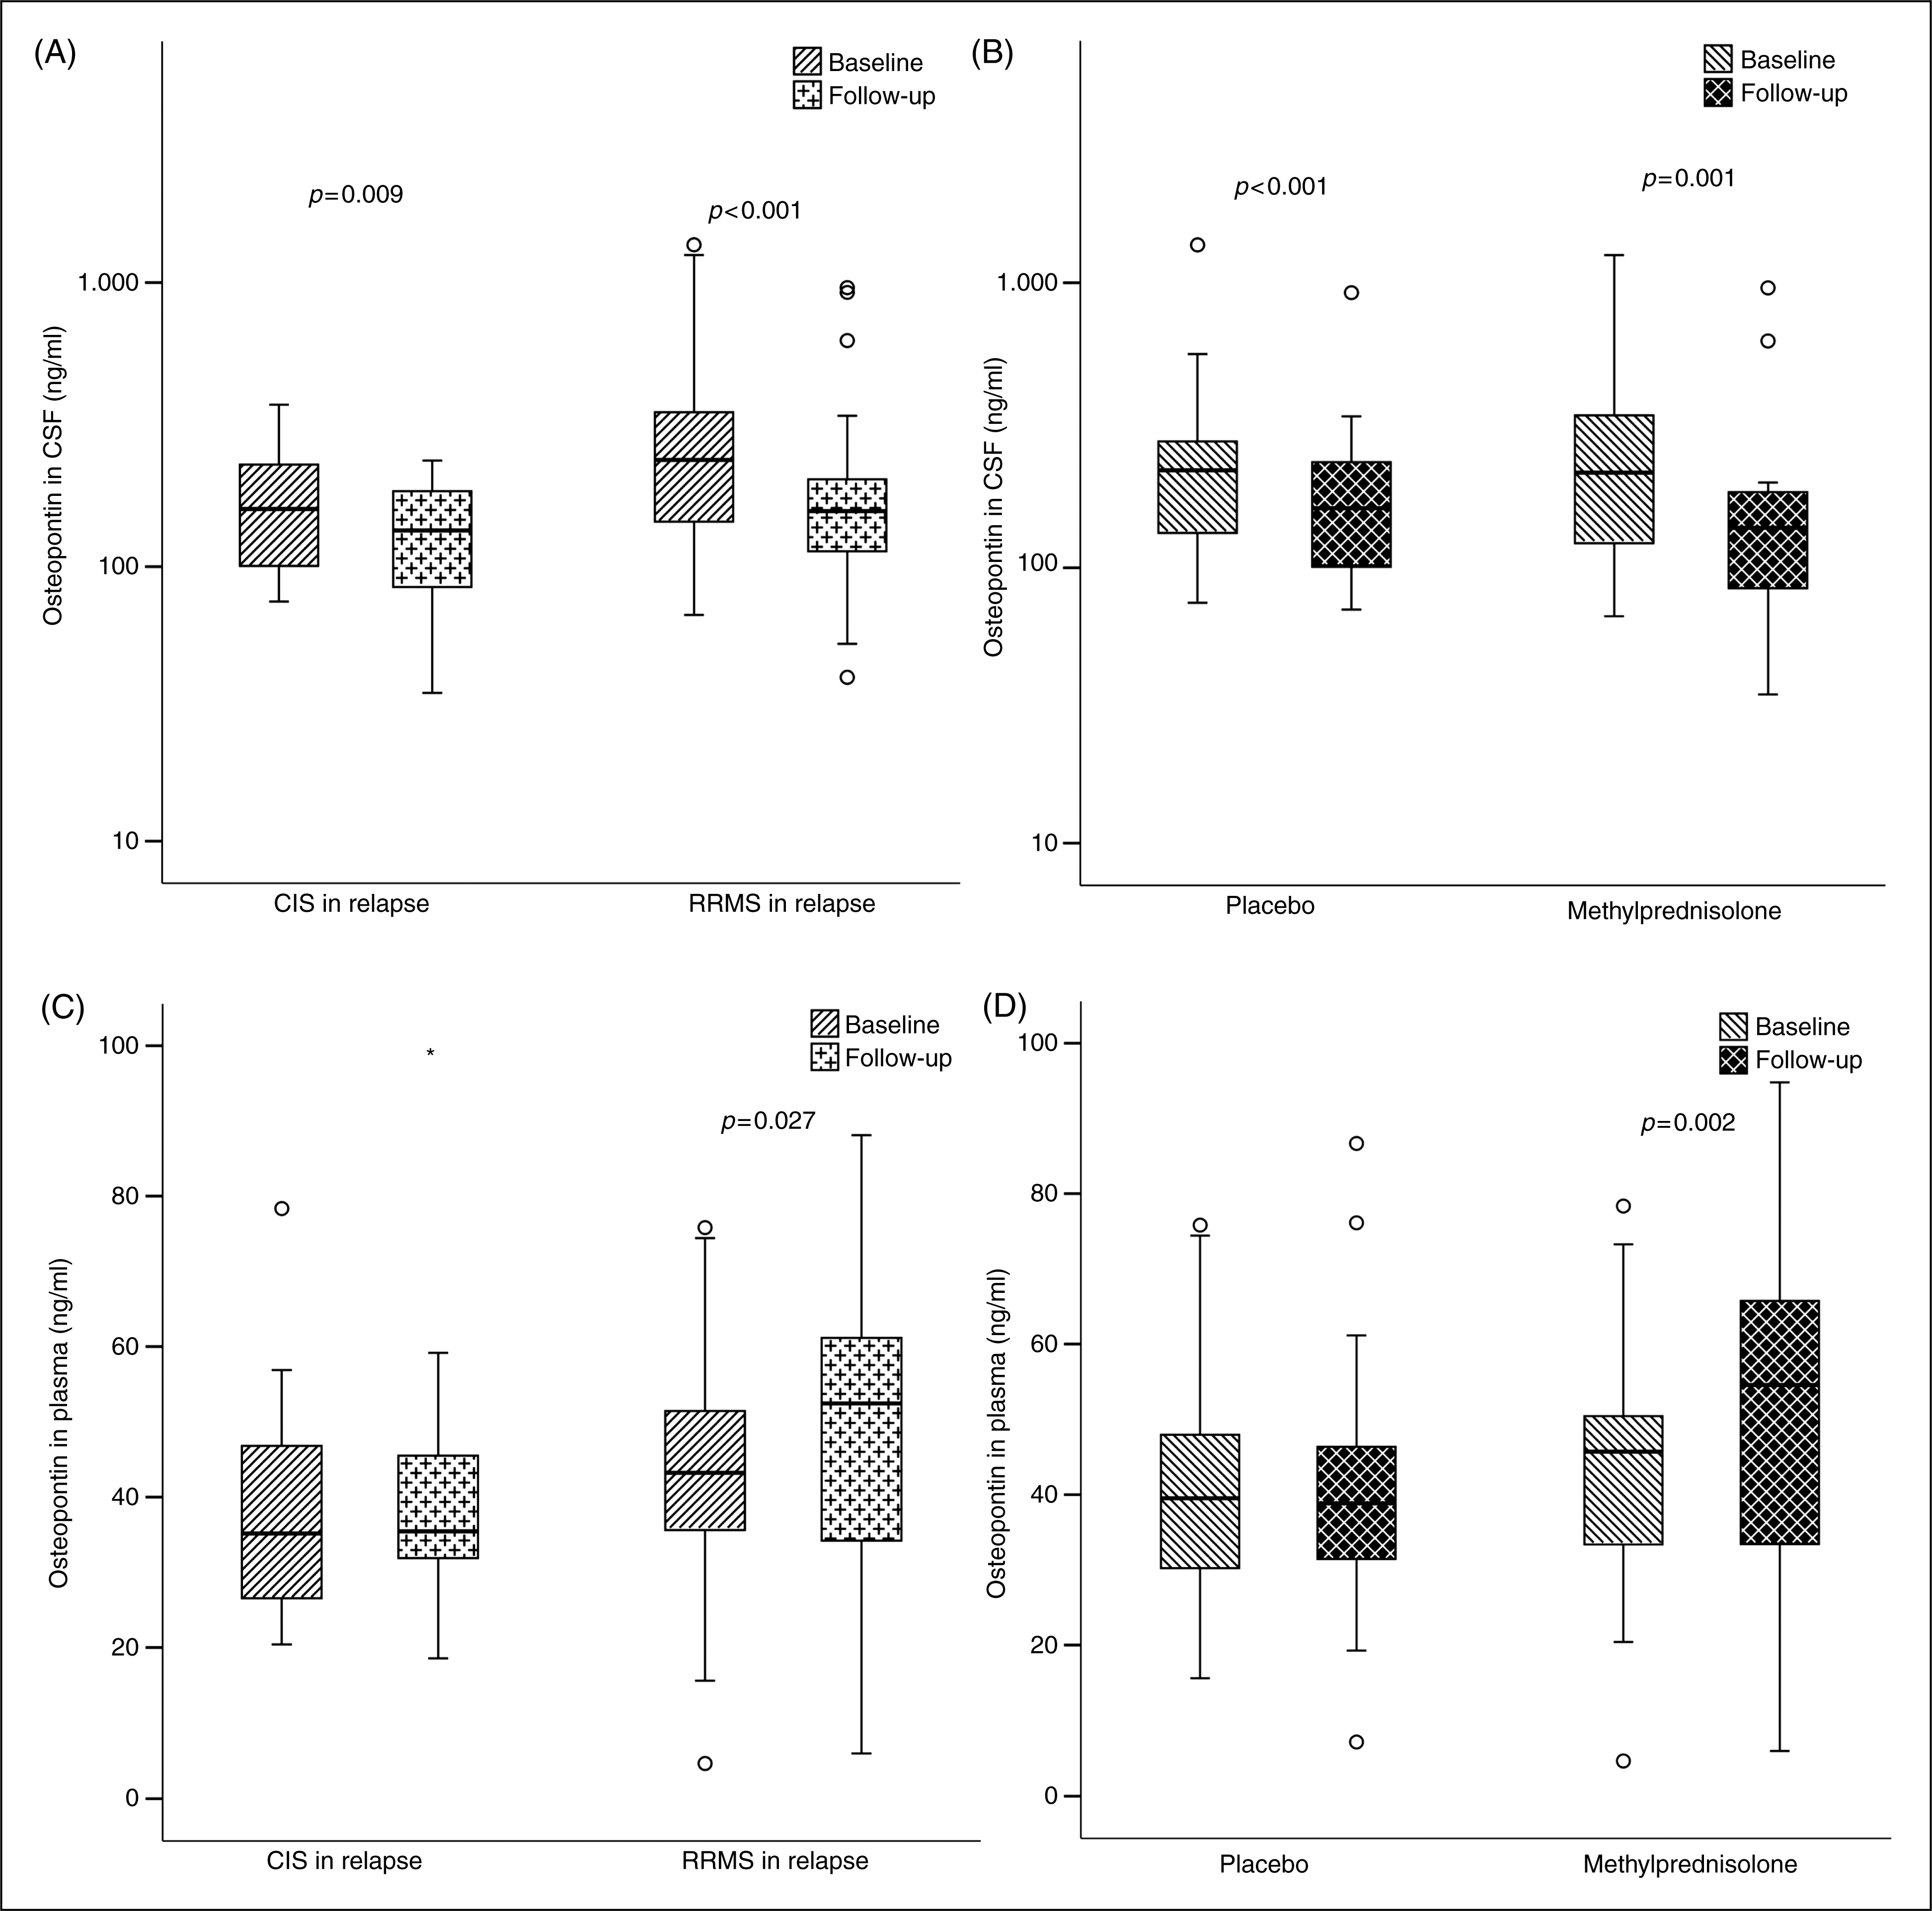
Osteopontin in plasma and in the cerebrospinal fluid (CSF) in multiple sclerosis subtypes. Osteopontin concentrations in plasma of 24 healthy control (HC) subjects and in plasma (panel A) and CSF (panel B) in 44 patients with other neurological disorders (OND), 25 patients with clinically isolated syndromes (CIS), 41 patients with relapsing–remitting multiple sclerosis (RRMS) in relapse, nine patients with primary progressive multiple sclerosis (PPMS), and 28 patients with secondary progressive multiple sclerosis (SPMS). Statistical testing was by the Mann–Whitney U test, p-values given are Bonferroni corrected. *Osteopontin concentrations in the CSF from CIS patients in relapse were significantly increased when cohorts were corrected for age in multivariate regression analysis. Kinetics of osteopontin in the cerebrospinal fluid (CSF) and plasma in response to clinical exacerbation. Graphs show the development of osteopontin concentrations in the CSF (panel A) and in plasma (panel C) in patients with clinically isolated syndrome (CIS) and relapsing–remitting multiple sclerosis (RRMS), sampled median 12 days after onset of relapse (baseline) and median 22 days later (follow-up). The impact of placebo and methylprednisolone treatment on the development of osteopontin concentrations in the CSF (panel B) and plasma (panel D) are shown for cohorts consisting of CIS and RRMS patients. Statistical testing was by the Wilcoxon’s signed rank test.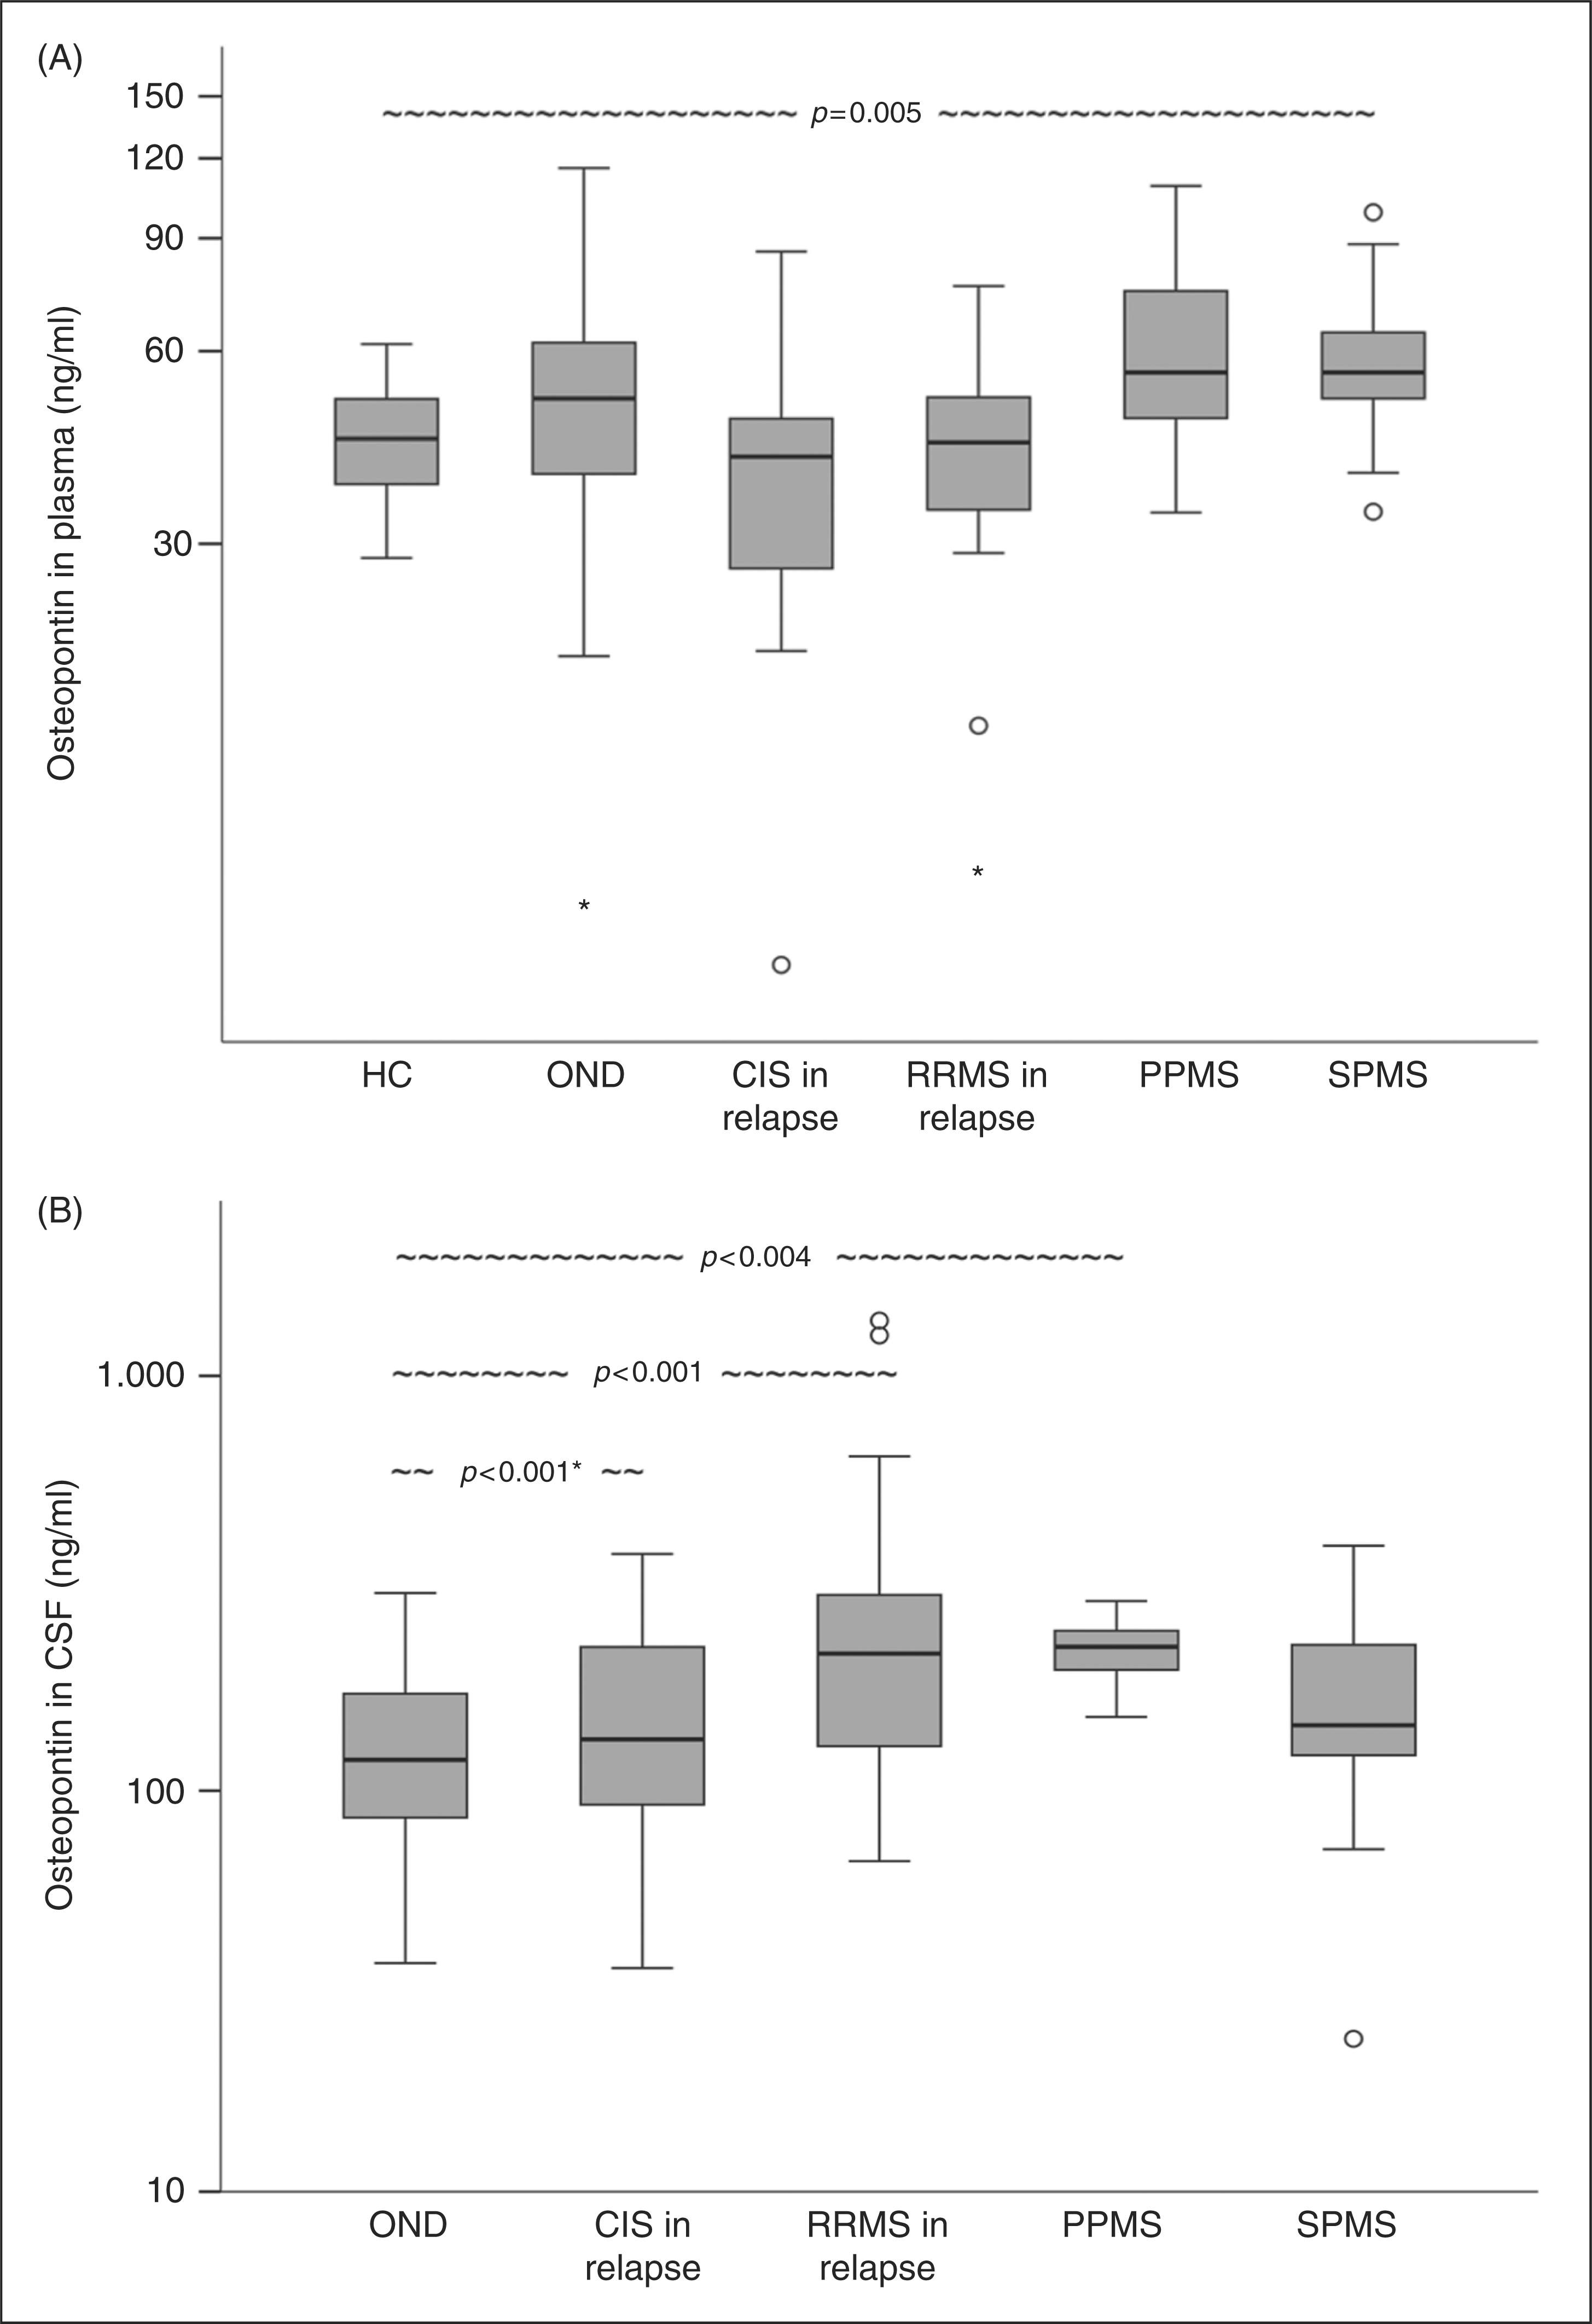
Results
Plasma OPN concentrations
Baseline characteristics of the patient material are given in Table 1. There was no difference in sex distribution in CIS, RRMS, PPMS, and SPMS patients and the neurological and healthy control subjects, but PPMS patients (p = 0.03) and SPMS patients (p = 0.003) were older than the healthy control subjects, and the CIS patients were younger than the neurological control subjects (p = 0.002).
Plasma OPN concentrations in healthy controls (44 ng/ml, IQR 37–51 ng/ml) and other neurological disorders (ONDs) (51 ng/ml, IQR 38–62 ng/ml) did not differ significantly. Plasma OPN concentrations among healthy control subjects were lower in women (38 ng/ml, IQR 35–44 ng/ml) than in men (50 ng/ml, IQR 45–59 ng/ml, p = 0.003) while no difference in plasma OPN concentrations related to sex was found in OND patients (women 49 ng/ml, IQR 39–58 ng/ml; men 55 ng/ml, IQR 33–68 ng/ml). Plasma OPN concentrations did not correlate with age.
Plasma OPN concentrations in CIS (41 ng/ml, IQR 27–47 ng/ml), RRMS (43 ng/ml, IQR 34–51 ng/ml), PPMS (56 ng/ml, IQR 43–75 ng/ml), SPMS (56 ng/ml, IQR 50–64 ng/ml), OND patients, and healthy controls differed significantly (Figure 1A; p < 0.001). SPMS patients had higher plasma concentrations of OPN than the healthy controls (p = 0.005), whereas plasma concentrations of OPN in the CIS, RRMS and PPMS patients did not differ significantly from plasma OPN concentrations in OND or healthy controls.
CSF OPN concentrations
CSF OPN concentrations in OND patients (119 ng/ml, IQR 84–174 ng/ml) were significantly higher than plasma concentrations of OPN (p < 0.001) and correlated weakly with age (rho = 0.439, p = 0.003), but did not differ in male and female patients. CSF OPN concentrations were also higher than plasma concentrations in CIS and all subgroups of MS patients (all p < 0.001). CSF OPN concentrations differed significantly in CIS (133 ng/ml, IQR 92–226 ng/ml), RRMS (215 ng/ml, IQR 127–306 ng/ml), PPMS (223 ng/ml, IQR 195–247 ng/ml), SPMS (144 ng/ml, IQR 121–225 ng/ml), and OND patients (Figure 1B: p < 0.001). Patients with RRMS (p < 0.001) and PPMS (p = 0.004) had significantly higher OPN concentrations in the CSF than the neurological controls. After correction for the difference in age we also found higher CSF concentrations of OPN in CIS than in neurological controls subjects (multivariate regression analysis: p = 0.02 for CIS vs. OND, p = 0.004 for age). CSF concentrations of OPN did not differ in SPMS and OND patients even after correction for the age effect.
OPN concentrations in the CSF and relation to disease activity and disability
As shown in Figure 2,in CIS and RRMS patients in relapse, the CSF OPN concentrations correlated with the area of Gd-enhancement on MRI (rho = 0.506, p < 0.001, n = 46), CSF levels of MBP (rho = 0.400, p = 0.001, n = 62), CSF levels of tau protein (rho = 0.382, p = 0.003, n = 60), and CSF concentrations of neopterin (rho = 0.385, p = 0.002, n = 62). In a multivariate regression analysis where the CSF concentrations of MBP, neopterin, tau protein, and OPN were introduced as independent variables, the CSF concentration of OPN was the only significant, independent predictor of the area of Gd-enhancement (data not shown). CSF concentrations of OPN did not correlate with the CSF leukocyte count or with intrathecal immunoglobulin G (IgG) synthesis. In the CIS group there was a trend to a correlation between the degree of abnormalities on T2-weighted MRI when classified as normal, slightly abnormal, or highly suggestive of MS according to the Paty criteria (data not shown: n = 22, rho = 0.42, p = 0.052).
Osteopontin in the cerebrospinal fluid (CSF) and other markers for inflammation and tissue damage. Association between osteopontin concentrations in the CSF with gadolinium (Gd) enhancement in magnetic resonance imaging (MRI) (panel A) and with CSF concentrations of myelin basic protein (MBP) (panel B), neopterin (panel C), and tau protein (panel D) in patients with clinically isolated syndrome (CIS) or relapsing–remitting multiple sclerosis (RRMS) median 11 days after onset of relapse. Statistics are given as Spearman’s rho ([a-z]+) p-value.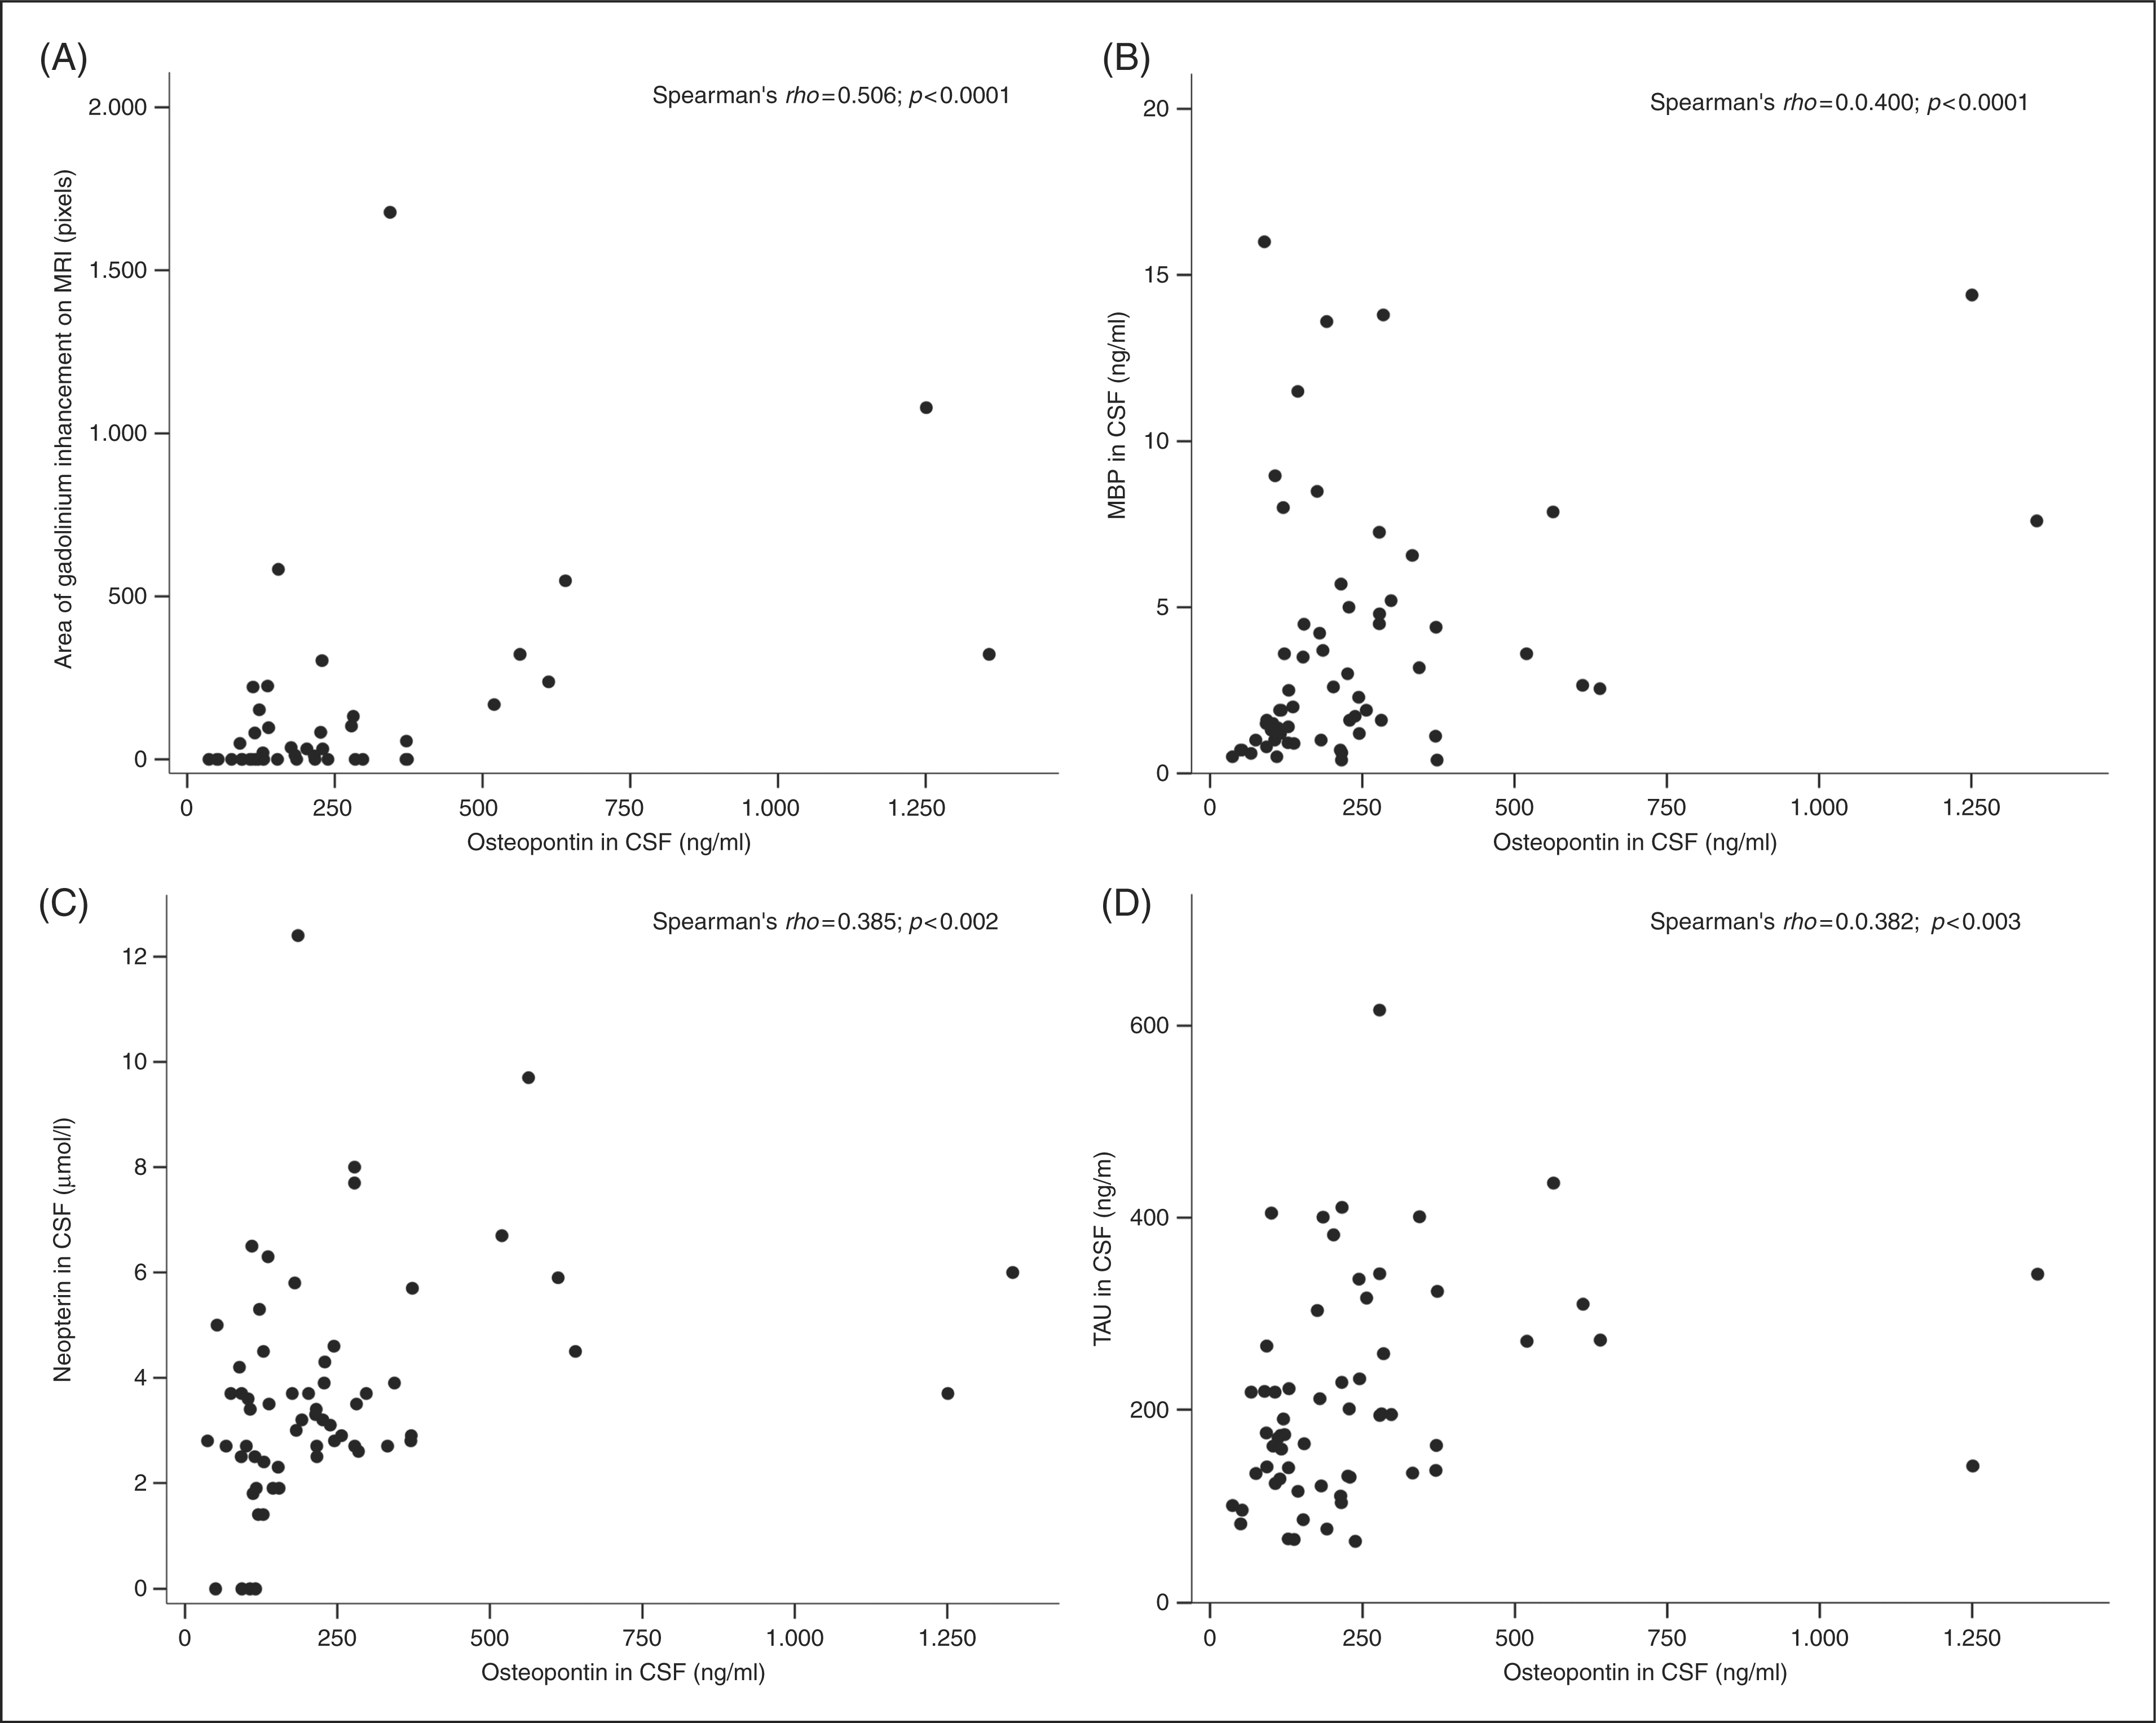
In patients with PPMS, OPN levels in the CSF correlated with the Kurtzke Expanded Disability Status Scale (EDSS) score (Figure 3: rho = 0.852, p = 0.004). CSF OPN concentrations did not correlate with disability in CIS, RRMS, or SPMS patients.
Osteopontin in the cerebrospinal fluid (CSF) and clinical disability in primary progressive multiple sclerosis (PPMS). There is a strong association between osteopontin concentrations in the CSF and disability (EDSS) in patients with PPMS. Statistics are given as Spearman’s rho ([a-z]+) p-value.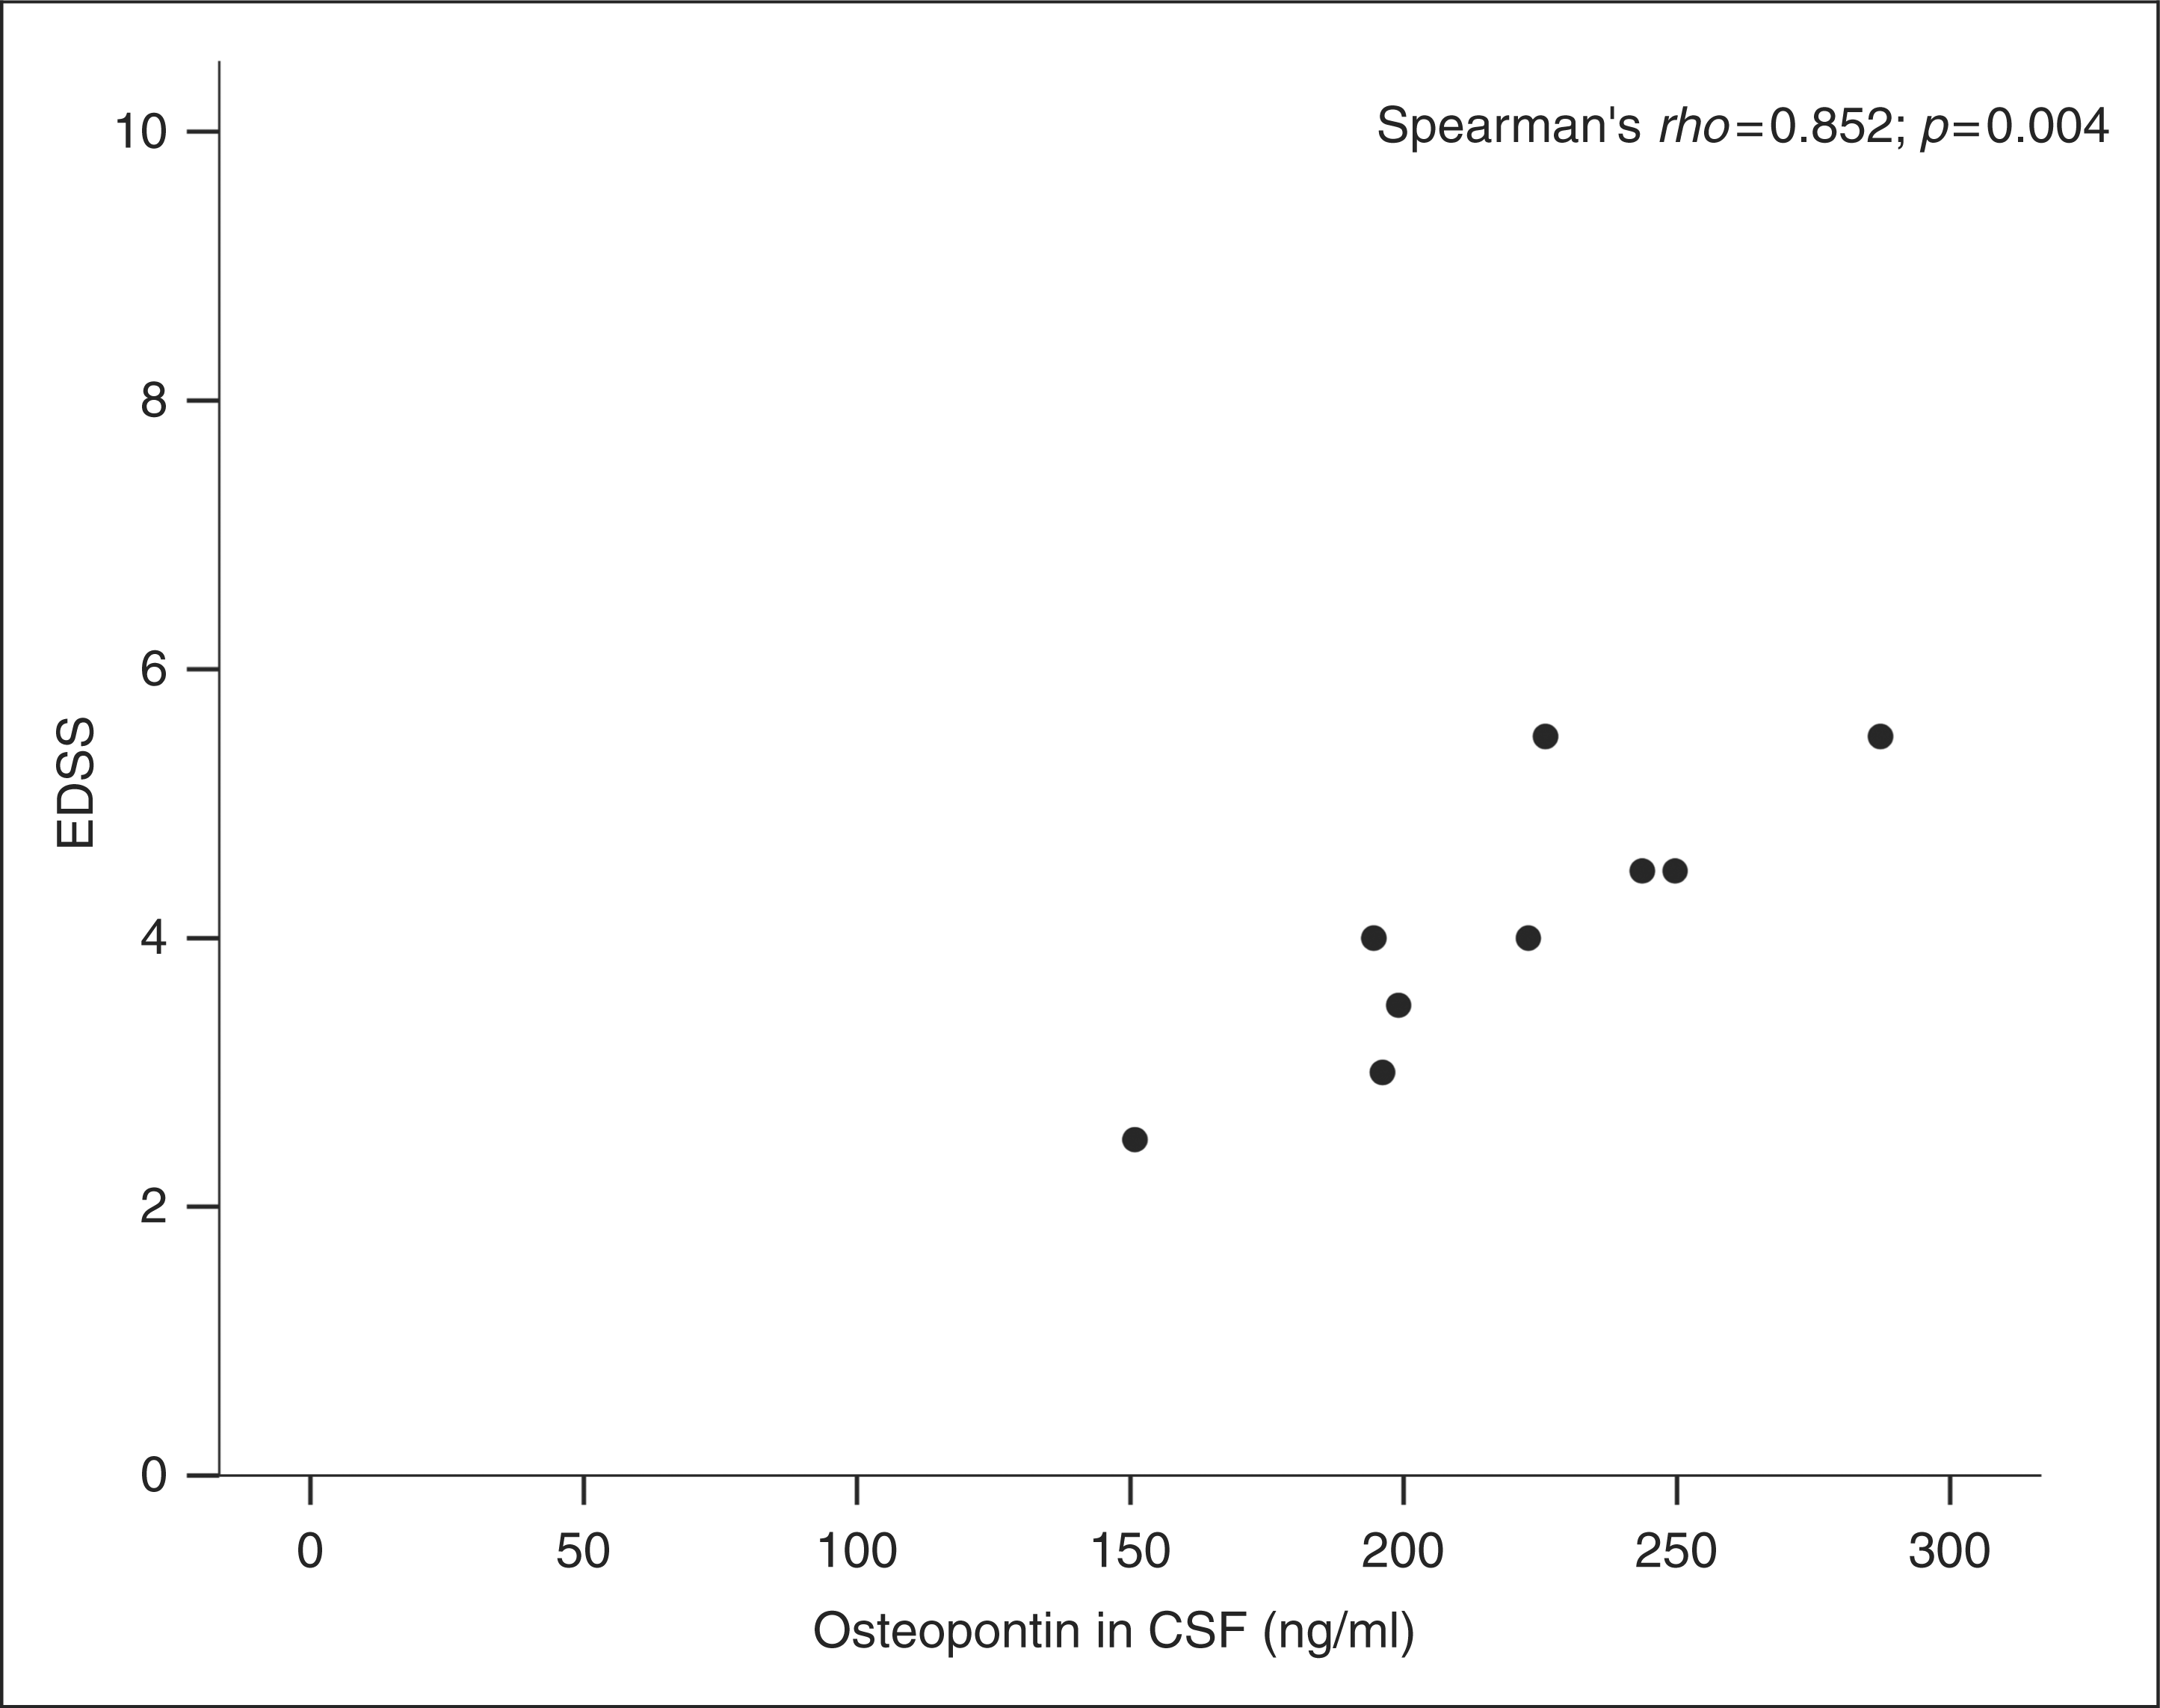
Serial studies of OPN in CIS and RRMS
Fifteen CIS and 33 RRMS patients in relapse underwent repeated blood sampling and lumbar puncture 3 weeks after the initiation of treatment with oral high-dose methylprednisolone or placebo. In pooled data, the CSF concentration of OPN decreased from 216 ng/ml (IQR 125–315 ng/ml) to 148 ng/ml (IQR 90–197 ng/ml, p < 0.001). The CSF concentration of OPN decreased significantly both in the CIS (25.5 %, IQR 4.6–37.2%, p = 0.009) and the RRMS subgroup (25.8%, IQR 2.1–51.9%, p < 0.001, Figure 4A). There was no significant difference in the decrease in patients treated with methylprednisolone (34.1 %, IQR 8.4–63.1%) and patients treated with placebo (18.1%, IQR 3.0–44.8%, Figure 4B).
In pooled data from CIS and RRMS patients plasma, OPN concentrations increased slightly by 6% (IQR −8–27%, p = 0.024). Subgroup analysis revealed that plasma OPN concentrations only increased significantly in patients treated with methylprednisolone (22.1%, IQR 6.5–36.6%, p = 0.002), whereas plasma OPN levels in placebo treated patients did not change significantly (−3.4%, IQR −12–5%, Figure 4C and 4D). There was no significant difference in the change in plasma OPN concentrations between CIS and RRMS patients.
Discussion
In this study we found that OPN concentrations in the CSF were increased in CIS and RRMS patients with active disease and showed a trend to correlate with the extent of T2-weighted MRI abnormalities in CIS patients, and that high OPN levels were associated with high measures of other markers for inflammation and tissue damage in the CNS. Furthermore, CSF OPN levels were increased and associated with the degree of disability in patients with PPMS. Finally, in all patient groups studied, concentrations of OPN were higher in CSF than in plasma, suggesting that the OPN detected in CSF is derived from intrathecal synthesis.
Two previous studies on CSF OPN concentrations in MS patients with heterogeneous disease activity and baseline characteristics gave conflicting results. Braitch et al. examined CSF OPN concentrations in 27 MS patients (22 with RRMS, four with PPMS, and one with SPMS), and found that CSF OPN concentrations were higher in MS patients than in control subjects with other neurological, non-inflammatory disease. 26 In contrast, Chowdhury et al. studied OPN in CSF from 30 MS patients (11 with RRMS, 13 with SPMS, and six with PPMS), of which 19 were treated with IFNs or glatiramer acetate. They found no significant differences in CSF OPN concentrations comparing MS to OND patients, and stable MS patients to MS patients with clinical or MRI disease activity. 25 We recently reported that CSF OPN levels were increased in a group of RRMS patients with very active disease. In these patients CSF OPN levels decreased significantly along with clinical stabilization after 1 year of treatment with natalizumab. 36
The results of the present study suggest that the differences between the results of previous studies may, at least partly, be explained by the dynamics of OPN expression in the CSF during relapses and differences in CSF OPN concentrations in different subtypes of MS. We demonstrated that increased CSF OPN concentrations are closely related to clinical exacerbation in CIS and RRMS, as they decreased again significantly within 3 weeks from baseline sampling. Interestingly, treatment with methylprednisolone did not influence the magnitude of this decrease. Underlining the pathogenic significance of OPN, we also found that high CSF OPN levels were associated with a higher extent of focal inflammation as measured by Gd-enhanced MRI, and tissue damage as reflected by the CSF concentration of MBP and tau protein. Furthermore, an interesting association between OPN and neopterin was observed. OPN is a pronounced promoter and neopterin is a marker for the IFN-γ-mediated activation of human mononuclear phagocytes. We previously found transient increases in CSF neopterin concentrations in MS with kinetics comparable to OPN. 33 Thus, our data suggest that increased OPN levels in the CSF reflect ongoing inflammatory processes in MS, may be used as a marker for disease activity, and might also serve as an outcome measure in clinical trials. However, changes in OPN are not specific for MS as OPN levels are also increased in inflammatory neurological diseases of the CNS other than MS. 25,26
Previous studies have shown that active lesions on Gd-enhanced MRI are rare in patients with PPMS and that in SPMS patients Gd enhancement is mainly observed in patients with superimposed relapses, and it has been suggested that inflammation is mainly restricted to MS patients with ongoing disease activity in the form of relapses. 37,38 In our study, patients with PPMS had significantly increased CSF OPN concentrations, which were associated with a higher degree of clinical disability (EDSS), and SPMS patients had increased plasma concentrations of OPN. This finding indicates that there is ongoing inflammation even in PMS patients. This is in accordance with recent neuropathological studies showing that classical perivascular inflammation and slowly expanding lesions, associated with the noduli of activated microglia in the NAWM, 39 are present in brains from PPMS and SPMS patients. 2,5 It has been suggested that axonal degeneration in the CNS of PMS patients does not develop in the absence of active inflammatory demyelination. 2,5 These results challenge the theory that PMS is primarily caused by progressive neurodegeneration, in the absence of active inflammation. 3,4,40 Indeed, increased chemokine concentrations and increased concentrations of nitric oxide metabolites have been observed both in patients with PPMS and SPMS. 41,42
It is not clear why we observed increased CSF OPN concentrations in PPMS whereas SPMS solely had increased plasma concentrations of OPN. A recent study correlating the disease course with histopathological changes suggests that whereas clinical disease activity in PPMS correlates with the extent of slowly expanding lesions in the brain, the disease course in SPMS correlates better with the extent of classical, actively demyelinating lesions of the type also observed in RRMS. 43 It is possible that SPMS patients, like RRMS patients, could have more transient increases in CSF OPN concentrations than in PPMS that are not easily detected in a cross-sectional study like the present one.
Whereas SPMS patients had higher plasma concentrations of OPN than healthy controls, we found no increase in plasma OPN concentrations in untreated CIS and RRMS patients in relapse. Instead, we found significantly increased plasma OPN concentrations in CIS and RRMS patients after treatment with methylprednisolone. The SPP1 ([a-z]+) promoter is known to contain a binding site for the glucocorticoid receptor, 44,45 and depending on cell type studied, stimulating and inhibiting effects of glucocorticoids on the OPN ([a-z]+) expression have been reported. 46 – 50 In contrast to our findings, three previous studies have reported increased plasma OPN concentrations in active RRMS. Comabella et al. examined plasma OPN concentrations approximately 2 weeks after onset of relapse and found increased plasma OPN levels. 23 The other two studies, one of them considering RRMS as being active when samples were obtained within 3 months before or after onset of relapse, are not fully comparable as blood sampling was timed differently in relation to the onset of relapse. 21,22 A fourth study reported lower concentrations of OPN in MS (RRMS, PPMS, and SPMS) than in healthy controls. 24 The timing of sampling, treatment with methylprednisolone, and variable inclusion of SPMS patients are likely to contribute to the discrepancies between studies of plasma OPN concentrations in MS. The biological significance of the increased plasma OPN concentrations in SPMS observed in the present study is uncertain, but it is tempting to speculate that it might reflect a change in immune activation mechanisms from adaptive to innate immunity, previously suggested to underlie the transition from RRMS to SPMS. 51
We conclude that OPN concentration in the CSF is a dynamic indicator of disease activity in RRMS, reflecting ongoing inflammation in the CNS. We found no relationship between plasma OPN concentrations and disease activity in MS, however, plasma OPN levels increased in RRMS patients treated with glucocorticoids and were higher in untreated SPMS patients. Furthermore, PPMS patients, but not SPMS patients, showed prominent increases in CSF OPN concentrations that are associated with clinical disability scores, suggesting differences in the pathogenesis of PPMS and SPMS that are not explained simply by neurodegenerative processes.
Footnotes
Funding
This research was supported by grants from the Danish Multiple Sclerosis Society, the Warwara Larsen Foundation, the Johnsen Memorial Foundation, the Lily Benthine Lund Foundation, the Novo Nordisk Foundation, the Danish Medical Research Council, Brdr Rønje Holding, the Ludvig & Sara Elsass Foundation, the Toyota Foundation, the Swedish Research Council, the Montel Williams Foundation, Bibbi and Niels Jensens Foundation, FP6 Neuropromise (LSHM-CT-2005-018637), and research grants from Biogen Idec.