
Abstract
Keywords
Introduction
Multiple sclerosis (MS) has long been characterized as a chronic inflammatory disease of the central nervous system. While the inflammatory process is well established, recent studies have emphasized the presence of additional neurodegenerative processes that assume an increasingly prominent role as the disease advances into its later progressive stage. 1 Magnetic resonance imaging (MRI) provides the best index of MS-related inflammatory processes, marking the early evolution of the disease through the number and size of gadolinium-enhanced lesions and T1/T2 lesions. 2 However, after a period of time, the number of enhanced lesions often declines and lesion burden on T2-weighted MRI stabilizes. 2,3 Clinically, the occurrence of distinct episodes of MS relapse and remission is often replaced by a gradual, unremitting worsening of symptoms over time. Some estimate that as many as 90% of relapsing–remitting patients convert to this secondary progressive stage of MS (SPMS) over a 20-year disease duration. 4 In this later stage, the changes noted on MRI no longer appear to be inflammatory, but instead are indicative of progressive brain atrophy stemming from cell loss. Reductions in brain volume become more prominent in addition to an increase in T1 hypointensities and the development of T2 hypointensities in deep gray matter structures. 2,3,5
Reduction in inflammatory markers in conjunction with progressive worsening of the disease would suggest that other processes assume greater importance in SPMS. One possibility is that oxidative stress is a major contributor to neurodegeneration at this stage of the disease. The importance of oxidative stress in the pathogenesis of MS has been indicated in several ways. 6 – 9 For example, lipid peroxidation products are found in plasma from MS patients. 10 In addition, the production rates of reactive oxygen intermediates from inflammatory cells are increased in leukocytes from MS patients 11,12 and in experimental autoimmune encephalomyelitis (EAE) mice. 8 An in vivo biomarker for oxidative stress could be a useful tool, enhancing our understanding of a possible, post-inflammatory disease process and perhaps serving as a surrogate marker to monitor disease progression in the later stage of MS.
Glutathione (GSH) is a potent endogenous antioxidant that plays a key role in protecting cells against oxidative damage by reactive oxygen species such as hydrogen peroxide generated in the brain. In particular, GSH provides a first line of defense against singlet oxygen and hydroxyl radicals that are known to cause cellular damage and eventual cell death by apoptosis or necrosis. 13,14 Because GSH is consumed in this protective process, a reduction in GSH levels is observed in brain tissue undergoing oxidative stress. 15 An expanding body of evidence has shown GSH to be a sensitive indicator of oxidative stress in various neurodegenerative diseases. 16,17,18,19
Non-invasive measurement of GSH levels in patients with MS could offer an important new parameter for characterizing this disease, monitoring its status and progression, and guiding improvements in clinical care. Along with a few other groups of investigators, we have demonstrated the feasibility of GSH detection in the human brain using multiple quantum filtering techniques of 1H magnetic resonance spectroscopy (MRS). 20,21,22 We developed the technique further by incorporating two-dimensional multiple quantum-filtered chemical shift imaging (CSI) of GSH to sample multiple brain regions without additional scan time. 23 In the present study, we compare quantitative measures of GSH levels in brains of SPMS patients and healthy controls, thereby evaluating the presence and severity of oxidative stress in SPMS.
Methods
Participants
Seventeen patients with SPMS and 17 healthy controls closely matched to the patients in age and gender were examined according to the study protocol approved by the Human Subjects Committee at the University of Kansas Medical Center. MS patients were recruited from the University of Kansas Multiple Sclerosis Clinic. Patients’ charts were reviewed to ascertain that each had a definite diagnosis of MS with a previous relapsing history and a gradual worsening of their function over at least the preceding year. Patients with a history of other autoimmune diseases, head injury, claustrophobia, or other unstable medical conditions were excluded. In order to ensure a close matching on age and gender in our samples, we recruited the controls sequentially to match individual patients. Informed consent was obtained from all study participants.
MR protocol
All MR scans were performed on a 3-T system (Allegra, Siemens, Erlangen, Germany). A custom-built quadrature radiofrequency (RF) helmet coil, a partial volume transmit/receive coil, was used to provide a relatively homogeneous RF field and high sensitivity with volume coverage above the eyes.
24
After positioning the participant supine in the magnet, three-plane scout MR images were acquired using a gradient echo sequence to locate the volume of interest (VOI). The VOI, a 3-cm axial slab for the CSI of GSH, was positioned to cover the area above the corpus callosum including the frontal to parietal regions, and also located in the iso-center of the magnet (Figure 1A).
(A) Outline of glutathione (GSH) chemical shift imaging (CSI) slice, the volume of interest (VOI), overlaid on a T1-weighted sagittal scout image of the brain of a multiple sclerosis patient. The CSI slice was placed in the fronto-parietal regions with an oblique orientation based on individual subject head shape and location. The orientation of the CSI slab was set to have a pitch angle of 14° (axial↔coronal) between the CSI slab and a line connecting the base of the corpus callosum from genu to splenium in a mid-sagittal slice of each participant, providing consistent positioning of the VOI. (B) Partial views of the in vivo oblique GSH CSI (left) and the simultaneously measured creatine (Cr) CSI (right) of a secondary progressive multiple sclerosis (SPMS) patient brain. The acquisition parameters were as follows: slice thickness = 3 cm, matrix size = 8 × 8, field of view (FOV) = 20 cm, TE/TR = 115/1500 ms, spectral width = 2 kHz, number of data points = 256, number of averages (NT) = 12 and scan time = 19 min. Spectra were overlaid on the corresponding anatomical MR images from the middle of the CSI slice. Line broadening factors for the spectra were 2 Hz for both GSH CSI and Cr CSI.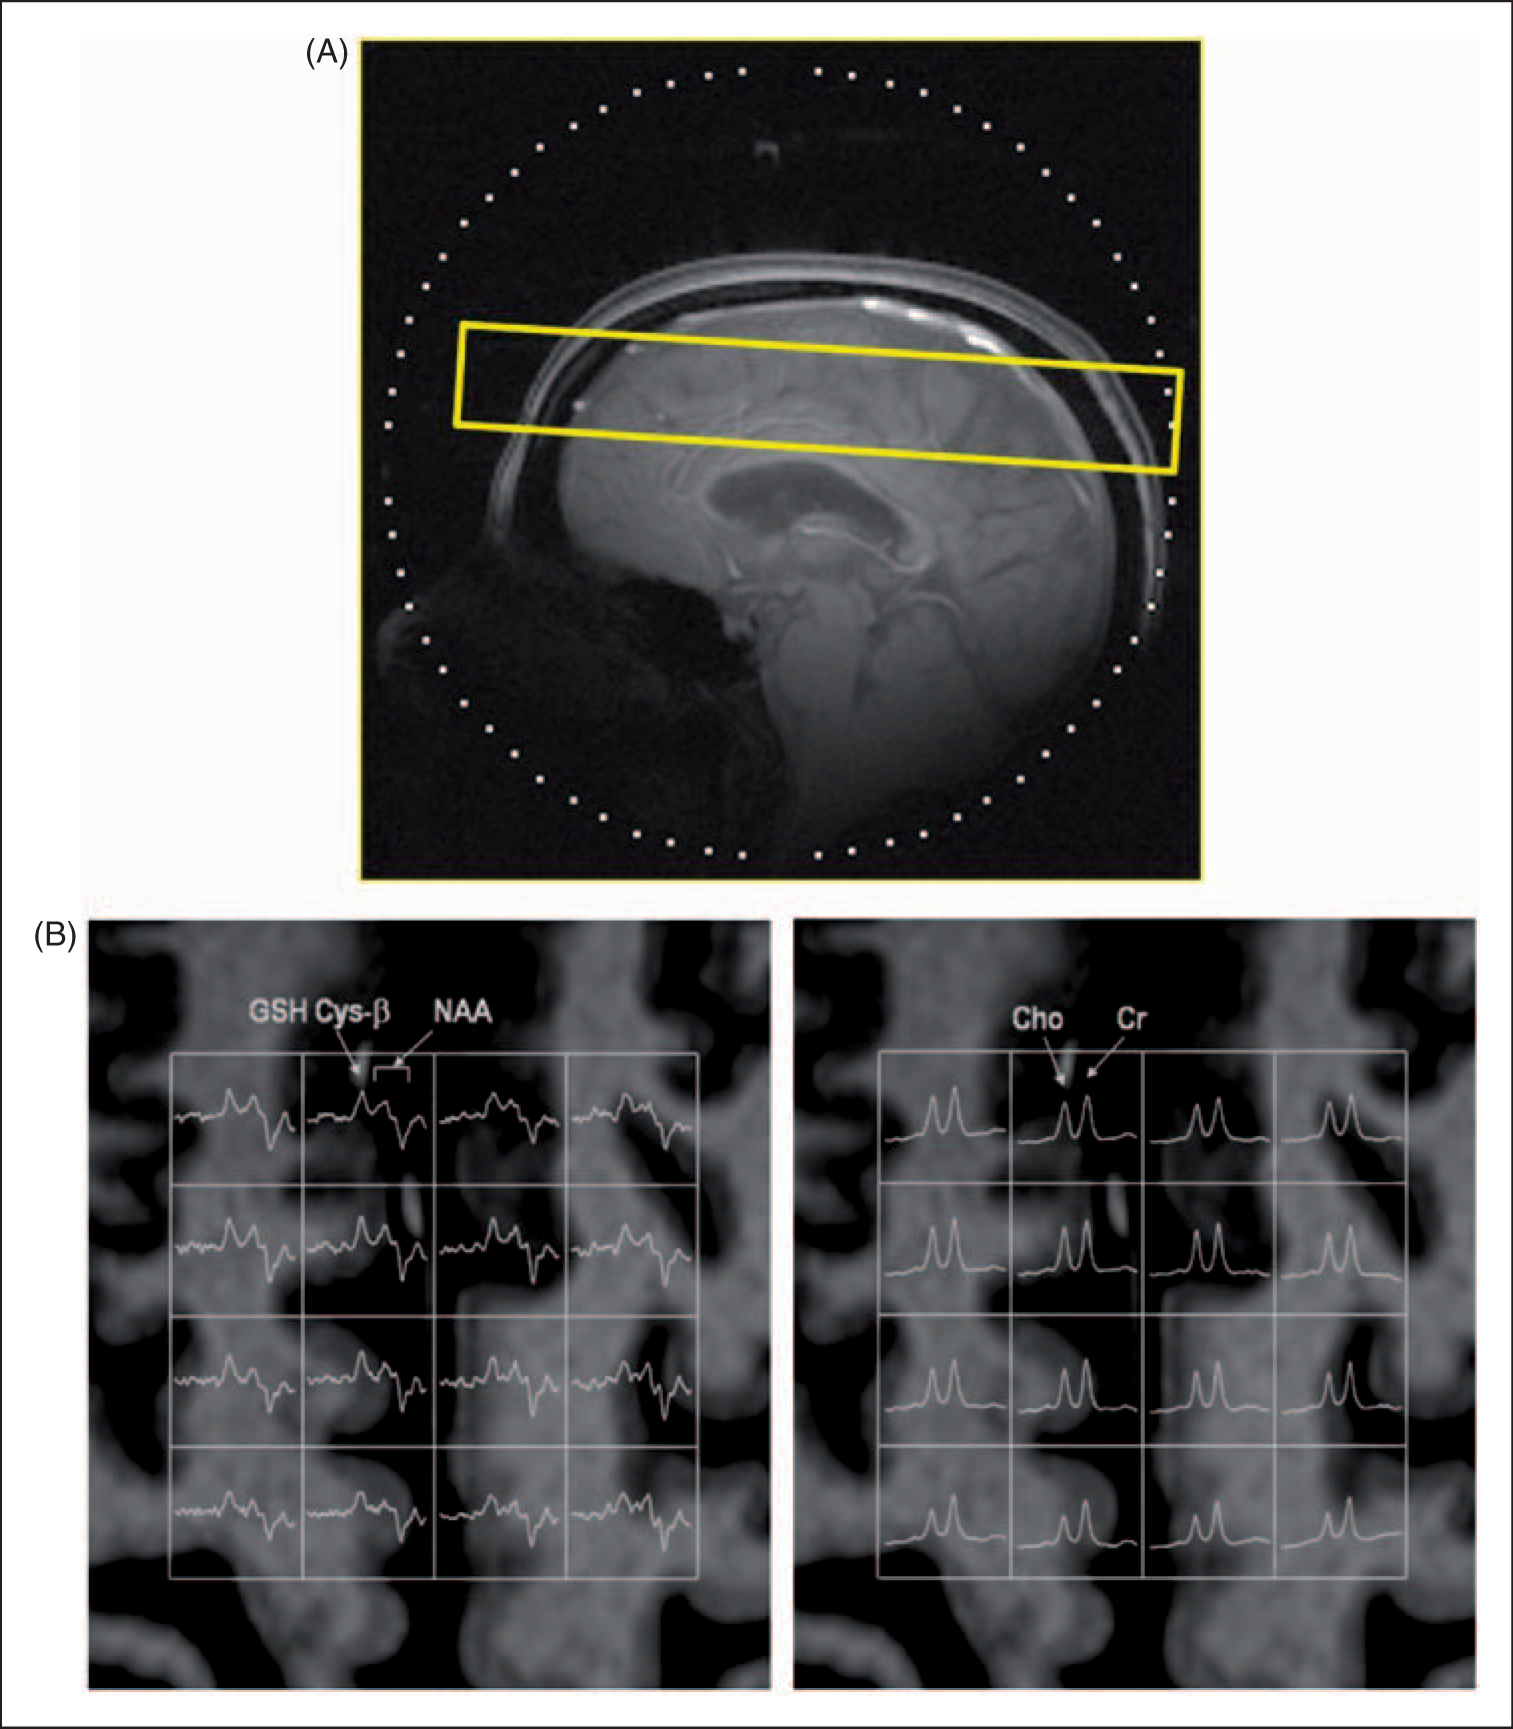
Localized automated shimming was performed to optimize static magnetic field homogeneity in the CSI slice using the Massachusetts General Hospital shimming package. The shimming routine adjusts all first- and second-order shim currents based on measured field maps. This shimming provides improved magnetic field homogeneity across the complete CSI slice, resulting in <7 Hz full width at half maximum (FWHM) of the water linewidth in the 6 × 6 × 3 cm 3 volume in the CSI slice.
In vivo mapping of GSH was performed on a CSI slice positioned in the fronto-parietal regions of the human brain, where localized shimming was applied (Figure 1). The multiple quantum-filtered CSI sequence for the GSH measurements was based on a two-echo scheme. 23,25 The concentrations of GSH were determined using an internal reference method, which employs the creatine (Cr) signal acquired simultaneously with those of GSH. Using Cr as an internal concentration reference provides an automatic correction for the brain atrophy effect since both GSH and Cr are mostly present in the brain tissue and concentrations of metabolites in the cerebro-spinal fluid are more than two to three orders of magnitude lower than those in the brain tissue. 26,27,28
GSH CSI data were processed with home-written software in IDL 6.3 (RSI, Boulder). Preprocessing of data includes line broadening of 2 Hz, zero padding of the data to 8192 points. Signals in Cr CSI were modeled with two Lorenzian peaks at 3.0 ppm for Cr and 3.2 ppm for total choline. The spectral line shape of GSH signals at 2.9 ppm was approximated with two Lorenzian peaks separated by 4 Hz. Co-edited signals from N-acetylaspartate (NAA) appeared at around 2.6–2.8 ppm and were approximated by three Lorenzian peaks. Spectral fitting was performed using Levenberg–Marquardt least-squares minimization algorithm implemented in the MPFIT curve-fitting package (Craig Markwardt). Following the Cr CSI data fitting, GSH CSI data were fitted using the frequency and phase information obtained from the corresponding Cr fitting. The GSH concentration was calculated from the peak area ratio of GSH to Cr in each CSI voxel with a calibration coefficient determined from measurements of a solution phantom containing GSH and Cr with known concentrations, and the Cr concentration from the literature in a similar manner as we have described previously. 25 The calibration coefficient used in the quantification of GSH includes the differences between GSH and Cr in longitudinal relaxation, volume definition and editing efficiency.
GSH concentrations were calculated from the central 5 × 5 cm 2 region of the CSI data, where both the static magnetic field (B0) and the RF field (B1) homogeneity are the most adjusted for the conservative estimation of GSH. The total area spans portions of both the frontal and parietal lobe, and the GSH concentration value obtained for this total area is here labeled as ‘fronto-parietal’. In addition, it was possible to independently obtain separate values for the anterior half (2.5 × 5 cm 2 ) and the posterior half (2.5 × 5 cm 2 ) of the total area. Although the two halves along this horizontal axis do not correspond perfectly with the frontal and parietal lobes, it is still reasonable to label the anterior concentration value as ‘mostly frontal’ and the posterior as ‘mostly parietal’. Because these values are obtained from each specified area (mostly frontal, mostly parietal and total) separately and the fronto-parietal value is not merely the arithmetic average of the two regional values, all three variables are reported here. Because participants in the MS patient and control groups were individually matched for age and gender, the concentrations of GSH for the two groups were compared using paired-sample t-tests. Effect sizes were computed between the two groups using Cohen’s d statistic.
Results
Demographics
Owing to the matching procedure, the participants in each group were identical with respect to age and gender. They ranged from 29 to 62 years of age with a mean ± standard deviation (SD) of 51 ± 8. Each group consisted of 14 females and 3 males, reflecting the demographics of MS patients in Kansas City area. Patients’ disability scores on the Expanded Disability Status Scale (EDSS) 29 ranged from 4.0 to 7.0, with a median of 6.0. Average age at the time of diagnosis was 31 ± 7 years, and average duration of disease (since diagnosis) was 19.7 ± 4 years.
Mapping of GSH via multiple quantum-filtered CSI
GSH CSI was successfully acquired from the fronto-parietal region of the human brain. The VOI (3-cm thick CSI slab) is indicated by a rectangle in a T1-weighted sagittal image of the brain of an MS patient (Figure 1A). Partial views of GSH CSI (Figure 1B, left) and the corresponding simultaneously measured Cr CSI (Figure 1B, right) are overlaid on anatomical MPRAGE images from the middle section of the CSI slab. GSH signals of the cysteine β-CH2 protons at ∼3 ppm were clearly detectable in all of the CSI voxels. Line shape analysis of GSH signals revealed that signal contamination from other overlapping resonances around 3 ppm such as creatine, γ-amino butyric acid (GABA), and macro molecules was minimal, demonstrating a robust detection of GSH signals in the GSH CSI through the doubly selective multiple quantum filtering. Consistent line shape and flat baseline shown in Cr CSI (Figure 1B, right) demonstrate a good spectral quality of the CSI data. The peak height of the choline signal at 3.2 ppm was lower than those in the conventional CSI due to the use of a selective refocusing pulse centered at 3.0 ppm providing complete refocusing of the Cr signal at 3.0 ppm and partial refocusing of the choline signal at 3.2 ppm.
GSH levels in SPMS patients and healthy controls
GSH levels in the total fronto-parietal area and in each sub-region were lower for the MS patients than for the controls (Figure 2). In the fronto-parietal area, the concentration of GSH for the MS patients was 1.04 ± 0.13 µmol/g (mean ± SD) compared with 1.19 ± 0.15 µmol/g for the controls, with a reduction of 12.5% (p = 0.005; Cohen’s d = 1.06). In the mostly frontal region, the concentration of GSH for the patients was 1.01 ± 0.15 µmol/g compared to 1.23 ± 0.20 µmol/g for the controls, a reduction of 18.5% (p = 0.001; Cohen’s d = 1.28). In this region, none of the MS patients had GSH levels exceeding the mean value for the controls. The difference in GSH concentrations was less pronounced in the mostly parietal region: 1.06 ± 0.13 µmol/g for the patients and 1.14 ± 0.13 µmol/g for the controls, a reduction of 7.7% ( p = 0.05; Cohen’s d = 0.66). In controls, the concentration of GSH was lower in the parietal region than in the frontal region ( p < 0.05, paired t-test), whereas no significant regional difference in GSH concentration was noted for the MS patients ( p = 0.15).
Comparison of GSH levels for secondary progressive multiple sclerosis (SPMS) patients (n = 17) and controls (n = 17). GSH levels were significantly lower for SPMS patients than for controls in the overall fronto-parietal region (p = 0.005) and the mainly frontal region (p = 0.001), whereas GSH levels in mainly parietal regions are marginally lower for SPMS patients compared with controls (p = 0.05). *Statistically significance levels of p < 0.05.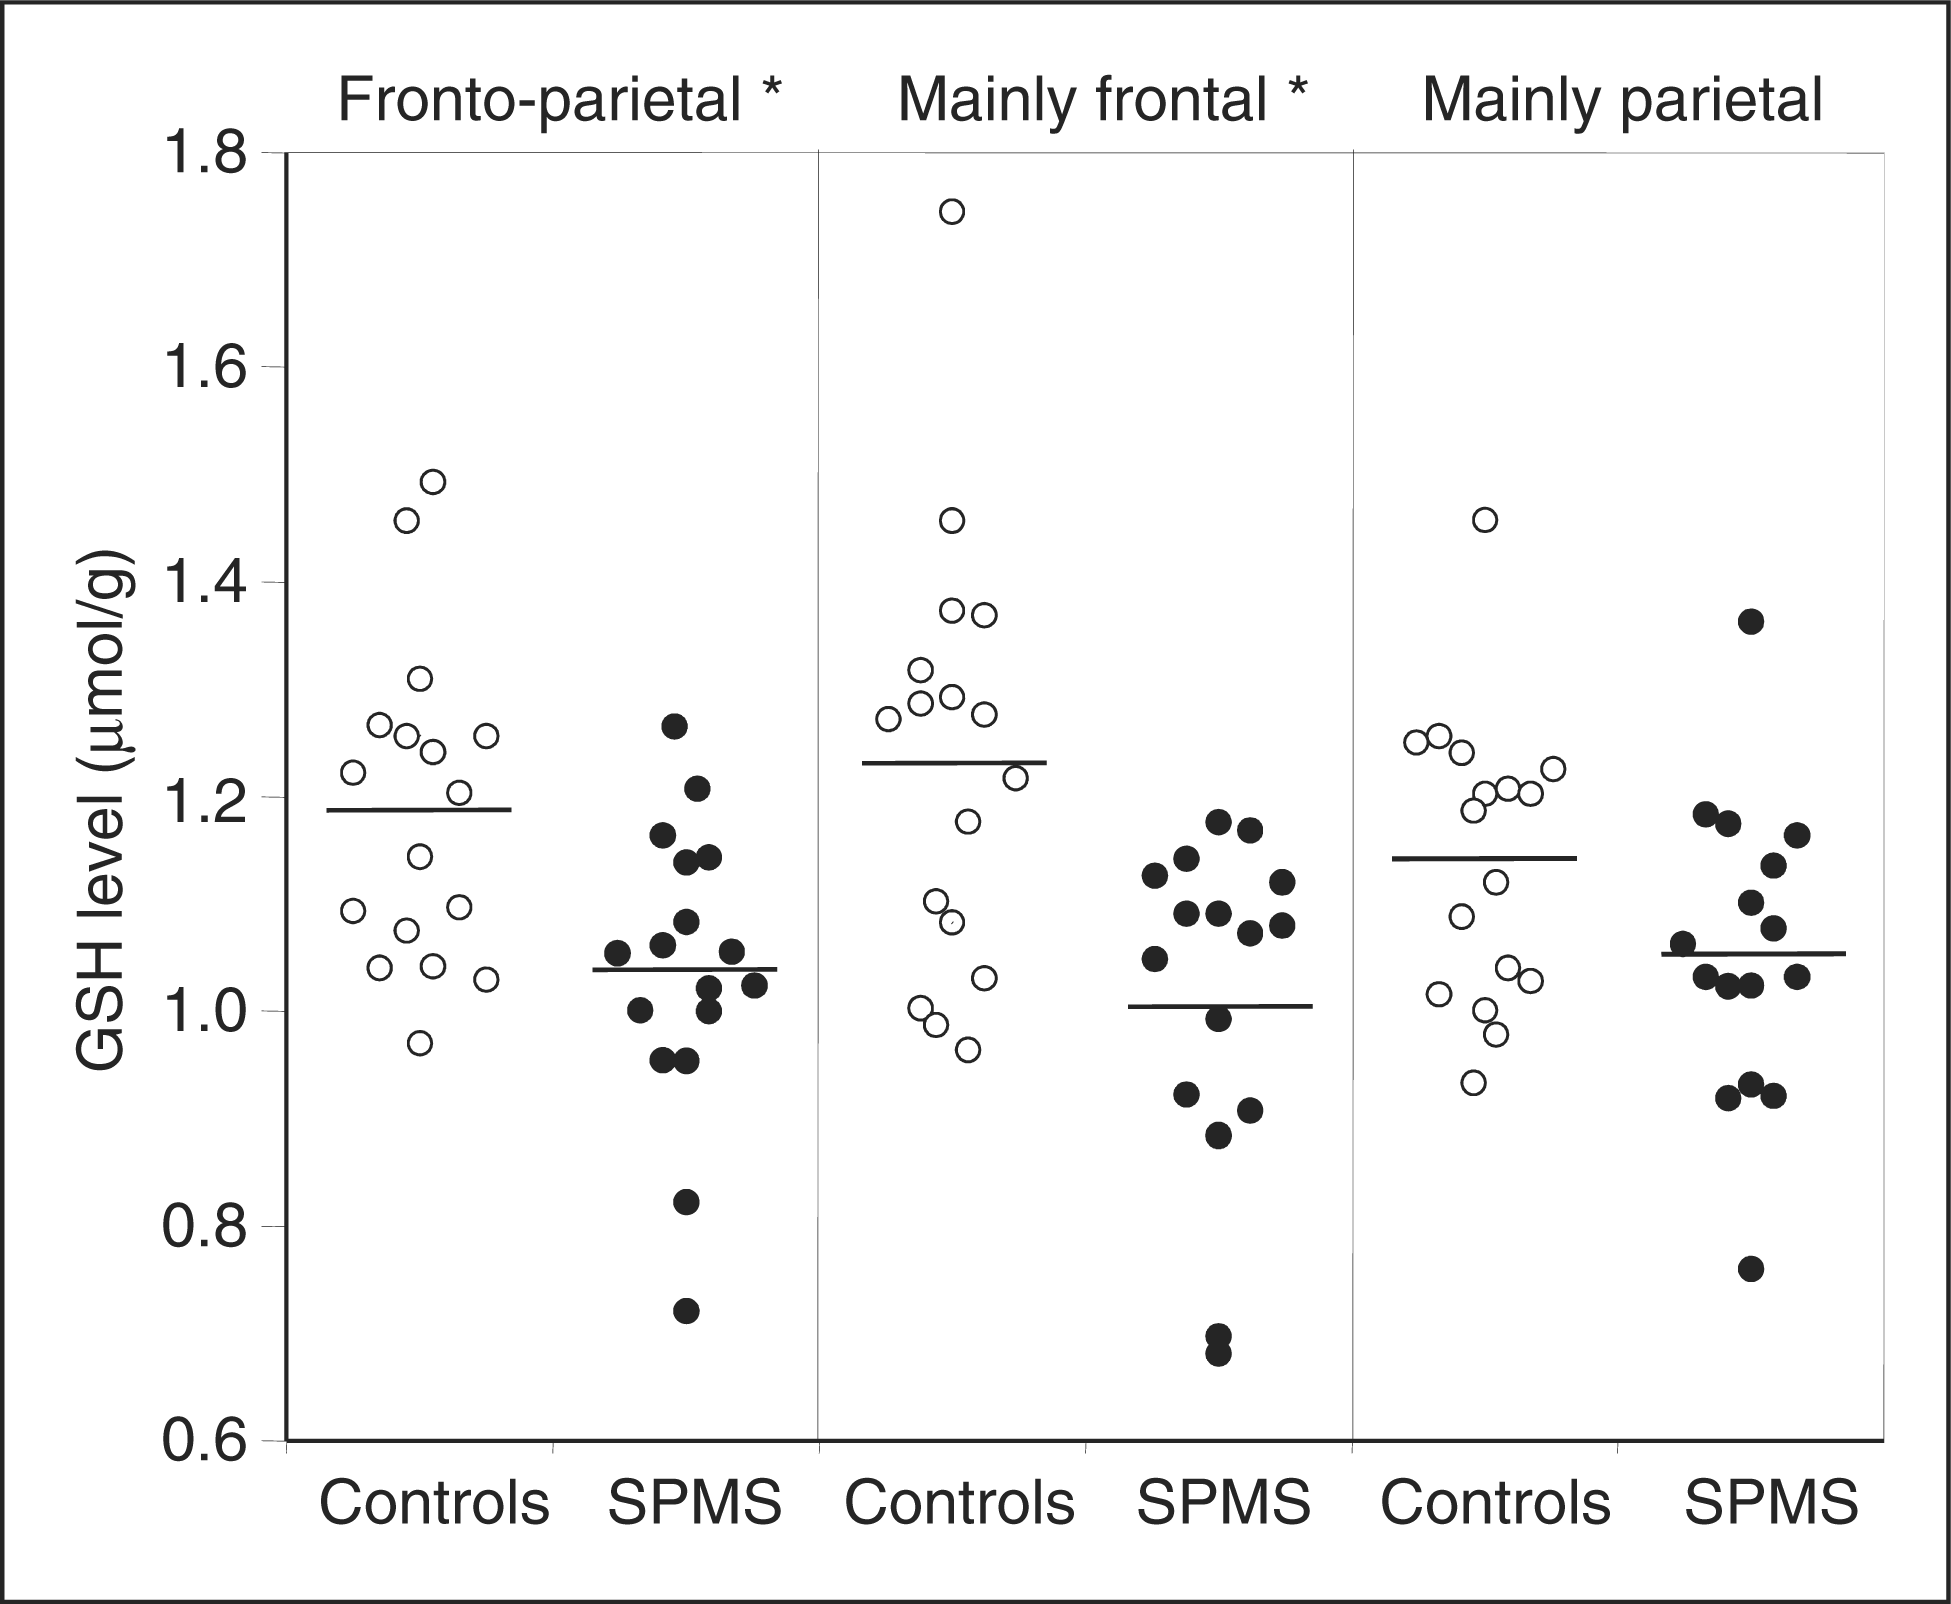
Correlations between GSH levels and demographic or disease-related characteristics
GSH levels did not differ for males and females. There was a non-significant positive relationship between age and GSH concentration in the overall fronto-parietal area for the MS patients (r = 0.36); this was due to a significant relationship between age and GSH concentration in the mostly frontal region for these patients (r = 0.52, N = 17, p = 0.03). The corresponding correlations for the healthy controls were non-significant.
The fronto-pariental GSH level tended to be lower for patients with higher disability ratings on the EDSS, but this correlation was not significant (Spearman’s rho = −0.17). The correlation was attenuated by severe restriction in the variability of the EDSS scores; all but four of the 17 MS patients having ratings of either 6.0 (n = 10) or 6.5 (n = 3). We did note that the patient with the highest disability rating (i.e. EDSS = 7.0) also had the second lowest GSH values.
Disease duration was negatively related to GSH levels in the total fronto-parietal area (r = −0.25) and in the mostly parietal region (r = −0.26), although neither of these correlations was significant. Patients’ age at diagnosis was positively related to GSH levels in the fronto-parietal area (r = 0.55, N = 17, p = 0.02) and in the mostly frontal region (r = 0.55, N = 17, p = 0.02). Since these GSH concentrations were also positively related to patients’ current age, we computed partial correlations for age at diagnosis, adjusted for current age. The partial correlations still indicated a positive relationship between age of onset and GSH levels (fronto-parietal: partial r = 0.45, df = 14, p = 0.08; mostly frontal: partial r = 0.34, df = 14, p = 0.20), but were no longer significant.
Discussion
The present in vivo method of GSH measurement affords the opportunity to confirm the presence and to assess the severity of oxidative stress in MS as well as other diseases. Using the GSH CSI technique, clear detection of GSH was achieved at a clinical field strength of 3 T. The use of a doubly selective multiple quantum-filtering method enabled us to resolve GSH signals from other overlapping resonances, which are particularly pronounced at a field strength of 3 T or lower. Incorporation of the GSH editing technique into the CSI technique significantly improved the information content, permitting measurement of GSH levels in the frontal and parietal regions of the brain. Unlike multiple quantum-based editing methods, the possibilities of adapting subtraction-based editing methods to the CSI technique are quite limited due to the necessity of maintaining effective suppression of overlapping resonances over extended brain regions as well as their susceptibility to subject movement.
The present study demonstrates that GSH mapping is feasible for clinical scans. The MR acquisition time for GSH was less than 20 min. The relatively long acquisition time was due to the low concentration of GSH (around ∼1 µmol/g). The advantage of multiple quantum CSI methods is the efficient scan time for multiple VOIs. Conventional CSI of metabolites with high concentrations (e.g., NAA at over 8–9 µmol/g) requires substantially longer scan times compared to single voxel 1 H NMR spectroscopy; however multiple quantum CSI of metabolites with low concentrations (e.g. GSH, GABA) requires an almost identical scan time, while providing biochemical information of multiple regions. It is also true, however, that the scan-time limitation does necessitate a much larger voxel size for GSH measurement compared with other prevalent signals such as NAA, creatine and choline.
The simultaneously measured Cr signal serves as a phase and frequency reference for fitting analysis of the GSH signals and, therefore, the use of this two-echo scheme significantly improved the reliability of GSH quantification compared with conventional multiple quantum-filtered spectroscopy that lacks any singlet signals. The use of Cr as an internal concentration reference also provided an automatic correction for the effect of brain atrophy, which is particularly important in the clinical studies of neurodegeneration where significant atrophy occurs during the disease progression. Another benefit of the two-echo scheme is that no additional scan time was required for the Cr CSI as its acquisition was achieved with no further relaxation delay during each repetition time period. When using Cr as an internal concentration reference, caution has to be taken as Cr concentrations could be altered in SPMS. 30,31,32 In our study, the Cr concentrations between MS patients and controls were not different in the fronto-parietal regions ( p = 0.87, data not shown). Thus, Cr could serve as a concentration reference in this study and the observed altered GSH levels in MS were not likely due to potential alterations of creatine levels.
GSH concentrations in this study were within the range of those in the human brain using biochemical analyses of autopsy specimens. 33,34 Concentrations in the frontal and parietal regions of the brains of SPMS patients were clearly lower compared with those of healthy controls. While the number of subjects in the present study was relatively small (n = 17 per group), the reduction in GSH found in the patients, particularly in the frontal lobe, was quite robust. Owing to the close matching between subjects in the two groups, the difference in GSH concentration cannot be attributed to disparities in age or gender. Instead, this difference indicates the presence of oxidative stress that could at least partially account for the continuing decline in function in the absence of inflammatory activity in patients with SPMS. As noted previously, GSH is an endogenous antioxidant that counterbalances the generation of reactive oxygen species and thereby prevents oxidative damage to cells. GSH is consumed in this antioxidant defense 35 and subsequently replenished in the tissues over a matter of days. 36 Therefore, GSH levels are ‘dynamic’ measures, reflecting the current status of oxidative stress in the tissue instead of the static markers of accumulated neurodegeneration (e.g. T1 hypointensities and atrophy) recorded by conventional MRI. The significant reductions observed in this study indicate a potentially serious ongoing process of oxidative stress contributing to the neurodegeneration that characterizes SPMS. Regional mapping of GSH might uncover even greater levels of oxidative stress, perhaps in specific areas where extensive MS lesions are evident.
Recently, while this work was underway, a significant reduction of GSH was reported for seven MS patients using a subtraction-based editing method at 7 T. 37 The patients were found to have significantly lower GSH levels than the controls in gray matter, but not in white matter. Sample sizes were small, and no information was provided concerning the comparability of the patients and controls on potentially important factors such as age and gender or on the severity, duration, and subtype of MS in the patient sample. The reported finding that differences in GSH levels between MS patients and controls were confined to gray matter is interesting, but warrants further consideration. The assessment of gray and white matter differences is possible using the GSH CSI technique, as we have demonstrated previously in the case of GABA. 38 However, this assessment requires an assumption that the concentrations of the biochemical in question are homogenous throughout the total region. Our results indicate differences in GSH levels between the mostly frontal and mostly parietal regions, and therefore separate values for gray and white matter could not be derived from the present results. In essence, regional heterogeneity precluded efforts to obtain separate determinations for gray and white matter.
Since this was a small study, the correlations between GSH levels and clinical measures (EDSS, disease duration, and age of onset) were not conclusive. Further investigation of the relationships between GSH levels and physical disability measures is warranted. However, given the dynamic nature of GSH, repeated assessments of disability over time and an examination of time-lagged correlations with GSH levels would be especially interesting to pursue. A patient with severe disability but without any notable progression might be expected to have normal or near normal GSH levels, while a patient with modest but rapidly worsening disability might have a markedly lower GSH levels. The measurement of GSH could be particularly useful in identifying patients at high risk for more dramatic disease progression and therefore warranting more aggressive therapeutic intervention.
The presence of a marked reduction in GSH concentration in the frontal region suggests that further examination of the relationship between oxidative stress and changes in MS patients’ cognitive impairment may be useful. In particular, the cognitive assessment performed in such a study should include measures of executive functions known to be associated with frontal lobe integrity. Future studies also need to address whether reductions in GSH levels are unique to SPMS or are to be found in other disease subtypes such as relapsing–remitting and primary progressive MS. The role of oxidative stress early in the course of MS or in relationship to disease exacerbations is currently undetermined, as is the possible utility of targeting oxidative stress in a neuroprotective approach aimed at slowing or halting the progress of this disease. The development of the present CSI technique for measuring GSH substantially expands opportunities to investigate these issues.
Conclusions
In this study, the quantitative assessment of GSH in the brains of SPMS patients has been demonstrated using the selective multiple quantum CSI of GSH. Despite the small number of patients, we have demonstrated that GSH levels are markedly reduced in the brains of SPMS patients compared with healthy controls. Further study is needed to evaluate GSH in patients with different presentations of MS and to correlate changes in GSH with changes in functional status in MS patients. Research capitalizing on this approach for evaluating ongoing oxidative stress could lead to new understanding of the pathogenesis of MS and to the development of new therapies directed toward the cascade of events associated with disease progression.
Footnotes
Acknowledgements
The authors thank Dr. Jo Ann Lierman and Mr. Allan Schmitt for their clinical assistance and support of this study. A preliminary account of this work has been presented at the annual meeting of ACTRIMS in Atlanta, GA, on 31 May 2009.
Funding
This work was supported by funding from the National Multiple Sclerosis Society (Grant Number PP-1428 to Lynch) and partially from the NIH (Grant Number AG022193 to Choi). The Hoglund Brain Imaging Center is supported by grants from the NIH (Grant Numbers C76 HF00201 and P30 HD002528) and the Hoglund Family Foundation.