
Abstract
Keywords
Introduction
Hypointense lesions on T1-weighted (T1w) magnetic resonance images (MRIs), or ‘black holes', are considered one of the most promising imaging endpoints in multiple sclerosis (MS) clinical trials. 1 Black holes are typically defined as white matter lesions with a hypointense appearance relative to normal-appearing white matter (NAWM) in a T1w image and that also appear hyperintense in the corresponding co-registered T2-weighted (T2w) image. About half of newly formed black holes are transient and will return to an isointense state, while others do not resolve and these, called persistent or chronic black holes, have been shown to reflect irreversible demyelination and axonal damage. 2,3 Black holes have been extensively studied to determine their pathological and clinical relevance, 4 but despite the increasing knowledge on their pathological significance, their relationship to clinical features remains unclear. Specifically, the correlation between black hole volume and clinical measures, most notable the Expanded Disability Status Scale (EDSS), 5 has been very inconsistent. 4,6 The Spearman correlation (r) values in previous cross-sectional studies have ranged from non-significant 7,8 to significant and moderately strong (e.g., r = 0.58, r = 0.65). 9,10 This inconsistency can be attributed to a number of factors. The discrepancy between the clinical presentation of MS and the disease burden visible on MRI, commonly referred to as the clinico-radiological paradox, has been well documented. 11 Other considerations are the size and clinical diversity of the patient group, with the strongest correlations driven primarily by studies with a combination of relapsing–remitting MS (RRMS) and secondary progressive MS (SPMS) patients. 6 Additional factors that may affect the correlation in any given study include variations in lesion appearance due to pathological state, the MRI hardware and scanning sequence parameters, and methodological considerations for lesion classification. 2,12
A number of studies have shown that the image intensity within a black hole is related to the amount of tissue destruction, with the darkest areas reflecting the most profound, and therefore likely to be more permanent, damage. Histological evidence has shown that the degree of hypointensity within a black hole correlates to axonal density 13 and can be used to partially distinguish between demyelinated lesions and those that have undergone subsequent remyelination. 14 More recently, a tissue-specific imaging technique was used to demonstrate that chronic black holes with signal closer to cerebrospinal fluid (CSF) have lower magnetization transfer ratios, indicative of more advanced tissue damage, than those lesions with signal closer to white matter. 15 It has been suggested that because of the heterogeneous nature of hypointense lesions, methods of black hole volume measurement that account for such intensity variations may produce stronger imaging surrogate biomarkers of MS progression. 12 Despite the mounting evidence that the intensity heterogeneity of black holes is pathologically meaningful, there have been very few systematic studies on how the variations in intensity may influence the correlation to clinical measures. Most previous studies on black hole volume have relied on binary segmentations that included all visibly hypointense regions within a corresponding hyperintense T2w lesion (e.g., Van Walderveen et al., 9 Parry et al. 10 ). A notable exception is the study by O'Riordan et al., 7 who explored the effect of the degree of hypointensity on the correlation between black hole volume and EDSS by computing the lesion volume at several different intensity thresholds. They did not find a statistically significant correlation at any threshold, but the patient sample available was not optimal in that the EDSS scores were tightly clustered.
The goals of this cross-sectional study are to investigate the range of black hole volume versus EDSS correlation values that may be spanned by varying the degree of hypointensity for classifying the lesions, and to determine whether measuring the volume within a restricted intensity range can improve clinical correlation over the traditional approach of including all visibly hypointense regions. While lesions only reflect a limited aspect of MS pathology and black hole volume cannot be expected to correlate perfectly with any clinical measure, identifying the key sources of variation that affect this correlation would be useful to improve reproducibility across future studies and provide further insight into the utility of black hole volume as a surrogate biomarker. To this end, a highly automated image analysis procedure was applied to the scans of 24 patients with MS with well-distributed EDSS scores to compute their black hole volumes at nine different levels of intensity relative to the reference intensities sampled in NAWM and CSF. Two methods of volume computation, one that takes each voxel as a whole, and the other computing a fractional value based on relative intensity, were compared to explore a technique that could potentially make the optimal volume–EDSS correlation more robust to the intensity level used for lesion classification.
Materials and methods
Age (years), disease duration (years), EDSS, gender and MS type statistics for the 24 patients in the current study (µ = mean, σ = standard deviation, q1–3 = quantiles of the distribution)
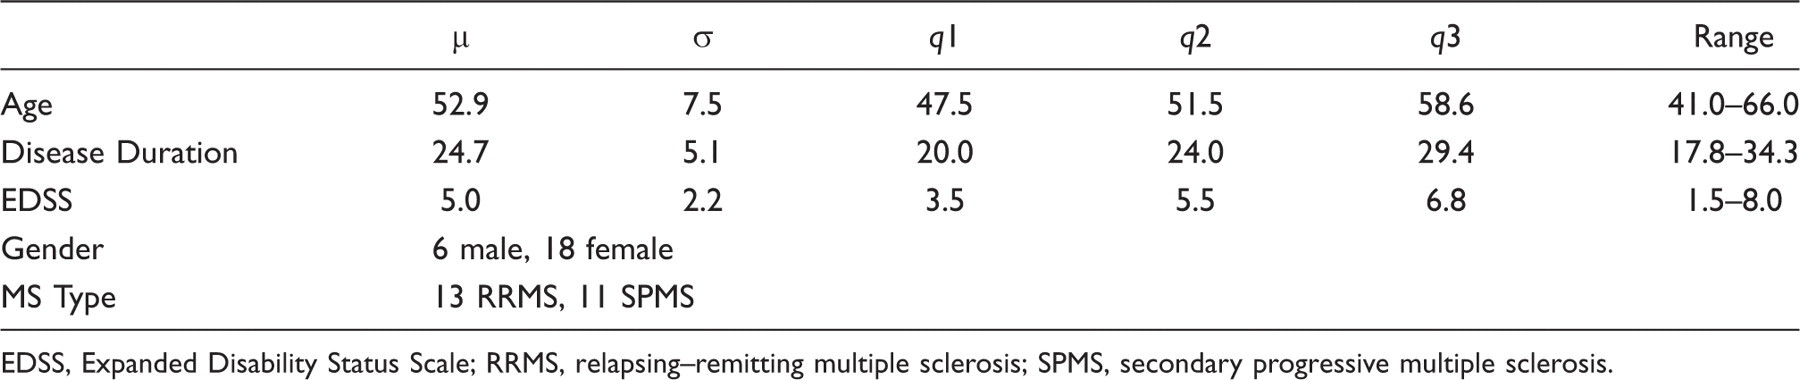
EDSS, Expanded Disability Status Scale; RRMS, relapsing–remitting multiple sclerosis; SPMS, secondary progressive multiple sclerosis.
Lesion classification and volume computation
The lesion classification and volume computation pipeline consists of two main preprocessing steps, followed by T2w lesion segmentation, then finally extraction and volumetric quantification of the black holes. To minimize operator bias, we employ a largely automated processing procedure that only requires manual interaction for identifying the T2w lesions. The first preprocessing step is the correction of MR intensity inhomogeneity using a multi-scale version
16
of the Non-parametric Non-uniform intensity Normalization (N3) method.
17
In the second preprocessing step, all non-brain tissue is removed with the Brain Extraction Tool (BET).
18
N3 and BET are both publicly available as free software. The rest of the segmentation procedure is diagrammed in Figure 1.
Overview of the black hole segmentation process. The only step that requires manual interaction is the identification of the T2w lesions. CSF, cerebrospinal fluid; GM, grey matter; MRI, magnetic resonance imaging; NAWM, normal-appearing white matter; T1w, T1-weighted; T2w, T2-weighted.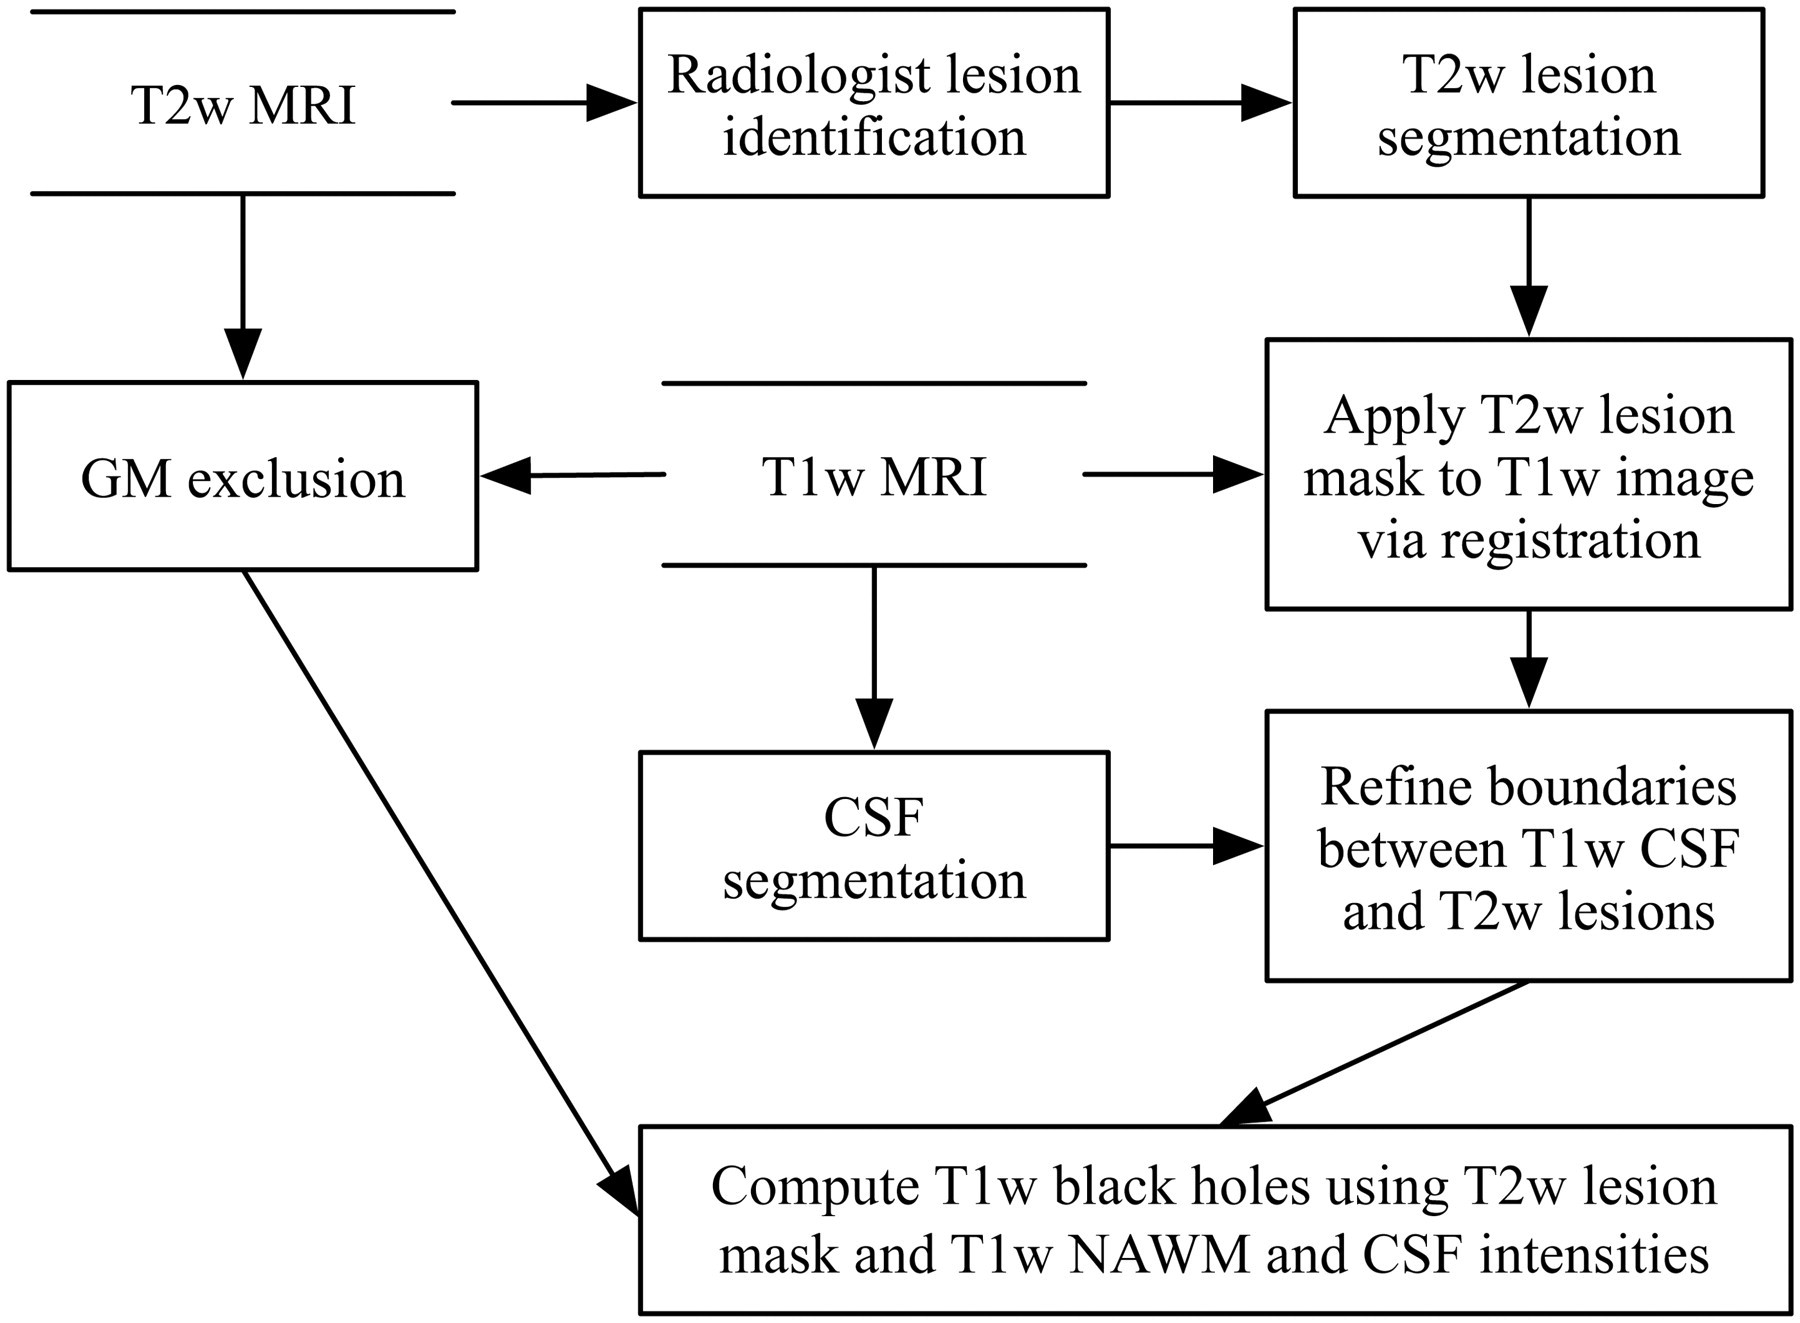
For T2w lesion identification, two radiologists who are highly experienced in MS lesion identification place one or more seed points to mark the location and approximate extent of each lesion. The radiologists follow a set of guidelines, consisting of three main points, that is minimalistic and allows the seeding procedure to be efficient and intuitive:
Mark all distinct hyperintense white matter regions consistent with MS pathology, regardless of their size. Place more than one point on a lesion if they feel that the additional points would help define the extent of the lesion. Place at least one point near the center of each lesion.
Full details on the point placement and subsequent automatic segmentation of the T2w lesions are described in previous work, 19 but briefly, the seed points are processed by a customized Parzen windows 20 classifier to estimate the intensity distribution of the lesions, and connected component and shape analyses are then used to reduce false positives. The T2w delineation component is the most complex of the entire black hole segmentation pipeline, and has the largest impact on overall accuracy and reproducibility. Fortunately, this component has been shown to agree closely and consistently to an established gold standard, and effectively reduces the variability between raters placing the seed points. 19 The overall accuracy of the T2w segmentation process is approximately 80% as measured by the Dice overlap coefficient. 21
To automatically extract the black holes from the T1w scans, each T2w scan is first registered to the corresponding T1w scan using a rigid transformation so that the T2w lesion mask can be overlaid to define a search space for the T1-hypointense regions. In some areas, most notably those with significant partial volume such as near the roof of the lateral ventricles, the CSF boundaries on the T1w scans can overlap slightly with those of the T2w lesion masks. The reasons for this may include overestimation of the T2w lesions, registration error and normal differences in CSF appearance on T1w versus T2w scans. To exclude CSF from contributing falsely to the black hole volume, a two-step CSF classification procedure is employed: (1) histogram-based thresholding 22 is applied to the T1w image to form a conservative CSF mask that mostly excludes partial volume areas; (2) the CSF mask on each slice is then refined using a 2D geodesic active contour (GAC), 23 which is a boundary model that deforms according to local gradient information, in this case expanding the CSF segmentation to coincide with detectable boundaries on the T1w image. The GAC is allowed to grow into the T2w lesion mask, thereby pushing it out of the CSF, but only up to a maximum of three voxels, which was empirically determined to be the maximum extent of the conflict region between the CSF/T2w lesion masks. The three-voxel constraint limits overgrowth errors in areas with exceptionally low gradients.
To extract the black holes from the refined T2w lesion mask at a given level of intensity, relative to the intensities of NAWM and CSF which may vary from scan to scan, the following upper threshold (tx
) is used to determine whether any given voxel x should be included:
where i NAWM, x is the NAWM intensity, taken as the mean of the T1w intensities of the 20 WM voxels that are closest to x on the same slice and also outside of the T2w lesion containing x, i CSF,slice is the mean CSF intensity over the entire slice, and l is the key parameter that is varied to span the range between NAWM and CSF. This method of computing an individual threshold for every voxel is designed to maximize the use of local contrast information and also naturally excludes gadolinium-enhanced areas. Grey matter is distinguished from WM and excluded from the computation of i NAWM, x by applying a modified fuzzy clustering algorithm 24 to the T2w/PDw combined intensity space. Every voxel x that has intensity ix ≤ tx is counted as a black hole voxel, with volume v equal to the product of the three voxel dimensions.
To assess how closely the automatic segmentation reflects the extent of total visible black hole burden, the radiologists manually delineated the full visual extent of all focal hypointensities on the T1w scans, excluding the enhanced areas, to provide a comparison to the computed results. Each radiologist independently traced all 24 scans, and upon review of the final segmentations, it was determined that the union of the two sets of manual results would most completely represent the lesion regions and best represent the traditional approach of black hole analysis that does not model intensity variations.
After the segmentation process, the black hole volumes are computed. In addition to the method above that counts each black hole voxel as a whole, a secondary volume is computed for each voxel by using the equation: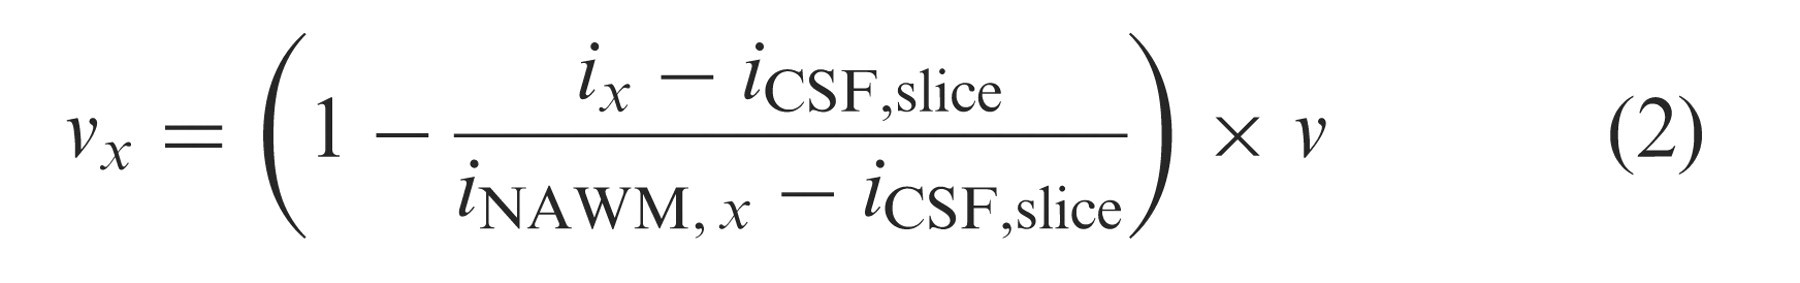
Once the volumes were computed, the Spearman rank correlations between vol l and EDSS and between IWvol l and EDSS were determined for each intensity level l. The similarity between the manual and automatic segmentations was quantified for each l using the Dice overlap coefficient. To provide greater context for the black hole results, we calculated a number of statistics relevant to T2w lesion volume and disease duration. Specifically, for each l we computed the percentage of the T2w lesion volume occupied by T1w lesions, the correlation between T2w lesion volume and black hole volume, and the correlation between T2w lesion volume and EDSS to determine whether the T1w lesions provide additional information to T2w lesion load and have a stronger relationship to clinical parameters as observed in previous studies. In addition, we computed the correlation between disease duration and EDSS and between disease duration and black hole volume. We also applied the Multiple Sclerosis Severity Score (MSSS), 25 which uses EDSS and disease duration to produce a new measure based on the distribution of disability in patients with comparable durations, and repeated our black hole correlation analysis with the MSSS.
Results
We compared the automatic and radiologist segmentations to determine the accuracy and consistency of the black hole computation method. The best overlap agreement between the automatic and union of the two manual segmentations occurs at l = 0.80 with an overall Dice similarity of 0.69, which is comparable to that between the segmentations performed by the two radiologists (0.71). In addition, the standard deviation in Dice similarity between the automatic and manual methods (0.11) is also similar to that between the radiologists (0.14).
Black hole volume mean (μ vol l ) and standard deviation (δ vol l ) in mm 3 , percentage of T2w lesion volume occupied by T1w black holes (T1w/T2w %), and Spearman's correlation (r) between EDSS scores and vol l normalized to parenchymal volume, computed at nine different intensity levels
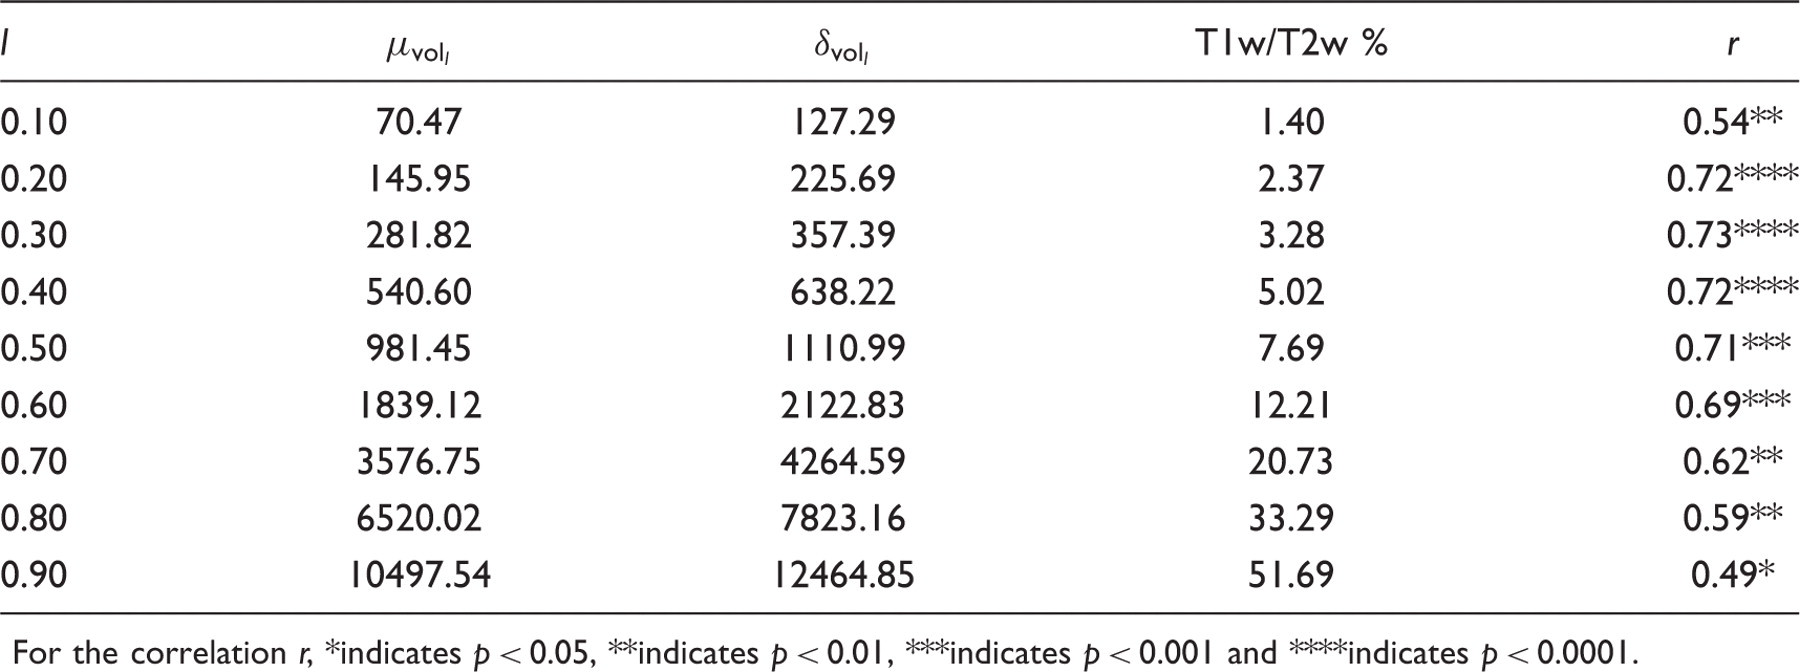
For the correlation r, *indicates p < 0.05, **indicates p < 0.01, ***indicates p < 0.001 and ****indicates p < 0.0001.
The fact that the automatic and manual methods agree most strongly at l = 0.80 means that this is the intensity level that most accurately targets all visibly hypointense regions. At this level, the EDSS correlation is 0.59 (p < 0.01). The mean volume computed at l = 0.30, the level with the highest correlation (0.73, p < 0.0001), is only 4.32% of that computed at l = 0.80, which means the maximum correlation for this data set occurs when only a very small, dark subset of the visible black hole voxels are included. Figure 2 illustrates the black holes extracted from a sample slice at l = 0.80 and l = 0.30.
Examples of black holes extracted at two different intensity levels. Left: T1w image with visible black holes. Middle: black holes computed at l = 0.80 (in purple). Right: black holes computed at l = 0.30 (in purple). The lesions computed at l = 0.80 correspond most closely to expert manual segmentations, while the volumes computed at l = 0.30 have the highest correlation to Expanded Disability Status Scale over all scans in the current data set. (Online version in colour).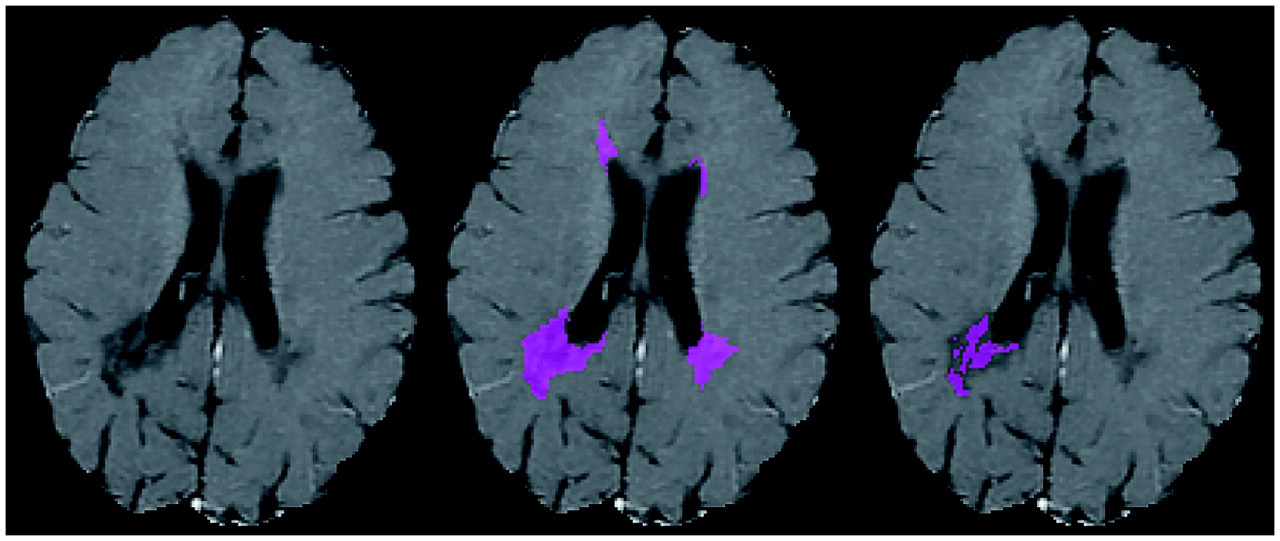
Intensity-weighted black hole volume mean (μ lWvol l ) and standard deviation (σ lWvol l ) in mm 3 , and Spearman's correlation (r) between EDSS scores and IWvol l normalized to parenchymal volume, computed at nine different intensity levels
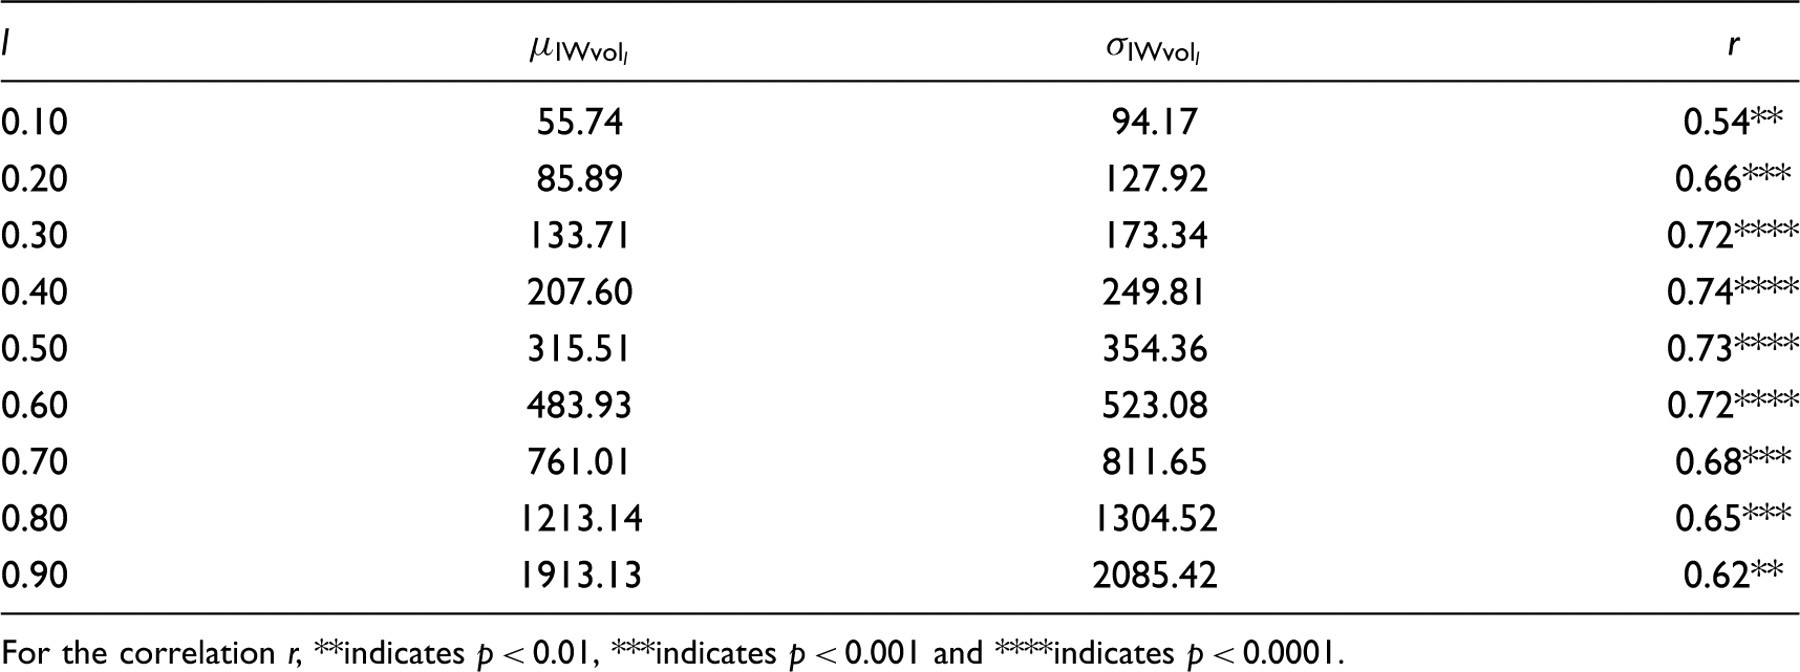
For the correlation r, **indicates p < 0.01, ***indicates p < 0.001 and ****indicates p < 0.0001.
Figure 3 is a graph of the volume to EDSS correlations with and without intensity weighting. The intensity-weighted correlation curve is flatter, more centered to the middle of the range, and more symmetrical, but the magnitudes of the two peaks are almost identical.
Black hole (BH) volume and intensity-weighted black hole volume correlation to Expanded Disability Status Scale (EDSS) at nine different intensity levels. The intensity-weighted correlation curve is flatter, more centred to the middle of the range, and more symmetrical, but the magnitudes of the two peaks are almost identical.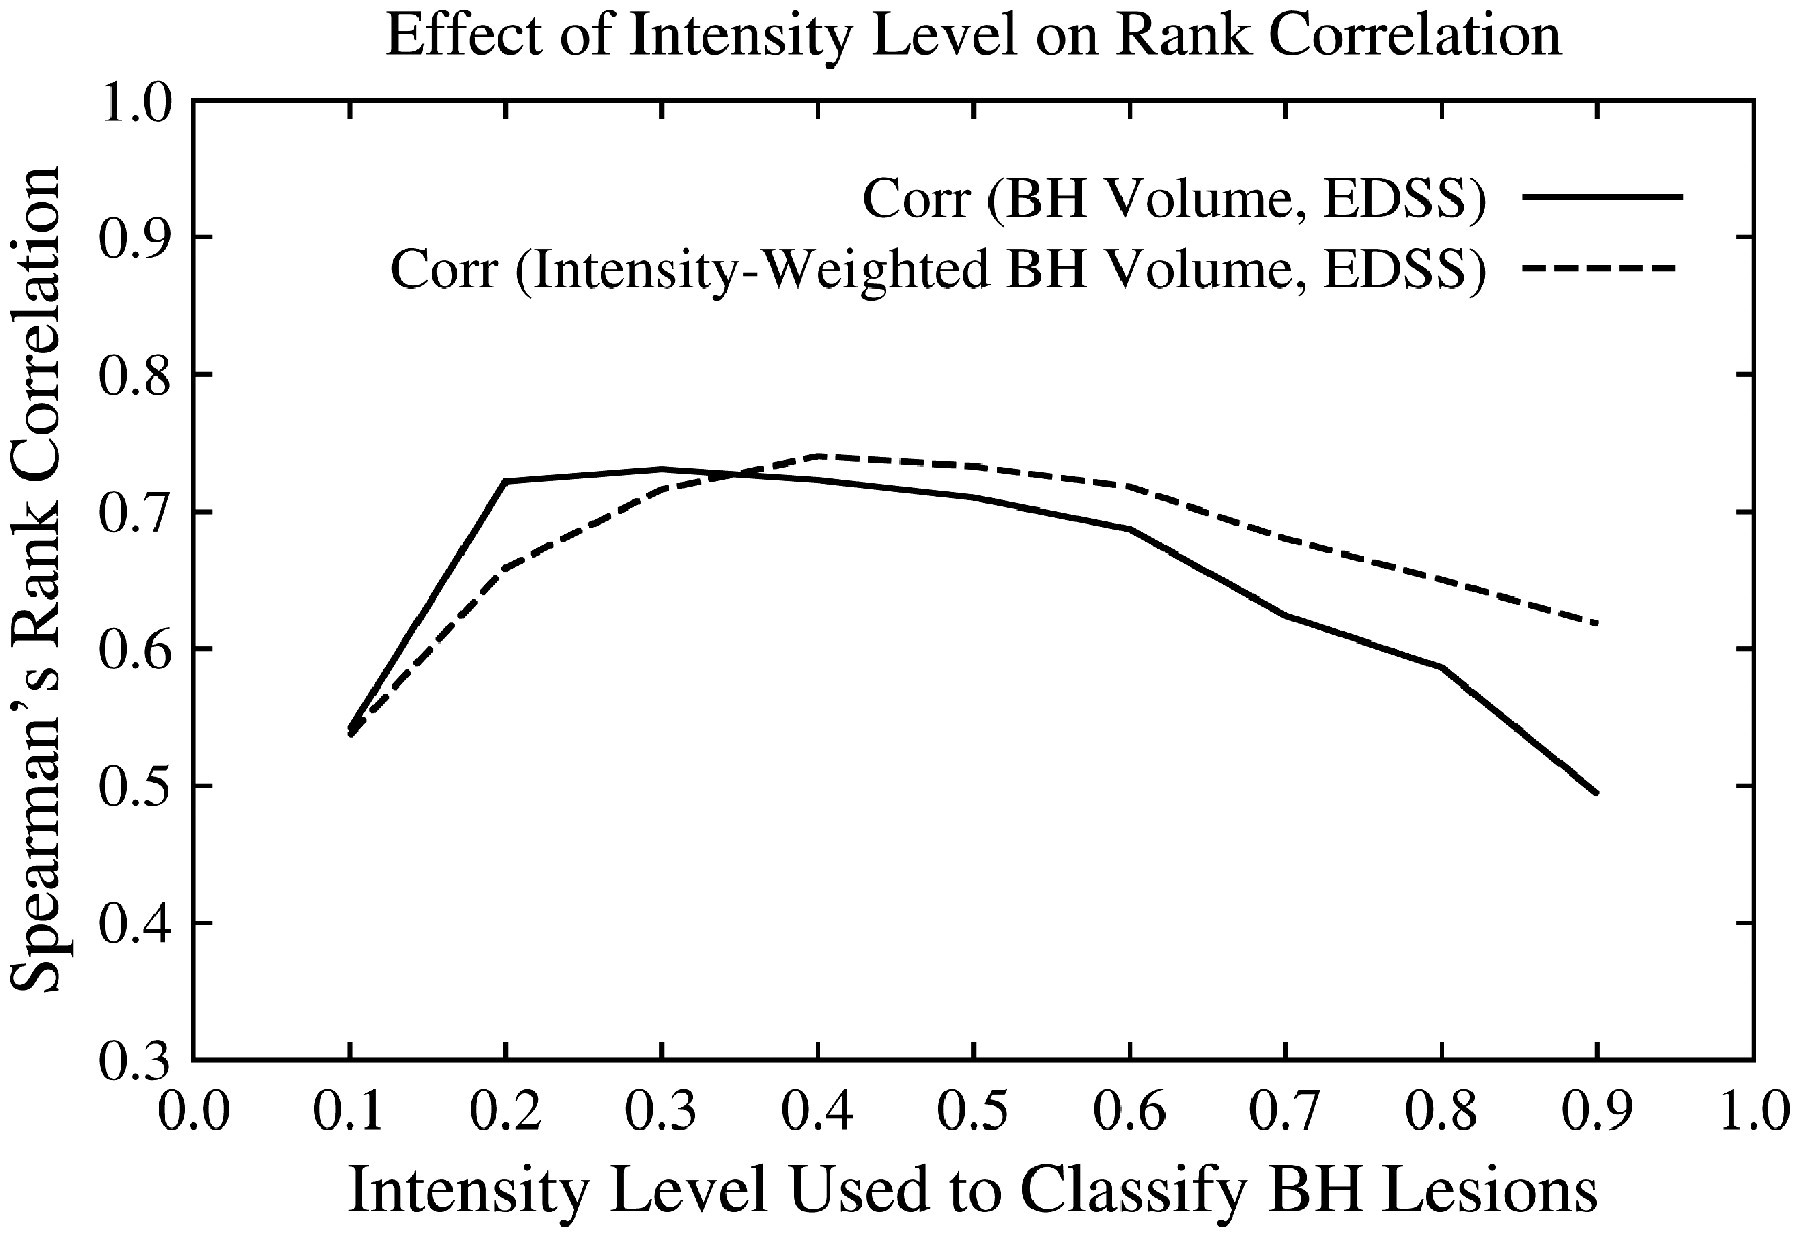
The correlation between T2w lesion volume, normalized to parenchymal size, and EDSS is 0.431 (p < 0.05), which is lower than the T1w lesion to EDSS correlation at any given intensity level for either computation method. The correlation between T2w lesion load and black hole volume without intensity weighting is 0.97 (p < 0.00001) at l = 0.80, which is the intensity level producing the strongest agreement between the automatic and manual black hole segmentations. At l = 0.30, the level with the highest correlation between T1w lesion volume and EDSS, the correlation between T1w and T2w lesion loads drops to 0.70 (p < 0.001), and the black holes only occupy 3.28% of the T2w lesion volume (Table 2).
In this patient sample, there is no significant correlation between disease duration and EDSS or disease duration and black hole volume at any intensity level for either computation method. In addition, adjusting the EDSS for disease duration by using the MSSS results in very similar correlations to those produced by using the EDSS alone. However, it should be noted that four of the patients had disease durations of 31, 32, 33 and 34 years, which are longer than the valid range of 30 years for applying the MSSS, and the values had to be clamped.
Discussion
This study has yielded some intriguing results on the influence of intensity variations on the correlation between T1w hypointense lesion volume and clinical disability as measured by EDSS. The most striking observation is the large range of correlation values obtained by varying the intensity level l used for lesion classification (0.49–0.72 for vol l , 0.54–0.74 for IWvol l ). While the correlation values near the high end of the observed range are strong (0.7+), the well-distributed nature of the EDSS scores may be a dominant factor, and the range of correlations likely represents a more general result than the values themselves.
In addition to using a clinically diverse patient group, there may be other methodological reasons for the range in correlation values and the smooth nature of the curves shown in Figure 3. To reduce the concerns of scan-to-scan variations in lesion appearance, we used NAWM and CSF as intensity references that should capture some of the signal fluctuations. O'Riordan et al. 7 also used NAWM and CSF to define black holes, but they worked with a much more restricted range to avoid overlapping intensities between black holes and CSF/NAWM, presumably because they did not have registered T2w lesion masks that could have been used to prevent CSF regions from being misclassified as black holes. In our case, the T2w lesion masks allowed us to explore the entire range from CSF to NAWM. However, to minimize the number of variables we made the simplifying assumption that the optimal value of l applies equally to all regions of the brain. Given that different regions can have different intensities for the same tissue type, a more refined analysis would include individual weights for each region.
It has also been suggested that the subjectivity of manual interaction may have impacted previous studies of black holes, 2 which tend to have much less distinct boundaries than T2w lesions. This provided motivation for our use of a largely automated method to reduce measurement noise. However, to reduce false positives stemming from the lack of specificity of conventional MRI, we did ask the radiologists to manually identify the T2w lesions. It would be of great interest to adapt some of the recent black hole classification methods 26,27 that do not require any manual processes except for the provision of expertly labeled data used to set the algorithmic parameters.
In this patient sample, the highest correlations values are associated with a small subset of the total black hole voxels (<5% for l = 0.30, <9% for l = 0.40) and have intensity values lower than or equal to 30–40% of the range from CSF to NAWM. The association of greater clinical significance with the darker regions seems to lend further support to previous studies that indicate such areas have more profound damage. The optimal value of l is likely to vary across data sets, and this single data set cannot be used to recommend a specific value. However, the differences in correlation within 20–60% of the CSF to NAWM range are small (≤0.06), and it seems promising that, given enough data, determining a useful range of values is a feasible goal, especially when using the intensity-weighted method of volume computation. Intensity weighting improves the ability to account for finer signal variations due to pathological state as well as partial volume, and makes the correlation curve more robust to the intensity level used for classification. We envision that if similar curves are observed across other data sets, the approach of targeting the darker regions would eventually replace the common strategy of including all visibly hypointense areas. This new volume measure would be used wherever total black hole burden is currently used, whether on its own or in a composite imaging score. As the correlation curve is fairly flat (Figure 3), especially when using intensity-weighted volumes, a conservative but still beneficial approach to choosing an intensity level could be to use a value close to 0.5, which may not yield the optimal correlation but the result should be close, and there would be little risk of encountering a sharp drop. However, as described below, further validation with advanced imaging, longitudinal data, larger samples and other disability measures will ultimately decide how the method would be best used in MS image analysis.
This work was motivated by histopathology studies that show the degree of T1w hypointensity is associated with the severity of tissue damage, and such evidence allows us to conjecture that the increased correlation to disability that we obtained by limiting the volume measure to the darker voxels is the result of restricting the region-of-interest to the more damaged areas, but the conventional MRIs used in this study lack the pathological specificity needed to confirm our theory. Future studies that use advanced MRI techniques, such as myelin water 28 and magnetization transfer 15,29 imaging, in combination with the current analysis method, would allow us to see the differences in composition and structural integrity at the various levels of hypointensity. For example, values of l at the higher end may primarily reflect inflammation and edema, while the lower values may indicate demyelination and axonal transaction.
This study only used data from a single time point, therefore only a cross-sectional analysis could be performed. Adjusting for disease duration did not significantly alter the results, but using longitudinal data may still prove valuable as demonstrated in previous studies with shorter time intervals (e.g., Van Walderveen et al., 9 Truyen et al. 30 ). For example, distinguishing between transient and chronic black holes, which are indicative of more permanent injury, may define more precisely the relationships between the intensity and duration of black holes. It remains to be seen whether intensity-based analysis has enough discriminative power to supplant longitudinal methods for identifying irreversible damage, but perhaps using the degree of hypointensity to further classify voxels within longitudinally identified persistent black holes would yield greater sensitivity to clinical parameters.
This study used a small patient sample relative to those used in most MS clinical trials. Larger groups of patients, perhaps segregated by disease course, with scans acquired from multiple sites, should be included in future studies. The method that we used for T2w segmentation has already been validated for large multi-center studies, and preliminary experiments have shown that the black hole extraction method can be used with little to no modification. The results could provide a practical estimate of the range of intensity levels that could be used to obtain more consistent and potentially stronger EDSS correlations in cross-sectional studies.
The measure of disability that we used for this study, namely the EDSS, despite being an extensively used clinical parameter in MS, has its own limitations. The non-linearity and heavy emphasis of the EDSS on ambulation have been well documented, and other measures that incorporate additional dimensions of disability, such as the Multiple Sclerosis Functional Composite (MSFC), are available and should be investigated. 31
In conclusion, we have shown that a large range in correlation values between black hole volume and EDSS can be observed by varying the intensity level, relative to the reference intensities sampled in CSF and NAWM, used to classify the lesions. In this data set, the greatest similarity to expertly traced lesions was obtained by including all voxels that are only slightly hypointense (≤80% of the CSF to NAWM range), but the strongest correlations were found by limiting the black hole regions to a small subset of the darkest voxels (≤30–40% of the CSF to NAWM range). Using an intensity-weighted method of volume computation improved the robustness of the correlation to parameter selection.
Footnotes
Funding
This research received no specific grant from any funding agency in the public, commercial, or not-for-profit sectors.
Conflict of interest statement
The authors declare that they have no conflicts of interest.