
Abstract
Introduction
Although multiple sclerosis (MS) is classically considered a typical white matter (WM) disease, recent histopathology studies have shown that a substantial part of the cortical grey matter (GM) is involved in the pathological process as well.1–3 Cortical demyelination may occur in four different patterns, 4 based on the location of the lesion within the cortex and/or subcortical WM: mixed GM–WM lesions (type I lesions) which affect both the GM and subcortical WM; smaller perivascular intracortical lesions (type II); widespread subpial demyelination (type III); and type IV lesions, which affect the entire width of the cortex. Besides demyelination, subtle neuroaxonal and glial loss, remyelination and inflammation have been found in the MS GM.5–9
It has been suggested that GM lesions are important contributors to clinical disease severity and disability in MS.10–12 Clinically, cortical lesions (CLs) have been correlated with cognitive impairment, epilepsy, depression, fatigue and physical disability.13–19 However, studies of the direct effects of focal CLs on clinical measures have been handicapped by the fact that only a small percentage of CLs can be detected by conventional magnetic resonance imaging (MRI).20,21 So far, it is unclear why it is possible to detect some CLs with conventional T2-weighted MRI, but not others. Understanding the selective conspicuity of cortical MS lesions on conventional MRI will enable a more accurate and reliable quantification of cortical tissue damage in vivo, and hence a more accurate correlation with clinical, and especially cognitive, deficits.
The goal of the current study was therefore to investigate whether MRI-visible CLs differ from MRI-invisible cortical lesions. In addition to histopathological measures, we employed three quantitative MRI (qMRI) techniques, T1- and T2-relaxation time measurements22,23 and magnetization transfer ratio (MTR),24–26 to characterize the cortical tissue. These qMRI techniques have all detected GM changes early on in the disease and could be related to, or even predict, clinical disability.27–30
Materials and methods
Subjects
Sixteen coronally cut, 10-mm-thick full-hemispheric brain slices of 10 patients with chronic MS (mean age 68.9 years; six women) were selected at autopsy and were formalin-fixed for several weeks. Table 1 provides demographic details of the MS donors. Clinical courses were determined by means of retrospective medical record reviews according to established criteria. 31 Ethics approval was obtained by the institutional ethics review board, and all the donors, or their next of kin, gave informed consent for the use of their tissue and medical records prior to death.
Demographic data of the studied cases
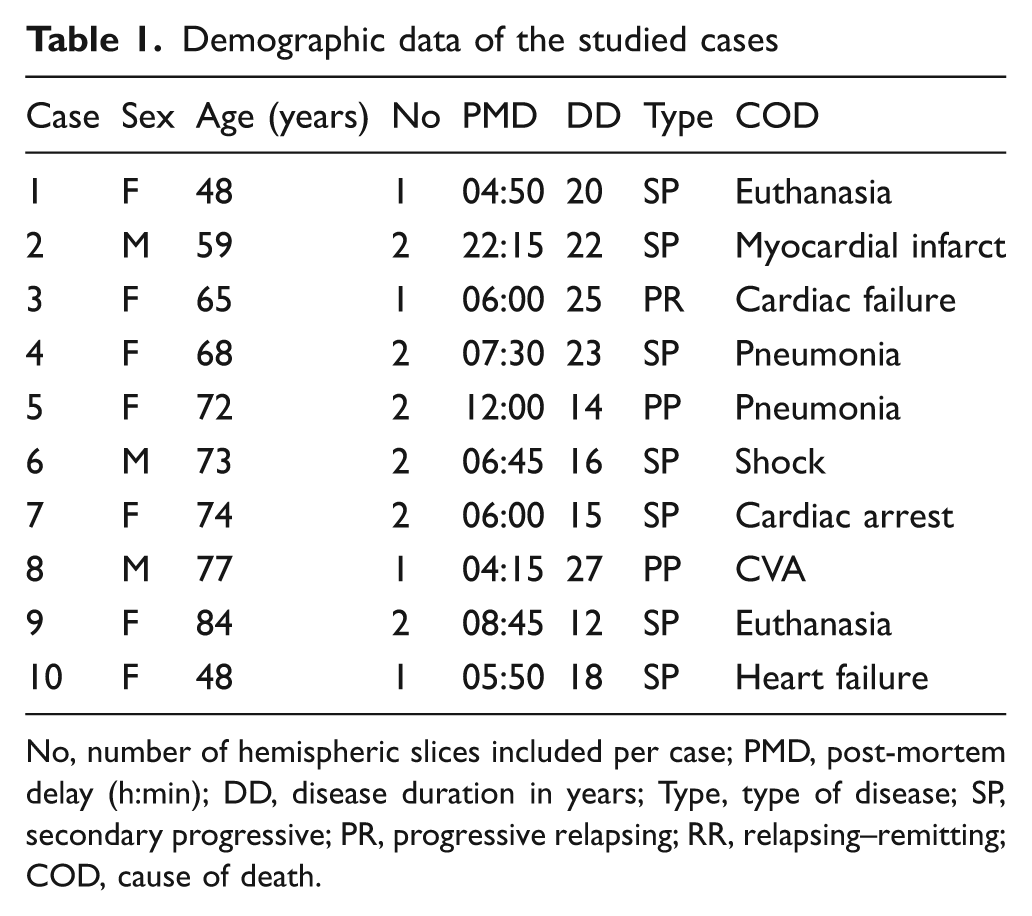
No, number of hemispheric slices included per case; PMD, post-mortem delay (h:min); DD, disease duration in years; Type, type of disease; SP, secondary progressive; PR, progressive relapsing; RR, relapsing–remitting; COD, cause of death.
Post-mortem MRI
Examinations were performed with a 1.5-T MR system (Magnetom Vision scanner, Siemens, Erlangen, Germany) by using a standard circularly polarized head coil. For reduction of tissue boundary artefacts, 21 each brain slice was immersed in a non-magnetic oil (Fomblin; perfluorinated polyether, Solvay Solexis, Weesp, The Netherlands). 29 Dual-echo T2-weighted spin-echo (T2SE) images (TR/TE1/TE2/NEX 2755 ms/45 ms/90 ms/2; field-of-view (FoV) 80 mm × 128 mm; matrix size 160 × 256; slice thickness 3 mm), as well as 3D fluid-attenuated inversion recovery (3D-FLAIR) images (TR/TE/TI/NEX: 6500 ms/120 ms/2200 ms/1; FoV 125 mm × 200 mm; matrix size 160 × 256; slice thickness 1.25 mm) were obtained from each brain slice.
For the T1 measurements, six sets of 3D fast low-angle shot (FLASH) images were acquired (TR/TE/NEX 15 ms/4 ms/4; slice thickness 3 mm; FoV 80 mm × 128 mm; matrix size 80 × 128) with nominal flip-angles between 2° and 25°. B1-maps were generated from five additional sets of 3D-FLASH images (TR/TE/NEX 15 ms/5 ms/4; partition thickness 3 mm; FoV 80 mm × 128 mm; matrix size 80 × 128) with nominal flip-angles varying between 140° and 220°. 30 Post processing yielded T1 maps and corresponding proton density (PD) maps.
For T2 measurement, a multi-echo Carr Purcell Meiboom Gill sequence (TR/NEX 2500 ms/1; FoV 80 mm × 128 mm, matrix size 80 mm × 128 mm, slice thickness 3 mm) with alternating 180° pulses and 16 equidistant echoes, starting from 20.5 ms, was applied, yielding a single T2 relaxation time per pixel, after a mono-exponential T2-fit.
MTR-maps were acquired with a 3D-FLASH sequence (TR/TE/NEX 27 ms/4 ms/1 partition thickness 5 mm; FoV 80 mm × 128 mm; matrix size 80 × 128; flip angle 20°), one with a Gaussian MT pre-pulse (MS), and one without (M0). (See Figure 1D–F for qMRI maps.)
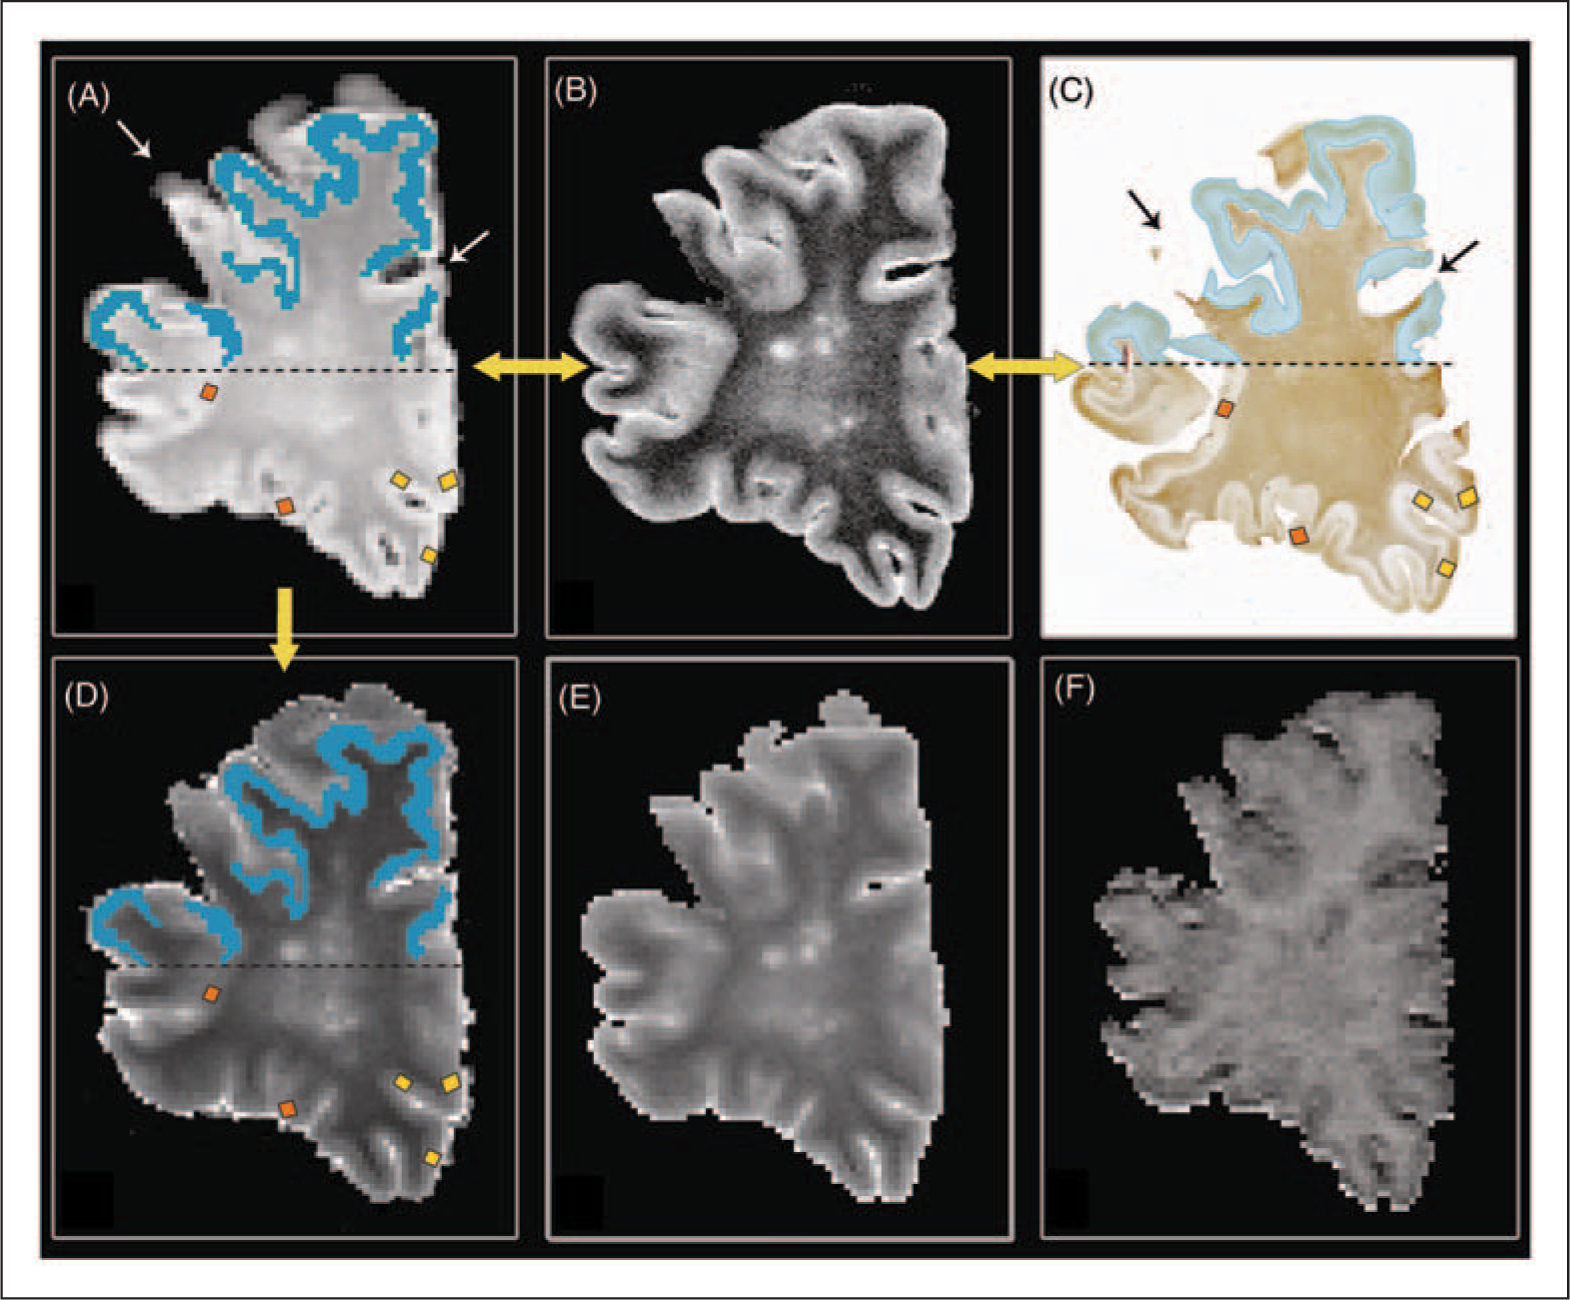
Demonstration of MRI-to-histopathology matching and placement of regions of interest (ROIs) on a post-mortem multiple sclerosis brain slice.
Neuropathology and immunohistochemistry
After MR imaging, the brain slices were cut in half to reveal the imaged plane, and embedded in paraffin. Stainings and immunohistochemistry were performed on 10-µm-thick sections. To assess tissue morphology and general tissue quality, as well as density of the neuropil (neuronal cell bodies, axons, dendrites), haematoxylin–eosin (HE), Nissl and Bodian silver stains were performed.
Immunohistochemistry was performed on adjacent sections with antibodies against the following targets: glial fibrillary acidic protein (GFAP; DakoCytomation, Glostrup, Denmark), antigen presenting cells / microglia, (HLA-DR; courtesy of Dr Hilgers, Amsterdam), proteolipid protein (PLP; Serotec, Oxford, UK) and fibrinogen (indicative of blood–brain barrier leakage; DakoCytomation, Glostrup, Denmark). Bound primary antibodies were detected using the EnVision® method (DakoCytomation, Glostrup, Denmark).
Regional analysis of cortical GM: Region-of-interest placement
After visual matching of the hemispheric tissue sections to the corresponding MRI planes using as many anatomical landmarks as possible, 32 CLs were counted and classified (type I–IV) on PLP-stained sections. CLs were defined as areas of complete demyelination on those sections.3,6,20,21 Size of CLs was calculated on scanned PLP-stained sections using ImageJ_1.37 (http://rsbweb.nih.gov/ij). Non-lesional GM (NLGM) was defined histopathologically on PLP-stained sections as areas devoid of any demyelination. CLs on MRI were scored in consensus by two experienced raters according to the following criteria (and as published previously): 21 (1) lesions should appear hyperintense on MRI, intermediate to the signal intensities of WM lesions and adjacent normal cortex; (2) lesional borders should be irregularly shaped (as in histology); and (3) lesions should not be clearly traceable over several subsequent slices (to avoid aberrant scoring of vascular structures).
qMRI measures and neuropathological measurements were calculated within regions of interest (ROIs), which were placed onto CLs and NLGM in all tissue sections and in corresponding MRI areas. To avoid bias, ROI sizes were kept as constant as possible. However, to ensure that ROIs were accurately placed within T2 hyperintensities only (so as to avoid partial voluming with NLGM), ROI shapes were sometimes slightly modified (elongated, but running less deep) to fit the more superficial hyperintensities (likely type III CLs). ROIs were placed on the PD maps, which were calculated from the flip angle arrays, and were subsequently copied onto the qMRI maps; matching accuracy was checked once more using the PD-weighted images as a reference. To assess the reproducibility of ROI placement, 50% of the ROIs were placed twice by the same observer (with 60 days in between the ROI placements) and intraclass correlation coefficients were calculated. (See Figure 1, A–D for placement of ROIs and matching procedure).
Neuropathological abnormalities within the ROIs were quantified by measuring staining intensity on digital images of histological sections, using ImageJ_1.37 as analysis software. The program was set in 8-bit mode and the mean staining intensity within the ROIs was measured (arbitrary units, ranging from 0–255). High values (increased light transmittance) correspond with low staining intensity. For each analysed ROI, mean T1 and T2 relaxation times, MTR, and the presence of histopathological abnormalities was assessed. Variation in staining intensity in cortical layers was accounted for by selecting NLGM areas of the same size and in the same cortical layers as the corresponding CLs. Light transmittance was used to quantify neuroaxonal densities on Bodian (Tm(Bodian)) and Nissl (Tm(Nissl)) stainings. Gliosis was assessed by light transmittance measurements on GFAP stainings (Tm(GFAP)), and blood–brain barrier leakage on fibrinogen stainings (Tm(fibrinogen)). The presence of myelin (PLP stainings) within the ROIs was assessed as either present or absent; in addition, staining intensity was measured on PLP-stained sections. Similarly, microglial cells were scored on the HLA-DR stained sections (400× magnification) as present or absent.
Global analysis of cortical GM: Histograms
Besides regional (ROI) analyses, the entire cortex (including MRI-visible lesions) was manually outlined on the calculated PD maps, and these outlines were copied onto the T1- T2-, and MTR-maps. This was done to calculate correlations between qMRI measures and histopathology stainings on a more global basis, as ROIs were conservatively placed and the total amount of lesional pathology may thus have been underrepresented. Pixels with partial volume at the inner and outer borders of the cortex were carefully excluded. Histograms were calculated for the manually outlined areas of the GM, and were normalized and smoothed by using a running average. Mean T1, T2, and MTR values, peak height, peak location and peak width (full width at half maximum) were then extracted from each histogram. To guarantee an accurate matching of the MR images to the corresponding tissue sections, each of the calculated PD maps was separately matched with the corresponding tissue section (Figure 1A–D). Next, the cortical GM was manually outlined in all tissue sections, and neuroaxonal densities, myelin densities, gliosis and blood–brain barrier leakage were assessed by light transmittance as described above. The overall percentage of demyelination was measured on PLP-stained sections and was calculated as (lesion volume/overall cortical volume)*100. Lesion volumes were measured with ImageJ_1.37.
Statistical analysis
Data analysis was performed by using SPSS version 14.0 for Windows (SPSS, Inc., Chicago, IL, USA). qMRI measurements and quantitative neuropathological data were compared by means of a general linear mixed model analysis, accounting for a nested design, where required (i.e. when there were significant interactions on slice and ROI levels). Pairwise comparisons were performed between MR-visible and MR-invisible CLs and between cortical lesions and NLGM. Bonferroni-corrected p < 0.05 was considered statistically significant. Pearson’s correlation coefficient (r) was used to investigate correlations of qMRI ROI and histogram parameters with transmittance measurements. For nonparametric correlations, Spearman’s rank correlation coefficient (ρ) was used. Significance was accepted at the level of p < 0.05. The intrarater variability for ROI positioning was expressed as intraclass correlation coefficient between subjects variance and total variance, calculated on basis of a restricted maximum likelihood method.
Results
On the PLP-stained sections, 187 cortical GM lesions were counted, the majority of which consisted of type III lesions (151 lesions, 80.7%). In total, 24 lesions (12.8%) were classified as type II, seven lesions (3.7%) as type IV, and five lesions (2.7%) as type I, consistent with previous histopathology results.4,20 The average amount of overall cortical demyelination per hemispheric brain slice was 7.7%, varying between 0% and 39.5% per section.
Regional analysis of the cortical GM (ROI analysis)
qMRI and histopathological comparison between MRI-visible and MRI-invisible CLs
A total of 91 ROIs were placed and analysed in representative cortical areas; 42 ROIs were placed in a cortical GM lesion each, and 49 ROIs in non-lesional GM. Of the 42 ROIs, 26 were placed in MRI-visible CLs, which consisted of five type I, one type II, 18 type III and two type IV lesions. The remaining 16 invisible lesions consisted of one type I, one type II, 11 type III, and three type IV lesions. Intraclass correlation coefficients showed good reliability for the placement of cortical ROIs on the qMRI maps (ICCT1 = 0.95, ICCT2 = 0.83, ICCMTR = 0.82). Neither qMRI measurements nor transmittance measurements showed a significant difference between visible and invisible CLs (Table 2). Both Tm(Bodian) and Tm(Nissl) measurements differed significantly between NLGM and visible CLs, as well as between NLGM and invisible CLs, respectively. T2 relaxation times differed significantly between visible lesions and NLGM (see Table 2).
Regional analysis of quantitative magnetic resonance imaging measurements and transmittance measurements in the cortical grey matter; model-based estimates
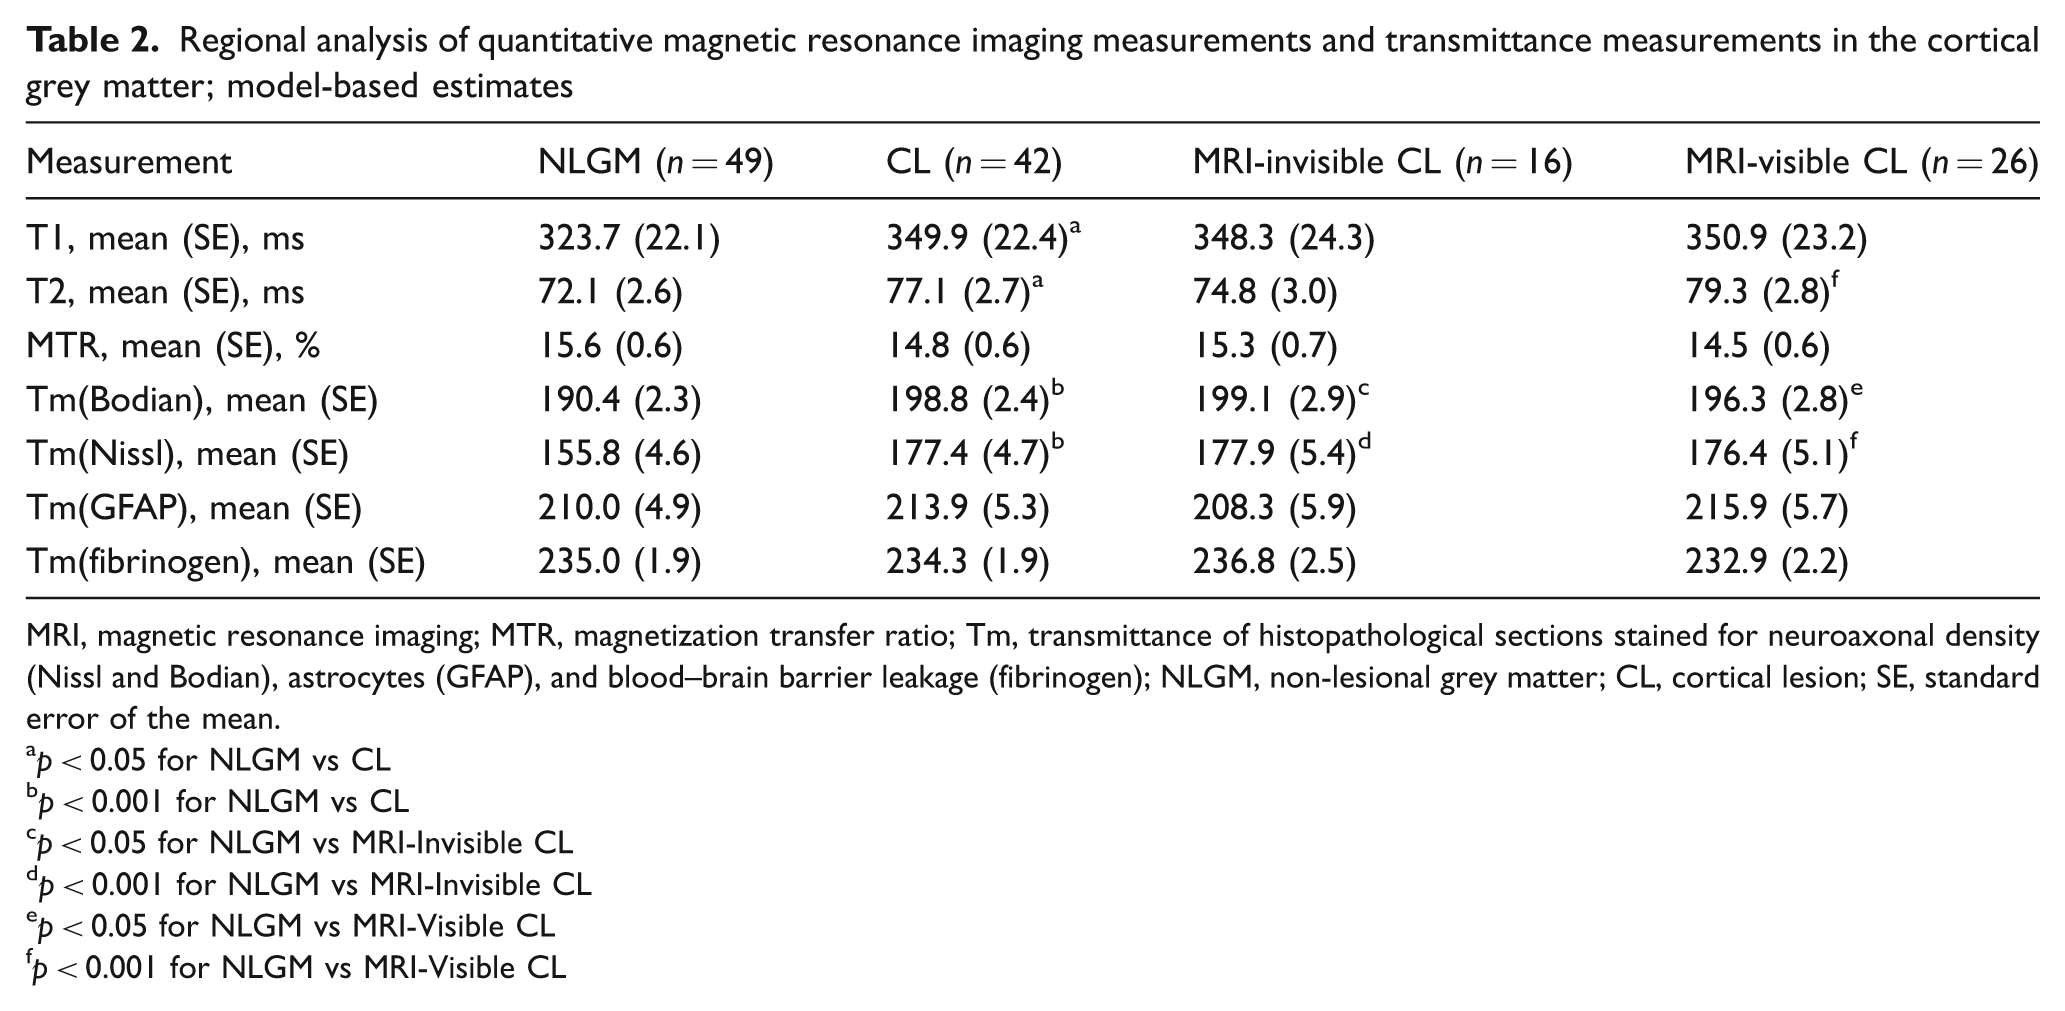
MRI, magnetic resonance imaging; MTR, magnetization transfer ratio; Tm, transmittance of histopathological sections stained for neuroaxonal density (Nissl and Bodian), astrocytes (GFAP), and blood–brain barrier leakage (fibrinogen); NLGM, non-lesional grey matter; CL, cortical lesion; SE, standard error of the mean.
p < 0.05 for NLGM vs CL
p < 0.001 for NLGM vs CL
p < 0.05 for NLGM vs MRI-Invisible CL
p < 0.001 for NLGM vs MRI-Invisible CL
p < 0.05 for NLGM vs MRI-Visible CL
p < 0.001 for NLGM vs MRI-Visible CL
qMRI measures within the ROIs correlated with several transmittance values: longer T2 relaxation times and lower MTR values correlated with demyelination (ρ = 0.30, p < 0.01, and ρ = −0.27, p < 0.05). Associations of T1, T2 and MTR with gliosis, microglial activation or fibrinogen leakage did not reach statistical significance. A correlation was detected between higher T1 relaxation times and lower staining intensities for Nissl, but not for Bodian stainings (ρ = 0.27, p < 0.05).
Upon comparison with the PLP-stained sections, 70 (37.4%) of the CLs were visible on conventional MRI (PD and/or FLAIR) (Figure 2; 1,2). Among those lesions, 50 (71.4%) were scored as type III lesions, 10 (14.3%) as type II lesions, five (7.1%) as type I, and five (7.1%) type IV lesions, respectively. Some 33.1% of all type III lesions and 41.7% of all type II lesions were detected on MRI. Type I and IV lesions were best detected, with a visibility of 100% and 71.4%, respectively. MRI-visible CLs were significantly larger than invisible lesions (mean 13.3 mm2 ± 1.7 mm2, versus 6.9 mm2 ± 1.3 mm2, respectively; p = 0.001), and visible type III lesions extended deeper into the lower cortical layers than invisible type III lesions (lesion width as calculated from the pia downwards: 1.9 mm for visible versus 1.3 mm for invisible lesions, p < 0.05). Semiquantitative assessment of microglial activation showed no difference between MRI-visible and MRI-invisible CLs (Figure 2; 3a–7b). Visible CLs correlated with the overall number of lesions in the brain slice (r = 0.96, p < 0.01) and with the overall percentage of demyelination (r = 0.78, p < 0.01) per hemispheric brain slice.
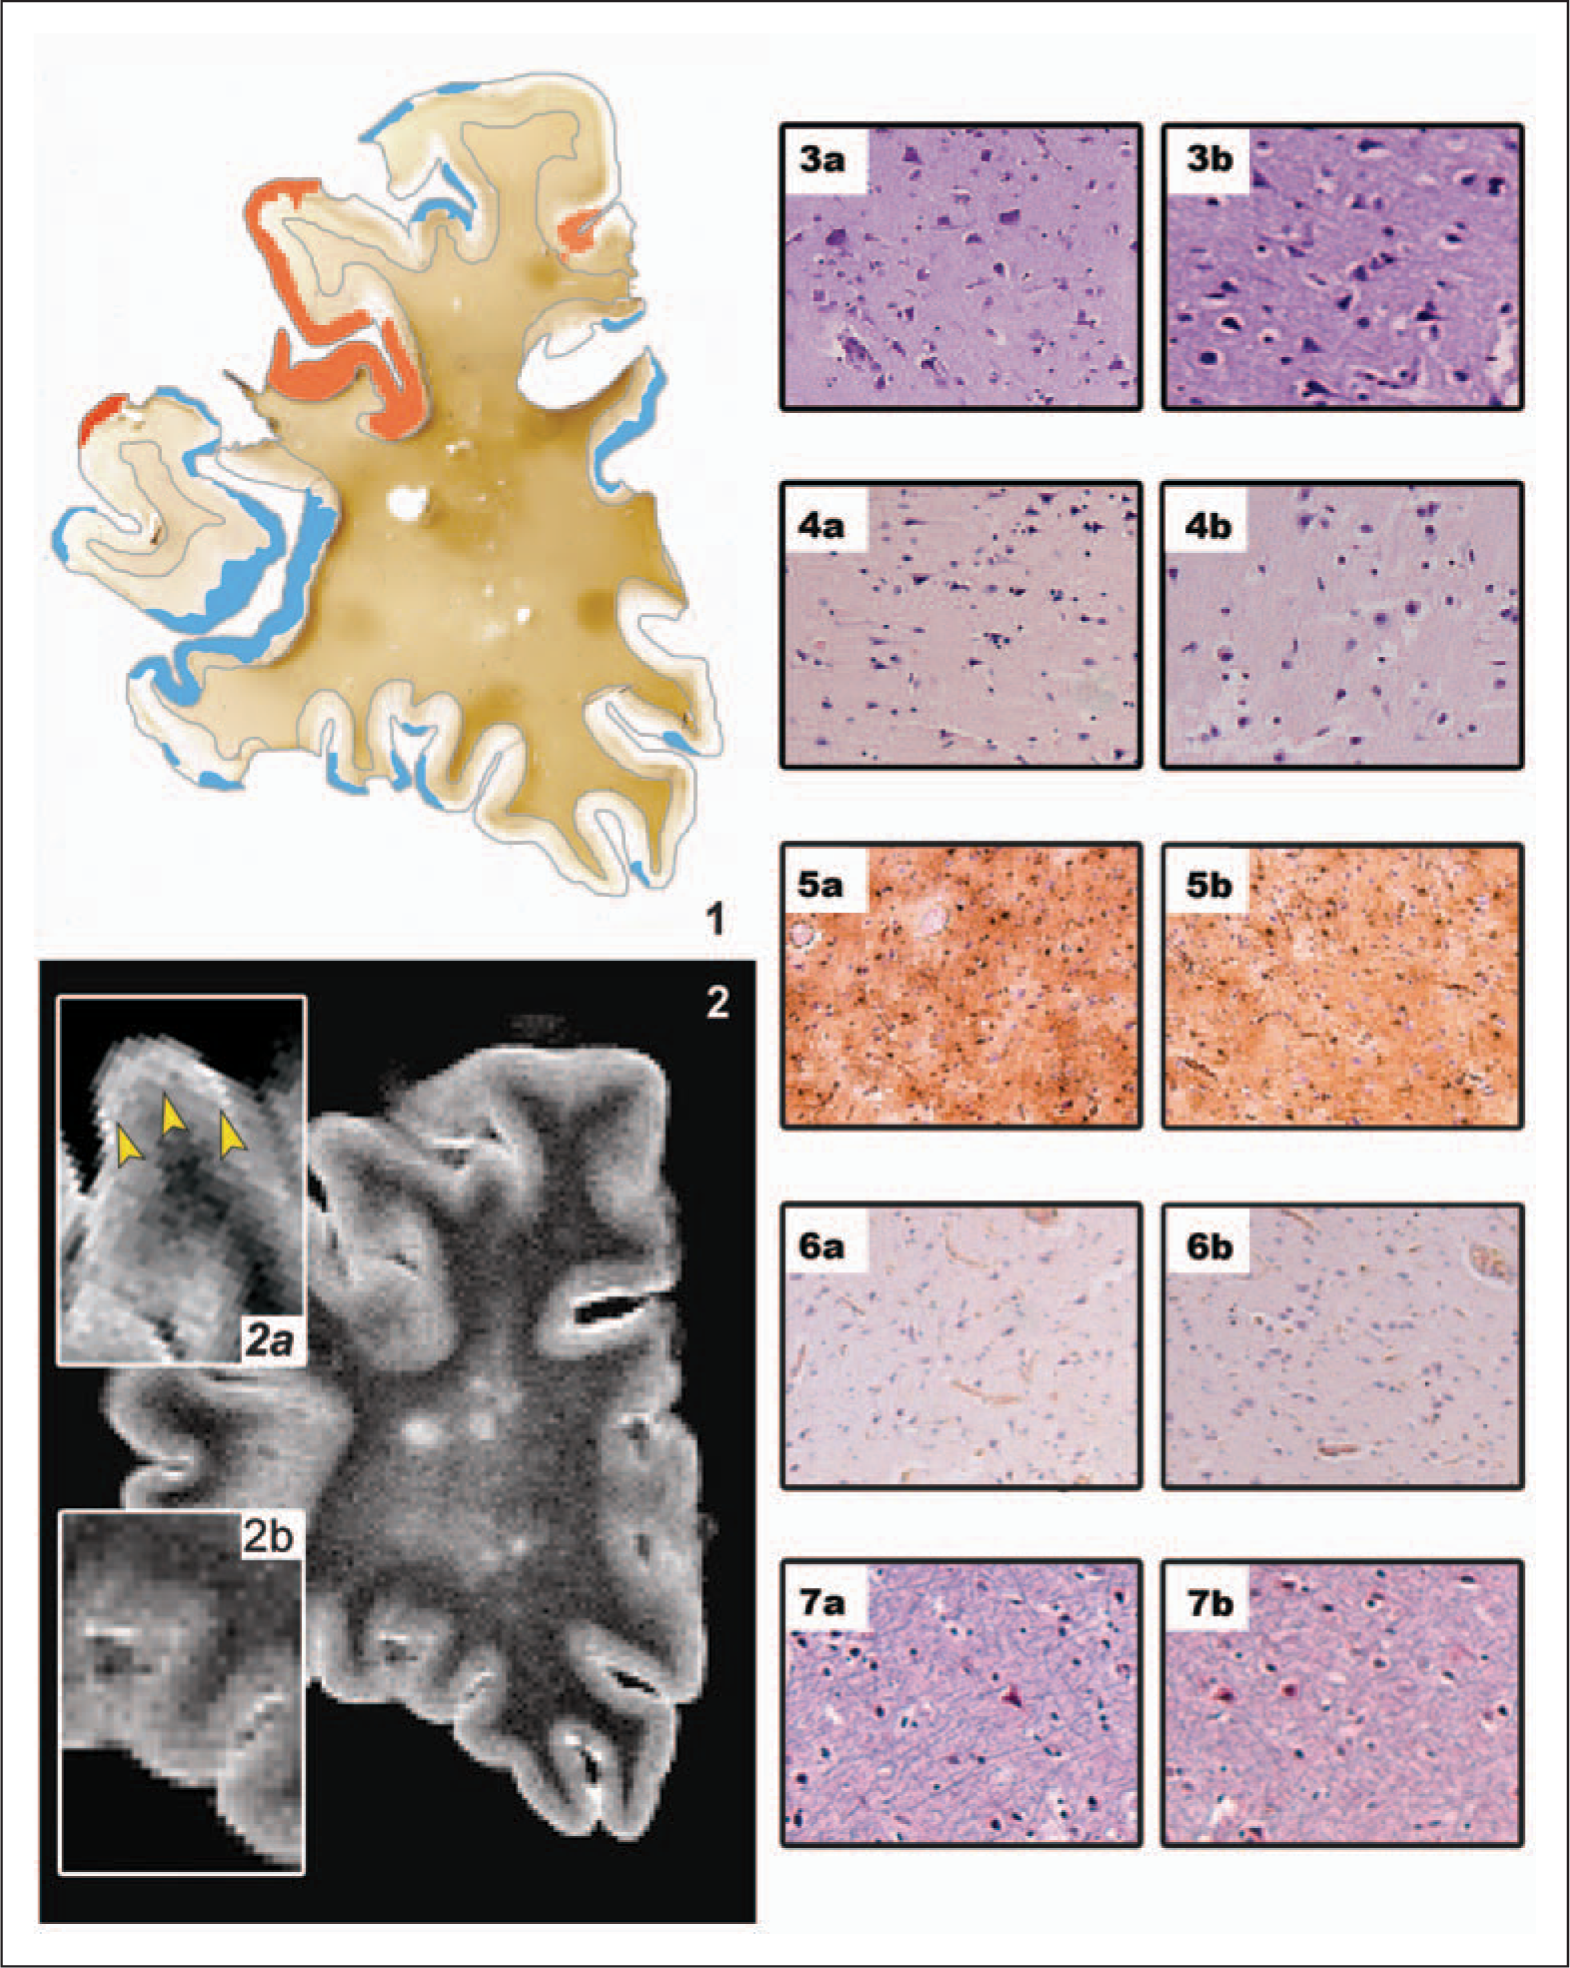
Comparison between magnetic resonance imaging (MRI)-visible and invisible cortical lesions.
qMRI and histopathology comparison between CLs and NLGM
T1 and T2 relaxation times differed significantly between CLs and NLGM, and there was a tendency for lower MTR in cortical lesions, but this difference did not reach significance. CLs showed significantly higher transmittance values in sections stained for neurons and axons as compared with NLGM (4.2% loss of staining intensity in Bodian stainings and 12.3% loss of Nissl staining intensity), whereas no difference was detected for Tm(GFAP) and Tm(Fibrinogen) (Table 2).
Histogram analysis of the cortical GM
Histogram peak positions, peak heights and means were correlated with the percentage of demyelination and transmittance measurements for neuroaxonal and myelin density, blood–brain barrier leakage and astrogliosis. The peak position of the T2 histograms correlated with Tm(PLP) (r = 0.56, p < 0.05), and MTR peak position and mean MTR correlated with the percentage of cortical demyelination (r = 0.76, p < 0.01, and r = 0.77, p < 0.01). No associations were found between gliosis, fibrinogen and axons (neurons) and T1, T2 and MTR histogram parameters.
Discussion
The present study demonstrates that CLs that are visible on conventional MR images are not different from MRI-invisible CLs in terms of underlying histopathology. Instead, visibility of CLs was exclusively determined by size. Furthermore, visibility of CLs, and therewith greater lesion size, was associated with a higher overall CL load, as assessed by histopathology. This indicates that when CLs become visible on MRI, we are only seeing the ‘tip of the pathological iceberg’ and many more demyelinated areas may be present, though invisible on MRI. qMRI measures were shown to sensitively reflect demyelination in the cortical GM of patients with MS, and detected both MRI-visible and MRI-invisible lesions.
Both in vivo MRI and histopathology studies have shown that GM pathology is already present in the earliest disease stages, and becomes increasingly prominent as disease progresses.25,33–35 However, an accurate estimation of GM pathology in vivo is challenging, as up to 91% of CLs are missed on conventional MRI. 20 No explanation exists why the remaining 9% are in fact visible.
As the greatest part of CLs consist of type III subpial lesions, 6 which cover only the upper (more thinly myelinated) cortical layers, it may be expected that MRI-visible lesions involve the lower, more densely myelinated cortical layers. Alternatively, they may consist of a more destructive or inflammatory pathology; both options would lead to notable differences in MRI contrast. Here we show, for the first time, that the latter hypothesis is unlikely, as neither axonal or glial loss, nor microglial activation or blood–brain barrier leakage were significantly different between MRI-visible and MRI-invisible lesions. Lesion size was the only discriminatory variable between MRI-visible and MRI-invisible CLs. Moreover, MRI-visible type III (subpial) lesions showed a more extensive infiltration into deeper, more heavily myelinated layers of the cortex, therewith generating better contrast on MRI. The fact that pathology does not differ between MRI-visible and MRI-invisible CLs was mirrored by the qMRI measures, which were very sensitive to overall cortical demyelination, confirming previous studies,22–26,36 but could not specifically distinguish between MRI-visible and MRI-invisible CLs. Despite the low overall percentage of demyelination (7.7%, varying between 0% and 39.5%) in our brain slices, histogram parameters showed significant correlations with cortical demyelination. Interestingly, increasing total cortical demyelination, as measured in PLP stainings and as reflected by the qMRI measures, was associated with an increased number of MRI-visible CLs (r = 0.96, p < 0.01). This ‘tip-of-the-iceberg phenomenon’ may be a specifically interesting observation for the clinical setting, as patients who show more CLs on their in vivo MRIs are likely to already have more severe cortical damage.
However, a few limitations apply to this study. First, our analysis may not be exhaustive. Other histopathological parameters than those selected here could contribute to the visibility of CLs on MRI. Furthermore, the ROI analysis may have been underpowered to detect differences in T1 and T2 relaxation times between MRI-visible and MRI-invisible lesions. The exclusion of cortical hyperintensities smaller than 5 pixels in order to compensate for volume averaging may have underpowered the study with respect to the detection of MR-visible CLs. For this study, formalin-fixed material was used, which slightly hampers comparisons of qMRI measures with the in vivo situation. The latter issue may not be detrimental, however, as qMRI results obtained from fixed material are still useful in terms of investigating histopathological underpinnings of qMRI changes in the post-mortem MS brain, and hence are still sufficiently clinically relevant. 37 Finally, it would have been highly interesting to study CLs with a Double Inversion Recovery (DIR) sequence in the current study, as this technique has shown to be sensitive to cortical MS lesions in vivo.38,39 However, this technique is not yet applicable to the post-mortem setting, and DIR imaging of post-mortem MS brain material therefore remains an interesting target for future research.
In conclusion, this study shows that visibility of CLs on conventional MRI seems to be predominantly determined by lesion size, and not by any distinctive underlying histopathology. Furthermore, greater CL size was associated with a higher overall CL load, indicating that once CLs become visible on MRI, these lesions represent only the ‘tip of the pathological iceberg’. qMRI measurements sensitively reflected the percentage of cortical demyelination, but did not distinguish between MRI-visible and MRI-invisible CLs. These findings substantially increase our understanding of the radiologically reported cortical qMRI abnormalities reported in MS.
Footnotes
The MS Center Amsterdam receives a program grant from the Dutch MS Research Foundation (Voorschoten, The Netherlands), grant no. 05-358c.
No conflict of interest to declare.