






Abstract
Introduction
Interferon beta (IFN-β) was the first specific disease-modifying therapy (DMT) licensed for multiple sclerosis (MS) and in its many forms remains the most commonly prescribed agent worldwide. Many patients fail to respond to IFN-β therapy, and one of the most significant reasons is the production of drug-specific antibodies. Up to 45% (mean ∼25%) of patients develop neutralizing antibodies (NAbs) to IFN-β products, which generally appear between 6 months and18 months of treatment.1–6 The development of NAbs is considered by many to be a significant factor contributing to treatment failure, and the reduction in relapse rate in patients who remain NAb negative may be as high as 50%.1,3 It has been shown in numerous trials that patients who become antibody positive have higher relapse rates, lesion activity on MRI, and also a higher rate of disease progression.4,7 There has been much controversy with respect to the significance of these antibodies in patients with MS who have been treated with IFN-β and how to manage them.8,9 Conflicting guidelines have been issued by several consensus groups regarding NAbs,10,11 and the interlaboratory variability of the established cytopathic effect assay (CPE) and myxovirus A protein (MxA) enzyme-linked immunosorbent assay (ELISA) has been problematic. However, one point of agreement was that NAb testing should occur in validated laboratories and that there remained a need for a reliable cost effective assay.
Physiologically, IFN-β alters the expression of several hundred genes at the nuclear level and the downstream production of mRNA and proteins. These confer the anti-viral, anti-proliferative and immunomodulatory actions of IFN-β and some of these have been identified as being relatively specific to type 1 interferons, the myxovirus resistance protein A (MxA) being the most specific. There is a significant rise in MxA mRNA and protein in response to IFN-β administration and this response is abrogated in the presence of NAbs.12–14
The luciferase NAb assay utilizes the reliable expression of the luciferase gene in response to activation of the interferon-stimulated response element. This assay was developed and validated to fulfill the need for a reliable, cost-efficient assay which could be readily incorporated into routine practice, as has previously been described.15,16 It has subsequently been disseminated to 14 laboratories worldwide, including Austria, Denmark, Germany and Canada where it is routinely used. To enhance the clinical application of NAb testing using this simple, cost-efficient assay, we sought to quantify MxA induction in response to IFN-β administration in vivo and to correlate this with the NAb titre (as measured by the luciferase reporter gene assay) to identify titres at which partial or complete loss of IFN-β bioactivity is seen.
Methods
Subjects and sample acquisition
Previous evaluation of NAb frequency using the luciferase assay revealed that up to 35% approximately of subjects treated with Rebif or Betaferon were NAb positive (+ve), whereas few subjects treated with Avonex become Nab + ve. 15 We therefore elected to exclude subjects treated with Avonex to enrich the capture of Nab + ve subjects, whilst maintaining a cohort of Nab negative (–ve) patients to serve as controls. In previous studies using the luciferase assay, 15 of those who were Nab + ve, the majority had low positive titres < 100 NU (∼50%) and approximately 40% had high positive titres > 320 NU, which was product dependent. Other groups have also shown that about 10% of subjects have some neutralizing activity but do not reach the 20-NU cut-off which is commonly used to denote NAb positivity. 17
Ethical approval to conduct the study in five sites was awarded prior to recruitment and subjects with MS treated with either Rebif or Betaferon for 6 months or more were included. Recruitment commenced in July 2008 and was completed in January 2010, by which time 144 subjects treated for more than 6 months with either Rebif or Betaferon had been recruited. Blood samples were obtained on the day that IFN-β would be administered and again 12 hours after injection. Blood for RNA analysis was taken in PAXgene® tubes to ensure the stability of mRNA for storage. Serum samples were also stored at that time. All of the samples were processed and stored at the Blizard Institute of Cell and Molecular Science, Barts and The London School of Medicine and Dentistry, London, UK.
NAb assay
The luciferase assay uses human fibrosarcoma cells (HL-116) donated by Dr G. Uze, which have been stably transfected with a luciferase reporter gene cassette.18,19 When the IFN-β molecule binds to its receptor it activates a transcellular signalling mechanism, which in turn activates the interferon-stimulated response element (ISRE). This translocates to the nucleus where it causes the transcription of the luciferase gene. The amount of luciferase produced in response to a known amount of IFN-β is predictable and in the presence of NAbs this response is abrogated. NAb assay methods have been previously described.15,16
In brief, cells were counted and added at a density 0.4 million/ml to a 96-well plate. A standard curve of IFN-β-1a was prepared, consisting of incremental concentrations ranging from 0 to 100 LU/ml. IFN-β standards, test samples, control positive and negative samples were added in duplicate to the plate. Samples were initially screened at a 1:10 dilution for neutralizing activity, and those which were positive were subsequently serially diluted (1:10 to 1:2560 end dilutions). The amount of luciferase induced was quantified using a commercial detection kit (Promega Steady Glo®). NAb titres were determined using the Kawade method20,21 and expressed in NU (neutralizing units). Samples with titre < 5 NU were considered negative, those between 5 NU and 19 NU had subclinical neutralizing activity and those > 20 NU were clinically positive. Positive and negative controls were included in each plate to ensure accuracy. Serum samples obtained before IFN-β administration and 12 hours post-dose were tested.
MxA quantification
Blood was collected in two Paxgene® tubes taken prior to IFN-β injection and two taken 12 hours after IFN-β injection to preserve mRNA for extraction. Extraction was performed using the PreAnalytix PAXgene Blood RNA system and following the manual extraction protocol (www.preanalytix.com/RNA.asp). RNA was quantified using the Nanodrop™ 3.1 and quality monitored. Extracts were standardized to 30 ng/μl of RNA. Reverse transcription was performed using the high capacity cDNA reverse transcriptase kit (with RNase inhibitor) as supplied by Applied Biosystems™ cat # 4374966.
Real-time polymerase chain reaction (PCR) was used to quantify MxA gene expression in response to administration of IFN-β. 22 Standard curves of MxA and glyceraldehyde 3-phosphate dehydrogenase (GAPDH) for use in the PCR were produced by stimulating HL-116 (luciferase transfected) cells overnight with 1000 LU/ml IFN-β-1a (Avonex), which was added to the Dulbecco’s modified Eagle medium in which cells were cultured. Five serial dilutions of cDNA were included in the PCR to generate both MxA and GAPDH standard curves. Values were attributed to each standard in accordance with the amount of RNA that was used to generate cDNA (100, 10, 1, 0.1 and 0.01 ng). Fresh master mixes for (i) MxA and (ii) GAPDH reactions were prepared using 10 μl Taqman Universal Master Mix, 8 μl molecular grade water and 1 μl of ABI gene expression mix (MxA or GAPDH), and 19 μl of master mix was added to each well in the reaction plate. The plate was loaded into the Taqman® 7500 system and the PCR was run.
Assay results were standardized by setting the threshold line at the point where the highest MxA standard (St1 100 ng RNA) crossed the vertical line denoting the 25th cycle. The MxA standard curve was automatically generated where the slope was optimized at −3.3 (−3.0 to −3.6) with the y-intercept at 24.5 to 25.0. Similarly, the GAPDH standard curve was generated where the slope was optimized at −3.3 (−3.0 to −3.6) with the y-intercept at 15.5 to 16.0. Relative quantification of the expression of MxA with reference to GAPDH was thus calculated. MxA expression at baseline, 12 hours post-IFN-β administration and absolute MxA induction were calculated using ABI 7500 SDS software.
Statistical analysis
Pre- and post-injection NAb titres were compared using a paired sample t-test. Mean MxA levels of NAb groups were compared using ANOVA. Non-parametric tests, namely the Mann–Whitney U-test, Kruskal-Wallis test with post Dunn correction for multiple comparison and Spearman correlation, were performed to correlate NAb titres with MxA levels, where appropriate using GraphPad Prism version 4.00 for Windows (GraphPad Software, San Diego, CA, USA, www.graphpad.com).
Results
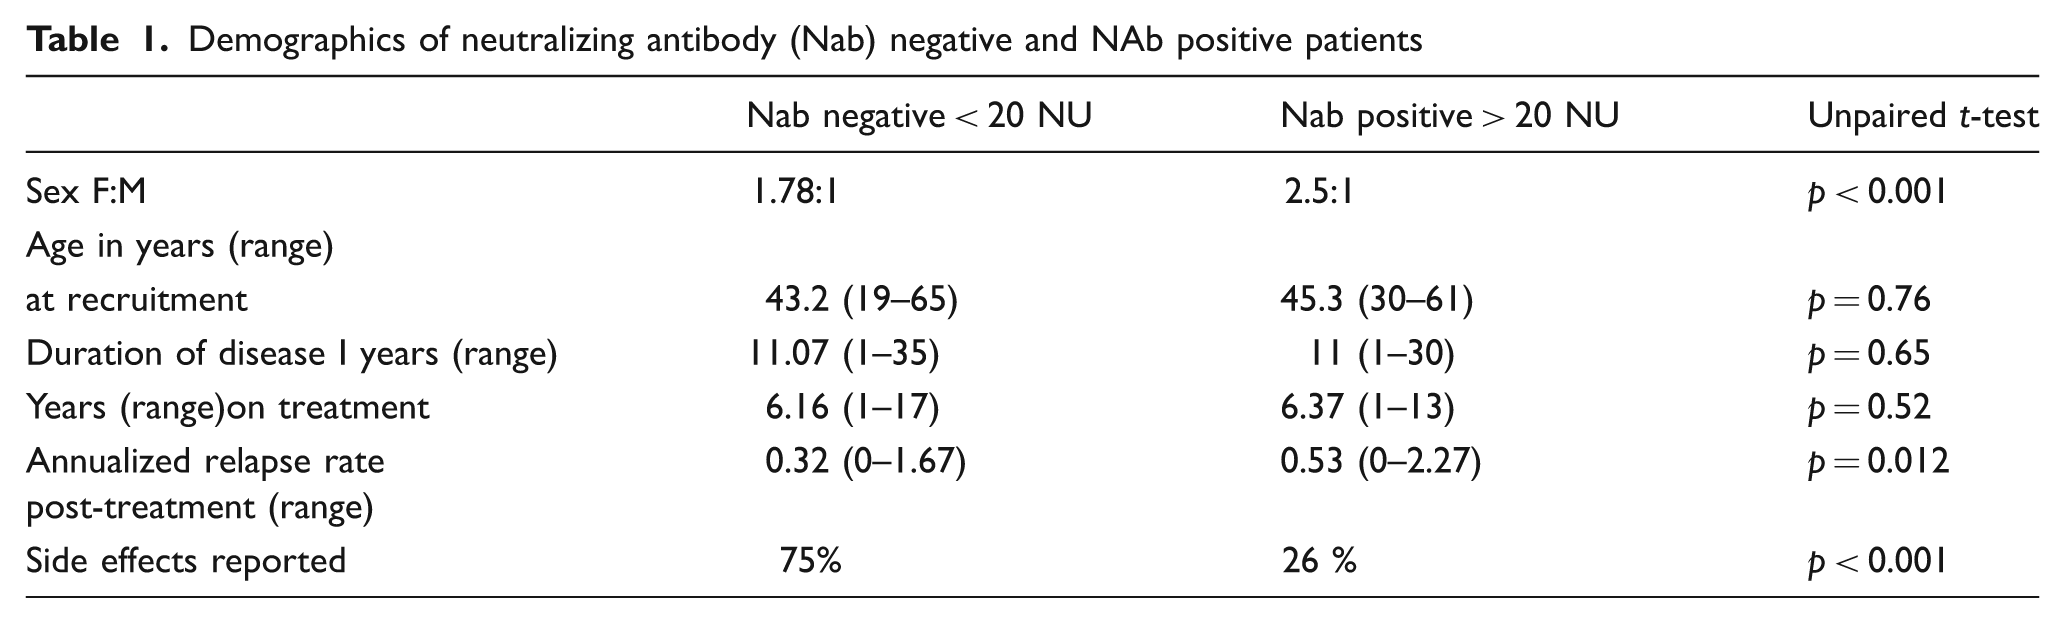
One hundred and forty-four subjects were recruited into the study (Table 1), of which 91 were female (64%) and 53 male (36%). Of those included, 19 were treated with Rebif 22 µg three times weekly (TTW), 89 were treated with Rebif 44 µg TTW and 36 with Betaferon 250 µg every other day (EOD). Of the 144 sets of samples, 138 had complete and valid NAb and MxA results. The average timing of the post-IFN-β administration sample was 12.6 hours (range 10–15 hours). A quarter of participants were NAb positive (titre > 20 NU, 26%) and a further 8% (n = 12) had evidence of sub-threshold neutralizing activity (titres 5–19 NU) (Table 2). Subjects treated with Betaferon had the highest frequency of NAbs (42%) as compared to Rebif 22 µg (32%) and Rebif 44 µg (25%). There was no difference in NAb titre in the pre- or post-IFN-β administration sera (p = 0.643).
Demographics of neutralizing antibody (Nab) negative and NAb positive patients
Neutralizing antibody (Nab) status depending on product

Baseline MxA
Mean baseline levels of MxA expression pre-IFN-β administration in NAb titre group were: NAb −ive 778.4 (95% CI 643–913), NAb 5–19 NU 624 (95% CI 442–805), NAb 20–99 NU 555 (95% CI 242–868), NAb 100–600 NU 390 (95% CI 20–659) and NAb > 600 NU 44.75 (95% CI 12–77). The MxA value at baseline in the NAb > 600 NU group was significantly different to all other groups (ANOVA p < 0.001) (Figure 1).

Scatterplot of log10 myxovirus protein A (MxA) level dependent on the neutralizing antibody (Nab) group. Mean and 95% CI are shown. (A) MxA level in each subject before interferon (IFN)-β administration. B. MxA level post-IFN-b administration. MxA levels at baseline and post injection value were significantly different in the NAbs > 600 NU group as compared with the other groups.
MxA post-dose
Mean MxA level post-IFN-β administration was also calculated: NAb −ive 2330 (95% CI 1940–2719), NAb 5–19 NU 1883 (95% CI 1335–2431), NAb 20–99 NU 1533 (95% CI 741–2324), NAb 100–600 NU 832 (186–1478) and NAb > 600 NU 101 (95% CI 0–224). The MxA value 12 hours post-IFN-β administration in the NAb 100–600 NU and > 600 NU group were significantly different to all other groups (ANOVA p = 0.0014) (Figure 1).
MxA induction
Mean induction of MxA in each group was: NAb −ive 1762 (95% CI 1411–2113), NAb 5–19 NU 1259 (95% CI 764–1754), NAb 20–99 NU 1168 (569–1768), NAb 100–600 NU 442 (95% CI 0–885), NAb > 600 NU 46 (95% CI 0–128). MxA induction was lower in the NAb 100–600 NU and NAb > 600 NU groups as compared with the lower NAb + ive and NAb −ive groups (ANOVA p = 0.0012, p < 0.0001) (Figure 2).

Scatterplot of log10 MxA induction in each subject depending on NAb titre. Mean and 95% CI shown. MxA induction levels were significantly different in the NAbs 100–600 NU and > 600 NU group as compared with the other groups.
Correlation of NAb titre with MxA expression
In subjects with any neutralizing activity (i.e. titre > 5 NU, n = 49) NAb titre was negatively correlated with MxA level at baseline, post-IFN-β administration and also MxA induction (Figure 3). In subjects with NAb titre 5–19 NU (n = 12) a correlation existed with baseline MxA level (Spearman r = −0.69, p < 0.0001) MxA post-injection (Spearman r = −0.74, p < 0.0001) and post-MxA induction (Spearman r = −0.70, p < 0.0001). Similarly, in subjects with clinically defined NAb + ve titres (i.e. NAb titre > 20 NU, n = 37) a correlation existed between titre and baseline MxA level (Spearman r = −0.72, p < 0.0001), MxA post-injection (Spearman r = −0.79, p < 0.0001) and MxA induction (Spearman r = −0.67, p = 0.0004).

Correlation of NAb titre (sample > 5 NU) with MxA level. (A) Pre-IFN-β injection, (B) post-IFN-β injection and (C) MxA induction.
This indicated that NAb titre is an accurate predictor of MxA level either pre- or post-IFN-β administration and confirms a titre (dose)-dependent suppresson of MxA induction in the presence of NAbs. Therefore, a single post-dose sample, to measure NAbs and MxA levels, would be sufficient to predict IFN-β bioactivity in clinical practice, provided patients injected themselves with bioactive IFNβ.
Discussion
The purpose of this study was to apply the established luciferase assay to biomarker induction in people with MS who has been treated with IFN-β to strengthen its application in routine clinical practice. We have found that there is a clear correlation between NAb titre determined using the luciferase NAb assay and MxA expression in both the pre-injection and 12 hours post-injection samples and also total MxA induction. This has further validated the use of this simple, cost-efficient assay in routine clinical practice. The post-injection MxA level showed the best correlation with NAb titre, and therefore could be a useful adjunct in clinical practice to predict IFN-β bioactivity. Those with low positive NAbs < 100 NU did not show significant loss of bioactivity (as measured by MxA) as compared with those with titres 100–600 NU, who experienced a reduction of activity, and those > 600 NU who showed little or no response to IFN-β administration (mean post-dose MxA expression 101, 95% CI 0–224). These results were consistent with those treated with either IFN-β 1a SC (both 22 µg and 44 µg doses) or IFN-β 1 b SC. There was no significant difference in NAb titre obtained in samples before or 12 hours after IFN-β injection, and thus a single 12-hour post-dose sample would suffice to assess both NAbs and MxA expression. Those with NAbs > 600 NU did not have any meaningful biological effect after IFN-β administration and those with NAbs 100–600 NU should have MxA expression measured to assess bioactivity. Binding antibodies were not tested in subjects before screening for neutralizing activity, as historically BAbs were routinely tested to avoid the need to test for NAbs using the more time-consuming or expensive CPE and MxA ELISA. It is possible that ∼4% of the neutralizing activity is non-antibody mediated; however this inhibition of IFN-β activity has been shown to exist both in vivo and in vitro and thus the distinction may not be relevant to the individual patient. 23
The complexity of decision-making with respect to treatment choices in MS and number of available treatments continue to increase. Although many clinicians expect newer oral agents and the parenteral monocloncal antibodies will replace IFN-β, the effects of IFN-β are known and they have a very good safety profile that seems to have stood the test of time. The effect of NAbs at a group level is generally well understood and has been shown to be associated with increased relapse rates and increased disease activity on MRI. Recently baseline endogenous MxA expression has been found to be a predictor of relapses in people with MS. 24 What this means, however, for the individual treated with IFN-β and with NAbs has remained somewhat unclear. The ambivalent data or, rather, the interpretation of the data, has led to indecision in the MS community with regards to whether to test for NAbs and MxA and how to interpret results. This model will also be applicable to other biological therapies in the future whose loss of efficacy may not be immediately apparent in a disease such as MS.
We have confirmed the titre-dependent loss of bioactivity, described by other groups,14,25 using the luciferase NAb assay, and have found that there is a clear correlation between NAb titre and MxA level in both the pre-injection and 12 hours post-injection samples. As we found no significant difference in NAb titre pre-dose or 12 hours post-dose, the luciferase NAb assay in conjunction with a single post-dose MxA measurement is a reliable and cost-efficient way to monitor IFN-β bio-efficacy and aid clinical decision-making in patients with MS.
Footnotes
Acknowledgements
We would like to acknowledge and thank the many people with MS who gave their time and blood samples for the purpose of this research.
We would also like to acknowledge our collaborators Professor David Miller (National Hospital for Neurology and Neurosurgery), Dr Andrea Malaspina and Elaine Bosley (Basildon Hospital), Dr Hamied Hewazy, Helen Gush and Janet Meek (Southend Hospital) and Dr Steve Wroe (St Thomas’ Hospital).
This research was funded by a Framework Package 6 EU grant held by the NABINMS Consortium.
Dr Farrell reports having received lecture fees from Teva-Aventis. Professor Giovannoni reports having received consulting fees from Bayer-Schering Healthcare, Biogen-Idec, Genzyme, GlaxoSmithKline, Merck-Serono, Novartis, Protein Discovery Laboratories, Teva-Aventis, Vertex Pharmaceuticals and UCB Pharma; lecture fees from Bayer-Schering Healthcare, Biogen-Idec, Pfizer, Teva-Aventis, Vertex Pharmaceuticals; and grant support from Bayer-Schering Healthcare, Biogen-Idec, GW Pharma, Merck-Serono, Merz, Novartis, Teva-Aventis and UCB Pharma.