
Abstract

The detection of oligoclonal IgG is definitely the most sensitive method to detect an intrathecal IgG synthesis in multiple sclerosis (MS) patients. However, Villar et al. should not mix up the quality of this well-characterized and established analysis for oligoclonal IgG with that of the method for oligoclonal IgM which is far from generally accepted and has been disputed for 30 years, which is also investigated in our laboratory. 1 There is a basic difference: oligoclonal IgG bands in the isoelectric focusing (IEF) are referring to antibodies from single-cell clones with different isoelectric points due to the individual intracellular, post-transitional modifications; in contrast ‘oligoclonal’ IgM, the cellular pentameric antibodies which are for analysis dissociated to the non-equally modified monomers, lose the association with single-cell clones, i.e. bands in IEF representing an arbitrary accumulation of equally charged antibodies from different clones.
The quantitative method for the detection of intrathecal IgM synthesis refers to a reference range based on clinically defined group of 4,300 patients without an intrathecal humoral immune response. 2 Figure 1 shows the corresponding diagram (cerebrospinal fluid (CSF)/serum concentration quotients, Q IgM versus Q Alb, the albumin quotient) with a hyperbolic reference range. 2
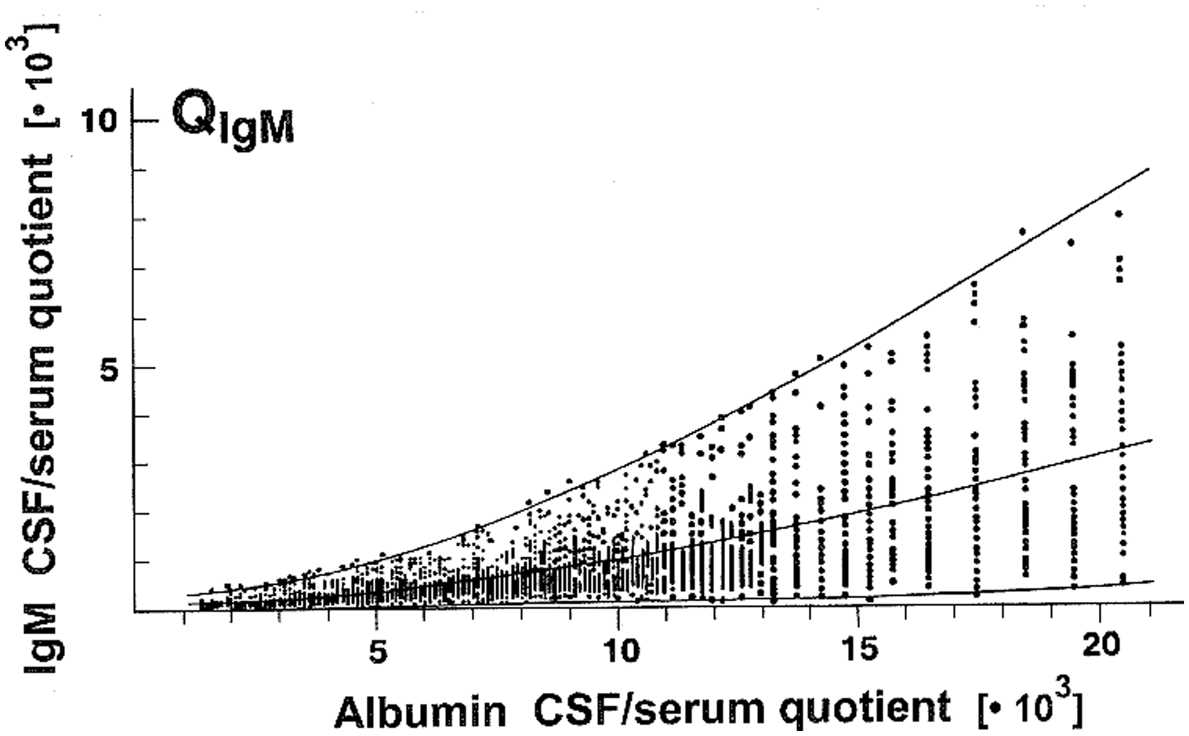
Control group of patients without an intrathecal humoral immune response. 2
The reference to a statistically defined reference range is a quantitative method (not semi-quantitative as Villar et al. mistakenly state). The clinical sensitivity for the detection of an intrathecal IgM synthesis in quotient diagrams depends on the allowed standard deviation (SD) around the mean. This of course must have an influence on the specificity. To reach a maximal specificity for diagnostic purposes we used the range of Q mean ± 3 SD (Figure 2), that means that about 99% of the controls are inside the reference range (quotient diagrams used for routine analysis). For the comparison of groups we introduced now a less specific but more sensitive reference range for Q mean ± 2 SD (still including 96% of the controls in the reference range) (Figure 2). This allowed the integration of young children with a weaker intrathecal IgM response in the statistical comparison of age-related variations in MS. 3,4 As shown in Figure 2 of Stauch et al. 4 for the method comparison between qualitative and quantitative IgM results, three of the IgM quotients measured by Villar et al. are around or below the mean Q IgM of the controls, i.e. they have a very high probability to be normal or to be without an intrathecal IgM synthesis. These kinds of values are shown, e.g., in a group of psychiatric control patients without any humoral immune response (see Figure 1c in Bechter et al. 5 ).
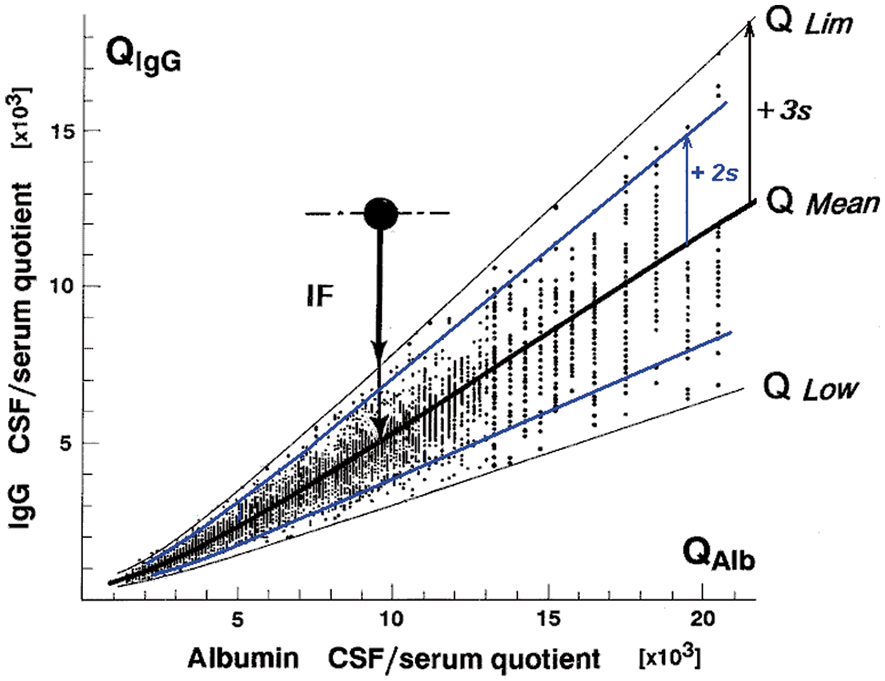
There is no doubt that a sufficiently sensitive qualitative method (oligoclonal IgG) helps to increase the sensitivity for the detection of an intrathecal synthesis. In the range of a weak intrathecal response, often in the range of the upper reference limit (Q lim in Figure 2), but we detected them not in the range of or below Q mean (IgG) in thousands of samples analysed.
Five of the possibly false-positive IgM interpretations of Villar et al. by oligoclonal IgM, as indicated in Figure 2 of Stauch et al., 4 are in the range of high blood derived IgM fractions in CSF recognized by their high Q Alb values (slight barrier dysfunction). This represents another argument for a possible bias in the method for oligoclonal IgM, as it means that for the higher CSF IgM concentration the probability of a false interpretation as intrathecal synthesis is increased.
The one patient of Villar et al. which we stated as false-negative (the open circle in Figure 2 of Stauch et al. 4 ) is demonstrated in the quotient diagram with calculated 20% intrathecal IgM synthesis, clearly above the reference range and thus has a statistical probability of >99.5% to be not normal in contrast to the qualitative analysis. However, in this case an analytical imprecision in immunochemical nephelometry could be considered as an alternative to explain the discrepancy.
To control their method Villar et al. should compare other clinically defined patient groups such as Guillain–Barré polyradiculitis with a barrier dysfunction but without a humoral immune response. In general, the sensitivity of their oligoclonal IgM method can be detected by a serial dilution experiment of a CSF sample with high intrathecal IgM fraction in CSF.
We understand that a statistical method is not a proof for the individual patient, but it is still a fundamental method to compare groups and to judge probabilities of interpretations.