
Abstract
Objective:
To determine the effects of intravenous natalizumab and intramuscular interferon beta-1a (IFNβ-1a) on the volume of white-matter (WM) lesions and normal appearing brain tissue (NABT) undergoing voxel-wise (VW) increases in magnetization transfer ratio (MTR) suggestive of remyelination in patients with relapsing multiple sclerosis.
Methods:
This prospective, open-label, single-blinded study enrolled patients with relapsing–remitting multiple sclerosis (RRMS) and relapsing secondary progressive multiple sclerosis (RSPMS) as well as a group of age/sex-matched healthy controls (n=22). Patients with multiple sclerosis were assigned to receive natalizumab monotherapy (n=77; RRMS/RSPMS) or intramuscular IFNβ-1a (n=26) as either monotherapy (RRMS) or combined with pulsed i.v. methylprednisolone, as needed (RSPMS). The primary endpoint was the two-year change in volume of NABT VWMTR, by quantifying the number of voxels that increased (suggesting remyelination) or decreased (suggesting demyelination) in their MTR value.
Results:
The volume of tissue undergoing increases in VWMTR was significantly larger in natalizumab compared with IFNβ-1a-treated patients (year 1: p=0.001 in NABT and p<0.006 in WM lesions; year 2: p=0.008 in NABT) and compared with healthy control subjects (year 1: p=0.05 and year 2: p=0.007 in NABT). The larger volume within NABT undergoing decreases in VWMTR was detected in multiple sclerosis patients compared with healthy controls (p<0.001), and in the IFNβ-1a group compared with the natalizumab group (year 1: p=0.05; year 2: p=0.002). One patient on natalizumab died from progressive multifocal leukoencephalopathy eight months after completing the study.
Conclusion:
Natalizumab may promote remyelination and stabilize demyelination in lesions and NABT in relapsing multiple sclerosis, compared with intramuscular IFNβ-1a.
Introduction
The underlying pathology of multiple sclerosis (MS) is characterized by alternating cycles of inflammation associated with demyelination that manifests both as focal lesions and more diffusely in otherwise normal appearing brain tissue (NABT), followed by remyelination.1,2 Magnetization transfer imaging (MTI) may be used to detect variations in myelin content within MS lesions and NABT. Decrease in the magnetization transfer ratio (MTR) has been reported to correlate with clinical decline assessed by the Expanded Disability Status Scale (EDSS), MS Functional Composite (MSFC), and other neuropsychological tests.3-6 In addition, it is a non-specific sign of demyelination, macrophage infiltration and axonal damage. 7 Increased MTR has been shown to be related to remyelination in animal 7 and post-mortem studies.8,9
MTR signal changes can be calculated on a voxel-wise (VW) basis.10-12 A voxel-based MTR analysis method has been shown to reveal acute focal demyelination and remyelination in vivo. 13 In that study, voxel-based analysis of MTR, using a method that includes threshold-free cluster enhancement in combination with a Monte Carlo estimation approach, was performed. 10 This VWMTR method reveals changes in MTR suggestive of demyelination and remyelination while avoiding the use of highly complex or experimental MRI acquisition techniques.
In clinical trials, natalizumab (TYSABRI®) decreased inflammation in patients with MS, as evidenced by a decrease in T2, T1, and gadolinium (Gd)-enhanced lesions.14-18 The effect of natalizumab on non-conventional measures, such as the VWMTR, is unknown.
The primary objective of this study was to define the effect of natalizumab monotherapy on a VWMTR basis by using dynamic mapping of lesions and NABT in patients with relapsing MS.
Methods
Study design
This was a two-year, prospective, open-label, case-control, single-blinded non-conventional MRI study. Initially, a one-year study was planned but follow-up was extended through two years to enable longer-term assessment of the impact of treatment on VWMTR changes.
This study was approved by the ethical standards committee on human experimentation at the University at Buffalo (Clinicaltrials.gov identifier number: NCT00937677).
Participants
The study included MS patients at a single center, as well as a group of sex-matched healthy control (HC) subjects. Participants were aged 18–65 years, had to have clinically definite MS according to the Polman criteria, 19 of either relapsing–remitting (RR) or relapsing secondary progressive (RSP) disease type; 20 EDSS scores ≤6.5; 21 disease duration <30 years; normal kidney function (creatinine clearance >59 ml/min); and have started therapy either with natalizumab or IM interferon beta-1a (IFNβ-1a).
Exclusion criteria were as follows: clinically significant infectious illness within 30 days prior to treatment assignment; any significant major disease that could preclude the administration of natalizumab; abnormal blood tests at screening; known drug hypersensitivity; disease-modifying therapy for MS within two weeks of screening; immunosuppressant therapy within three months; nursing mothers, pregnant females, and females planning to become pregnant while on study; unwillingness or inability to comply with study requirements; or any other reasons indicating any patient who, in the opinion of the investigators, was unsuitable for enrollment.
Interventions
All MS patients initiated monotherapy with either intravenous (i.v.) natalizumab (300 mg infusion every four weeks) or IM IFNβ-1a monotherapy (30 µg weekly). Patients on natalizumab fulfilled the TOUCH® (TYSABRI® Outreach: Unified Commitment to Health) enrollment requirements. 22 Use of other disease-modifying therapies during the study was prohibited, but RSPMS patients on IFNβ-1a were allowed to receive add-on 1 g i.v. methylprednisolone for three days as determined by clinical decision. Relapses were treated with 1 g i.v. methylprednisolone for 3–5 days. Therapy for symptoms of MS (e.g. treatment for spasticity, depression or fatigue) was allowed and optimized as early as possible in an attempt to maintain consistent treatment.
The treatment selection (natalizumab versus IFNβ-1a) was determined by clinician/patient decision with no randomization.
Endpoints
The primary endpoint was the two-year change in NABT as assessed by quantifying the number of voxels that increased (suggestive of remyelination) or decreased (suggestive of demyelination) in their MTR value. Total volume of increased and decreased MTR voxels in NABT between baseline and year 1 and between year 1 and year 2 was calculated in MS patients and HC subjects. The volume of lesion-based (T1, T2, and Gd-enhanced lesion volumes) VWMTR changes was also calculated over the same time points in MS patients.
Secondary endpoints included differences in number of voxels that increased or decreased in their MTR value between RRMS and RSPMS patients, disability progression (EDSS) and relapses.
Clinical assessments
Physical examinations and neurologic assessments were conducted at baseline, one year, and two year follow-up. In case of neurologic worsening, patients were evaluated within five days of symptom onset and were treated with corticosteroids if a relapse was confirmed. For patients receiving natalizumab, if concerns of suspected progressive multifocal leukoencephalopathy (PML) were raised, the patient underwent an MRI and/or CSF evaluation. To assess safety during the study, routine laboratory tests including complete blood count/differential blood count, liver and renal function monitoring and urinalysis were performed every three months.
MRI assessments and analysis
MRI assessments were performed at baseline, one year, and two years using the same 1.5-Tesla General Electric Signa 4x/Lx unit (Milwaukee, WI, USA). For each session, a T2-weighted image (WI), 3D-spoiled gradient-recalled (SPGR) T1-WI, spin-echo T1-WI with and without Gd contrast, fluid attenuated inversion recovery (FLAIR), proton density and proton density with MT pulse images were obtained using the same protocol between the various time points.
The axial dual spin echo sequence was acquired with TE 12/90 ms, TR 3000 ms, NEX 1, ETL 14, FOV 24 cm ×18 cm, matrix 192 × 256, 3 mm slice thickness with a total of 48 slices, no gap. We also acquired axial 3D-SPGR T1-WI scans with FOV 24 cm × 18 cm, matrix 192 × 256, 1.5 mm thick, 128 slices, no gap, TE 7 ms, TR 24 ms, NEX 1, FLIP angle 30°, axial FLAIR with FOV 24 cm × 24 cm, matrix 192 × 256, 48 slices, 3 mm thick, no gap, TE 128 ms, TI 2000 ms, TR 8002 ms, ETL 22, NEX 1, and axial proton density (conventional spin-echo, FOV 24 cm × 24 cm, matrix 192 × 256, 48 slices, 3 mm thick, no gap, TE 12 ms, TR 1400 ms, NEX 1) and a similar axial proton density with MT contrast (1200 Hz off-water resonance pulse). Axial spin echo T1-WI was acquired with FOV 24 cm × 18 cm, matrix 192 × 256, 48 slices, 3 mm thick, no gap, TE 9 ms, TR 600 ms, NEX 2. The Gd-enhanced spin echo T1-WI sequence was acquired only in MS patients 5 min after injection of a single dose i.v. bolus of 0.1 mmol/kg gadopentetate dimeglumine. Patients and controls were positioned in the magnet according to commonly accepted international guidelines.
The image analysis was blinded to patients’ clinical characteristics and clinical status. The number of brain T1 Gd-enhanced lesions was based on manual tracing on the digital films. 23 T2, T1, and Gd-enhanced lesion volumes (LVs) were measured using a semi-automated edge detection contouring-thresholding technique, as previously described. 24
VWMTR measurements
VWMTR measures were obtained by a semi-automated method. 10 The volume of significant local MTR changes was evaluated via a difference mapping technique in T2, T1, and Gd-enhanced lesions and in NABT. For each subject, baseline and follow-up MTR maps were placed in a common halfway space, facilitating VW subtraction. Our previously published approach 10 was slightly modified to avoid performing individual inhomogeneity corrections on baseline and follow-up MTR maps, instead opting for a slightly increased threshold on the high-pass filter for the joint subtraction image. The resulting subtraction map was then enhanced by using a threshold-free cluster enhancement (TFCE) algorithm 25 and a significance threshold was determined through the use of a subject-specific Monte Carlo simulation. Supra-threshold volumes (95th percentile) were quantified for both areas of increasing and decreasing MTR voxels (Figures 1 and 2). All image analyses were manually verified and artifacts were corrected, if necessary.
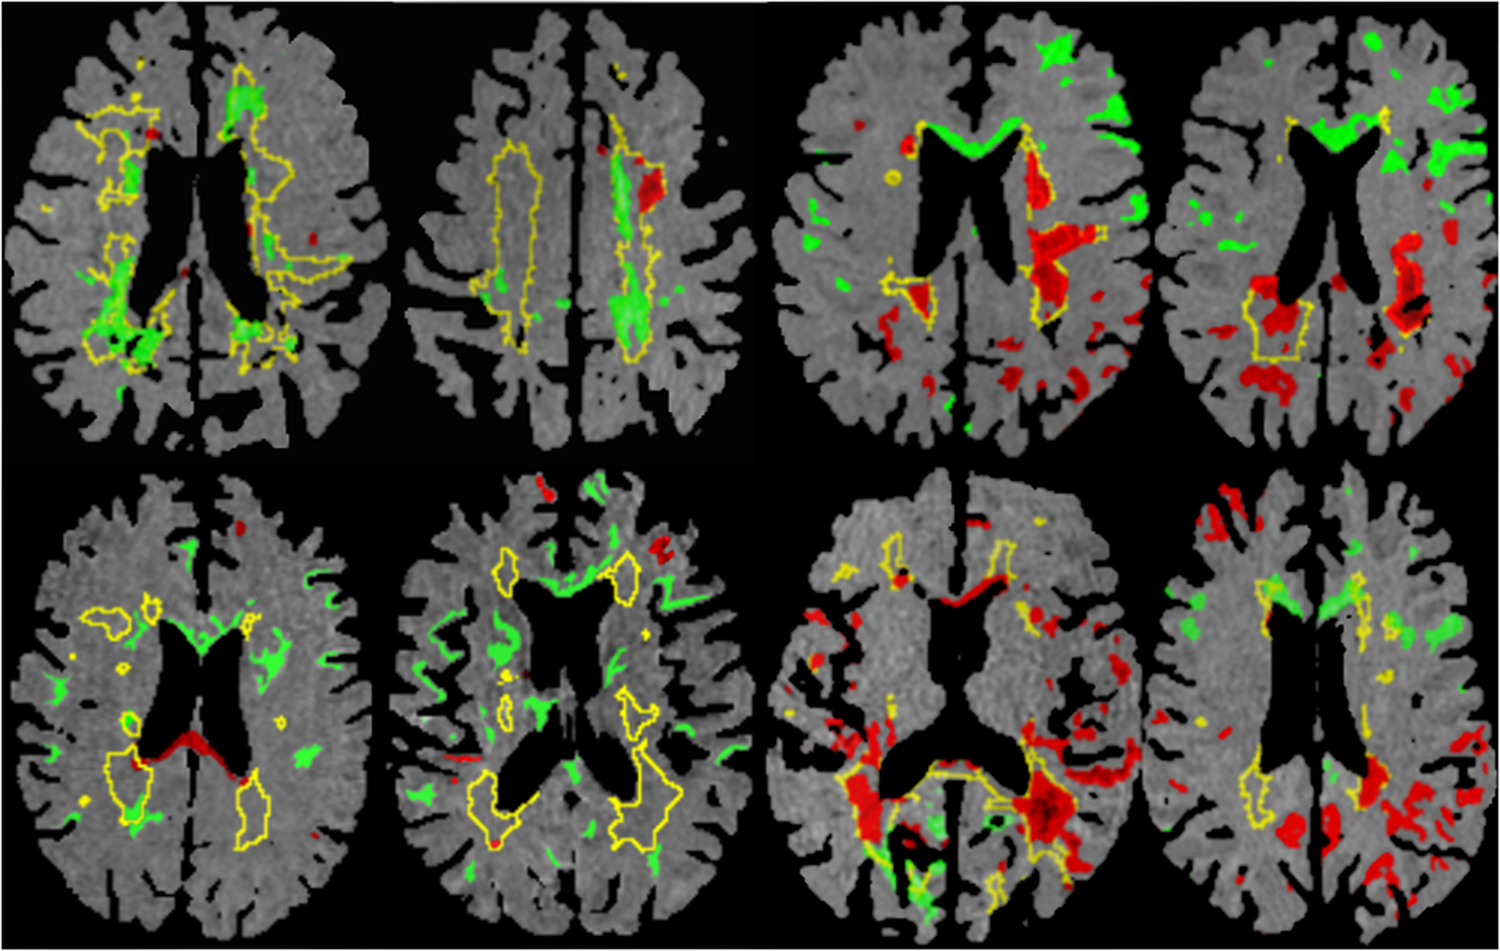
Voxel-wise (VW) magnetization transfer ratio (MTR) mapping of increasing (suggestive of remyelination) and decreasing (suggestive of demyelination) areas in the T2 lesions and normal appearing brain tissue (NABT) in patients with relapsing–remitting multiple sclerosis (MS) from baseline to year 1 (upper row) and from year 1 to year 2 (lower row). From left to right are displayed examples of various patients treated with natalizumab (first two columns on the left) and interferon beta-1a (IFNβ-1a) (last two columns on the right). Yellow outlines represent external contours of visible T2 hyperintense lesions on fluid attenuated inversion recovery (FLAIR) images; green areas represent brain regions undergoing super-threshold increases in MTR (95th percentile); and red areas represent brain regions undergoing super-threshold decreases in MTR (95th percentile). Note volume within T2 lesions and NABT undergoing increases in VWMTR in natalizumab-treated patients. Also note heterogeneity of T2 lesion recovery in second left column image, upper row, where the right hemisphere T2 lesion is stable from increasing or decreasing VWMTR volume point of view, whereas the left hemisphere T2 lesion shows that volume is predominantly undergoing increases, but also some decreases, in VWMTR. Note volume within NABT undergoing decreases in VWMTR in cortical regions in the right column, lower row in IFNβ-1a-treated patients, probably representing cortical subpial demyelination. Also note volume within T2 lesion undergoing decreases in VWMTR in part of the T2 lesion in the first right column, upper row (adjacent to the right inferior lateral ventricle horn), corresponding to the appearance of T1 hypointensity on T1-weighted image. Note that some caution in interpreting results is warranted since the false discovery rate (FDR) correction process implies that a small, statistically controlled portion of results may be due to artifact.
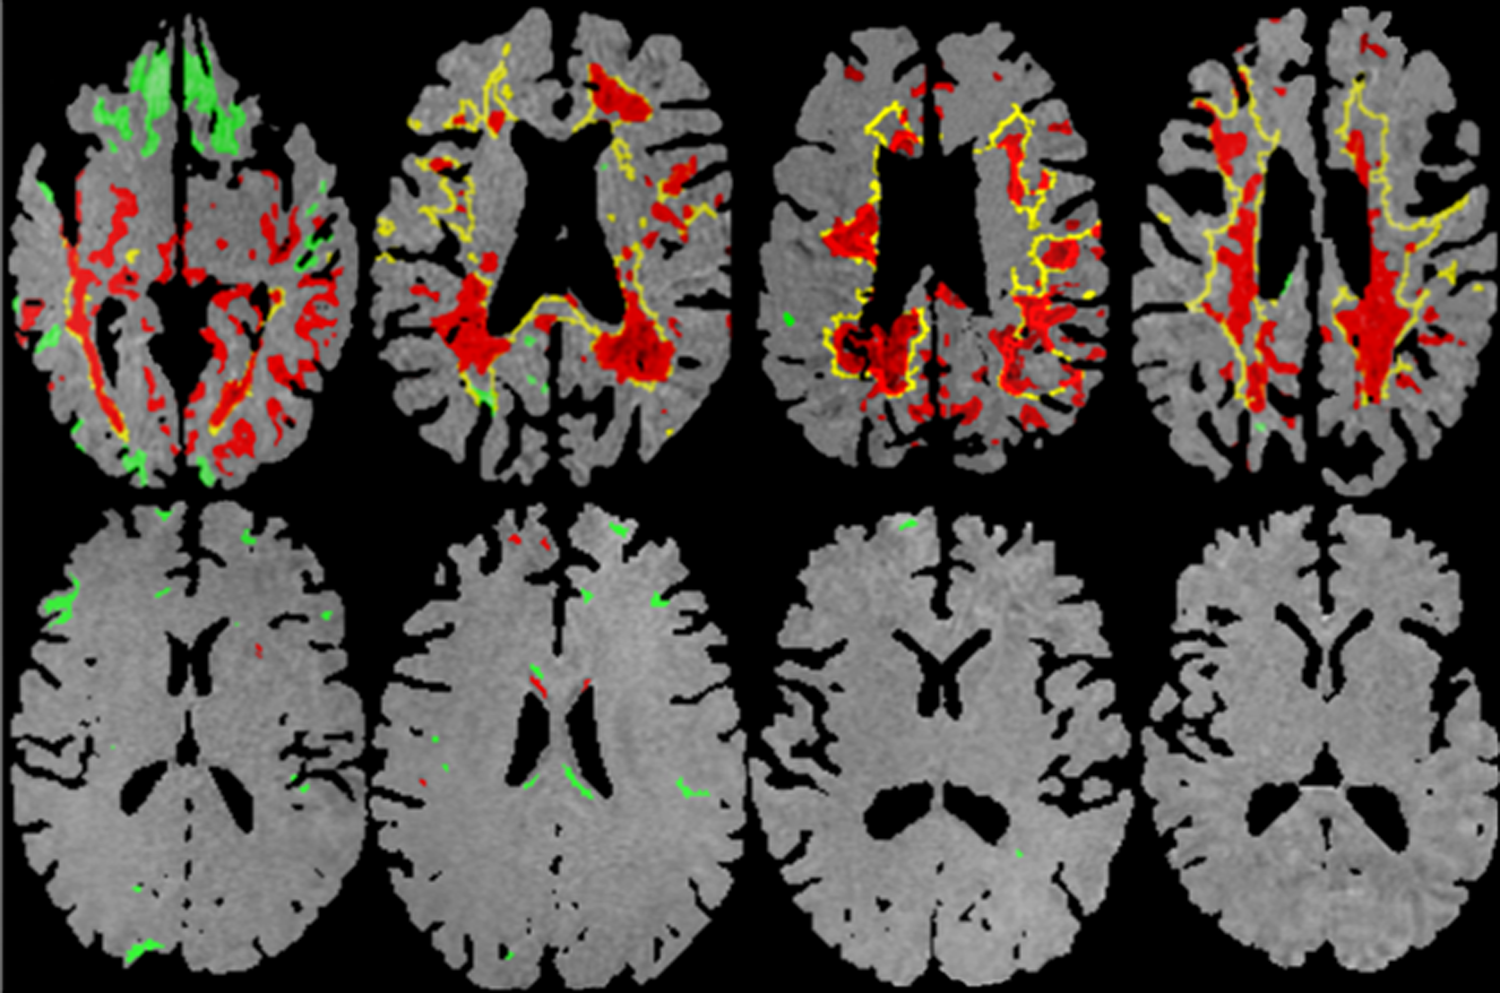
Voxel-wise (VW) magnetization transfer ratio (MTR) mapping of increasing (suggestive of remyelination) and decreasing (suggestive of demyelination) areas in the T2 lesions and normal appearing brain tissue (NABT) in patients with relapsing secondary progressive multiple sclerosis (RSPMS) (upper row) and healthy controls (lower row). From left to right, examples are displayed of various patients between baseline to year 1 (first two columns on the left) and from year 1 to year 2 (last two columns on the right). Yellow outlines represent external contours of visible T2 hyperintense lesions on fluid attenuated inversion recovery (FLAIR) images; green areas represent brain regions undergoing super-threshold increases in MTR (95th percentile); and red areas represent brain regions undergoing super-threshold decreases in MTR (95th percentile). Note the changes within T2 lesions and NABT predominantly undergoing decreases in VWMTR in patients with RSPMS. Note very little volume of tissue undergoing increases/decreases in VWMTR in healthy controls. Note that some caution in interpreting results is warranted since the false discovery rate (FDR) correction process implies that a small, statistically controlled portion of results may be due to artifact.
Statistical analysis
Statistical analysis was performed using the Statistical Package for the Social Sciences (SPSS, Version 16.0). Data were analyzed on an intention-to-treat (ITT) basis. However, given that there were some baseline differences in LVs between patients who began the study and patients who completed the study, the MRI findings (changes in lesion number and LV) were also analyzed on the basis of completion of two years of study.
Statistical demographic and clinical differences among the study groups were calculated using chi squared tests, Student’s-t test and Mann–Whitney U test, as appropriate. Because the volume of tissue undergoing increases/decreases in VWMTR was not normally distributed, the differences between the study groups were calculated using the non-parametric Kruskal–Wallis test, while specific individual active and control groups difference were examined by the Mann–Whitney U test. Within-patient changes from baseline MRI measures and statistical differences between increasing and decreasing VWMTR within groups were calculated using the non-parametric Friedman and Wilcoxon-rank sum tests. The minimum significance level for entry and inclusion in the final model was 0.05. All p values were based on two-tailed tests.
Results
Patients
Eligible participants were recruited between September 2006 and September 2007. Overall, 77 patients initiated natalizumab treatment and 26 patients started IM IFNβ-1a (17 RRMS and nine RSPMS, Table 1). Twenty-two participants were enrolled into the HC group.
Baseline demographic and disease characteristics.
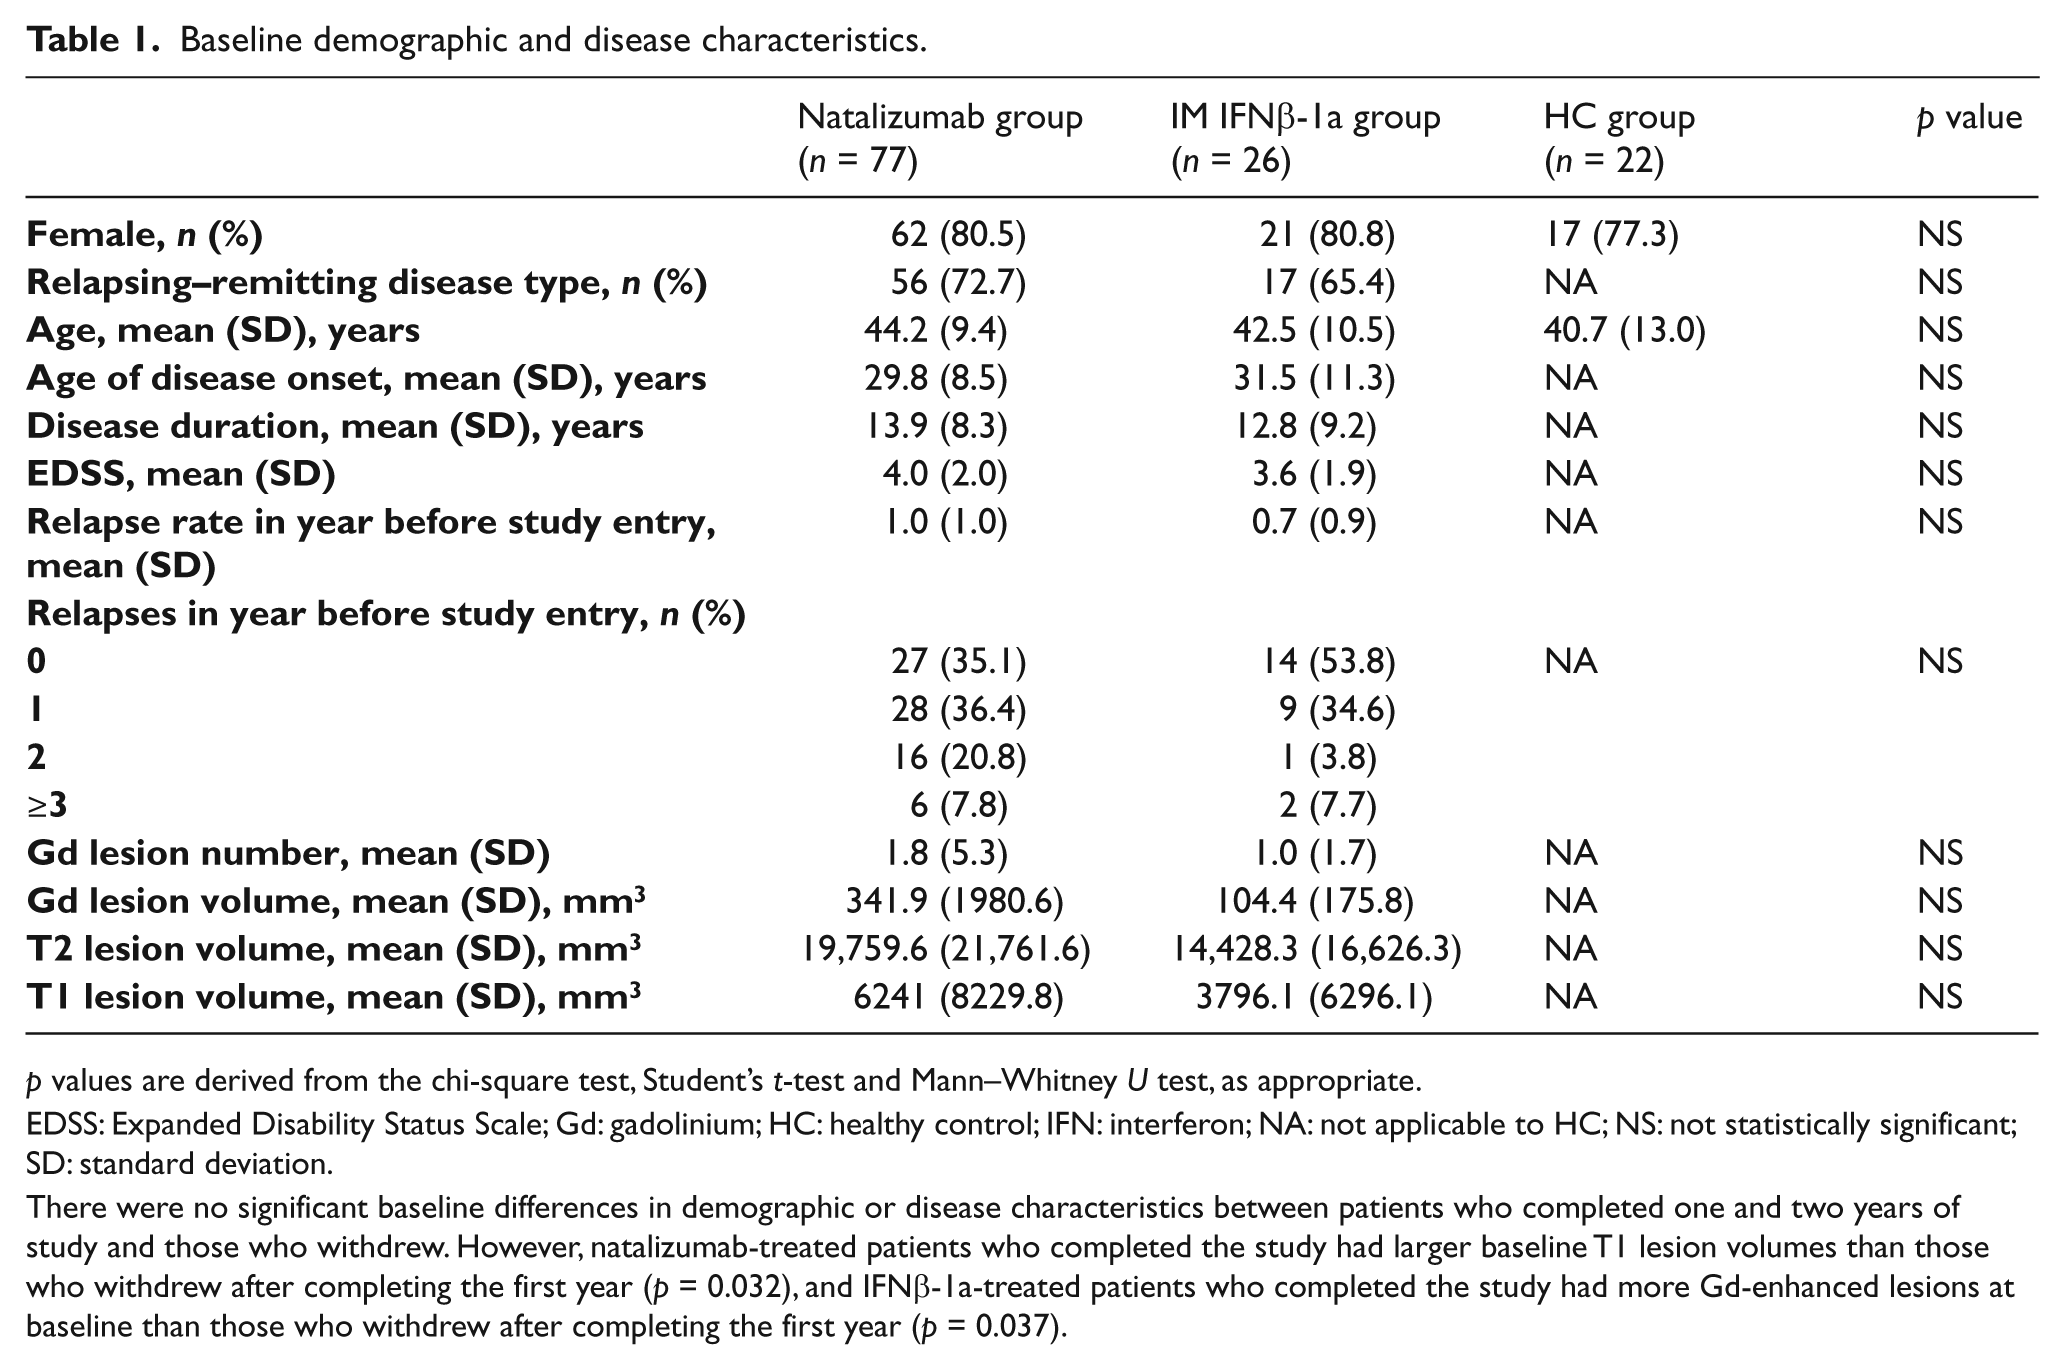
p values are derived from the chi-square test, Student’s t-test and Mann–Whitney U test, as appropriate.
EDSS: Expanded Disability Status Scale; Gd: gadolinium; HC: healthy control; IFN: interferon; NA: not applicable to HC; NS: not statistically significant; SD: standard deviation.
There were no significant baseline differences in demographic or disease characteristics between patients who completed one and two years of study and those who withdrew. However, natalizumab-treated patients who completed the study had larger baseline T1 lesion volumes than those who withdrew after completing the first year (p = 0.032), and IFNβ-1a-treated patients who completed the study had more Gd-enhanced lesions at baseline than those who withdrew after completing the first year (p = 0.037).
Of the 125 participants in the study, 110 completed the first year of the study (62 [81%] natalizumab, 26 [100%] IFNβ-1a and 22 [100%] HC) and 60 completed two years of follow-up (40 [52%] natalizumab, eight [31%] IFNβ-1a and 12 [55%] HC). A flow chart of patient numbers and reasons for study withdrawal are given in Figure A (supplementary material).
Demographic and disease characteristics were similar across the study groups at baseline (Table 1). In addition, there were no significant baseline differences in demographic or disease characteristics between patients who completed one and two years of study and those who withdrew. However, natalizumab-treated patients who completed the study had larger baseline T1 LV than those who withdrew after completing the first year (p = 0.032), and IFNβ-1a-treated patients who completed the study had more Gd-enhanced lesions at baseline than those who withdrew after completing the first year (p = 0.037).
Clinical findings in patients with MS
Table A (supplementary material) shows clinical findings in the treatment groups over one and two years. In the natalizumab group, mean relapse rate decreased from 1.0 to 0.4 (p < 0.001) over one year and remained 0.4 over two years. In total, there were 18 relapses among natalizumab-treated patients in the first year of the study; 12 occurred in patients with RRMS and the remainder occurred in patients with RSPMS. No patients presented with relapses during year 2 (100% relapse free). In the IFNβ-1a group, mean relapse rate increased from 0.7 to 1.5 (p < 0.001) over one year and was 1.0 over two years. At years 1 and 2, there were significantly lower relapse rates and fewer relapses in the natalizumab group than in the IFNβ-1a group (Table A, supplementary material). In both treatment groups, EDSS scores remained relatively stable (Table A, supplementary material).
VWMTR characteristics
Table 2 shows the differences in volume of increasing (suggesting remyelination) and decreasing (suggesting demyelination) VWMTR across groups of MS patients and HC subjects.
Voxel-wise magnetization transfer volume ratio (VWMTR) changes in the study groups.
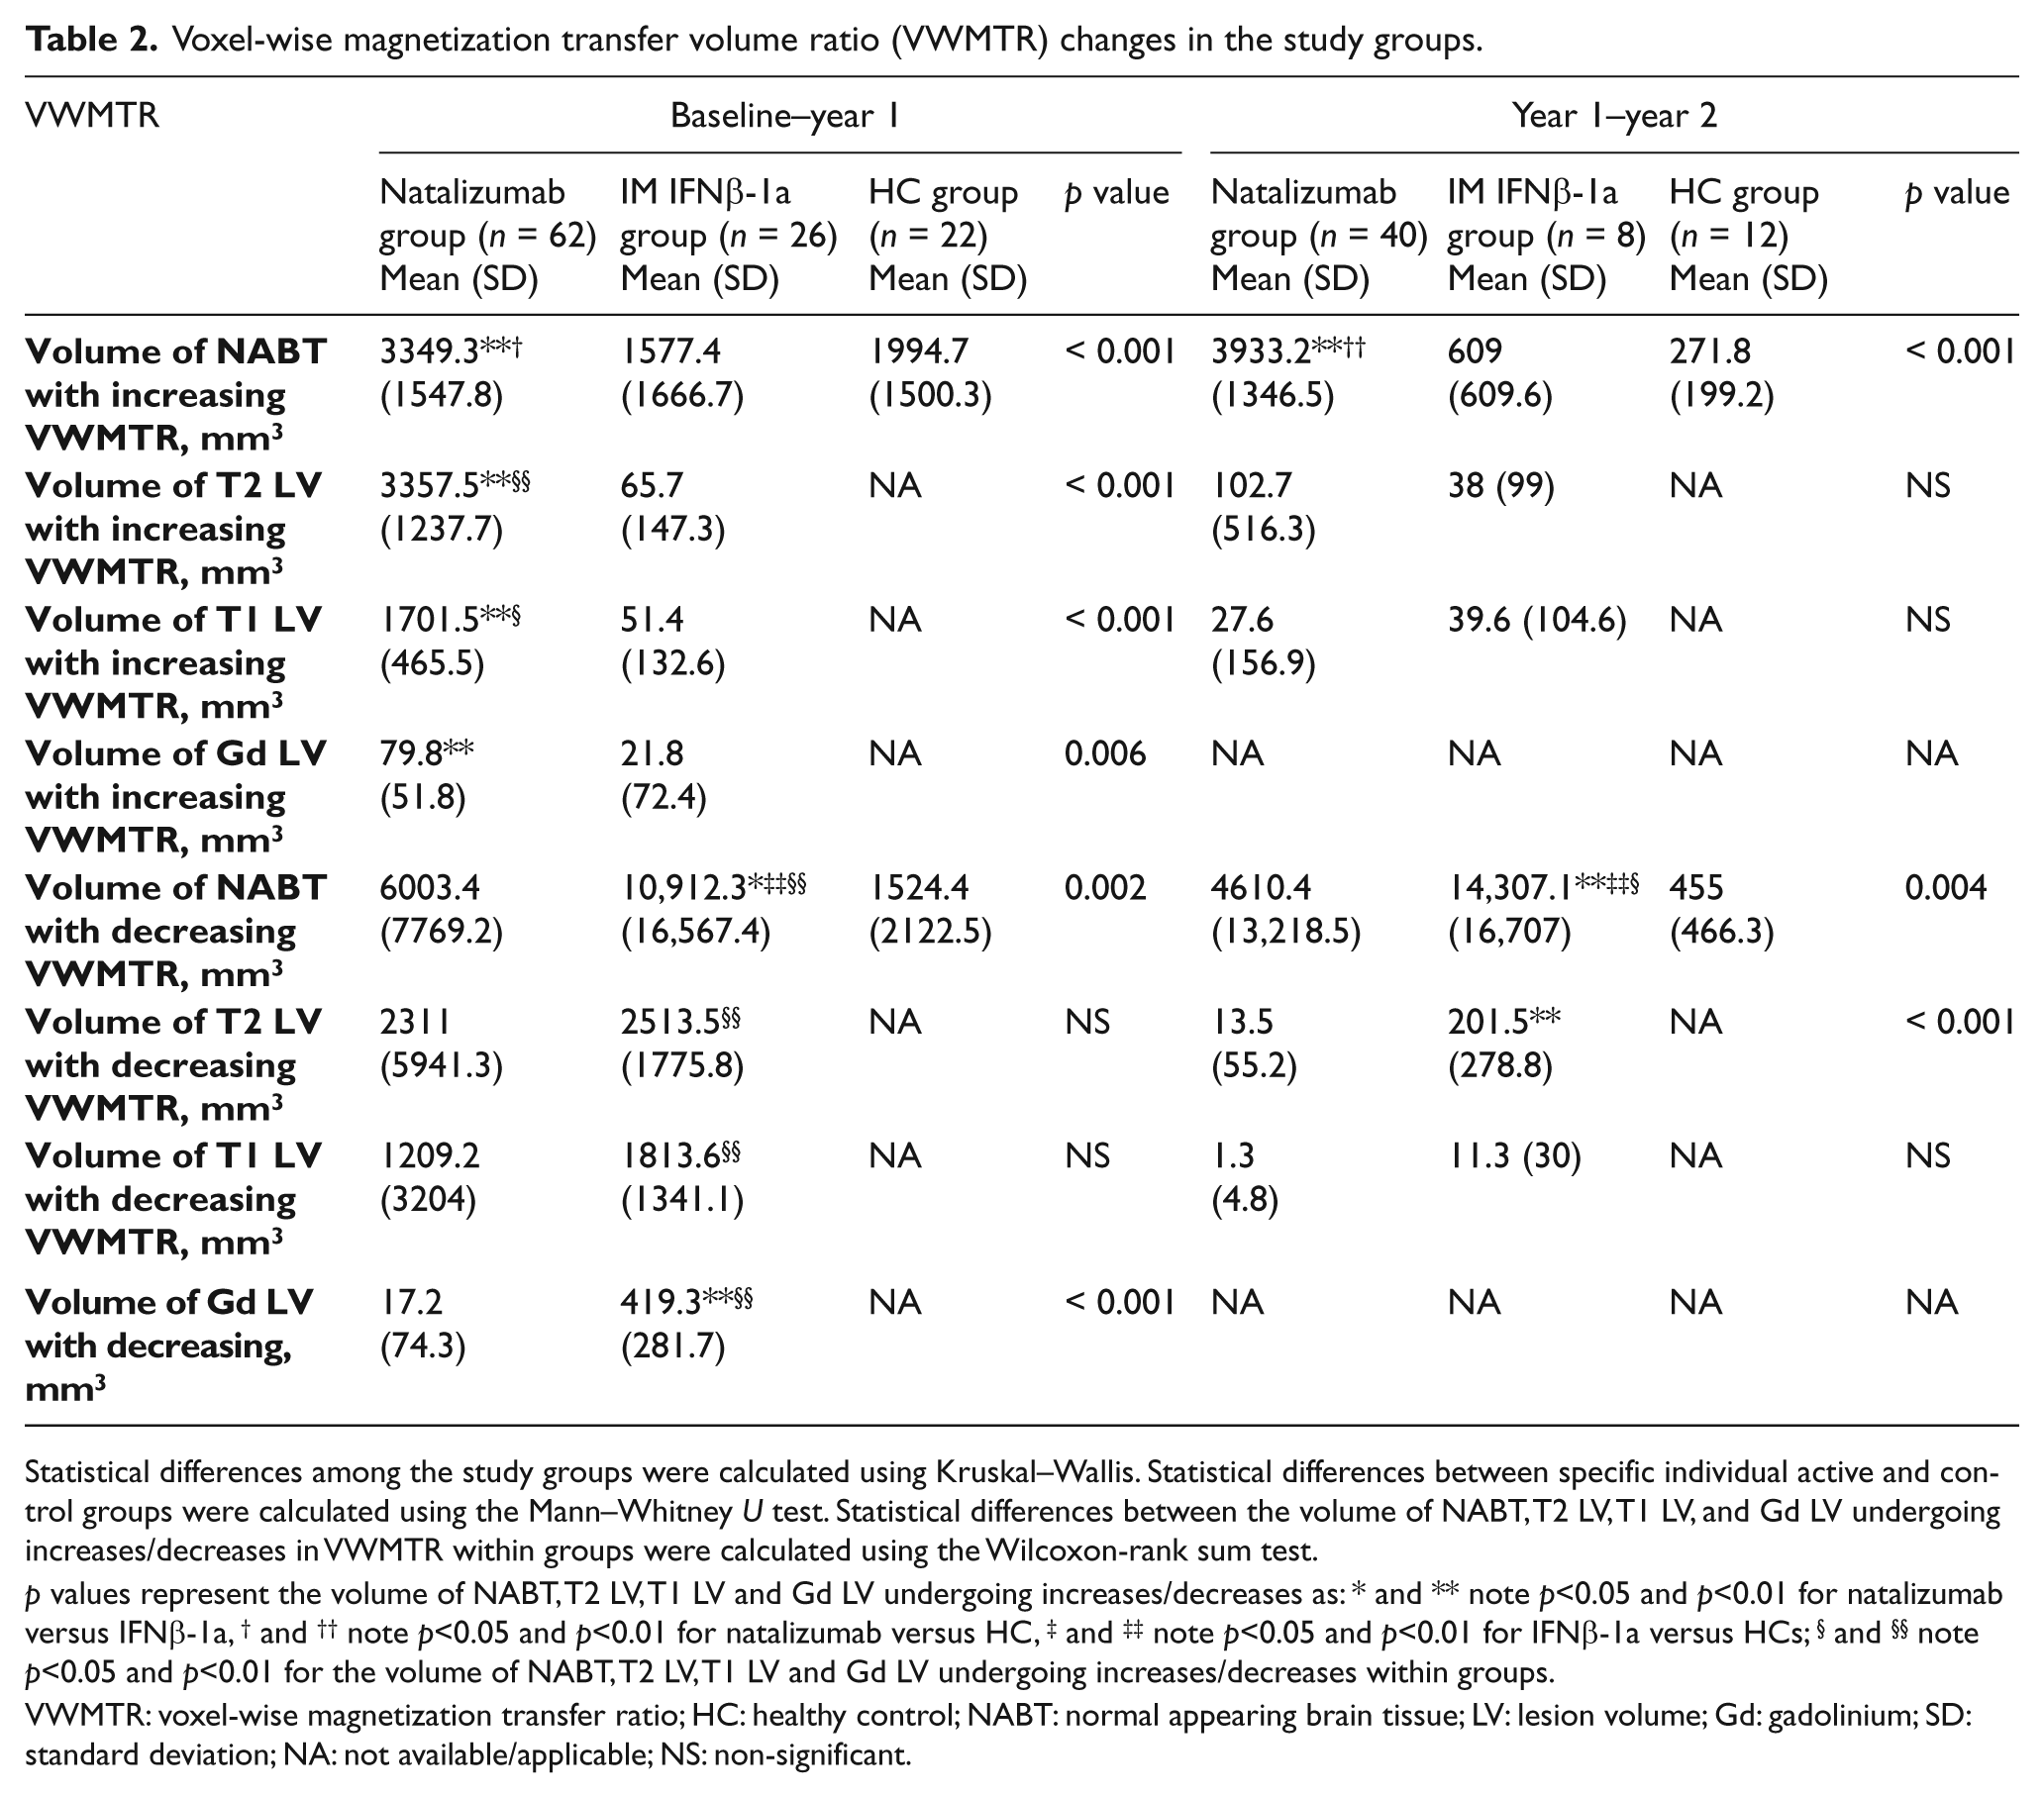
Statistical differences among the study groups were calculated using Kruskal–Wallis. Statistical differences between specific individual active and control groups were calculated using the Mann–Whitney U test. Statistical differences between the volume of NABT, T2 LV, T1 LV, and Gd LV undergoing increases/decreases in VWMTR within groups were calculated using the Wilcoxon-rank sum test.
p values represent the volume of NABT, T2 LV, T1 LV and Gd LV undergoing increases/decreases as: * and ** note p<0.05 and p<0.01 for natalizumab versus IFNβ-1a, † and †† note p<0.05 and p<0.01 for natalizumab versus HC, ‡ and ‡‡ note p<0.05 and p<0.01 for IFNβ-1a versus HCs; § and §§ note p<0.05 and p<0.01 for the volume of NABT, T2 LV, T1 LV and Gd LV undergoing increases/decreases within groups.
VWMTR: voxel-wise magnetization transfer ratio; HC: healthy control; NABT: normal appearing brain tissue; LV: lesion volume; Gd: gadolinium; SD: standard deviation; NA: not available/applicable; NS: non-significant.
NABT VWMTR changes
In both years of the study, a significant difference in the volume within NABT undergoing increases in VWMTR was observed across the study groups (Table 2). Analyses comparing individual groups revealed a larger volume within NABT undergoing increases in VWMTR in the natalizumab-treated patients in the first (p = 0.001) and second (p = 0.008) years of the study compared with IFNβ-1a-treated patients (Figure 1). In the first (p = 0.05) and second (p = 0.007) years of the study, natalizumab-treated patients experienced a larger volume within NABT undergoing increases in VWMTR compared with HC subjects. There was no difference in volume within NABT undergoing increases in VWMTR in HC compared with the IFNβ-1a-treated patients.
The volume within NABT undergoing decreases in VWMTR was also significantly different across study groups (Table 2). Comparison between individual groups revealed that patients treated with IFNβ-1a experienced a larger volume within NABT undergoing decreases in VWMTR, compared with natalizumab-treated patients during years 1 (p = 0.05) and 2 (p = 0.002, Figure 1), and compared with HC subjects during years 1 and 2 (p < 0.001, Figure 2). There were three potential outliers in the natalizumab group who presented with volume within NABT undergoing decreasing VWMTR above 10,000 mm3 in year 1 to year 2 (one showed 13,377.8 mm3, one showed 37,425.6 mm3 and the third showed 67,325.6 mm3). There were also three potential outliers in the IFNβ-1a group (one showed 16,611.1 mm3, one showed 33,170 mm3 and the third showed 41,325 mm3). Visual inspection of the VWMTR images did not reveal artifacts and changes were attributed as biologically plausible.
MS lesion VWMTR changes
During year 1, the natalizumab-treated patients had larger volumes within T2, T1, and Gd-enhanced lesions undergoing increases in VWMTR compared with IFNβ-1a-treated patients (p < 0.006, Table 2 and Figure 1). No significant differences between groups in volume within lesions undergoing increases in VWMTR were seen during year 2.
Patients treated with IFNβ-1a experienced larger volume within Gd-enhanced lesions undergoing decreases in VWMTR during year 1 and in T2 lesion VWMTR during year 2, compared with natalizumab-treated patients (p < 0.001 for both comparisons, Table 2).
Within-patient VWMTR changes
During year 1, natalizumab-treated MS patients exhibited significantly larger volume within T2 and T1 lesions undergoing increases in VWMTR compared with the volume undergoing decreases in VWMTR in the same regions (Table 2). In contrast, IM IFNβ-1a-treated patients exhibited significantly larger volume within NABT, T2, T1, and Gd-enhanced lesions undergoing decreases in VWMTR compared with the volume undergoing increases in VWMTR in these same regions. At year 2, no significant within-patient changes were seen with natalizumab treatment, whereas with IFNβ-1a treatment, the significantly larger volume within NABT undergoing decreases in VWMTR compared with NABT volume undergoing increases in VWMTR persisted (p = 0.02) (Table 2).
VWMTR changes in subtypes of relapsing MS
Among the two types of MS patients enrolled in the study, RRMS patients treated with IFNβ-1a showed significantly larger volume within T2, T1, and Gd-enhanced lesions undergoing decreases in VWMTR compared with natalizumab-treated RRMS patients at one year. Similarly, RSPMS patients treated with IFNβ-1a had significantly larger volume within NABT and Gd-enhanced lesions undergoing decreases in VWMTR (Figure 2) than those treated with natalizumab. Comparisons by MS type were not conducted at the two-year follow-up because of the small number of RSPMS patients (n = 2) treated with IFNβ-1a.
Changes in volume of tissue undergoing increases/decreases in VWMTR were compared between the first and second years of the study. In the natalizumab group, smaller volume within T2, T1 and Gd-enhanced lesions undergoing increases in VWMTR (p<0.05) and smaller volume within NABT (p = 0.079), T2 (p < 0.001), T1 (p < 0.001), and Gd-enhanced (p = 0.07) lesions undergoing decreases in VWMTR were observed in the second year compared with the first year. In the IFNβ-1a group, a smaller volume within NABT undergoing increases in VWMTR (p = 0.02) and smaller volume within T1 (p = 0.02), T2 (p = 0.06), and Gd-enhanced (p = 0.02) lesions undergoing decreases in VWMTR was observed in the second year compared with the first year of study. In the HC group, a lesser extent (p = 0.01) of volume within NABT underwent increases in VWMTR in the second year of study.
MRI lesion number and volume change in patients with MS
Changes in lesion number and volume are shown in Table B (supplementary material). There was a significant decrease in the number and volume of Gd-enhanced lesions over the course of the study in the natalizumab group and trend for decrease in the IFNβ-1a group. However, T2 and T1 LV increased in both treatment groups.
Safety in natalizumab-treated patients
In natalizumab-treated patients, seven patients experienced an allergic reaction in year 1 and were withdrawn from the study. In the second year, one patient developed breast cancer and was discontinued from natalizumab. In addition, one 53-year-old female patient with RSPMS developed PML approximately four months after completing the two-year follow-up and died approximately four months later. No other safety concerns were observed with natalizumab in the studied population (including opportunistic infections and anaphylactic reactions). No safety issues were reported in the IFNβ-1a treatment arm.
Discussion
In this two-year study, relapsing MS patients treated with i.v. natalizumab exhibited significantly larger tissue volume undergoing increases in VWMTR compared with patients treated with IM IFNβ-1a or HC subjects. These findings suggest that i.v. natalizumab may significantly promote remyelination compared with IM IFNβ-1a. At the same time, natalizumab treatment was associated with stabilization in the volume of lesion and NABT undergoing decreases in VWMTR compared with IM IFNβ-1a. These findings suggest that natalizumab treatment may stabilize demyelination both in lesions and in NABT compared with IM IFNβ-1a.
In addition to effects on VWMTR suggestive of remyelination/demyelination, natalizumab monotherapy reduced the mean relapse rate over one and two years, which is consistent with observations in the phase 3 AFFIRM study. 16 Conversely, we did not observe a reduction in relapse rate with IM IFNβ-1a in our group. This may reflect the relatively small number of patients we enrolled in the IFNβ group. There were no occurrences of relapses in either the natalizumab or IM IFNβ-1a arms over the second year of follow-up. The EDSS remained stable in both treatment arms.
During the study, the volume within NABT undergoing increases/decreases in VWMTR was larger than changes observed for T2 LV. This indicates that the VWMTR method might be a more sensitive approach than LV-based measures for assessing ‘real-time’ changes suggestive of remyelination/demyelination, without the need for highly complex experimental techniques or biopsy. Although our VWMTR method for determining increasing/decreasing volume changes has not yet been histopathologically validated and, therefore, the dynamics of these changes do not necessarily represent a specific sign of remyelination/demyelination, 10 recent histopathological, in vivo and clinical studies have shown the sensitivity and validity of voxel-based thresholding methods for assessing changes in MTR consistent with remyelination/demyelination in MS.12,13,26 However, to our knowledge, this is the first study in patients with MS to use the VWMTR method to specifically monitor the effectiveness of a disease-modifying therapy.
The VWMTR method used in this study was previously validated via separate and complementary approaches, including simulation, scan–rescan test and application to a real dataset. 10 In this study, we slightly modified the VWMTR method by substituting use of individual inhomogeneity corrections on baseline and follow-up MTR maps with increased threshold on the high-pass filter for the joint subtraction image. This slightly modified approach is more conservative. In a previous study, 10 a simulation approach was used to test the robustness of the method against a variety of noise levels (kappa was 0.573 ± 0.089 and area under curve was 0.942) to gain a more complete understanding of the specificity and sensitivity achievable (95th percentile) and to compare it with a standard thresholding approach. 11
Scan–rescan data were used to verify the stability of the results in the short term. 10 The volume within NABT undergoing increases/decreases in VWMTR in HC scanned over a one week period showed an average false positive rate of 0.3% for all of the NABT (1440 mm3 for increases and 1480 mm3 for decreases with specificity of 99.7%). 10 It is not entirely clear why the HC presented with somewhat greater volume within NABT undergoing increases in VWMTR over the first year compared with the second year of follow-up in the present study, and whether these NABT VWMTR changes reflect measurement error, artifacts or real myelin-related biological changes in healthy subjects over time. Since all images were visually verified, gross artifacts can be ruled out, but we cannot exclude measurement noise related to our reproducibility of the method. However, the results of this study are more conservative when compared with our previous pilot investigation that revealed 3420 mm3 of volume within NABT undergoing increases in VWMTR over one-year follow-up in the HC group. Nevertheless, given that volume within NABT undergoing increases in VWMTR in HC was close to that of the IM IFNβ-1a-treated MS patients in the first year, it is unclear whether the only reason for VWMTR increases may be related to remyelination or whether there are other mechanisms for these changes besides remyelination. Resolution of edema and fluid shifts could also play a role in this effect with treatment, although the volume within NABT continuous increases in VWMTR in the second year of the natalizumab treated patients would point toward a more sustained remyelination effect, as most of the changes related to fluid shifts should have been resolved by then. 15
The results from this study raise an interesting question about regional predilection of the volume of tissue undergoing increases/decreases in VWMTR. While we can only speculate at this time whether the volume of tissue undergoing increases in VWMTR is more confined to the frontal lobes and the volume of tissue undergoing decreases in VWMTR is more confined to the parietal and occipital lobes (Figure 1), our visual inspection of the data reveals possible regional specificity. One potential explanation for these observations might be related to the distribution of brain-derived neurotrophic factor (BDNF) receptors and consequently a higher capacity for remyelination in specific regions.27,28 More sophisticated regional voxel-wise type analysis of the volume of tissue undergoing increases/decreases in VWMTR will be the subject of our further reports.
The usefulness of the VWMTR method in detecting cortical demyelination on longitudinal images from individual MS patients has not yet been determined. Visual inspection of the data revealed that the volume within NABT undergoing predominantly decreases/increases in VWMTR was in the cortical subpial regions. While changes within gray matter are currently detected by our approach, they are not isolated and quantified independently for cortical regions. We plan to use a joint longitudinal cortical mask to test the sensitivity and specificity of our VWMTR method in detecting cortical demyelination by using a pre- and post-mortem imaging approach.
During the study, one patient being treated with natalizumab developed breast cancer and was discontinued from natalizumab. Breast cancer is not a known adverse reaction with natalizumab, 29 and therefore it is likely that this event was not treatment related. Another natalizumab-treated patient developed a fatal case of PML, an opportunistic viral infection of the brain. PML has previously been reported in patients taking natalizumab, and as a consequence the drug is available only through a special restricted distribution program called the TOUCH® prescribing program.22,29 Patients in our study fulfilled the criteria of this program.
The study was originally designed to be one year in length. At one year, the results indicated the sensitivity of the VWMTR technique for detecting differences in the effect of disease-modifying therapy on MTR. We therefore proposed that a two-year follow-up was warranted to assess the longer-term effect of natalizumab and IFNβ-1a on VWMTR changes. Extending the study provided additional useful data on the maintained beneficial impact of natalizumab on VWMTR changes suggestive of remyelination/demyelination. The longer-term data also provided further support for the use of the VWMTR method for monitoring disease activity in patients with MS. However, a major shortcoming of extending the study was that a sizable proportion of patients and HCs refused to participate in the second year of follow-up compared with baseline (48% for natalizumab, 69.2% for IFNβ and 45.5% for HC groups). This was particularly noticeable in the IFNβ-1a group; in total, 16 of 26 patients in this treatment arm failed to provide consent to participate in the second year of the study. Consequently, the results observed with IFNβ-1a in year 2 of follow-up should be treated with caution and the validity of the comparisons with year 1 may be skewed. This is particularly relevant for interpreting the volume within NABT undergoing decreases in VWMTR in year 1 to year 2 in the natalizumab and IFNβ-1a groups. There were three potential outliers in each treatment group who presented with volume within NABT undergoing decreasing VWMTR above 10,000 mm3; however, these patients were not excluded from the analyses, as visual inspection of the images did not reveal artifacts. Therefore, these changes were considered as biologically plausible. Furthermore, these potential outliers presented the VWMTR values opposite to our hypothesis and so make the results even more conservative.
Further limitations of the study are that it enrolled a relatively small number of patients and that patients were not randomly assigned to treatment. As a consequence, a larger, randomized trial would be useful to confirm our findings. There are also certain limitations associated with the VWMTR method, which are discussed in detail elsewhere. 10 However, the proposed approach of detecting the volume within NABT undergoing increases/decreases in VWMTR in vivo is promising and should be further studied and improved.
Our findings suggest that, in patients with relapsing MS, two years of treatment with i.v. natalizumab may promote remyelination (as indicated by volume within NABT undergoing increases in VWMTR) and may stabilize demyelination (as indicated by volume within NABT undergoing decreases of VWMTR) compared with IFNβ-1a.
Supplemental Material
sj-doc-1-msj-10.1177_1352458511433304 – Supplemental material for Voxel-wise magnetization transfer imaging study of effects of natalizumab and IFNβ-1a in multiple sclerosis
Supplemental material, sj-doc-1-msj-10.1177_1352458511433304 for Voxel-wise magnetization transfer imaging study of effects of natalizumab and IFNβ-1a in multiple sclerosis by R Zivadinov, MG Dwyer, S Hussein, E Carl, C Kennedy, M Andrews, D Hojnacki, M Heininen-Brown, L Willis, M Cherneva, N Bergsland and B Weinstock-Guttman in Multiple Sclerosis Journal
Supplemental Material
sj-doc-2-msj-10.1177_1352458511433304 – Supplemental material for Voxel-wise magnetization transfer imaging study of effects of natalizumab and IFNβ-1a in multiple sclerosis
Supplemental material, sj-doc-2-msj-10.1177_1352458511433304 for Voxel-wise magnetization transfer imaging study of effects of natalizumab and IFNβ-1a in multiple sclerosis by R Zivadinov, MG Dwyer, S Hussein, E Carl, C Kennedy, M Andrews, D Hojnacki, M Heininen-Brown, L Willis, M Cherneva, N Bergsland and B Weinstock-Guttman in Multiple Sclerosis Journal
Supplemental Material
sj-doc-3-msj-10.1177_1352458511433304 – Supplemental material for Voxel-wise magnetization transfer imaging study of effects of natalizumab and IFNβ-1a in multiple sclerosis
Supplemental material, sj-doc-3-msj-10.1177_1352458511433304 for Voxel-wise magnetization transfer imaging study of effects of natalizumab and IFNβ-1a in multiple sclerosis by R Zivadinov, MG Dwyer, S Hussein, E Carl, C Kennedy, M Andrews, D Hojnacki, M Heininen-Brown, L Willis, M Cherneva, N Bergsland and B Weinstock-Guttman in Multiple Sclerosis Journal
Footnotes
Acknowledgements
The authors acknowledge the contributions of Infusion, Haddam, CT, USA, for editorial assistance in the preparation of the manuscript. The authors thank Eve Salczynski for technical assistance in the preparation of this manuscript.
Funding
This work was supported by Biogen Idec., (Weston, MA 02493, USA) IRB NEU2011107E.
Author contributions (including performance of statistical analyses)
RZ and BW-G contributed to design and conceptualization of the study. RZ, MGD, SH, EC, CK, MA, DH, MH-B, LW, MC, NB and BW-G contributed to analysis or interpretation of the data. All authors contributed to drafting or revising the manuscript for intellectual content.
Conflict of interest statement
RZ is a speaker and consultant for Biogen Idec, EMD Serono, Genzyme, Questcor Pharmaceuticals, and Teva and receives financial support for research activities from Biogen Idec, Bracco, EMD Serono, Genzyme, Questcor Pharmaceuticals, and Teva.
MGD, SH, EC, CK and MA have nothing to disclose. DH is a speaker and consultant for Biogen Idec, EMD Serono, Pfizer, and Teva. MH-B, LW, MC and NB have nothing to disclose. BW-G received personal compensation for consulting, speaking and serving on a scientific advisory board for Biogen Idec, EMD Serono, Pfizer, and Teva Neuroscience, received personal compensation for serving on an advisory board for Novartis and received financial support for research activities from Aspreva, Acorda, National Multiple Sclerosis Society, the National Institutes of Health, ITN, Biogen Idec, EMD Serono, Cognition, and Teva Neuroscience.
Supplemental material
Supplemental material for this article is available online.
References
Supplementary Material
Please find the following supplemental material available below.
For Open Access articles published under a Creative Commons License, all supplemental material carries the same license as the article it is associated with.
For non-Open Access articles published, all supplemental material carries a non-exclusive license, and permission requests for re-use of supplemental material or any part of supplemental material shall be sent directly to the copyright owner as specified in the copyright notice associated with the article.