
Abstract
Background:
Optical coherence tomography can be used to assess retinal degeneration in multiple sclerosis (MS). Thinning of the retinal nerve fibre layer and macular thickness have been well characterized, but newer devices allow quantification of all retinal layers.
Objectives:
The objective of this study was to evaluate the thickness of the paramacular retina, peripapillary retinal nerve fibre layer, and deeper paramacular layers in MS patient subgroups, using state-of-the-art optical coherence tomography.
Methods:
Using a Heidelberg Engineering Spectralis device, we performed paramacular volumetric retinal scans and circular peripapillary fibre-layer scans, manually segmenting different retinal layers into single horizontal foveal scans in 95 patients with definite MS (42 relapsing–remitting, 41 secondary progressive, 12 primary progressive), plus 91 age- and sex-matched controls.
Results:
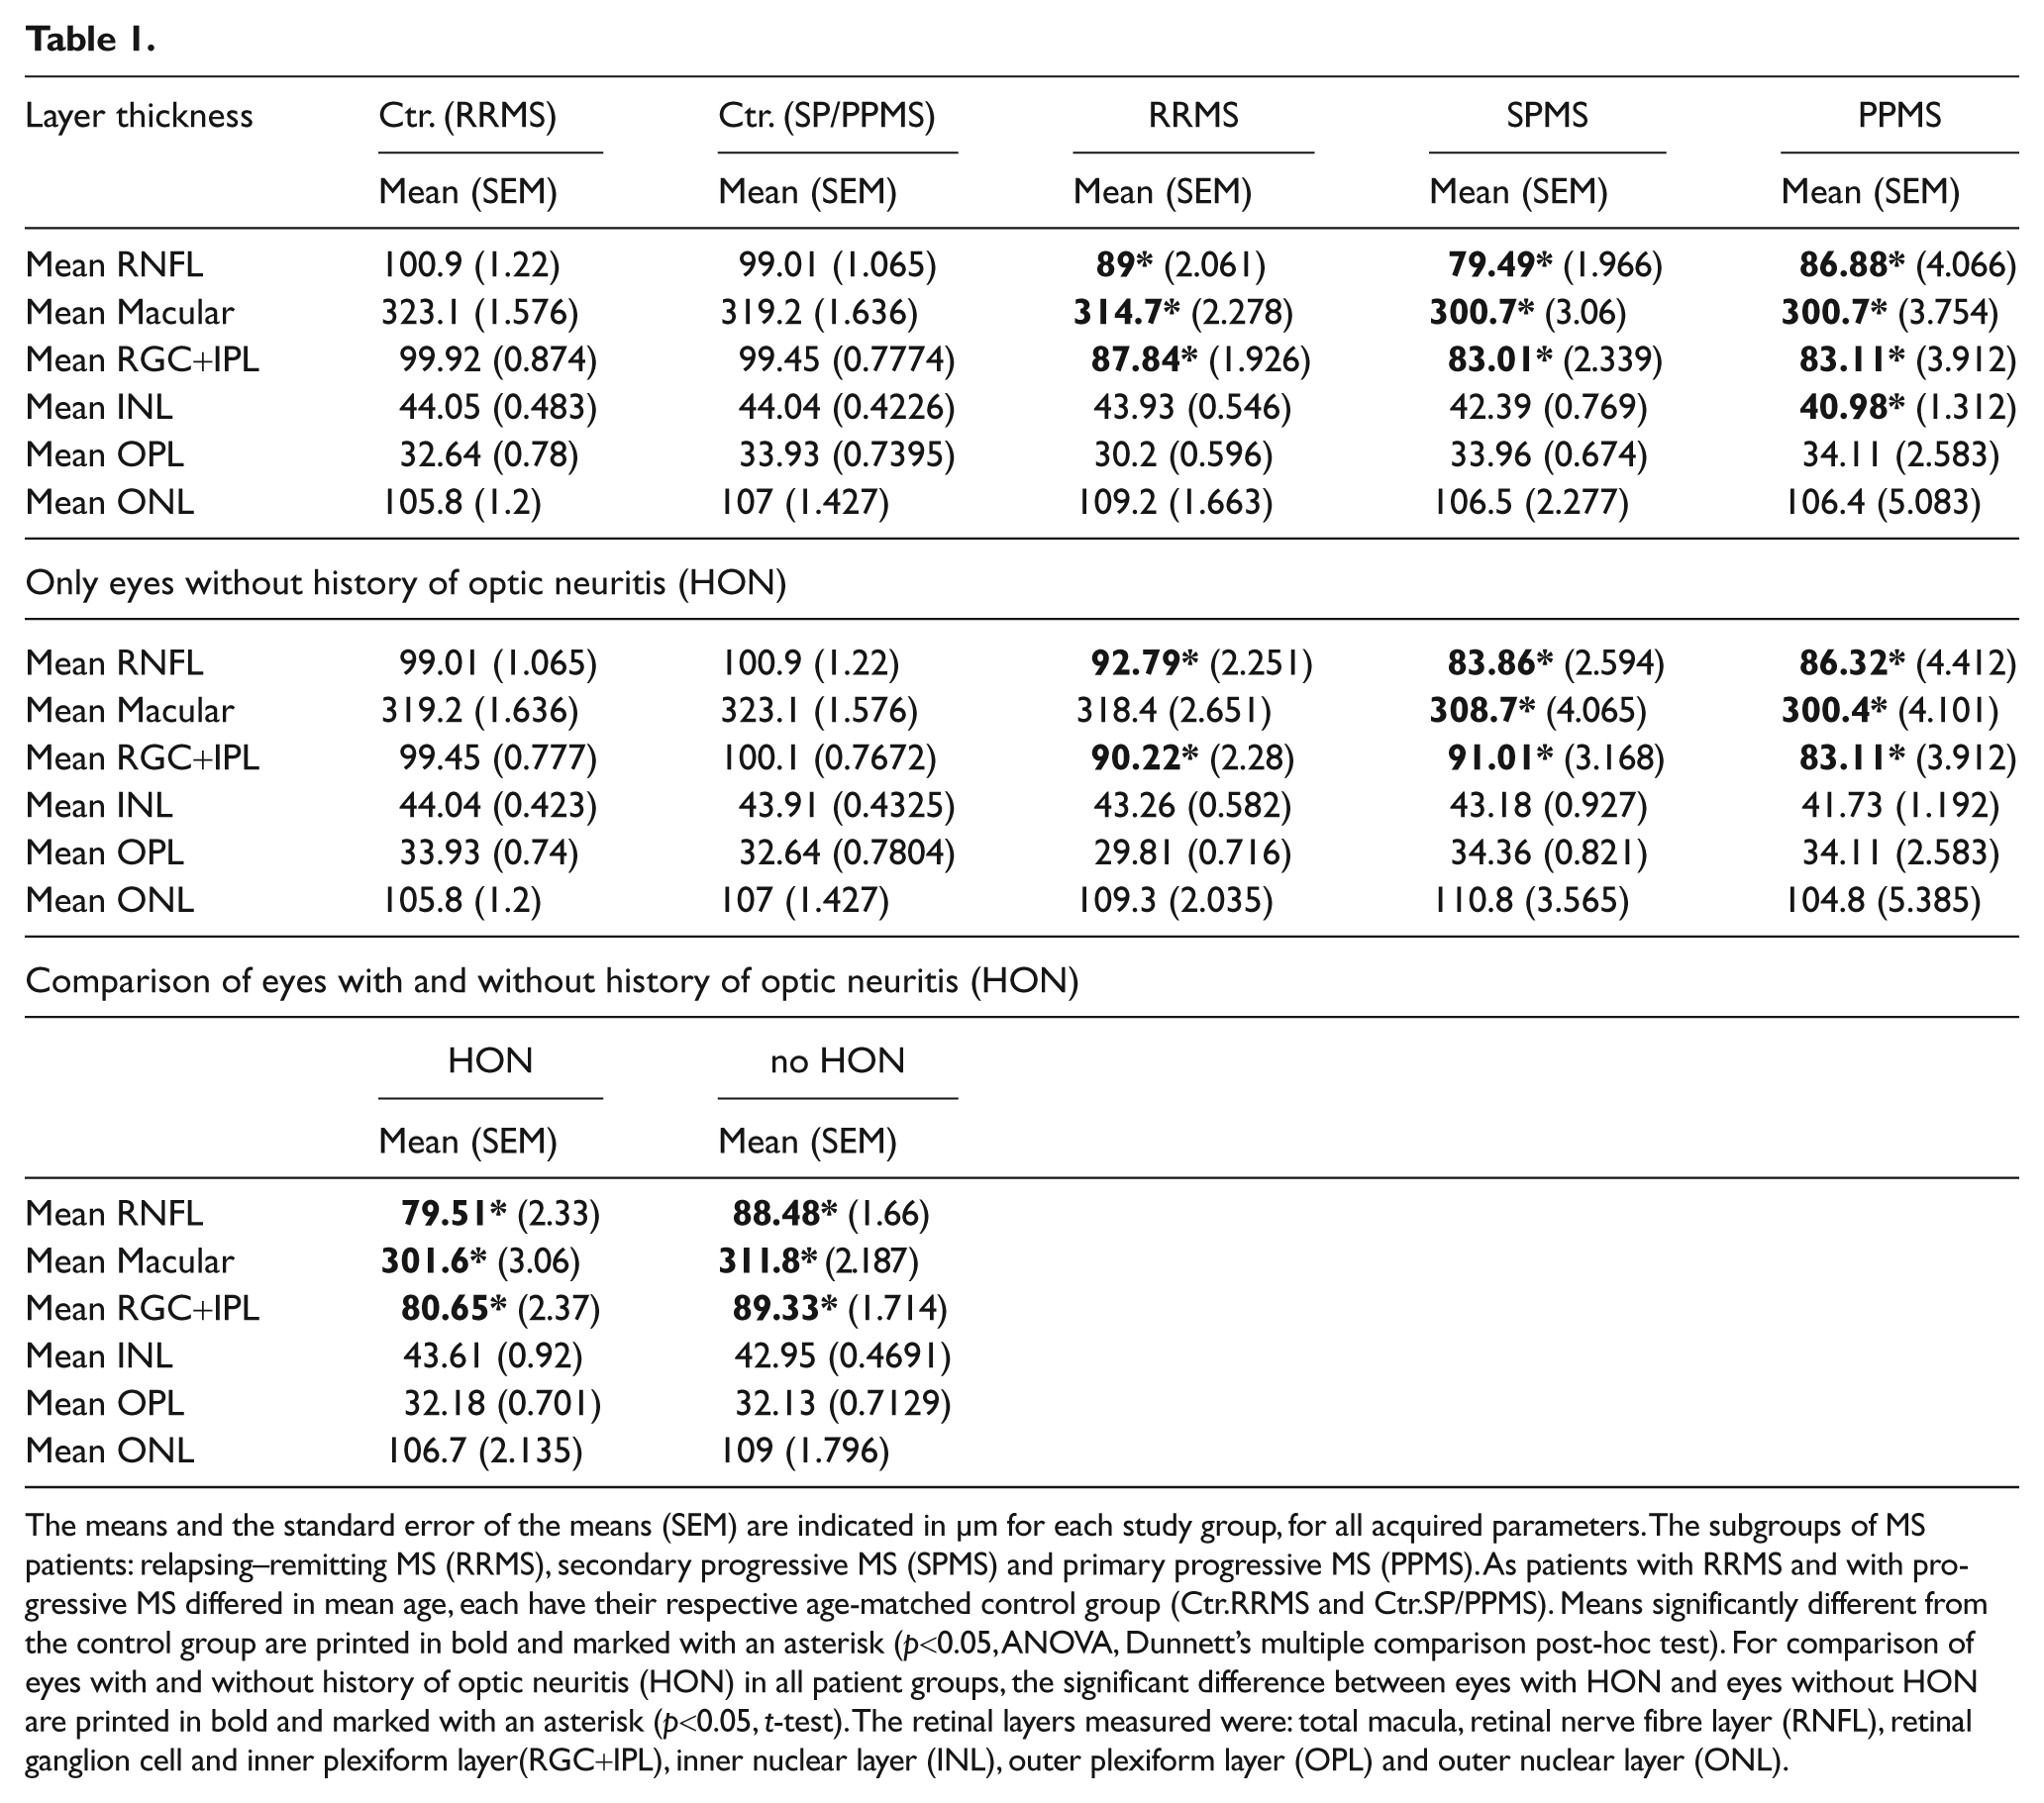
Even without a history of optic neuritis, all MS subgroups had significant thinning of the peripapillary retinal nerve fibre layer, the paramacular retinal thickness and the retinal ganglion cell- and inner plexiform layer. Only in primary progressive MS was the inner nuclear layer significantly reduced.
Conclusions:
Our findings indicate a primary retinal pathology involving the inner nuclear layer in primary progressive MS. Results in eyes without history of optic neuritis suggest possible subclinical episodes of optic neuritis or retrograde trans-synaptic degeneration of retinal ganglion cells and their axons.
Keywords
Introduction
Multiple sclerosis (MS) is a chronic inflammatory disease of the central nervous system (CNS) that involves autoimmune mechanisms targeting both white and grey matter. The key pathophysiology of MS is characterized by demyelination of nerve tissue, which culminates in a reduction in axonal transmission. 1,2 Concomitant axonal and neuronal degeneration seems to be responsible for permanent disability in this disease. 3 –5
In 50% of MS patients visual dysfunction is the presenting symptom and in particular, optic neuritis is the heralding event in up to 38% of patients. 6,7 Visual function is affected in up to 80% of patients with longstanding MS, and loss of vision is the second most important deficit causing reduced quality of life. 5,8
Optical coherence tomography (OCT) is a non-invasive, high-resolution technique using low-coherence interferometry to obtain cross-sectional images of the retina. 9 OCT allows a precise morphological examination of the fovea, optic disc, peripapillary retinal nerve fibre layer (RNFL) thickness, and general layered structure of the retina. 10
The RNFL is the first layer below the inner limiting membrane and contains the axons of the ganglion cells which form the optic nerves, chiasm, and optic tracts. 11 Since retinal axons remain non-myelinated until they penetrate the lamina cribrosa, the RNFL is an ideal structure to visualize any process of neurodegeneration, stasis or repair that may occur in a natural setting or as a consequence of neuroprotective interventions. 12
Several studies demonstrate that there is thinning of the RNFL in MS patients with and without optic neuritis. 13 –19 A meta-analysis for time domain OCT, performed by Petzold et al. (2010), confirmed a RNFL thinning of 20.38 µm (n=2063, p<0.0001) after optic neuritis in MS, and of 7.08 µm (n=3154, p<0.0001) in MS without optic neuritis. 20 RNFL thickness is associated with clinically significant visual loss 21 and it correlates with clinical neurological impairment, as well as with paraclinical data like evoked potentials. 20 Less is known about the relationship between MS and the deeper retinal layers, in particular the retinal ganglion cell (RGC) layer, the inner plexiform layer (IPL), the inner nuclear layer (INL), the outer plexiform layer (OPL) and the outer nuclear layer (ONL).
Recent studies using OCT or laser polarimetry (GdxVCC) revealed there is degeneration of the RGC layer in MS patients’ eyes. 22 –24 Using a novel retinal segmentation protocol in a Cirrus OCT device (Zeiss, Germany), Saidha et al. (2011) found a significant thinning of the INL and ONL only in a subgroup of MS patients with predominant macular thinning, when compared with other patients with MS with a relative sparing of the RGC layer. In MS patients without predominant macular thinning, the INL and ONL thicknesses were not found to be different from healthy controls. 19
In a pilot study involving eight MS patients, Davies et al. (2011) recently demonstrated that RGC layer volumes become reduced in the eyes of patients with MS, as compared to disease-free controls, and that MS eyes having a history of optic neuritis (HON) have the greatest degree of RGC neuronal loss. 23 A large histopathology study revealed degeneration of the RNFL, macular thickness and RGC layer in 82 MS patient eyes. Mainly in patients with primary or secondary progressive MS, this study also found atrophy of the INL. 25
We present the first study that assesses the thickness of all relevant paramacular retinal layers in horizontal transfoveal scans, using a Spectralis OCT device.
Materials and methods
Patients
After obtaining informed consent, we examined 42 patients with relapsing–remitting multiple sclerosis (RRMS), 41 with secondary progressive MS (SPMS), 12 with primary progressive MS (PPMS) and 91 control patients without any ophthalmologic, other inflammatory or degenerative neurological diseases. Patients were diagnosed following the 2005 revised McDonald criteria. 26 All subjects reported ophthalmologic examinations within three years before our OCT. We excluded the following from our analysis: subjects with high myopia, a history of retinopathy or glaucoma, or patients with acute optic neuritis or with HON less than 12 months before OCT measurement. The study participants’ clinical features are listed in the Supplemental Table (see supplementary Table online). Any eyes with uncertain HON were excluded from the comparison between HON and no HON.
Optical coherence tomography
The details of the principles of spectral-domain OCT have been described elsewhere. 27 Using a Spectralis OCT device (Heidelberg Engineering, Germany), we obtained perifoveal volumetric retinal scans consisting of 25 single horizontal axial scans (scanning area: 6 × 6 mm2, Figure 1 centred at the fovea). To assess the peripapillary RNFL, a circular scan with a diameter of approximately 3.4 mm (1024 A-scans) was performed after manually positioning the centre on the middle of the optic disc. Furthermore, we performed high-resolution horizontal scans through the middle of the fovea. All scans were performed with support of the image alignment eye-tracking system (TruTrack, Heidelberg Engineering, Germany). RNFL measurements and high-resolution single horizontal scans were averaged from 100 images and scans for volumetric calculations were averaged from 10 images (Automatic Real Time or ART). Any scans with poor quality (<20 DB) were excluded from the analysis.
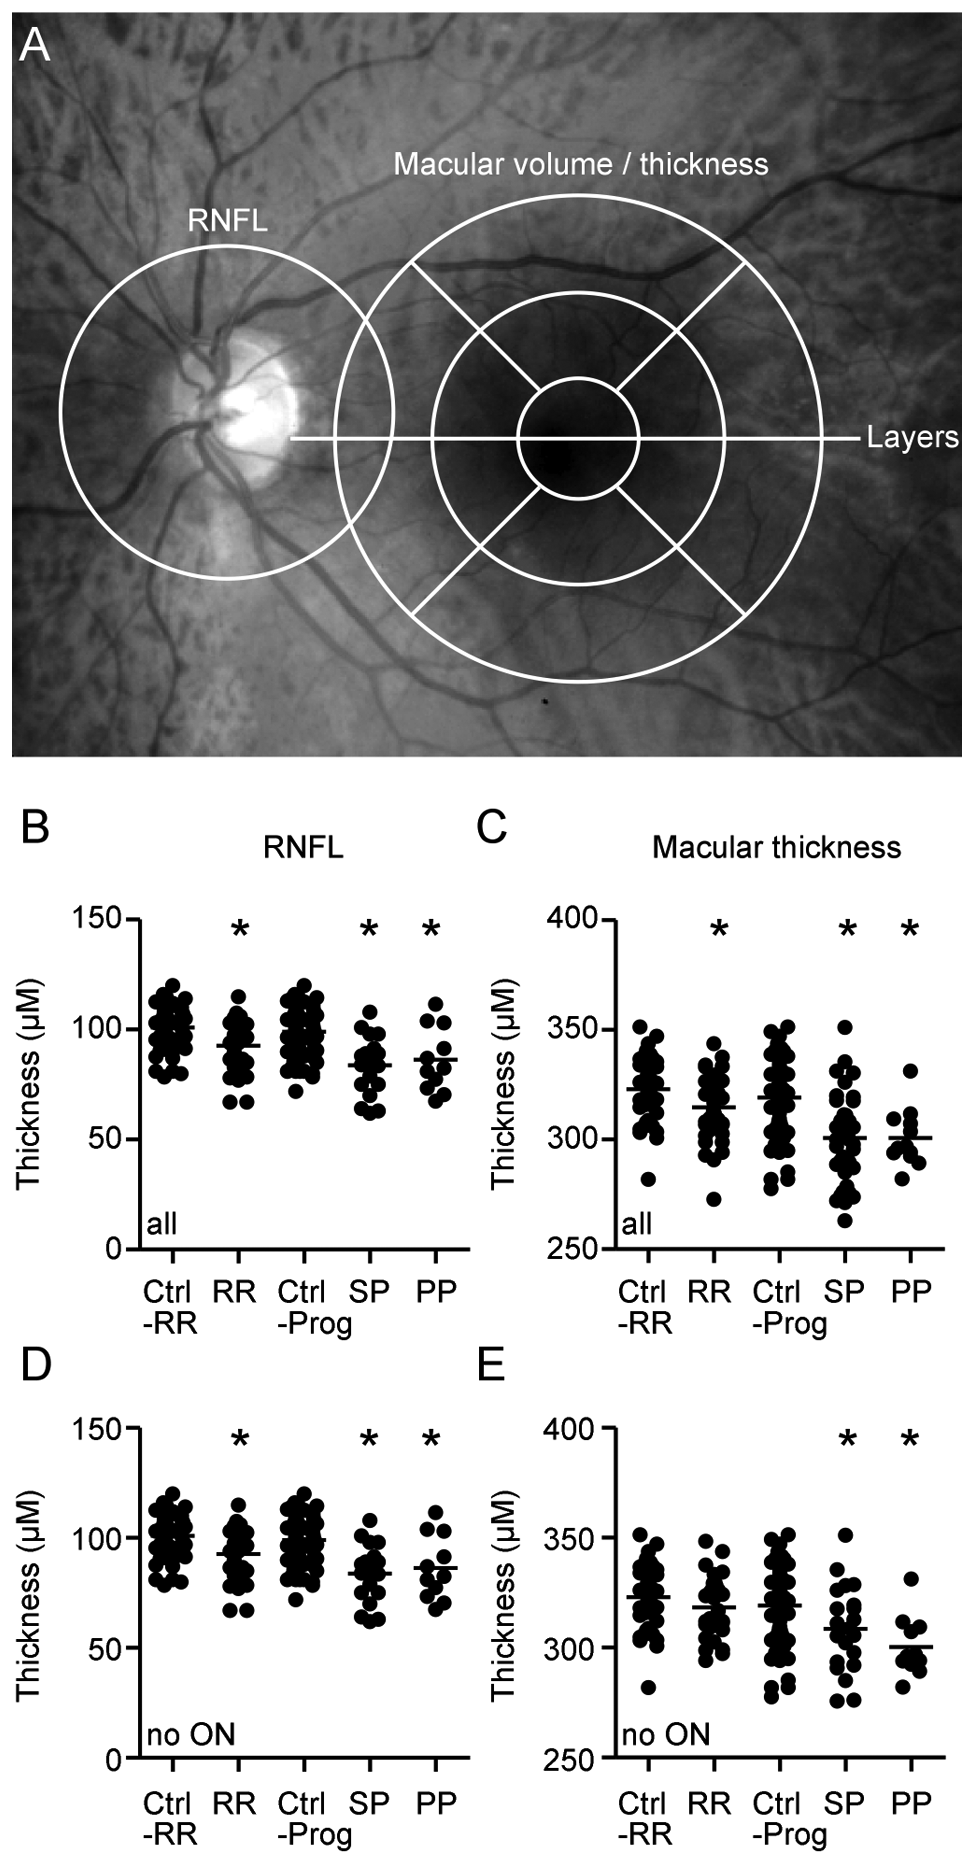
Established Optical Coherence Tomography (OCT) parameters in multiple sclerosis (MS). (A) The areas measured are marked in an image of the fundus: The retinal nerve fibre layer (RNFL) was measured in a circular scan centred on the optic disc. Macular thickness and volume were measured in volumetric scans around the macula, divided into central and peripheral quadrants and the central macula. Manual segmentation of retinal layers was performed in a horizontal scan through the centre of the fovea.Scatter plots display the thickness of the RNFL (B and D) and the total macular thickness (C and E) in all study subject eyes (B and C), and in those without a history of optic neuritis (HON) (D and E). Each point represents the mean of one patient’s two eyes. The mean of all patients is indicated by a horizontal bar. A significant difference from the control group is indicated by asterisks (p<0.05, ANOVA and Dunnett’s post-hoc test) and a significant difference between patient groups, by horizontal bars (p<0.05, ANOVA and Tukey’s post-hoc test).
While the results of the RNFL and paramacular volumetric measurements were automatically segmented, the segmentation of the different retinal layers in the single horizontal foveal scans was performed manually by repositioning of the measurement lines (white dotted lines in Figure 2) on the borders between the different layers. The thickness of the different layers was measured at the thickest point nasally and temporally of the macula, using Heidelberg Eye Explorer software (Figure 1).
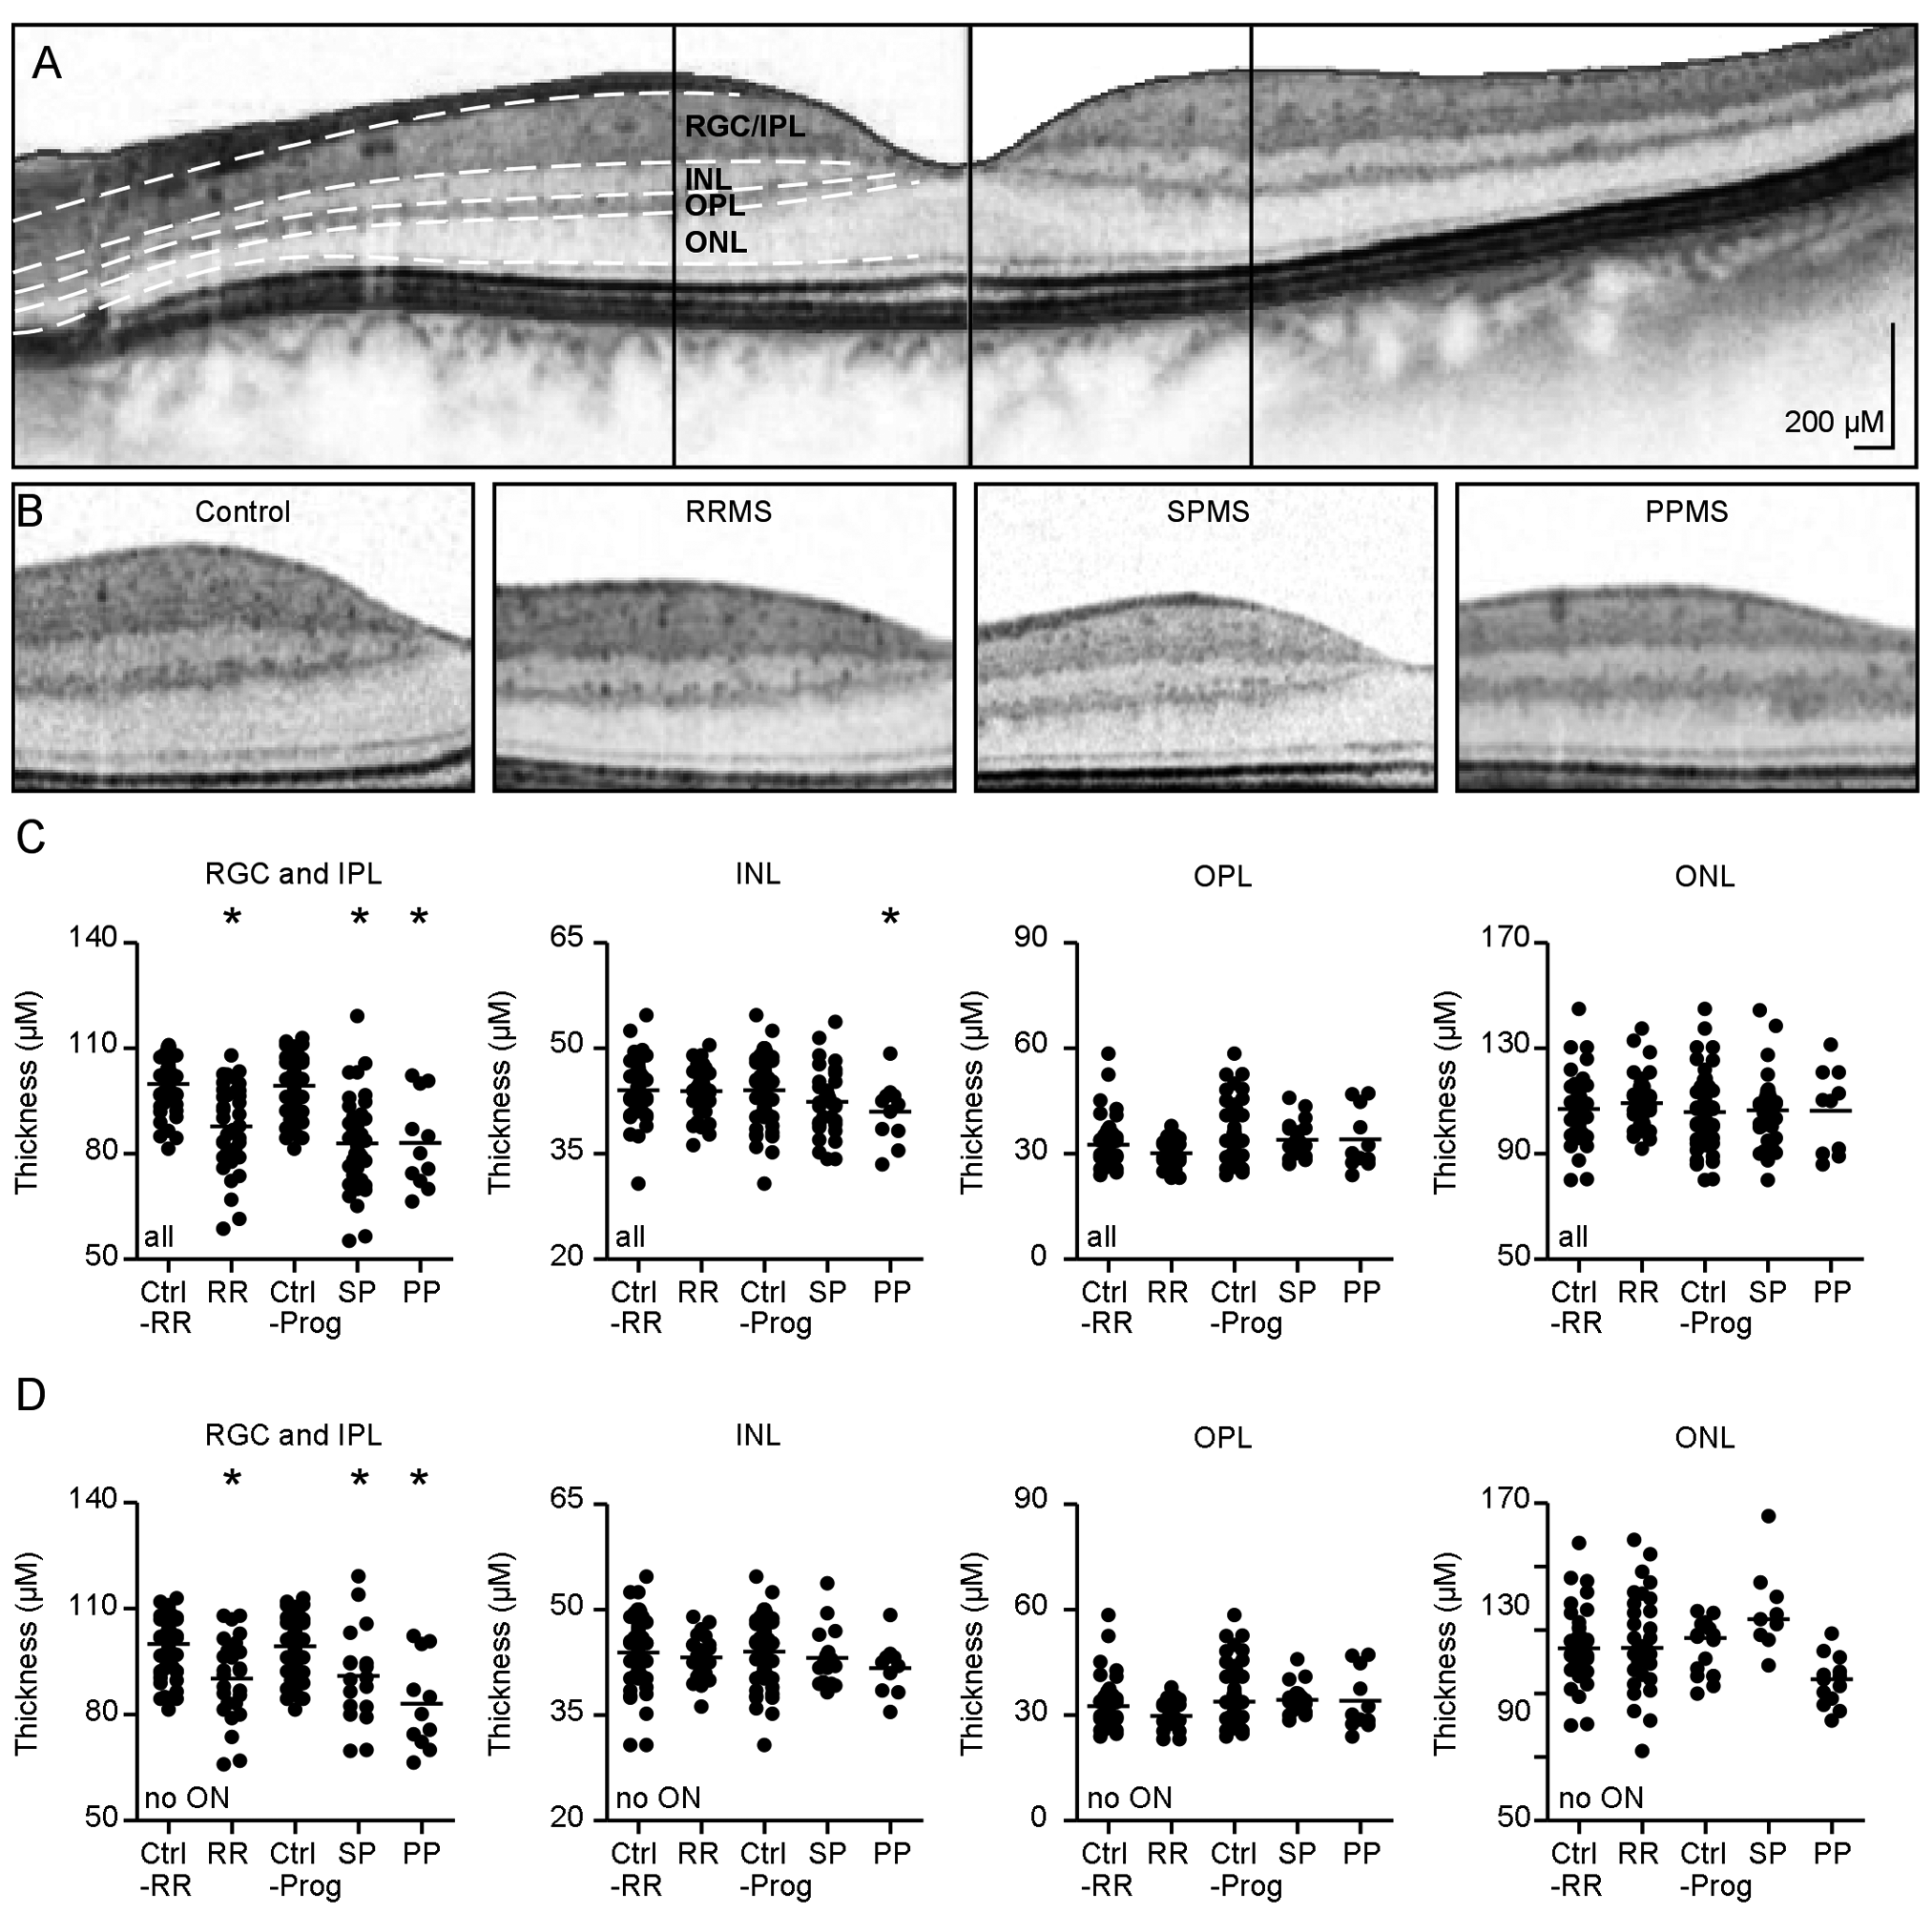
Manual segmentation of the parafoveal retinal layers (A and B). The segmentation of the different retinal layers was performed manually in single horizontal foveal scans. The images are displayed as negatives to better differentiate the different layers. (A) A typical foveal scan. After manual segmentation, retinal layers are divided by white dotted lines. The thickness of all layers was measured at the vertical lines indicating the thickest point nasally and temporally of the fovea, except for the outer nuclear layer (ONL), which was measured centrally along the vertical line. (B) Sections of a control and of representatives of the subgroups of MS patients: relapsing–remitting MS (RRMS), secondary progressive MS (SPMS) and primary progressive MS (PPMS). (C and D) Scatter plots of the mean thickness of all retinal layers. Each point represents the mean of one patient’s two eyes. A horizontal bar indicates the mean of all patients. A significant difference from the control group is indicated by asterisks (p<0.05, ANOVA and Dunnett’s post-hoc test), while a significant difference between the patient groups is shown by horizontal bars (p<0.05, ANOVA and Tukey’s post-hoc test). (C) Results from all eyes, for the different study groups; (D) only the results for eyes without HON are shown.
As in most subjects, our patients’ outer nuclear layer (ONL) presented only one central thickest point, rather than several nasal and temporal peaks as is normally seen in the other layers; therefore, we used the thickness at this ONL central point in our analysis (Figure 2). For the few subjects having a nasal and a temporal maximum of thickness, we used the higher value.
To assure test-retest reliability of the manual segmentation method, we first examined 19 subjects twice and the results for each layer were compared (Bland Altman method). We found that the test-retest reliability of the manual segmentation method was excellent for the RGC+IPL and ONL, with a Bland Altman bias (BAB) of 1.2 +/– 3.5% and 0.2 +/– 5.9% respectively; while reliability was good for the OPL and INL, with a BAB of −2.8 +/– 8.8% and BAB of 0.007 +/– 7.7%, respectively.
Statistical evaluation
Statistical analysis was done with Prism 5.0 (Graphpad), following data preparation within Microsoft Excel. Both eyes of each subject were included in the analysis as statistically dependent duplicates. Because our cohorts of PPMS and SPMS patients and the controls were significantly older than our RRMS patients, we excluded all controls older than 55 years (thus 30 controls were excluded) to obtain an age match with the RRMS cohort, whereas SPMS and PPMS patients were compared to all the controls. The mean sex ratio of MS patients in the subgroups and controls did not differ: it was 65% female.
For comparison of the eyes of MS patients with and without HON, the differences between one unaffected eye and one eye with HON in the same subject were taken into account, as these same-patient eyes were considered statistically independent due to the HON. In contrast, for our subjects with HON or without HON in both eyes, both were analysed together as statistically dependent duplicates. Parametric tests were used for statistical comparison, as all datasets were found to be normally distributed (via De Agostino and Pearson omnibus normality test). Analysis of variance (ANOVA) was performed using Dunnett’s multiple comparison post-hoc test to compare all groups to controls, but Tukey’s multiple comparison post-hoc test for the comparison between all pairs of columns. Student’s t test was used to compare eyes with and without HON. Any p values below 0.05 were considered significant.
Results
The mean age of the entire cohort of controls was 47.4 years. For the RRMS control subgroup, without controls over 55 years of age, the mean age was 38.2 years. Our RRMS patients had a mean age of 37.1, SPMS of 48.9 and PPMS of 50.3 years. The differences in age between these patient groups and their respective controls were not significant.
The peripapillary RNFL, the paramacular thickness and volume, and the thickness of the different retinal layers were measured as illustrated in Figure 1A. The mean peripapillary RNFL and mean paramacular thickness of all MS subgroups were found to be thinner compared to their respective controls (Figure 1, B and C). These differences remained significant only when eyes without HON were taken into account (Figure 1, D and E), indicating a retinal degeneration that is independent of HON, as was shown previously. 28
Due to the high resolution of the latest generation spectral domain OCT device used here, identification of the different retinal layers was possible in transfoveal scans. We manually segmented retinal layers in high-resolution horizontal scans through the middle of the fovea (Figure 2A) and measured the thickness of the different layers, as indicated (Figure 2B).
The thickness of the retinal ganglion cell and inner plexiform layer (RGC+IPL) was significantly reduced in all groups of MS patients, as compared to their respective controls (Figure 2C). As with the peripapillary RNFL, a significant thinning in all patient subgroups was also observed specifically in those eyes without history nor signs of previous HON (Figure 2D).
The thickness of the INL was significantly reduced only in PPMS (Figure 2C). When analysing only the eyes of PPMS patients who reported no HON, we found that this reduction was no longer significant (Figure 2D). We observed no significant changes of the OPL (Figure 2, C and D) or ONL (Figure 2, C and D) in any of the MS groups. The results of all retinal parameters for the different MS subtypes and controls are summarized in table 1.
A comparison of MS-patients’ eyes with and without HON revealed that there were significant reductions of the peripapillary RNFL, macular thickness and RGC+IPL in eyes with HON (Figure 3, A–C); while no influence of HON was observed in the INL, OPL and ONL (Figure 3, D–F). The mean reduction in eyes with HON compared to MS eyes without HON was 7.5 µm for the RNFL, 9 µm for the mean macular thickness, and 7.5 µm for the RGC+IPL.
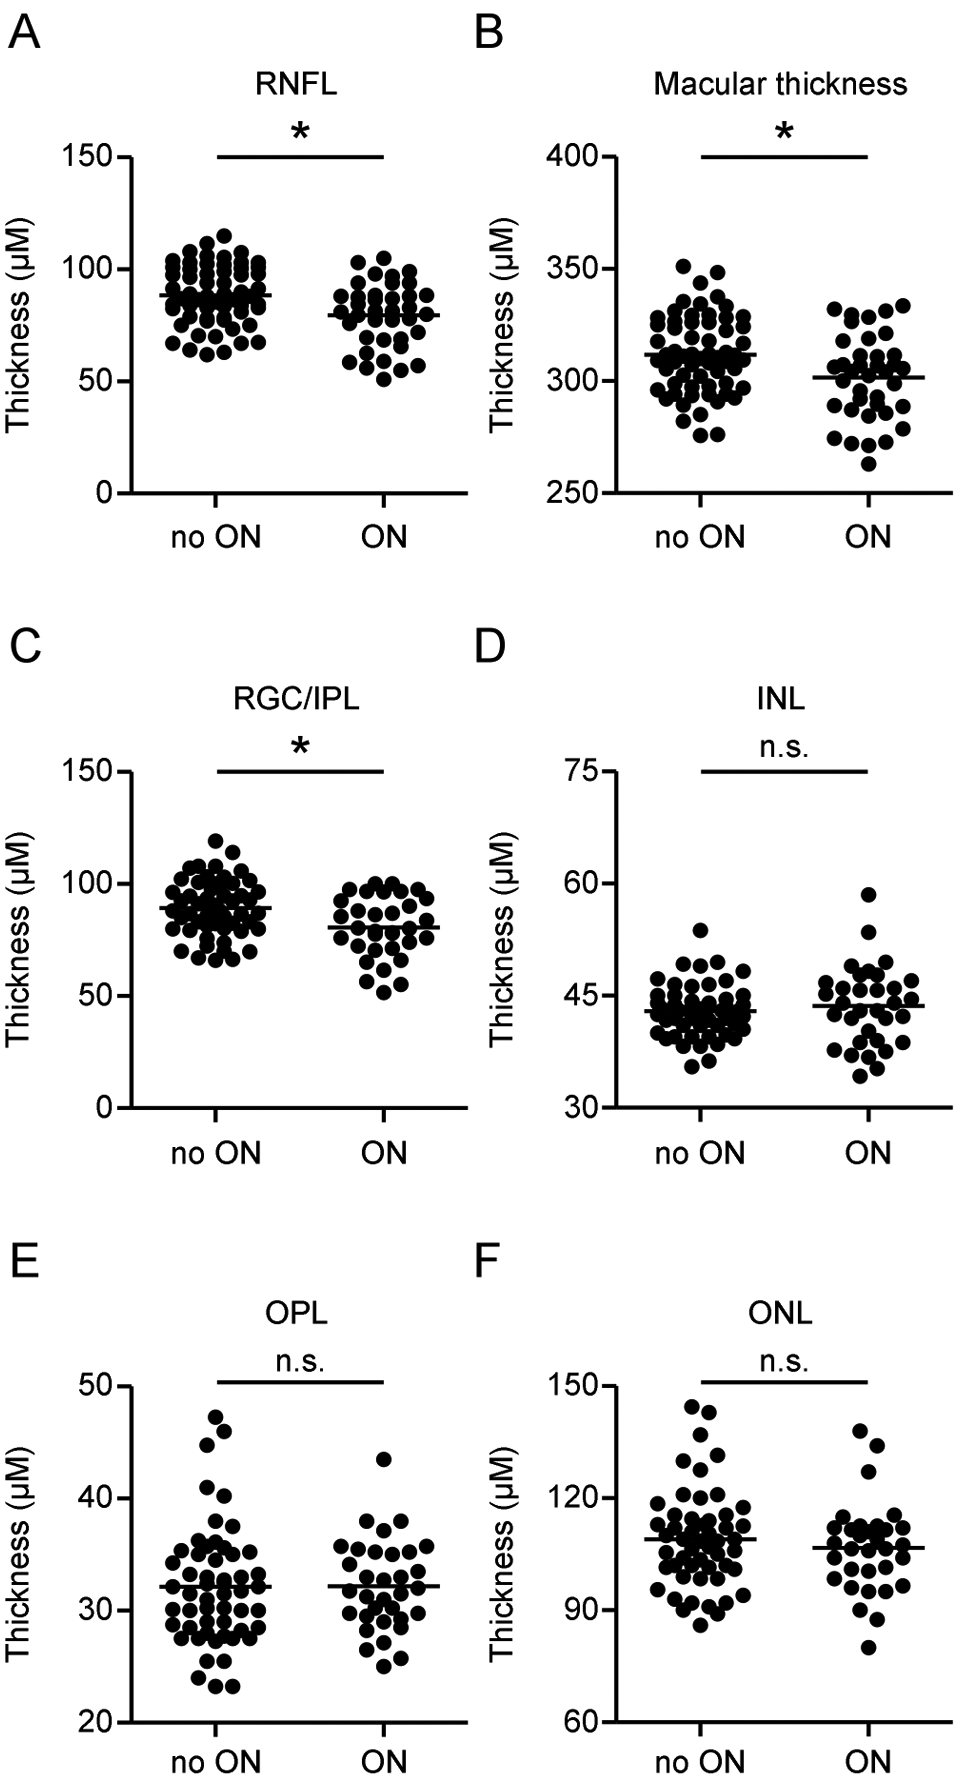
Effect of history of optic neuritis (HON). (A–F) The thickness of all retinal layers in eyes from all multiple sclerosis (MS) subgroups is compared between eyes with and without HON. Each point represents the mean of two eyes of one patient. The mean of all patients is indicated by a horizontal bar. Significant differences are indicated by asterisks (p<0.05, t-test). MS subgroups: relapsing–remitting MS (RRMS), secondary progressive MS (SPMS) and primary progressive MS (PPMS).
We observed significant correlations between the mean RNFL-, macular-, and OPL- thicknesses with the clinical status of MS patients measured as EDSS (R= -0.36, R= -0.35 and R= 0.33, respectively; all p<0.05, Spearman; see Figure 5A). These correlations were still significant when only the eyes without HON were taken into account (R= -0.36, R= -0.35, and R= 0.33 respectively; all p<0.05, Spearman; see Figure 5B). RNFL and macular thickness showed an inverse correlation, where thinner layers were associated with higher Expanded Disability Status Scale (EDSS) scores. In contrast, the OPL thickness showed a moderately positive correlation, as thicker OPL values were associated with higher EDSS scores (Figure 4).
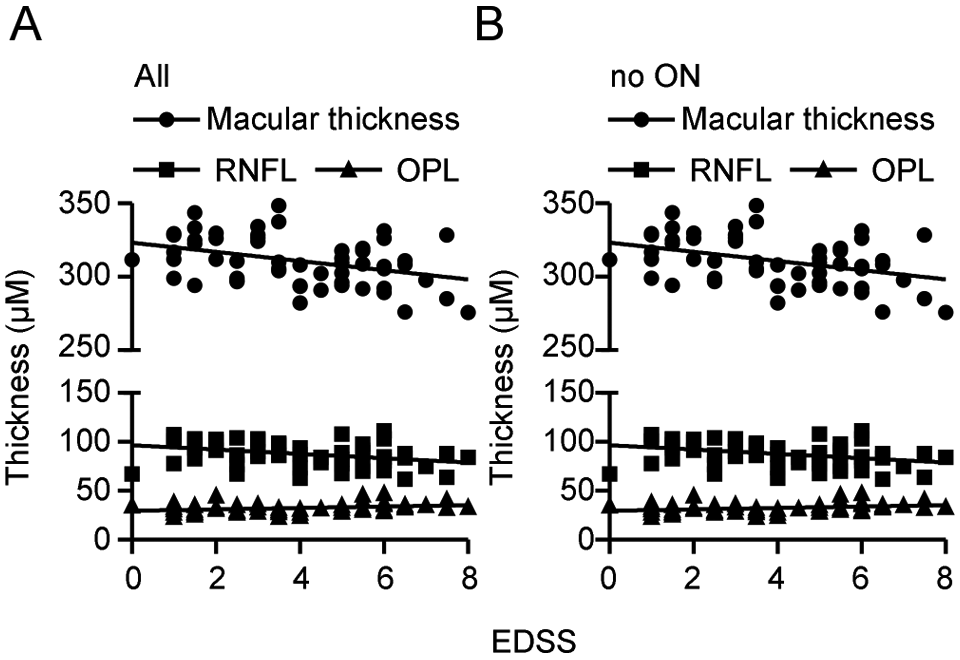
Correlations of Optical Coherence Tomography (OCT) parameters with Expanded Disability Status Scale (EDSS). (A and B) The retinal nerve fibre layer (RNFL), total macular thickness, and outer plexiform layer (OPL) correlate with the clinical status measured as EDSS. Correlations were significant (p<0.05, Spearman) when (A) all eyes were analysed and (B) when only eyes without a history of optic neuritis were taken into account.
Discussion
A large body of evidence exists on thinning of the RNFL and macular thickness in the eyes of patients with MS, both independently of HON and the more pronounced effect as a result of HON. 20 A newer generation of OCT devices with better resolution has now made it possible to assess the deeper retinal layers: The first studies indicate that there is a reduction of the RGC layer in MS. 19,22,23 Thinning of the RNFL and RGC layer can be attributed to consecutive degeneration of the RGCs and their axons following optic neuritis.
We also observed thinning of the RNFL and mean macular thickness, plus we found that there was thinning of the RGC+IPL in MS patient eyes with HON, as compared to eyes without HON. Even in the absence of HON, we found that RNFL, macular thickness and RGC+IPL were thinner in all of the MS subgroups as compared to the normal controls. This could be attributed to subclinical episodes of optic neuritis that were not recognized by the patients, to primary neurodegeneration of the RGCs and their axons in the absence of inflammation, or to retrograde trans-synaptic degeneration of the RGCs and their axons due to MS lesions of the posterior visual pathways. Trans-synaptic RGC degeneration has previously been reported in patients with homonymous hemianopia, due to retrogeniculate lesions. 29,30 None of our MS patients without HON presented a severe hemianopia detectable by finger perimetry, nor did the patients otherwise report experiencing hemianopia.
Because we observed no significant reduction of the INL, OPL and ONL in patients with RRMS and SPMS, we believe that the reductions of the mean macular thickness observed in these patients reflect the thinning of the RNFL and RGC+IPL.
Interestingly, we did observe a significant reduction of the INL thickness specifically in our PPMS patients. This is likely to represent a primary retinal pathology in these PPMS patients, which would be independent of inflammatory events of the optic nerve itself.
In a large study, Saidha et al. (2011) identified a reduction of the INL and ONL, while exhibiting at the same time a normal RGC layer, in a subset of MS patients with predominant macular thinning and normal RNFL. 19 In the same study, the INL and ONL were not found to be altered in MS patients with normal OCT nor with a predominant reduction of the RNFL.
Our set of PPMS patients seems to resemble yet another entity, where RNFL, total macular thickness, RGC+IPL and INL are reduced, yet the ONL remains intact. This finding is in line with a microscopic study by Green et al. (2010), who observed atrophy of the INL mainly in eyes of progressive MS patients, while the degeneration of the RNFL and RGCL was observed in all MS subsets. 25 Further longitudinal prospective studies are already under way: these should reveal whether progressive MS is associated with early degeneration of the INL.
Our data clearly revealed there is an impact of optic neuritis on the thickness of the RGC+IPL and we also reproduced the already well-documented reduction of the RNFL and macular thickness. In our study, a reduction of peripapillary RNFL and macular thickness of 7.5 and 8 µm, respectively, as an apparent consequence of optic neuritis was less pronounced than results of previous studies. 20 This is likely because of our cohort’s rather high percentage of progressive MS patients exhibiting severe retinal degeneration even without HON.
We found that HON had no influence on the deeper retinal layers of our patients, as we observed no changes in INL, OPL or ONL thickness. Apparently, retrograde trans-synaptic degeneration does not play a role in changing the thickness of the deeper retinal layers, as the INL was found to be normal in most of our RRMS and SPMS patients, while the RGC+IPL was significantly thinner.
In concurrence with previous publications, 13 RNFL and macular thickness correlated inversely with the EDSS. Interestingly, in our study, OPL thickness correlated positively with the EDSS, meaning that a more severe clinical manifestation of disease was associated with having a thicker OPL. It is possible that the thickening of this layer, where rods and cones make synaptic contacts with bipolar and horizontal cells, is caused by reorganization processes that occur after degeneration of the other retinal layers. At the same time, we observed no influence of HON on OPL thickness, so OPL thickness was not thicker in any of our different MS subgroups, when compared to controls. It appeared that in our patients the OPL thickness reflects MS disease severity, irrespective of optic neuritis nor MS subtype.
We conclude, besides confirming the well-known reduction of RFNL and macular thickness, that MS with optic neuritis and to a lesser degree MS without HON lead to an appreciable degeneration of the RGC+IPL in all MS subgroups. In addition, our PPMS patients showed a reduction of the INL that was independent of optic neuritis and seemed to represent a primary retinal pathology. The only significant correlations that we found between disease severity and retinal layer thickness were related to the RNFL and the macular thickness in a negative correlation; while for OPL thickness, we observed a positive correlation.
Footnotes
Acknowledgements
The authors are grateful to E Cohn, a technician at the Department of Neurology of the Heinrich Heine University in Düsseldorf, for her great technical help supporting this study. The MS center at the Heinrich-Heine-University is supported by the Walter-and-Ilse-Rose-Stiftung, the Eugène Devic European Network (EU-FP7), and the German Ministry for Education and Research (KKNMS-BMBF).
Funding statement
This research received no specific grant from any funding agency in the public, commercial, or not-for-profit sectors.
Conflict of interest statement
None declared.