
Abstract
Background:
Although a more favorable course of multiple sclerosis is associated with a low degree of cortical pathology, only longitudinal studies could definitely confirm this association.
Materials and Methods:
We followed 95 early relapsing–remitting MS (RRMS; median Expanded Disability Status Scale (EDSS) = 1.5, mean disease duration = 3.1 ± 1.3 years) and 45 benign MS patients (EDSS ≤ 3.0, disease duration ≥ 15 years, normal cognition) for 6 years, with EDSS evaluations every 6 months and brain magnetic resonance imaging (MRI) at baseline and then yearly.
Results:
At baseline, we detected 406 cortical lesions (CLs) in 67/95 (70.5%) early RRMS and in 24/45 (53.3%) benign MS patients (p = 0.046). After 6 years, the appearance of new CLs was observed in 80/95 (84.2%; 518 CLs) of our early RRMS and in 25/45 (55.5%; 63 CLs; p < 0.001) benign MS patients. At baseline, after corrections for age and disease duration, we observed a cortical thinning of several frontal and temporal regions in our RRMS study patients, compared to the benign MS patients (p ranging between 0.001–0.05). After 6 years, the cortical thinning had increased significantly in several cortices of RRMS patients, but only in the occipital-temporal (p = 0.036) and superior parietal gyrus (p = 0.035) of those with benign MS. Stepwise regression analysis revealed the CL volume (p = 0.006) and the cortical thickness of the temporal middle (p < 0.001), insular long (p < 0.001), superior frontal (p < 0.001) and middle frontal gyri (p < 0.001) as the most sensitive independent predictors of a favorable disease course.
Conclusions:
Our data confirmed that a significantly milder cortical pathology characterizes the most favorable clinical course of MS. Measures of focal and diffuse grey matter should be combined to increase the accuracy in the identification of a benign MS course.
Keywords
Introduction
The existence of a benign form of multiple sclerosis (MS) is still debated. 1,2 As a matter of fact, a portion of relapse-onset MS has a relatively favorable course, characterized by rare relapses and very slow accumulation of physical and/or cognitive disability. 1,2 The factors that determine a milder MS course are unknown and the early identification of the patients affected from the so-called benign MS is still a challenge. Magnetic resonance imaging (MRI) of the white matter (WM) has been largely used in the search to identify possible prognostic markers, but results have been contradictory and inconclusive. 3 –7 On the other hand, several recent observations indicate that the pathology occurring in the cortex is the possible substratum of clinical disability and disease progression; 8 –10 however, only longitudinal prospective studies may help to depict the relationship between the heterogeneous course of MS and the pathological process taking place in the cortex. Here we present the results of the 6-year extension of our previous 1-year prospective longitudinal study on the evolution of cortical pathology in a group of MS subjects with a relatively mild disease evolution (i.e. the so-called benign MS, having >15 years of disease duration and an Expanded Disability Status Scale (EDSS) ≤ 3), in comparison with that of a group of relapsing–remitting MS (RRMS) patients moving from earlier to later stages of disease. 11 The aim of the study was to obtain further information on the relationship between cortical pathology and the ”benign” disease course.
Methods
Study population
In the period between June 2005 and June 2006, we enrolled two groups of MS patients in a longitudinal, prospective, clinical and neuroradiological study:
One group, representing those currently defined as having benign MS, were 48 consecutive relapse-onset MS patients having at least 15 years of disease duration, an EDSS 12 score ≤ 3.0 and normal cognition on the Rao’s Brief Repeatable Battery (BRB) Neuropsychological Test, version A. 13,14
A second group consisting of 96 consecutive early RRMS patients, defined by having ≤ 5 years of disease duration and an EDSS score ≤ 3.0.
Our diagnosis was achieved in agreement with the clinical and magnetic resonance (MR) criteria for MS that were available in early 2005. 15 Our study consisted of programmed neurological examination (by EDSS) every 6 months, and in case of a relapse, as well as a complete MR examination (including sequences for grey matter analysis) at study entry (T0), after 6 years (T6) (range = 72 + 2 months) and in each case of relapse.
Patients were considered clinically worsened if they had an EDSS increase of at least 1.0 point, confirmed at 1 year in the absence of relapses. All patients had to be relapse- and steroid-free for at least 1 month before the MRI examination. We treated 24 benign MS and 91 RRMS patients with immunomodulatory agents at study entry. The neuropsychological assessment was performed at T0 and T6 by a neuropsychologist whom was blinded to both clinical and MR results, using the Rao’s BRB of Neuropsychological Test, version A. 13 The local ethics committee approved the study and informed consent was obtained from all patients.
Image acquisition protocol
All images were acquired using a 1.5 T scanner (Achieva, Philips Medical Systems, Best, The Netherlands) with a 33 mT/m power gradient and a 16-channel head coil. No major hardware upgrades of the scanner occurred during the study period and bimonthly quality assurance sessions took place, to guarantee measurement stability. The following images were acquired from each subject:
Double inversion recovery (DIR): repetition time (TR) = 15,631 msec, echo time (TE) = 25 msec, inversion time (TI) = 3400 msec, delay = 325 msec, echo train length (ETL) = 17, slice thickness = 3mm, Gap = 0, a matrix size = 130 × 256 and a field of view (FOV) = 250 × 200 mm. 2
Fluid-attenuated inversion recovery (FLAIR): TR = 10,000 msec, TE = 120 msec, TI = 2500 msec, ETL = 23, with slice thickness = 3mm, Gap = 0, a matrix size = 172 × 288, and a FOV = 250 × 200 mm. 2
Three volumetric fast-field echo (FFE) sequence: 120 contiguous axial slices, TR = 25 msec, TE = 4.6 msec, flip angle = 30°, slice thickness = 1.2 mm, matrix size = 256 × 256, and a FOV = 250 × 250 mm. 2 The last FFE was acquired 5 minutes after gadolinium-EDTA (0.1 mmol/kg) intravenous administration.
All MRI examinations were performed at least 1 month after the last relapse. Upon follow-up, the subjects were carefully repositioned according to published guidelines for executing serial MRI studies of MS. 16
Image analysis
Cortical lesion number and volume
All the images were assessed by consensus of two experienced observers, who were blinded to the patients’ identity. At T0 and T6, the number of CLs and the number of new CLs were assessed on DIR images (Figure 1), following the recent recommendations for CL scoring in patients with MS. 17 The CL volume was calculated at baseline and after 6 years, using a semiautomatic thresholding technique based on the Fuzzy C-mean algorithm 18,19 that is included in Medical Images Processing, Analysis and Visualization (MIPAV) (http://mipav.cit.nih.gov) software, developed at the National Institutes of Health. Finally, ΔCLs volume was calculated (CLs volume at follow up – CLs volume at baseline).
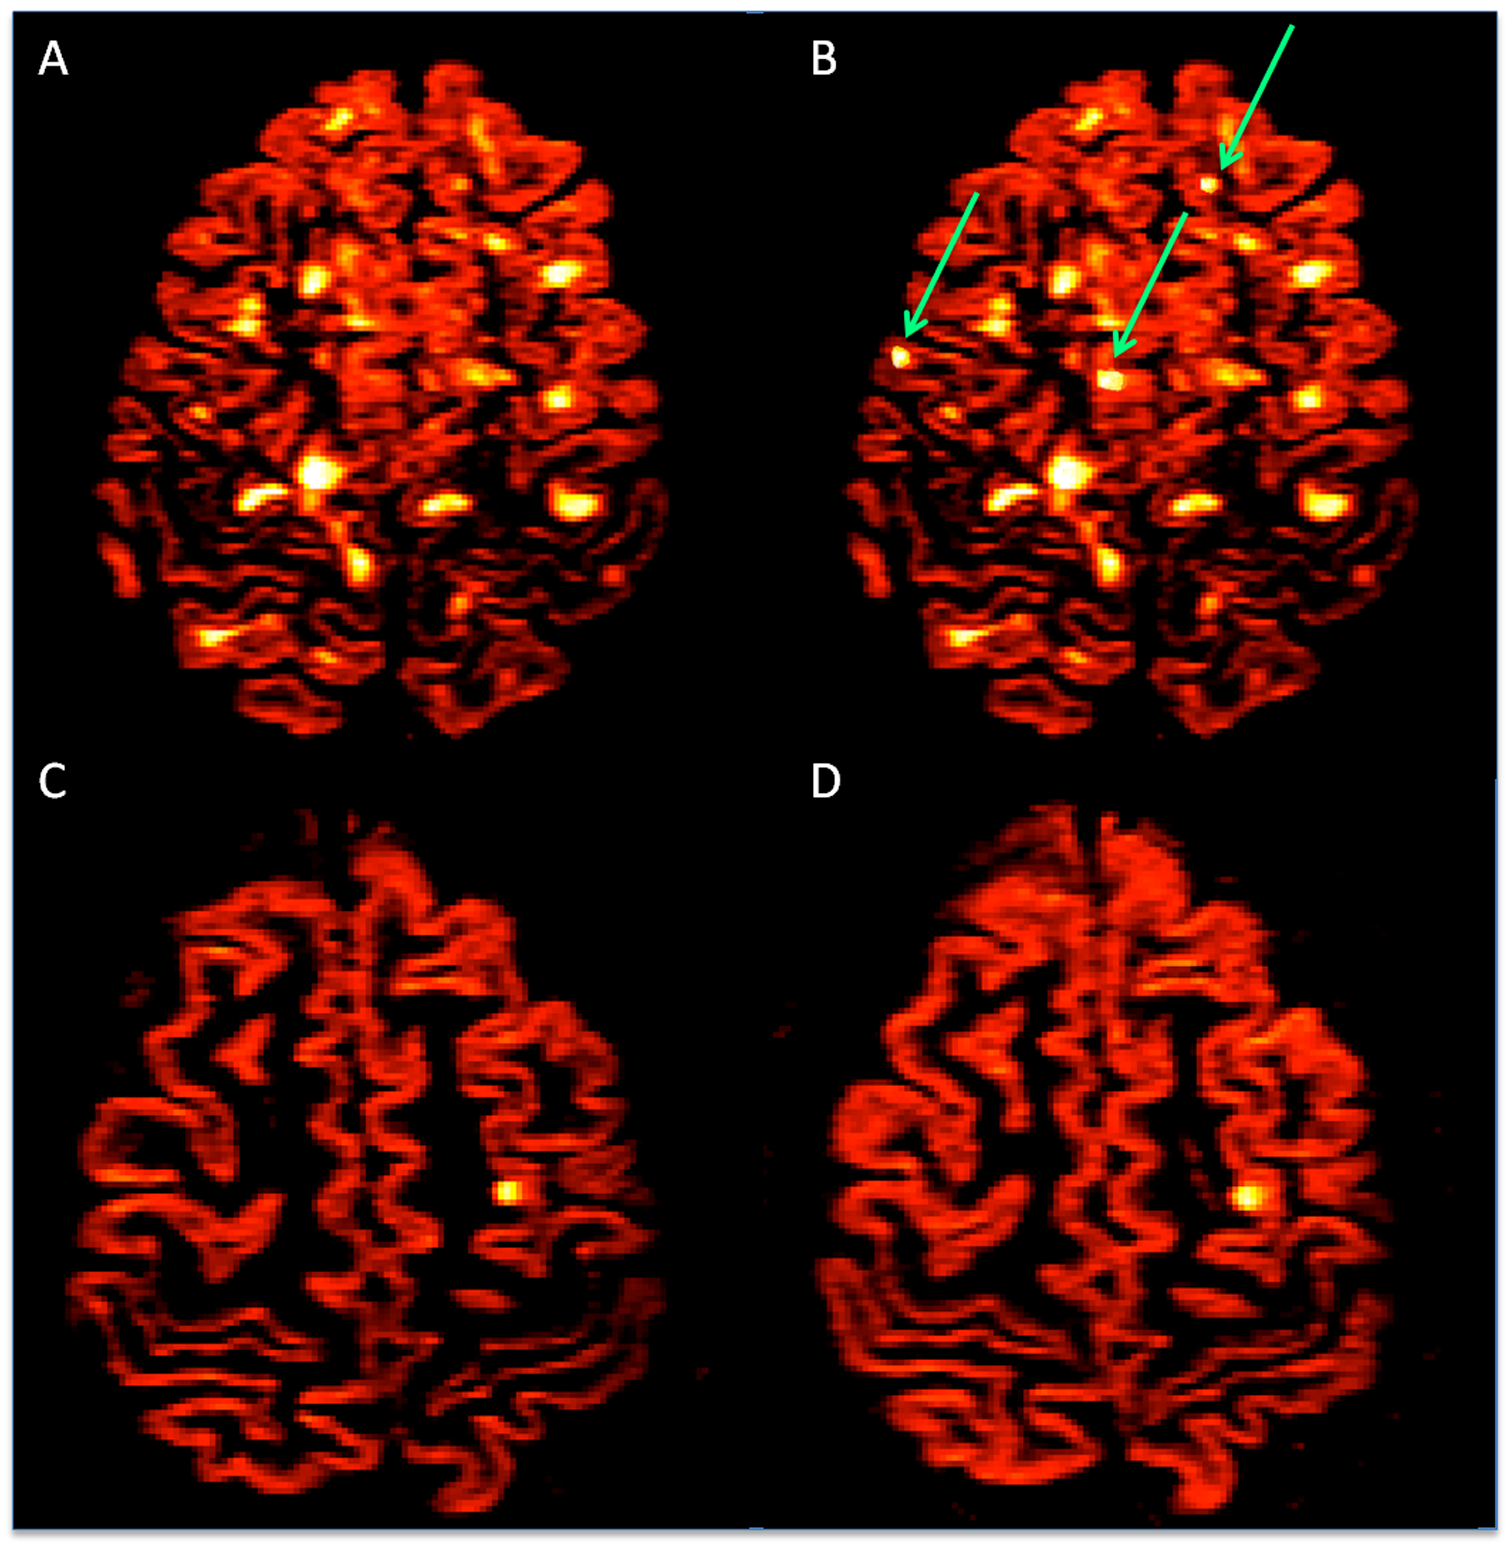
Representative axial DIR images of CLs (the red color) in a RRMS patient ((a) and (b)), and a benign MS individual ((c) and (d)), at baseline ((a), (c)) and after 6 years ((b), (d)). Arrows indicate new CLs that appeared during the follow-up. The number and volume of CLs were clearly higher in RRMS.
White matter lesion number and volume
The same procedure was applied to FLAIR images, to identify and segment the WM lesions. Thus, we obtained the number of WM lesions and the T2 hyperintense WM lesion volume (T2WMLV) at baseline. At the end of the study, the number of new WM lesion and the Δ-T2WMLV (T2WMLV at T6 – T0) were calculated. Also, we evaluated the number of contrast-enhancing lesions (CEL).
Cortical thickness evaluation
We performed global and regional cortical thickness (CTh) evaluations, as the mean of right and left hemispheres, at T0 and at T6, on the volumetric FFE data sets with the longitudinal stream included in the Freesurfer image analysis suite (release v5.1.0), available online (
Statistical analysis
Between-group differences were assessed using an analysis of variance (ANCOVA), including age and the treatment status as a covariate. A t-test with Bonferroni’s correction was applied on regional CTh variables separately, to test differences between patient groups. Pearson Chi Square was applied to test the association between WM lesions, new WM lesions, CLs and new CLs with benign MS.
A general linear model was applied to evaluate the relationship of all MR parameters at baseline (T2WMLV, CEL number, CLs number, CLs volume, global CTh and the CTh of the separate cortical areas) as well as age, considered as independent variables, and the Benign MS course as a dependent variable (disease phenotype, binary). An automatic model selection procedure (stepwise regression) was adopted, to help choose the best variables combination.
A second, general linear model was applied to evaluate the relationship of all MR parameters at T6, considered as independent variables, and the Benign MS course (binary) as a dependent variable. Leave-one-out cross-validation prediction error for GLMs was applied, in order to estimate the goodness of the model, i.e. the GLM was fit to data omitting one patient at a time, then the predicted response for the omitted patient was compared to the observed one and the error rate was estimated.
The prediction capability of the estimated model (goodness of fit) is given by the error rate of classifying the patient. All statistical analyses were performed using SPSS version18 and R, a statistical package available at
Results
Clinical findings
One RRMS patient moved to another city and did not conclude the follow-up; 74/96 (77%) RRMS and 13/48 (27%) benign MS patients (p < 0.001) experienced at least one clinical relapse during the study. Among these, 51 RRMS and 11 benign MS experienced EDSS worsening. At the end of the follow-up period, 3/48 (6.2%) of those with benign MS had an EDSS score > 3.0. Thus, applying a “more restricted” definition of benign, we included in the final analysis 45 benign MS patients having an EDSS ≤ 3.0 after 20 years of disease duration and compared them with 95 RRMS (Table 1 ). None of these 45 benign MS patient showed cognitive impairment at follow-up (Table 2). All relapses were treated with 1g/day methylprednisolone for 5 days.
Clinical and MRI parameters in the eRRMS and benign MS patients at study entry.
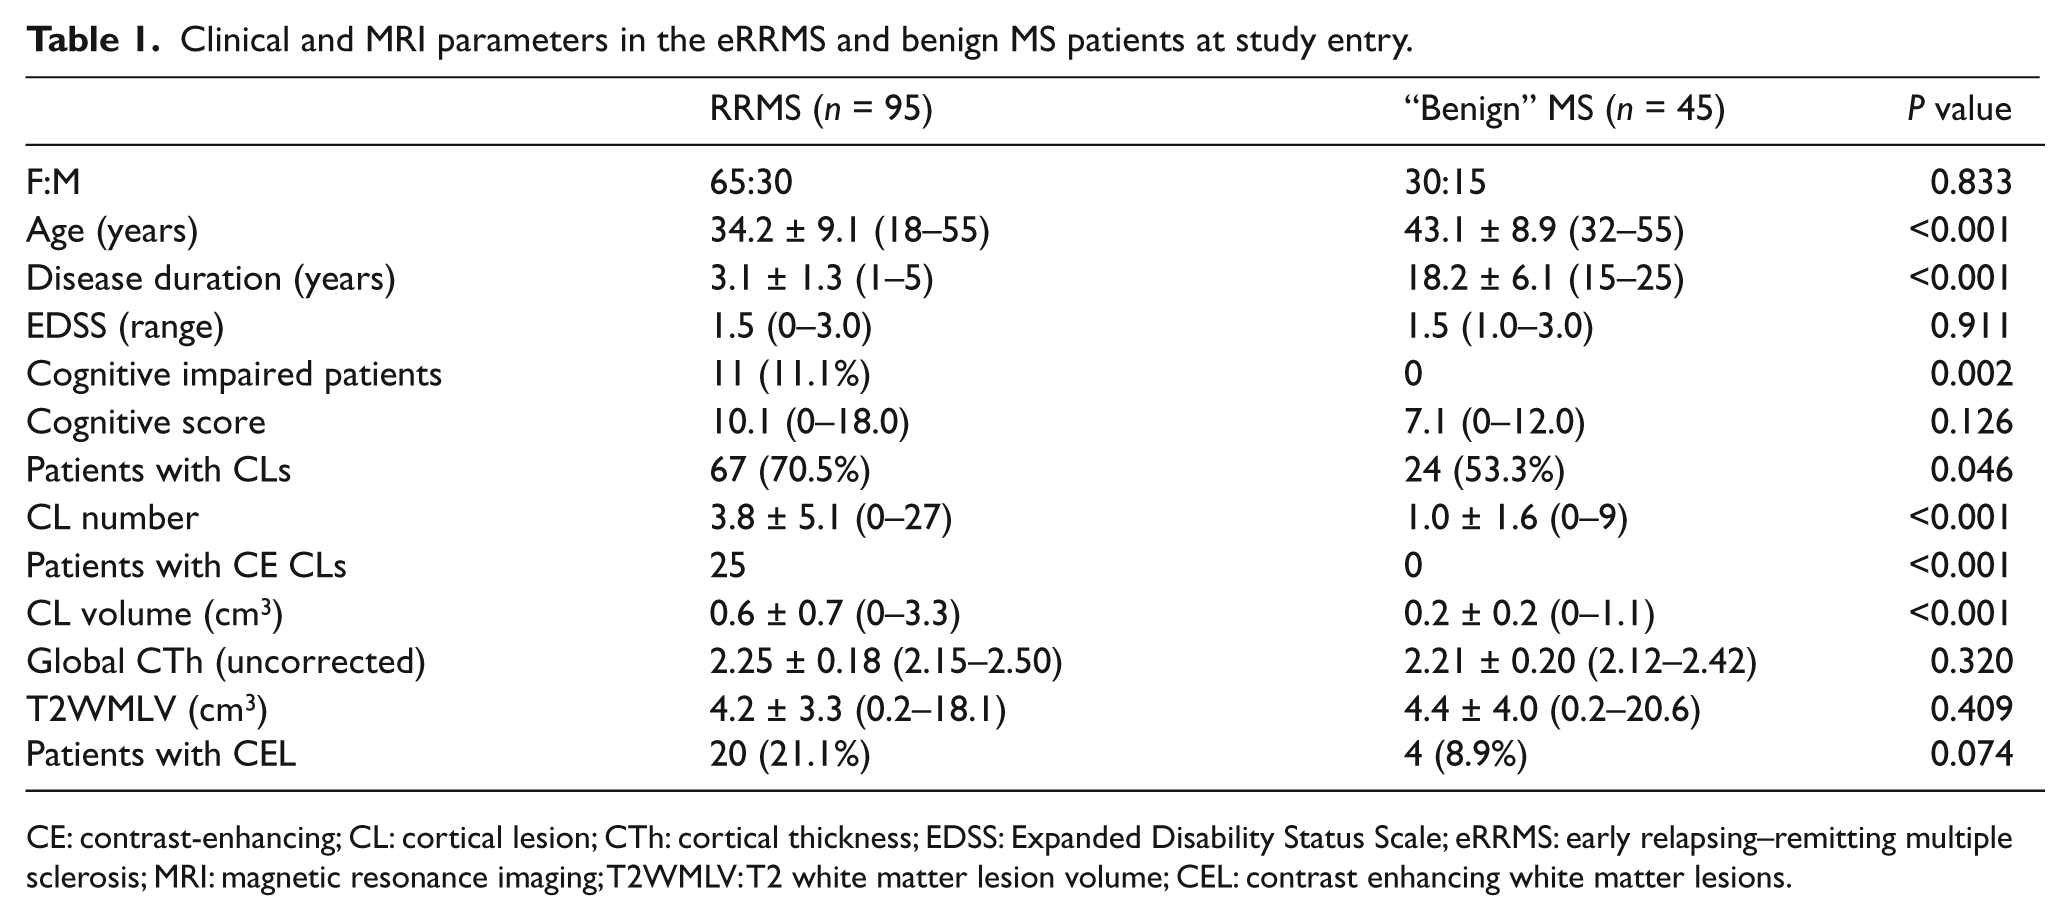
CE: contrast-enhancing; CL: cortical lesion; CTh: cortical thickness; EDSS: Expanded Disability Status Scale; eRRMS: early relapsing–remitting multiple sclerosis; MRI: magnetic resonance imaging; T2WMLV: T2 white matter lesion volume; CEL: contrast enhancing white matter lesions.
Clinical and MR parameters after 6-year follow-up.
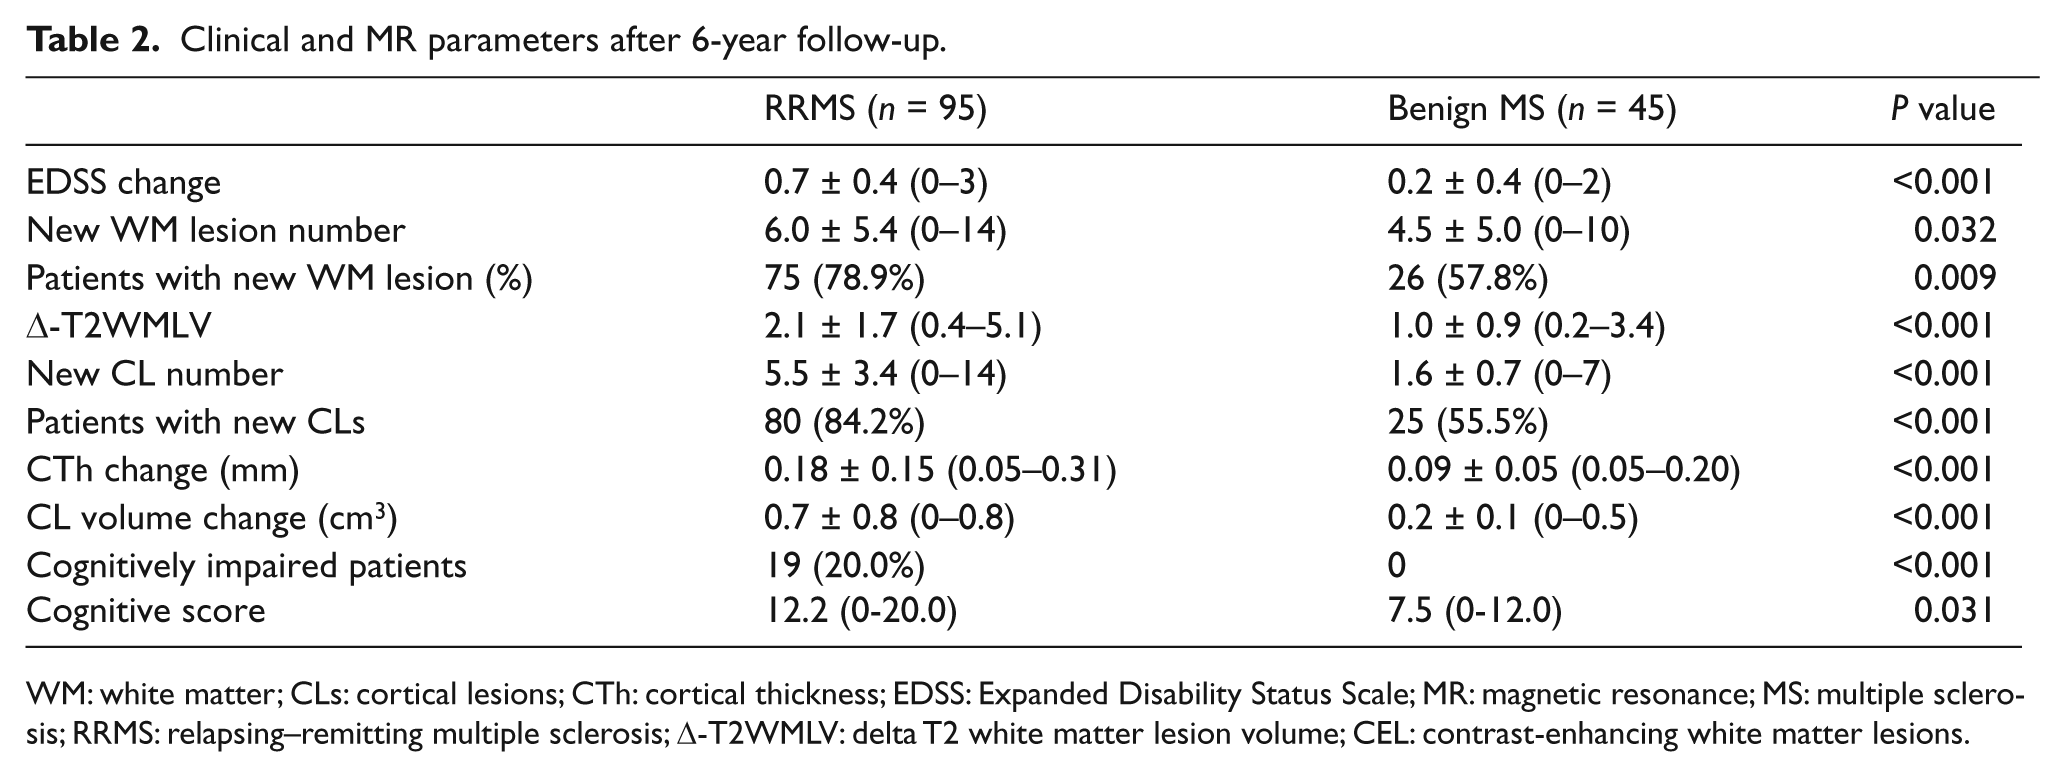
WM: white matter; CLs: cortical lesions; CTh: cortical thickness; EDSS: Expanded Disability Status Scale; MR: magnetic resonance; MS: multiple sclerosis; RRMS: relapsing–remitting multiple sclerosis; Δ-T2WMLV: delta T2 white matter lesion volume; CEL: contrast-enhancing white matter lesions.
MR imaging findings
Cortical lesions
Table 1 and Table 2 report the number and volume of CLs at baseline and follow-up of the patients that concluded the study. At study entry, 406 CLs were detected in 67/95 (70.5%) RRMS patients (Figure 1(a)) and 24/45 (53.3%, p = 0.046) benign MS (Figure 1(c)) cases. We found that 32 CLs (all in RRMS patients) were enhanced by gadolinium. At T6, a total of 588 new CLs (518 in RRMS and 70 in benign MS patients) were found in 80/95 (84.2%) RRMS (Figure 1(b)) and 25/45 (55.5%, p < 0.001) benign MS patients (Figure 1(d)). Among these, 25 CLs (24 in RRMS and 1 in benign MS patients) were enhanced by gadolinium. This resulted in a significant increase of both the number and volume of CL between baseline and follow-up, in both groups (p < 0.001). The appearance of new CLs was highly related to the appearance of new WM lesions. Indeed, among the 80 RRMS and the 25 benign MS patients gaining new CLs at T6, 73 (91.3%) and 23 (92.0%) also showed new WM lesions, respectively. However, when only those patients who developed a new WM lesion were considered, the number of new CLs was significantly lower (> 50%) in benign MS (2.5 ± 1.0; range 1–7) than in RRMS (5.4 ± 3.3; range 1–14; p < 0.001).
Cortical thickness (CTh)
Although the global CTh at study entry was significantly lower in benign MS, as compared to RRMS (p < 0.01); after an age and disease duration correction, it became lower in the RRMS patients (mean = 2.20; std. error = 0.22; 95%CI = 2.15–2.24), rather than in those with benign MS (mean = 2.34; std. error = 0.28; 95%CI = 2.26–2.41; p < 0.001). The regional analysis disclosed a significant cortical thinning in several frontal and temporal regions of RRMS patients, as compared to the benign MS patients (p ranging between 0.001–0.05).
At T6, we observed a significant decrease of the global CTh, as compared to T0, in RRMS (p = 0.002), but not in benign MS (p = 0.120) patients and the CTh change was higher in RRMS than in benign MS (p = 0.001; Table 2). Our regional analysis disclosed a significant cortical thinning of the occipital-temporal gyrus (p = 0.036) and of the superior parietal gyrus (p = 0.035) in benign MS, as compared to T0, while a significant thinning was observed in several cortical areas in the RRMS group (p ranging between 0.001–0.05) (See Figure 2 and Table 3).
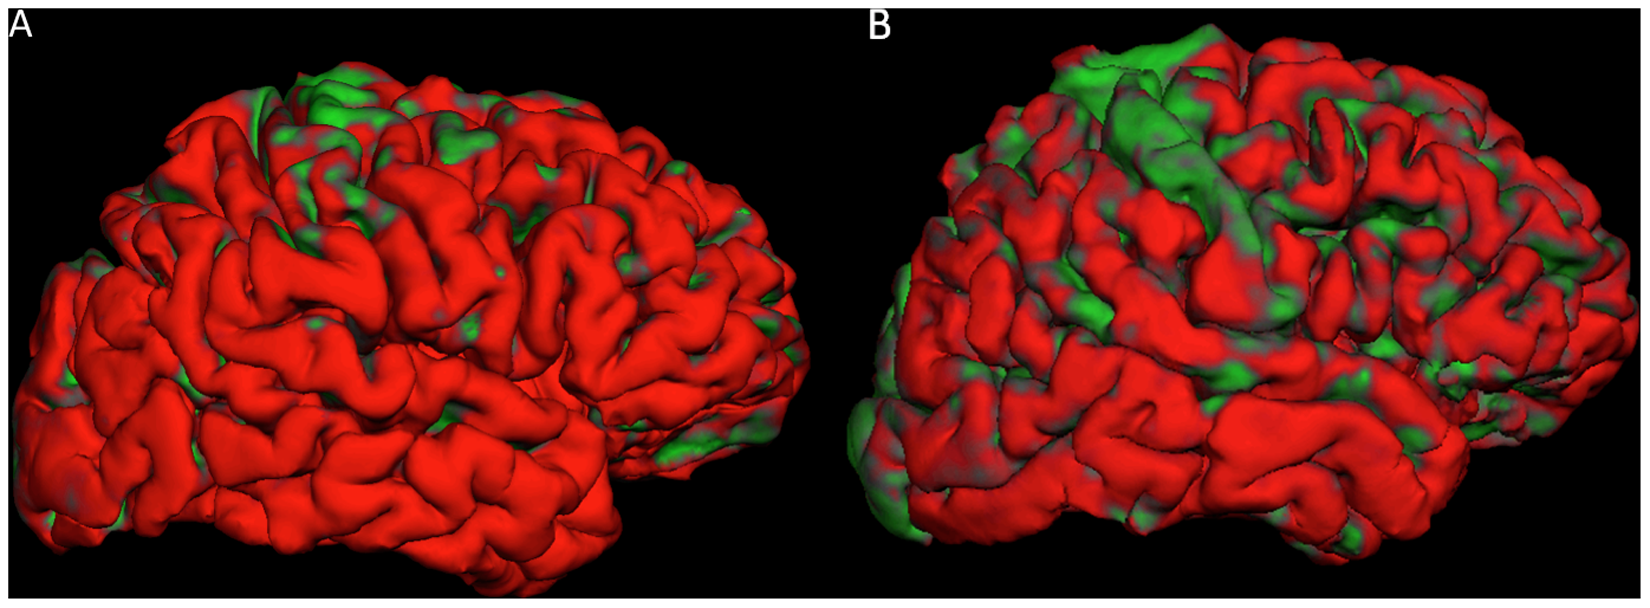
Freesurfer-based 3D reconstruction of the pial surface of a benign MS (A) and a RRMS (B) patients. The cortical areas that resulted significantly (p < 0.05 after Bonferroni correction) thinner at follow up compared to baseline are coloured in green. The progression of cortical thinning was clearly faster in the RRMS than in the benign MS patient.
Cortical thinning of the main regions of the brain in the studied populations.
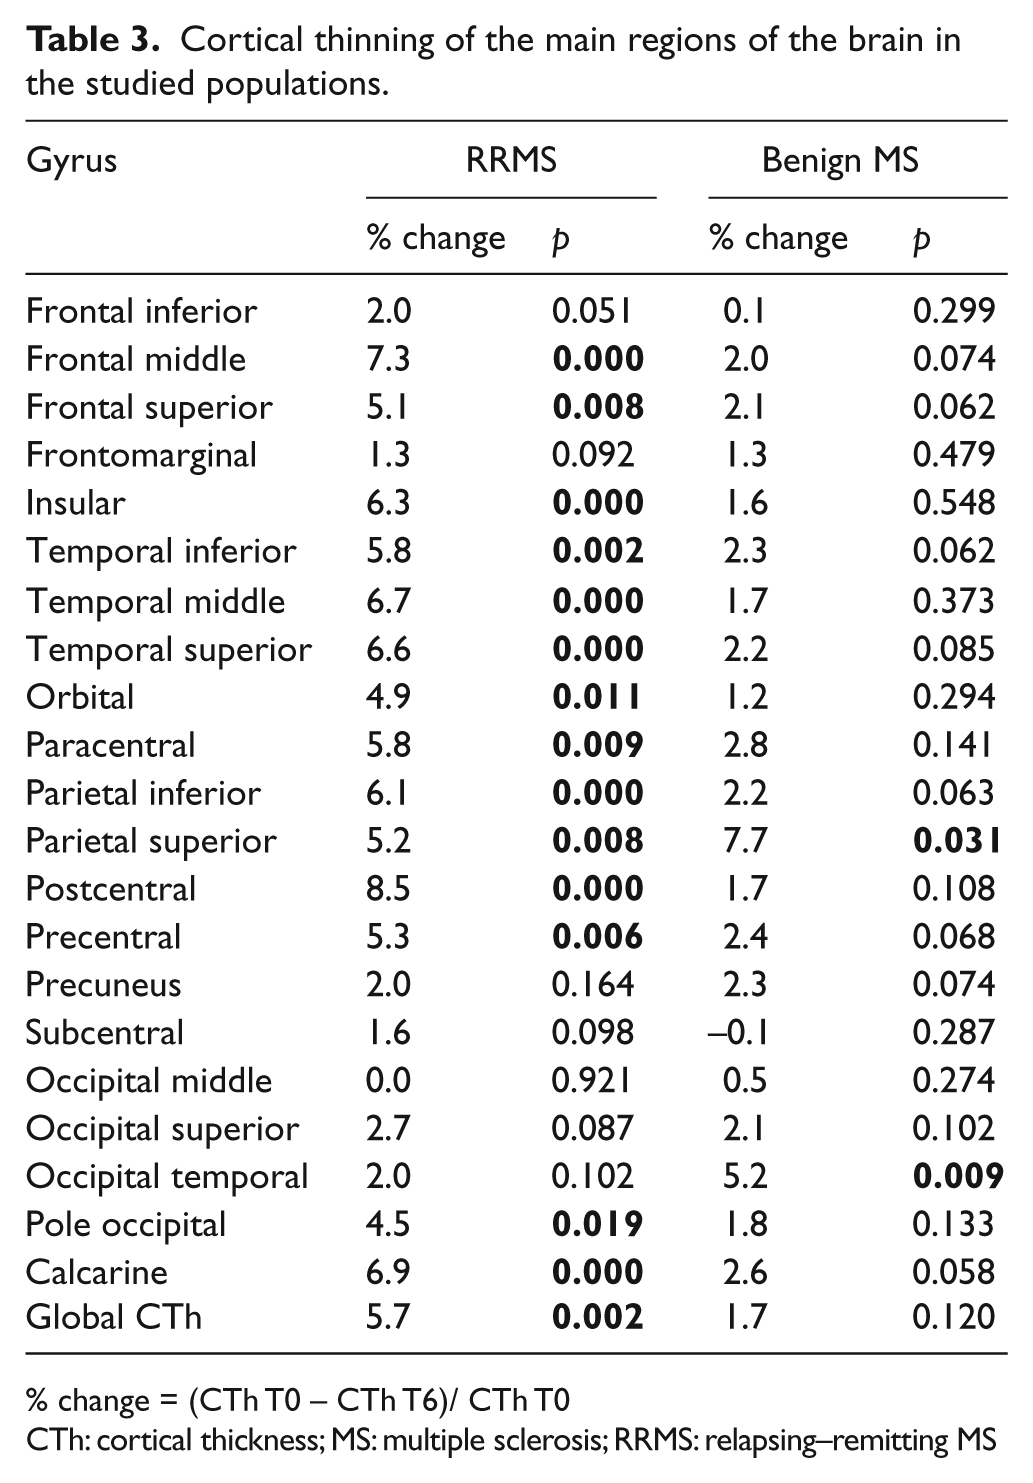
% change = (CTh T0 – CTh T6)/ CTh T0
CTh: cortical thickness; MS: multiple sclerosis; RRMS: relapsing–remitting MS
White matter lesions
Table 1 and Table 2 report the number and volume of WM lesions at T0 and T6. We observed the appearance of new T2 WM lesions in 75/95 (78.9%) RRMS patients and in 26/45 (57.8%) persons with benign MS (p = 0.009). A total number of 775 new WM lesions were scored (570 in RRMS and 205 in benign MS). This resulted in a significantly increased T2-WMLV in both groups, as compared to at study entry (p < 0.001 for both comparisons, Table 2). Moreover, when a calculation was performed considering only the patients who developed new WM lesions during the follow-up, we observed no significant difference in the number of new WM lesions, between RRMS (7.6 ± 4.1; range 1–14) and benign MS (7.8 ± 4.5; range 1–10; p = 0.28).
Multivariate analysis
A stepwise regression analysis of baseline parameters revealed significant contribution from CL volume (p = 0.006), T2WMLV (p = 0.034), and CTh of temporal middle (p < 0.001), insular long (p < 0.001), superior frontal (p < 0.001) and middle frontal gyri (p < 0.001) as independent predictors of the benign course of the disease. The estimated model correctly identified 38/45 (84.4%) of the benign MS and 76/95 (74.7%) of the RRMS patients (sensitivity = 84.4%, specificity = 80.0% and accuracy = 81.4%). The prediction capability of such a model (goodness of fit) can be recovered by the error rate of classifying the patients, which was 18.6%.
When applied to MR parameters at T6, a stepwise regression procedure revealed significant contribution from CL volume (p = 0.001), new CL number (p = 0.008) and the CTh change of insular long (p = 0.003), superior frontal (p < 0.001) and middle frontal gyrus (p < 0.001) as independent predictors of the benign course of the disease. The estimated model correctly identified 39/45 of the benign MS and 82/95 of the RRMS patients (sensitivity = 86.7%, specificity = 86.3% and accuracy = 86.4%). The prediction capability of such a model (goodness of fit) can be recovered by the error rate of classifying patients that was of 13.6%.
Discussion
In line with previous observation, 11,21 our findings confirm that a low cortical lesion burden is a main feature of patients having the benign MS course. Indeed, despite the huge difference in disease duration, the benign MS group was characterized by significantly lower CL number and volume, percentage of patients having CLs and number of gadolinium-enhancing CLs, as compared to the RRMS group. The role played by cortical pathology in determining the heterogeneous course of MS was further stressed by analyzing the increases in the WM lesion and CL load during the follow-up. While the appearance of new CLs was associated to the appearance of new WM lesions in both groups of patients, the comparative increase in CL number and volume was significantly lower in benign MS, even in those patients who had the same rate of WM lesion accumulation compared to RRMS, thus suggesting that the severity of GM involvement rather than WM pathology characterized the benign group. Furthermore, when applied to all MRI parameters (included those at follow-up), the stepwise regression analysis revealed there was a significant association between new CLs, rather than new WM lesions, and the benign course of the disease; thus confirming that a very low rate of CL accumulation is a discriminant characteristic of the benign MS patients. Of course we are aware of the low sensitivity of DIR sequence in detecting focal cortical pathology. Indeed, histological studies have demonstrated that the majority of subpial lesions escape detection when low field MRI is used; 22 however, DIR is the most sensitive MR sequence currently available to demonstrate focal lesions in the cortex 23 and, as is recently described, no histological difference seems to exist between the MR-detectable and -undetectable CLs, 24 and that the tip of the iceberg seems to be highly correlated with its invisible submerged part, thus ensuring there is clinical value for the low-field MRI results. 24
Notwithstanding this, and in order to increase as much as possible our sensitivity in detecting the changes in cortical pathology, we performed a regional and longitudinal analysis of normal-appearing cortical GM. This analysis revealed that there was a more severe and widespread cortical thinning in the RRMS group, as compared to the benign MS group, even at study entry. Indeed, although the CTh of several regions and even the global CTh were lower in benign MS than in RRMS, such differences were tipped over by an age and disease duration correction. This result has been further confirmed by our longitudinal analysis, which showed a significantly faster cortical thinning in several frontal and temporal regions of the RRMS patients, as compared to benign MS patients.
Finally, a multivariate analysis confirmed that CTh of temporal middle, insular long, superior frontal and middle frontal gyri (and its decrease over time) were major predictors of the benign course of the disease. The statistical model used, including the volume of CL and WM lesions at study entry, showed the highest accuracy in predicting a favorable long-term disease course. Although our study did not address the role of microscopic damage in the so-called normal-appearing GM, our current data on the association of a low degree of cortical pathology with a benign disease course were in line with a previous observation that magnetization transfer ratio values of cortical GM are significantly higher in benign MS, compared to RRMS. 25 Moreover, when benign patients were divided in two groups on the basis of their cognitive performance, patients with cognitive preservation again showed they had higher cortical MTR values, and also greater neocortical volume, than those who had cognitive dysfunction (whom in our study would have not been considered “benign”). 26
The definition of benign MS needs a short comment. Although the adjective benign is classically used to define a peculiar form of MS characterized by a low degree of disability after at least 15 years of disease duration, the real existence of benign MS is questioned by the inhomogeneous and often-conflicting literature data. 1,2,27 –32 We agree that the definition of “benign MS” may sometimes be temporary, and that several patients classified as benign may then show a significant physical and/or cognitive decline in later disease stages. 2,33 For this reason, we applied a two-step-based selection process to find our benign MS patients: First, by following a widely-accepted consensus classification, which requires an EDSS score ≤ 3.0 and no cognitive dysfunction, 34 even after a disease duration of at least 15 years; secondly, we excluded those patients whose EDSS increased over 3.0 or whom developed a cognitive dysfunction during the 6-year follow-up. Thus, our benign MS group included only patients having an EDSS score ≤ 3.0 and normal cognition, even after 20 or more years. On the other hand, one may argue that some RRMS patients will likely have a benign clinical and MR evolution. Although this possibility exists, the presence of some benign MS among the RRMS patients would reinforce the significance of our findings.
In summary, we describe evidence of significant cortical sparing in those MS patients whom have the most favorable clinical course. In contrast, patients with a “classical” RRMS disease course accumulate both focal and diffuse cortical damage, which may explain why the majority of them go on to enter the secondary progressive phase of MS. Our data extended the results of a previous 5-year longitudinal study 35 and suggested that the evaluation of GM damage should be combined with that of WM damage, in order to increase the accuracy in identifying any possible favorable courses of MS. Considering that an early and accurate awareness of a benign course can avoid the need to start therapies and limit the associated adverse effects and cost of treatment, our data may constitute an important step forward in the clinical setting, given that the conventional WM MRI metrics and clinical parameters were often found to be misleading in determining the patient’s prognosis and counselling.
Footnotes
Funding
This research has been partly funded by Prog. 3: “Biomarkers and Diagnosis” ISS.17, the University of Padova, Interarea Pr. CPDA 099394, 2009-2010).
Conflict of interest statement
Massimiliano Calabrese received honoraria for speaking from Sanofi Aventis, Merck-Serono and Biogen Idec and funds for travel from Sanofi Aventis and Merck-Serono. Irene Mattisi, Alice Favaretto, Valentina Poretto, Chiara Romualdi and Aldo Morra have nothing to disclose. Francesca Rinaldi received speaker honoraria from Biogen Idec and travel funding from Biogen Idec, Merck Serono, Sanofi-Aventis and Bayer Schering Pharma. Paola Perini received honoraria for speaking from Biogen Idec and funds for travel from Merck-Serono. Paolo Gallo serves on the Scientific Advisory Boards of Biogen Idec, Merck-Serono, Bayer-Shering, Genzyme, Sanofi-Aventis and Novartis; he has received honoraria for speaking and funds for travel from Biogen-Idec Italy, Merck-Serono, Bayer-Shering, Genzyme, Sanofi-Aventis, and Novartis; and he has received research support from Biogen Idec-Italy, Merck-Serono, Bayer-Shering, Sanofi-Aventis, Novartis, and the Italian Ministry of Public Health (2009–2010, Prog. 3: “Biomarkers and Diagnosis” ISS.17, the University of Padova, Interarea Pr. CPDA 099394, 2009-2010).