
Abstract
Background:
People with multiple sclerosis (MS) experience frequent falls, which are associated with impairments and limitations to activities and participations.
Objective:
The objective of this paper is to evaluate falls risk factors using robust clinical measures.
Methods:
A total of 150 individuals (confirmed MS diagnosis, Expanded Disability Status Scale (EDSS) 3.5–6.5) were recruited, with 148 participants included in the final analysis. Demographic data were collected and performance assessed in eight predictor measures (Physiological Profile Assessment (PPA), Brief Ataxia Rating scale, Ashworth scale (Ashworth), Modified Falls Efficacy scale, Symbol Digit Modalities Test, dual-task interference, lying/standing blood pressure, static/dynamic visual acuity). Participants prospectively recorded falls over three months using a daily diary. People were classified as “fallers” based on reports of ≥ two falls.
Results:
A total of 104 participants recorded 672 falls; 78 (52.7%) reported ≥ two falls. Continence issues, previous falls history and use of prescribed medications were each associated with increased risk of being a “faller”. Ashworth and PPA risk score contributed significantly to a logistic regression model predicting faller/non-faller classification. The reduced model (Ashworth, PPA, EDSS) showed fair-to-good predictive ability (ROC c-statistic 0.73, sensitivity 70%, specificity 69%).
Conclusion:
This study confirms the high prevalence of falls in ambulant people with MS. Important potentially modifiable risk factors are identified, suggesting aspects to target in falls interventions.
Introduction
Falls are a significant issue in multiple sclerosis (MS), with research demonstrating more than 50% of people falling in any six-month period. 1 People with MS have an increased risk of osteoporotic fractures, 2 and falls are associated with significant limitations to activities and participations. 3 Guidance recommends further research should be carried out with the aim of reducing falls rate in people with MS. 4
Knowledge of the risk factors for falls in MS is essential to guide the development of an appropriately targeted intervention. Current knowledge relating to specific risk factors for falls in MS is limited. A recent systematic review 5 suggests that use of a walking aid, balance limitations, cognitive impairments and progressive disease sub-type are associated with increased falls risk; however, findings were equivocal for many predictors studied, and other potential risk factors remain under-researched. Issues were also highlighted relating to methodological limitations in many studies, including use of retrospective falls reporting, and lack of a clear definition of a fall in several studies.
We aimed to identify factors associated with increased falls risk in people with MS, using clinically applicable predictor measures. We also aimed to explore which, if any, specific impairments were associated with increased risk of falls, to inform the evidence base for the development of future falls management interventions.
Materials and methods
This quantitative cohort study involved a one-off assessment of potential falls risk factors, followed by three months of prospective collection of data relating to falls incidence.
Participants
Participants were recruited from a large longitudinal cohort study, the South West Impact of MS study (SWIMS). 6 All potentially eligible participants within the database were identified by the study coordinator and invited to participate by letter (N = 277). In addition, 18 individuals made direct contact following local publicity about the project. For pragmatic reasons, to minimise the burden of travel for the assessor, participants were recruited in batches according to geography, with the final sample comprising individuals from across the entire SWIMS catchment area. Inclusion criteria were a confirmed diagnosis of MS as determined by McDonald’s criteria 7 and an Expanded Disability Status Scale (EDSS) of between 3.5 and 6.5, scored by telephone interview. 8 Individuals were excluded if they were unable to effectively give informed consent or had co-morbidities likely to significantly impact on balance as determined by the study assessor (HG).
Ethical approval was granted by University and regional National Health Service (NHS) Ethics Committees (10/H0203/66). Participation was voluntary and written informed consent was gained in accordance with the International Declaration of Helsinki. 9
Predictor variables
Eight potential predictor variables were included. The choice of variables incorporated those aspects previously linked to falls in MS, where the measures used in previous studies lacked specificity.10,11 Also included were attributes with limited or no evaluation in MS, but which could reasonably be considered as potentially important based on literature in other populations and the prevalence of the attribute in MS (e.g. cerebellar disease, vestibular pathologies, dual-tasking deficits). These were measured using standardised and validated outcome measures which have been shown to have clinical utility. For each variable, higher scores indicate worse performance.
The Physiological Profile Assessment (short form) (PPA) provided a quantitative measure of key physiological risk factors for falls, including strength, sensation, sway, vision and reaction time. Validated in older people, 12 scores can be considered separately, or summed and weighted to give a total risk score, as used in this study.
The Brief Ataxia Rating Scale (BARS) is a quick, clinically applicable test for ataxia, assessing five key aspects of coordination derived from the International Co-operative Ataxia Rating Scale. 13
The Ashworth scale was used to rate spasticity as measured using the testing guidelines reported in Nuyens et al. 14 Because of reported issues associated with use of multiple muscles and summed scoring of the Ashworth scale, 15 individual measurements were taken of the gastrocnemius and soleus muscles of the ankle reported by the participants as being their “worst” leg.
In line with recommendations, the Modified Falls Efficacy Score (International) (MFESI) was used to assess fear of falling. 16 This produces a single summed score based on the responses to 16 questions.
The Symbol Digit Modalities Test (SDMT) provides a fast, reliable measure which evaluates areas of cognitive function likely to be relevant to falls risk, including working memory and attention. 17 We used the oral version, recording the number of symbols correctly identified during the 90-second test period.
Dual-task interference (DTI) was measured using a 10-metre walk and serial 7 subtraction protocol, as recommended by previous DTI research in older people. 18 While a range of data was recorded, the main statistical analysis used the change in walking time, expressed as a percentage change between the single- and dual-task walks.
Measurement of lying and standing blood pressure assessed autonomic function, in line with previous MS studies. 19 Blood pressure was measured after 15 minutes in supine position and recorded for at least two minutes after standing using a calibrated digital sphygmomanometer (A&D Instruments, Oxford). A drop of > 20/10 mmHg after standing for at least one minute was considered positive. 20
Vestibular dysfunction, in particular the inability to suppress the vestibular-ocular reflex (VOR) to stabilise gaze during head movements, has been highlighted as a risk factor for falls in older people. 21 In line with Hillman et al., 22 our test compared visual acuity under seated static and dynamic conditions, where the head was moved passively back and forth through a 400 arc in a horizontal plane at a frequency of approximately 1.5 Hz, equating to a maximum velocity of approximately 1200/sec (Figure 1). Dynamic test movements were guided by the use of audio feedback (audible only to the tester) and a visual range guide. Visual acuity was measured for each eye individually using a Freiburg Visual Acuity Test (FrACT) Landolt C protocol. 23 Visual acuity was recorded using the Visual Acuity Rating (VAR) score. 24
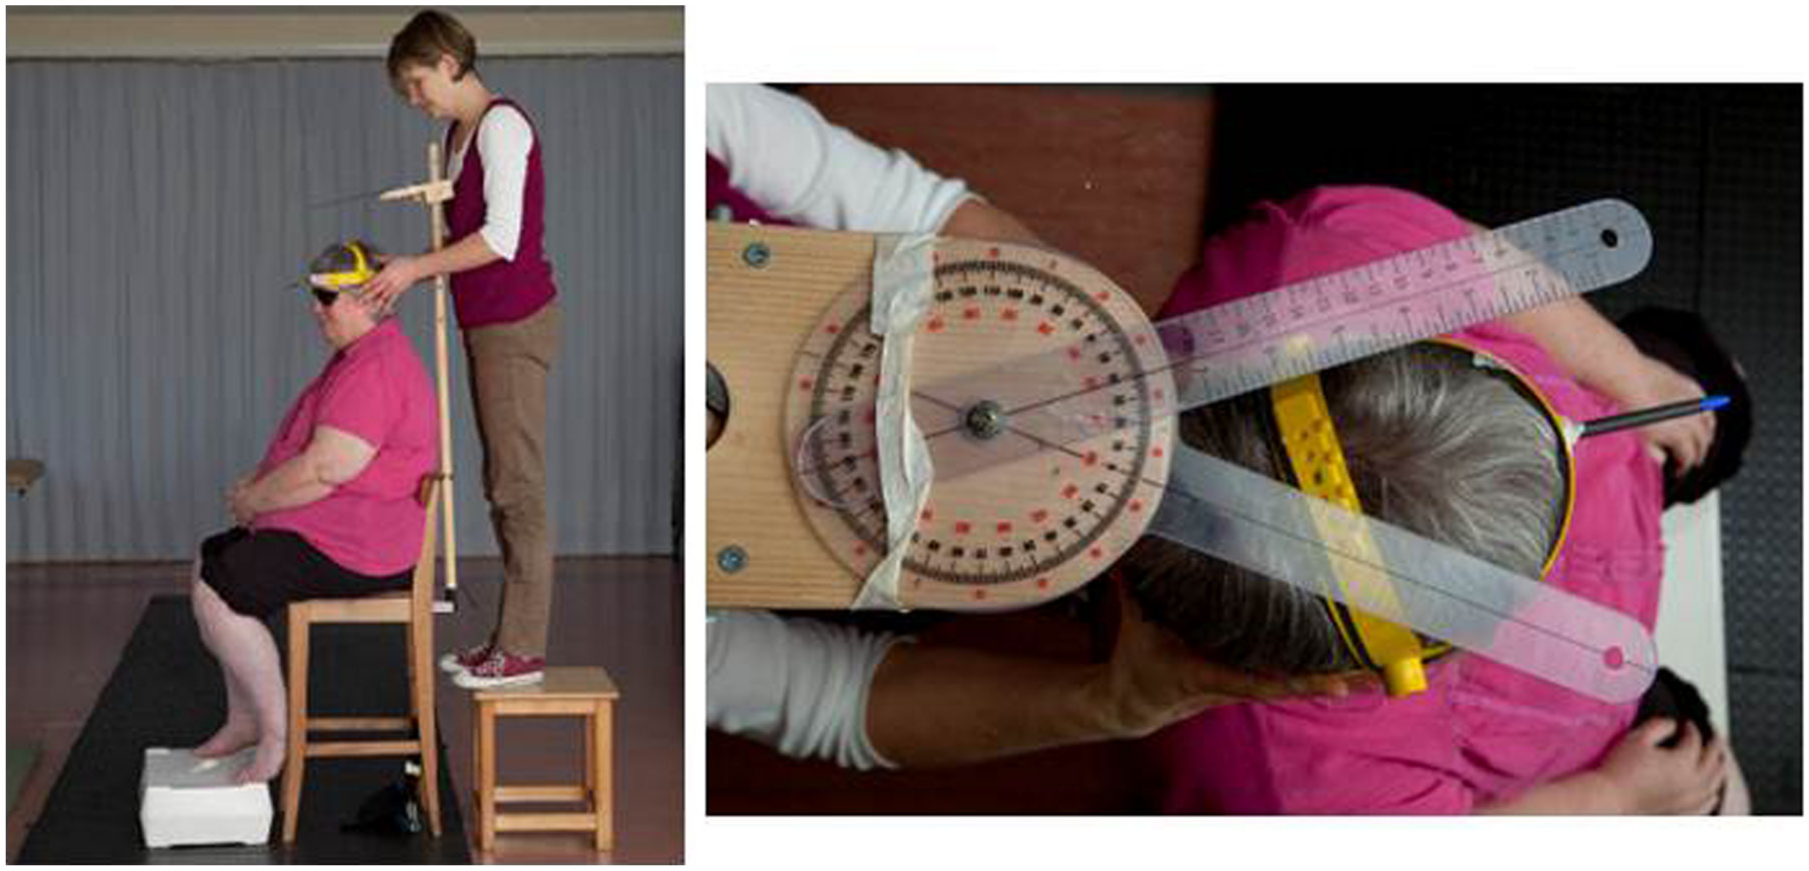
Set-up for dynamic visual acuity test.
Outcome variable
In line with best practice guidance, falls were defined as: “a slip or trip in which you lost your balance and landed on the floor or ground or lower level”, and people were classified as fallers or non-fallers based on self-reports of two or more falls during the prospective diary return period. 16
Procedures
Data were collected from May 2011 to August 2012. At a single assessment session, demographic and clinical data were collected, followed by the battery of assessments, conducted in a standardised order to minimise fatigue. All assessments were undertaken by one assessor (HG) according to a written protocol.
Participants were asked to prospectively record all falls using a daily diary system for three months immediately following their assessment. Participants received a pack containing 84 daily falls diary sheets, written completion instructions and reply-paid return envelopes. Diaries were returned at two-weekly intervals: Any participant whose diary returns fell behind schedule was followed-up by a reminder telephone call or email.
Data analyses
All data were entered directly onto an Excel spreadsheet which had been developed to minimise potential data input errors; accuracy was checked after each assessment. Any aspect of the assessment for which participants were unable to provide data was recorded, including coding for each reason for non-completion. Individual missing data were excluded from analysis on a case-by-case basis. Participants who failed to return any falls diary reports were excluded from the analyses.
All statistical analyses were run using IBM SPSS Statistics v20. For all analyses, the significance level was set at 5%. Data were summarised using frequencies and percentages, mean and standard deviation or median and interquartile range (IQR) as appropriate. Associations between categorical variables and falls grouping were analysed using Fisher’s exact test. For continuous variables, the differences between the two falls groups were compared using independent two-sample t tests (for normally distributed data) or Mann Whitney U tests (for non-parametric data). To further explore possible associations between each factor and falls grouping, unadjusted odds ratios (and corresponding 95% confidence intervals (CIs)) were calculated.
For the main statistical analysis, multi-variable logistic regression analysis, adjusting for disease severity as determined by EDSS score, was used to determine which combination of the eight predictor variables best discriminated between the two falls groups. Initially, forced entry was used to include all of the predictor variables plus the EDSS. Subsequently, backwards stepwise elimination was undertaken to develop a reduced model: The order of elimination was determined by evaluation of the Wald statistic for each predictor at each step alongside qualitative evaluation of the variables under consideration. This process is recommended above standard stepwise methods using solely significance-based decision-making to improve the stability and quality of the final model. 25 Further exploratory analyses of the component scores of variables included in the reduced model were undertaken to evaluate the relative contributions of each element to the overall performance of the retained predictor.
Goodness-of-fit of the final reduced model was assessed using the Hosmer and Lemeshow test and model performance was assessed using analysis of the receiver-operating characteristics (ROC) curve as a plot of the sensitivity and 1-specificity for all possible cut-off points. The optimal cut-off point of the model (defined as the point that maximises sensitivity and specificity) 26 was determined using least-distance analysis and confirmed by calculating the Youden index. 27 The main assumptions of logistic regression were also investigated 28 using standard diagnostic methods.
Sample size
The aim of the main statistical analysis was to identify the best linear combination of eight possible variables to predict fallers/non-fallers, using multi-variable logistic regression. Based on Peduzzi et al., 29 a sample size of 145 patients is sufficient for this type of analysis, assuming that the proportion of fallers is no lower than 55%. One hundred and fifty participants were recruited, allowing for a 3% dropout rate.
Results
Figure 2 details the participant flow through the study.
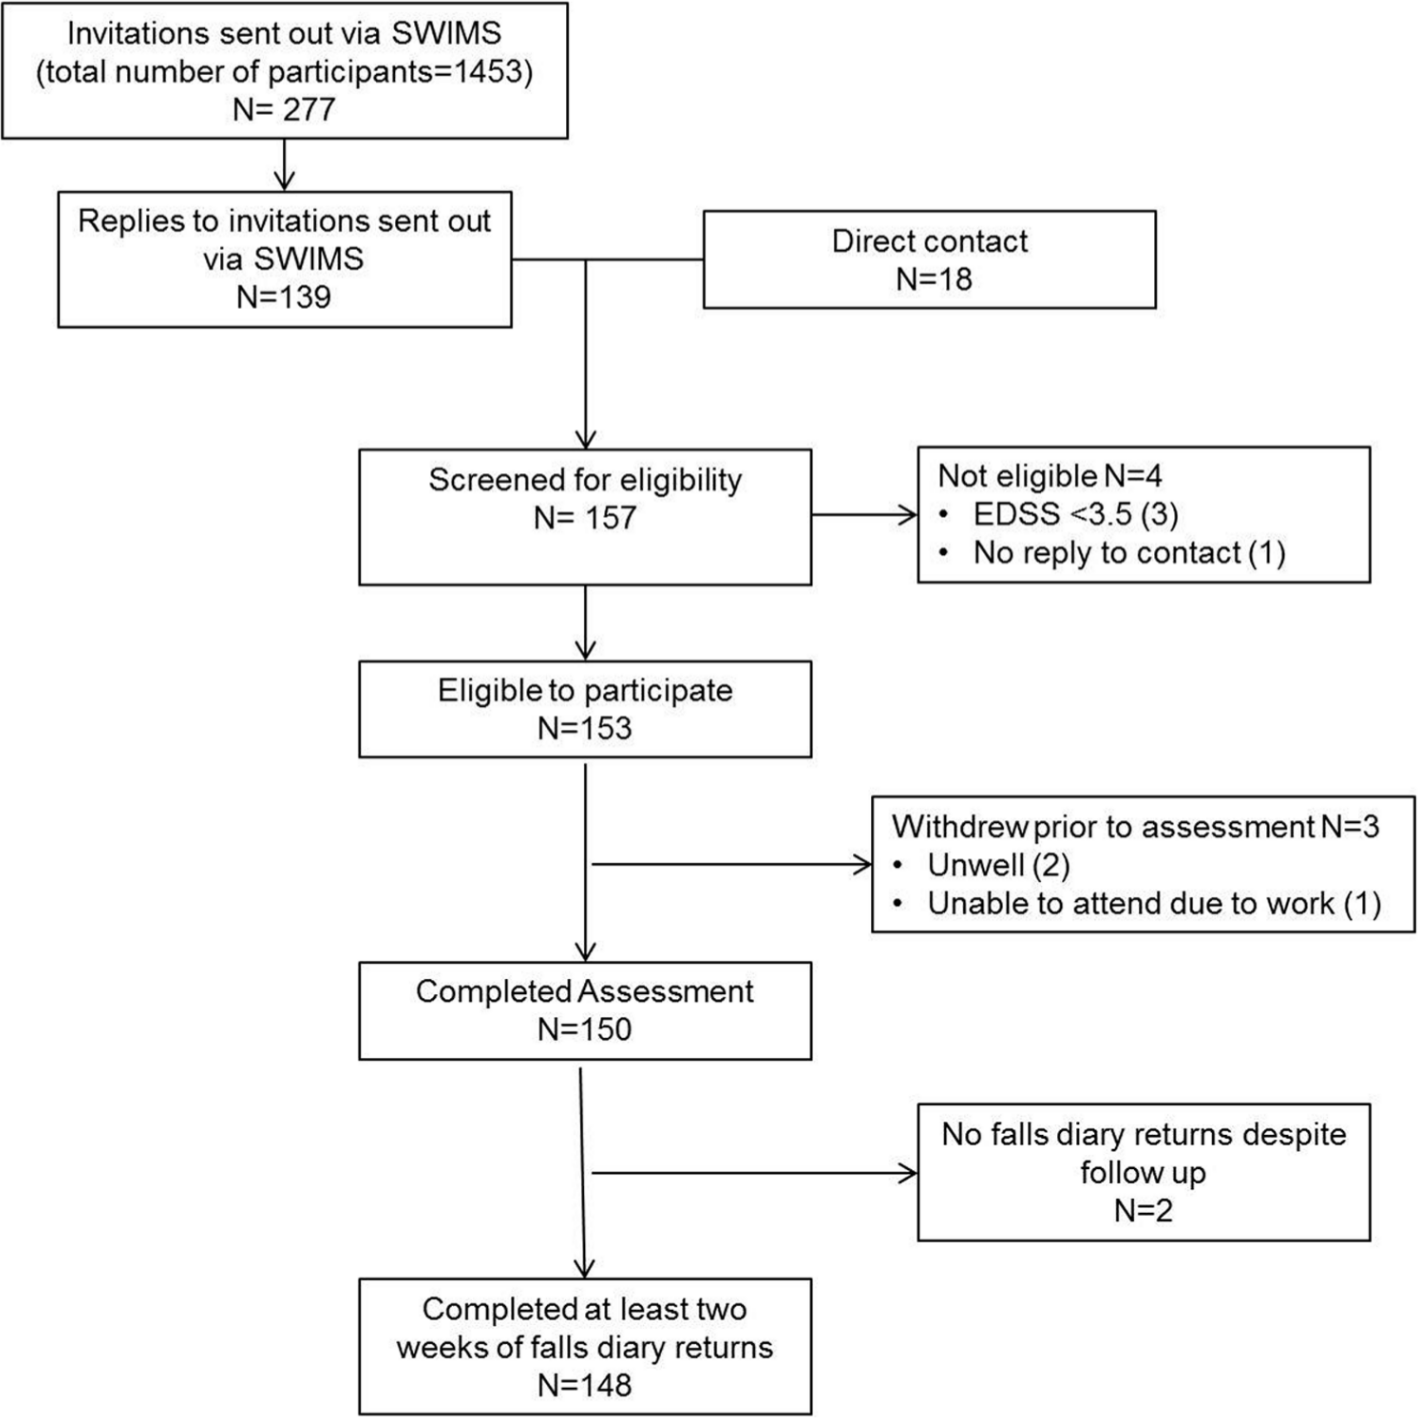
Participant flow diagram.
Participant characteristics
Demographic and clinical characteristics of the sample are summarised in Table 1. These characteristics are broadly similar to those reported in the wider MS population. 30
Demographic and clinical characteristics.
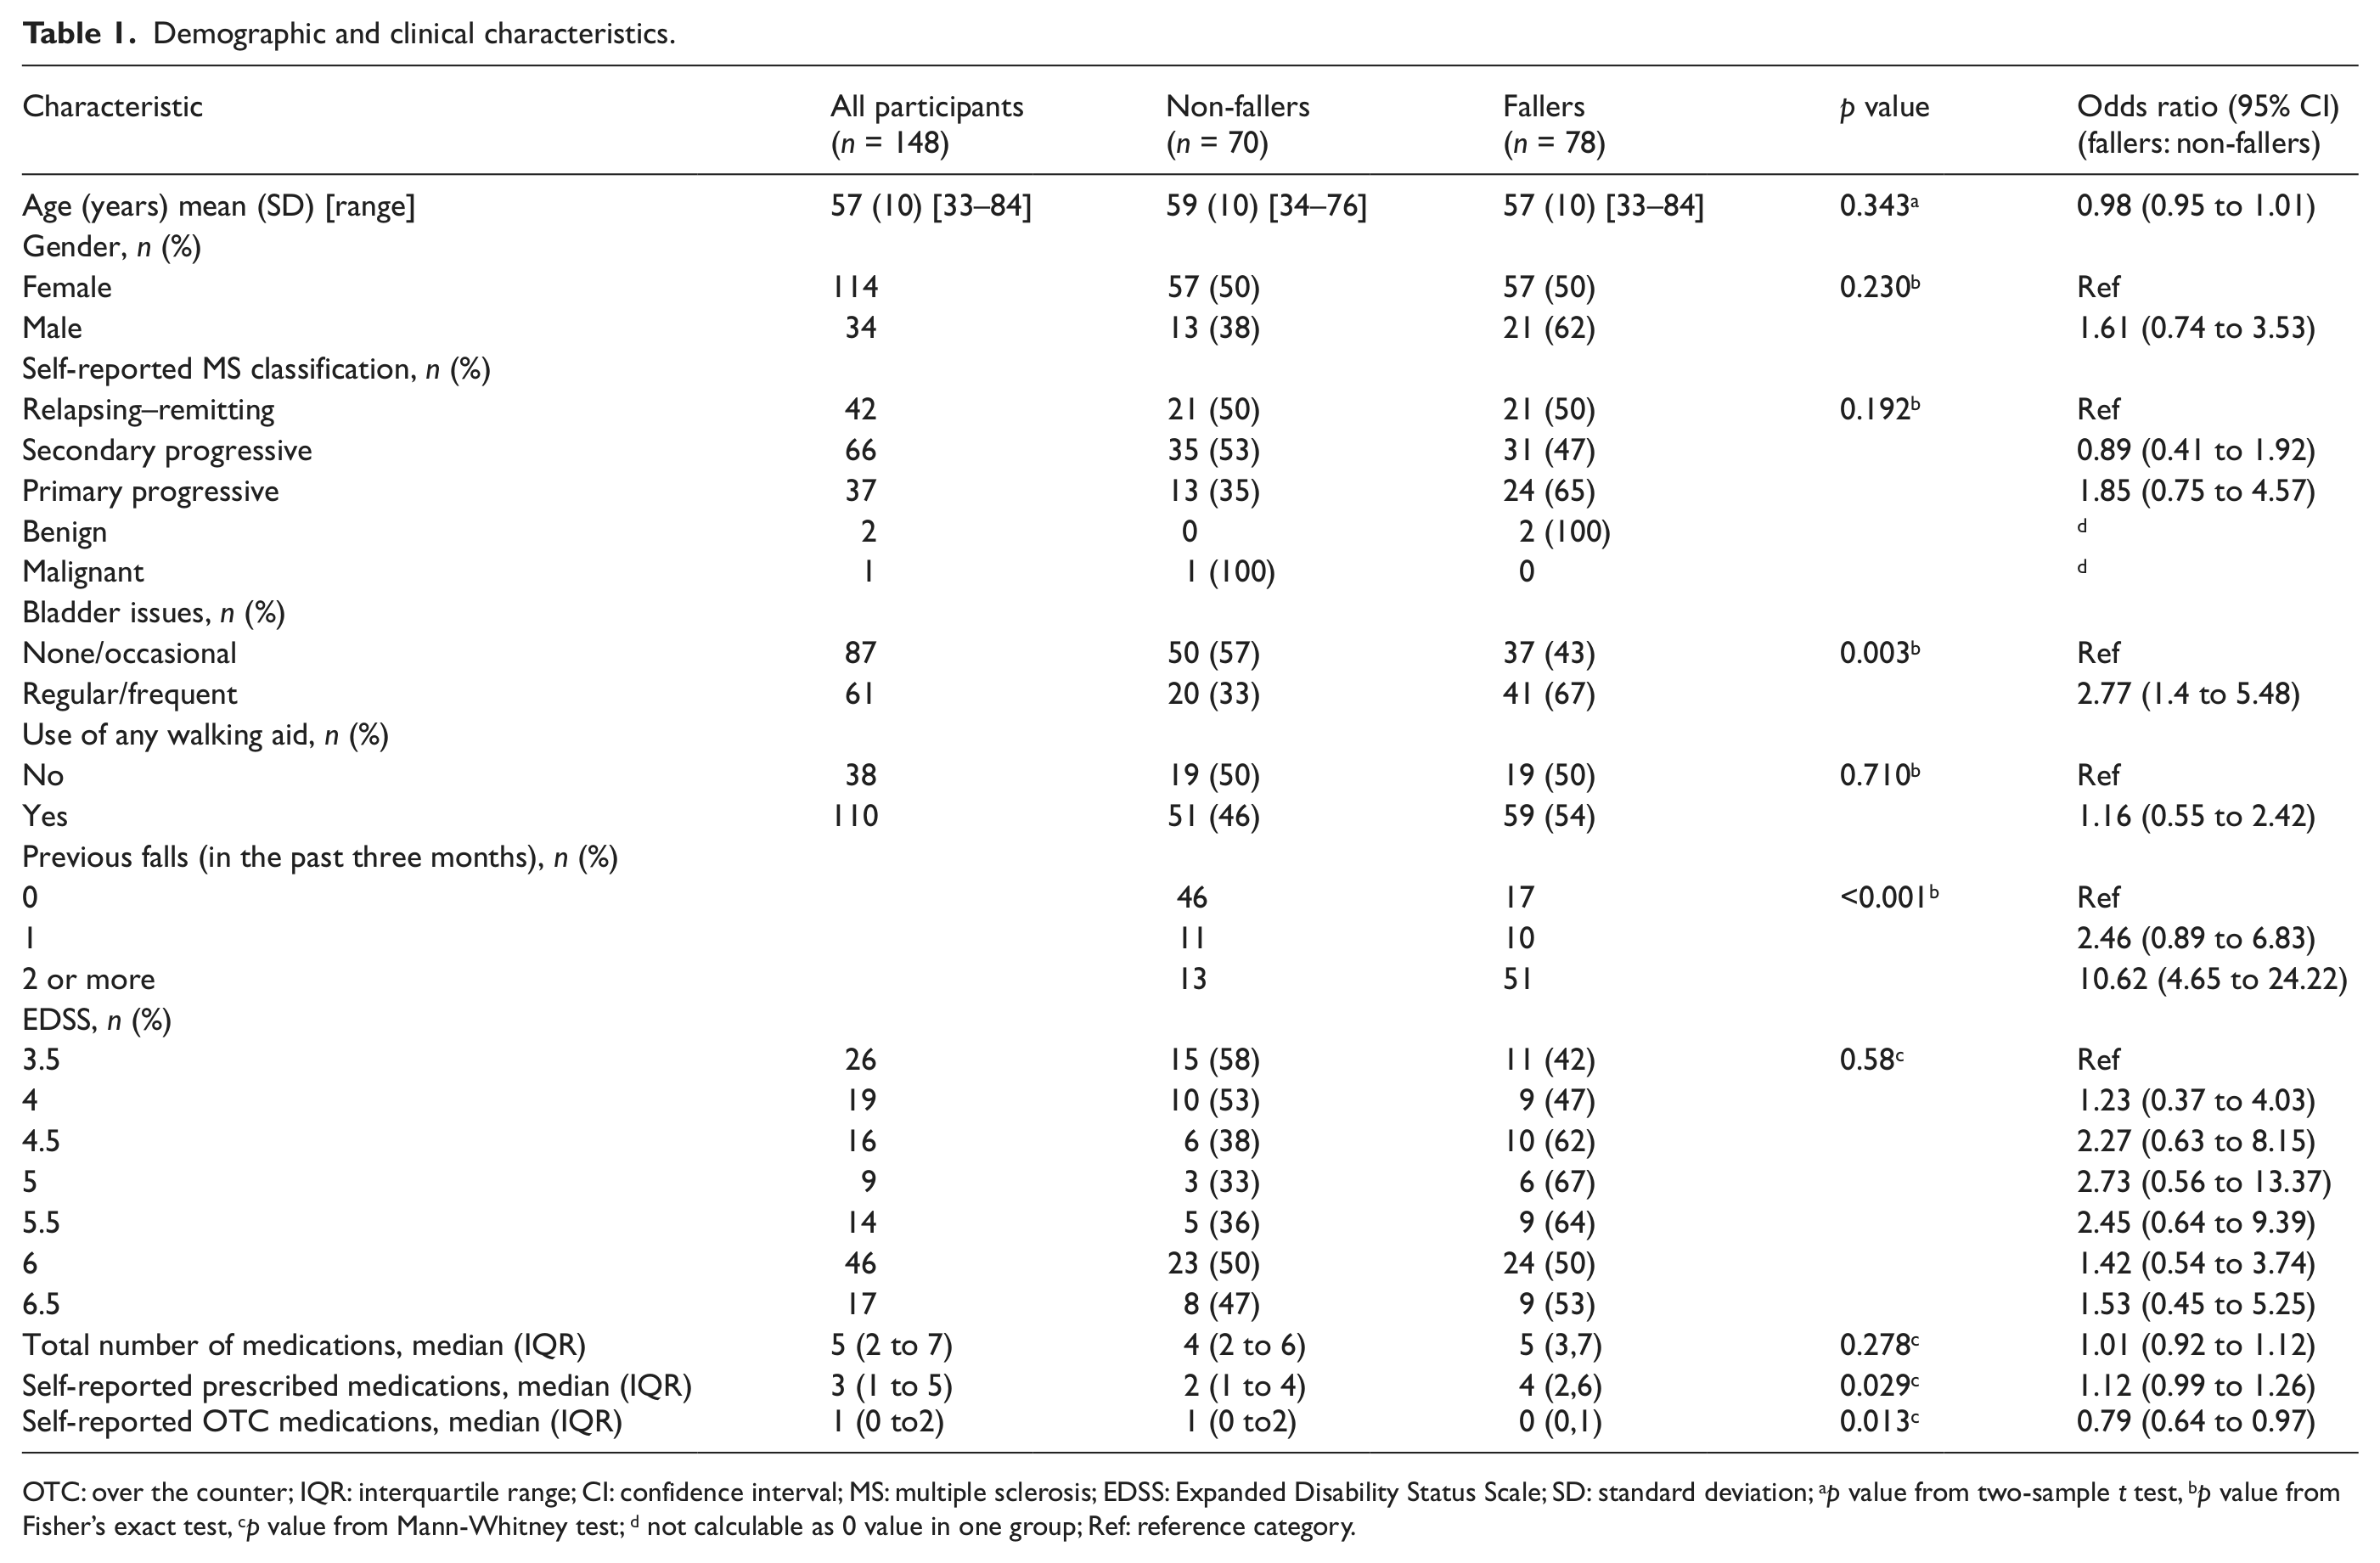
OTC: over the counter; IQR: interquartile range; CI: confidence interval; MS: multiple sclerosis; EDSS: Expanded Disability Status Scale; SD: standard deviation; ap value from two-sample t test, bp value from Fisher’s exact test, cp value from Mann-Whitney test; d not calculable as 0 value in one group; Ref: reference category.
Falls data
Of the 150 participants recruited, two failed to return any falls diary data despite prompts and were therefore excluded from the subsequent analyses; 148 completed at least two weeks of falls diaries and were included in the analyses. Amongst these 148 participants, a total of 823 of a possible total of 888 falls diaries were returned, a return rate of 92.7%. During the three-month period, 104 participants (70.3%) reported at least one fall, with a total of 672 falls being recorded. Amongst these 104 participants, a median of three falls (IQR 1.25 to 6.75) was reported, with a total range of one to 63 falls. Seventy-eight participants (52.7%) recorded two or more falls, thus meeting the pre-determined criteria to be classified as fallers.
Demographic and clinical characteristics and falls status (Table 1)
There was evidence of significant associations between self-reports of previous falls, medication use and urinary continence issues and whether or not individuals were classified as fallers or non-fallers (all p < 0.05). The odds of being classified as a faller for participants reporting two or more falls in the previous three months were more than 10 times the odds for participants who did not report a fall in the previous three months (odds ratio (OR) 10.62, 95% CI 4.65–24.22). Similarly, the odds of being classified as a faller were significantly greater for participants who reported regular/frequent urinary continence issues, compared to those reporting none/occasional issues (OR 2.77, 95% CI 1.40–5.48). There was also an increase in the odds of being classified as a faller with increasing numbers of prescribed medications (OR 1.12, 95% CI 0.99–1.26); and a reduction in odds with increasing numbers of over-the-counter (OTC) medications (OR 0.79, 95% CI 0.64–0.97).
Whilst ORs were greater than one for many of the other characteristics, there was insufficient evidence of significant associations with falls status. Of interest is the non-linear variation in the OR for faller/non-faller seen with EDSS level, with the OR steadily increasing for EDSS 4.0 to 5.0, compared with EDSS 3.5, followed by a decrease in the ORs at each step from 5.5 to 6.5.
Predictor variables and falls status
The summary statistics for the objective assessments indicate worse performance by fallers in all eight predictors (Table 2). However, within the multi-variable logistic regression analysis (which included EDSS as per the study protocol) only two predictor variables are seen to make significant independent contributions to the model: Ashworth scale and PPA. Within the categorical variable of the Ashworth scale, the ORs are non-linear, with a higher OR for those scoring one (OR 7.88, 95% CI 2.16–28.80) compared to those scoring two or more (OR 2.51, 95% CI 0.91–6.95). Increasing PPA score was associated with increased risk of being classified as a faller (OR 1.9, 95% CI 1.34–2.69). Exploratory analysis of the individual aspects of the PPA demonstrates that the key contributing factors are postural sway and reaction time (all p < 0.006, after adjustment for EDSS) (Table 3). It is noted that whilst the p values for these elements indicate statistically significant differences between fallers and non-fallers, the ORs for each individual element are extremely close to one.
Regression analysis, full model.
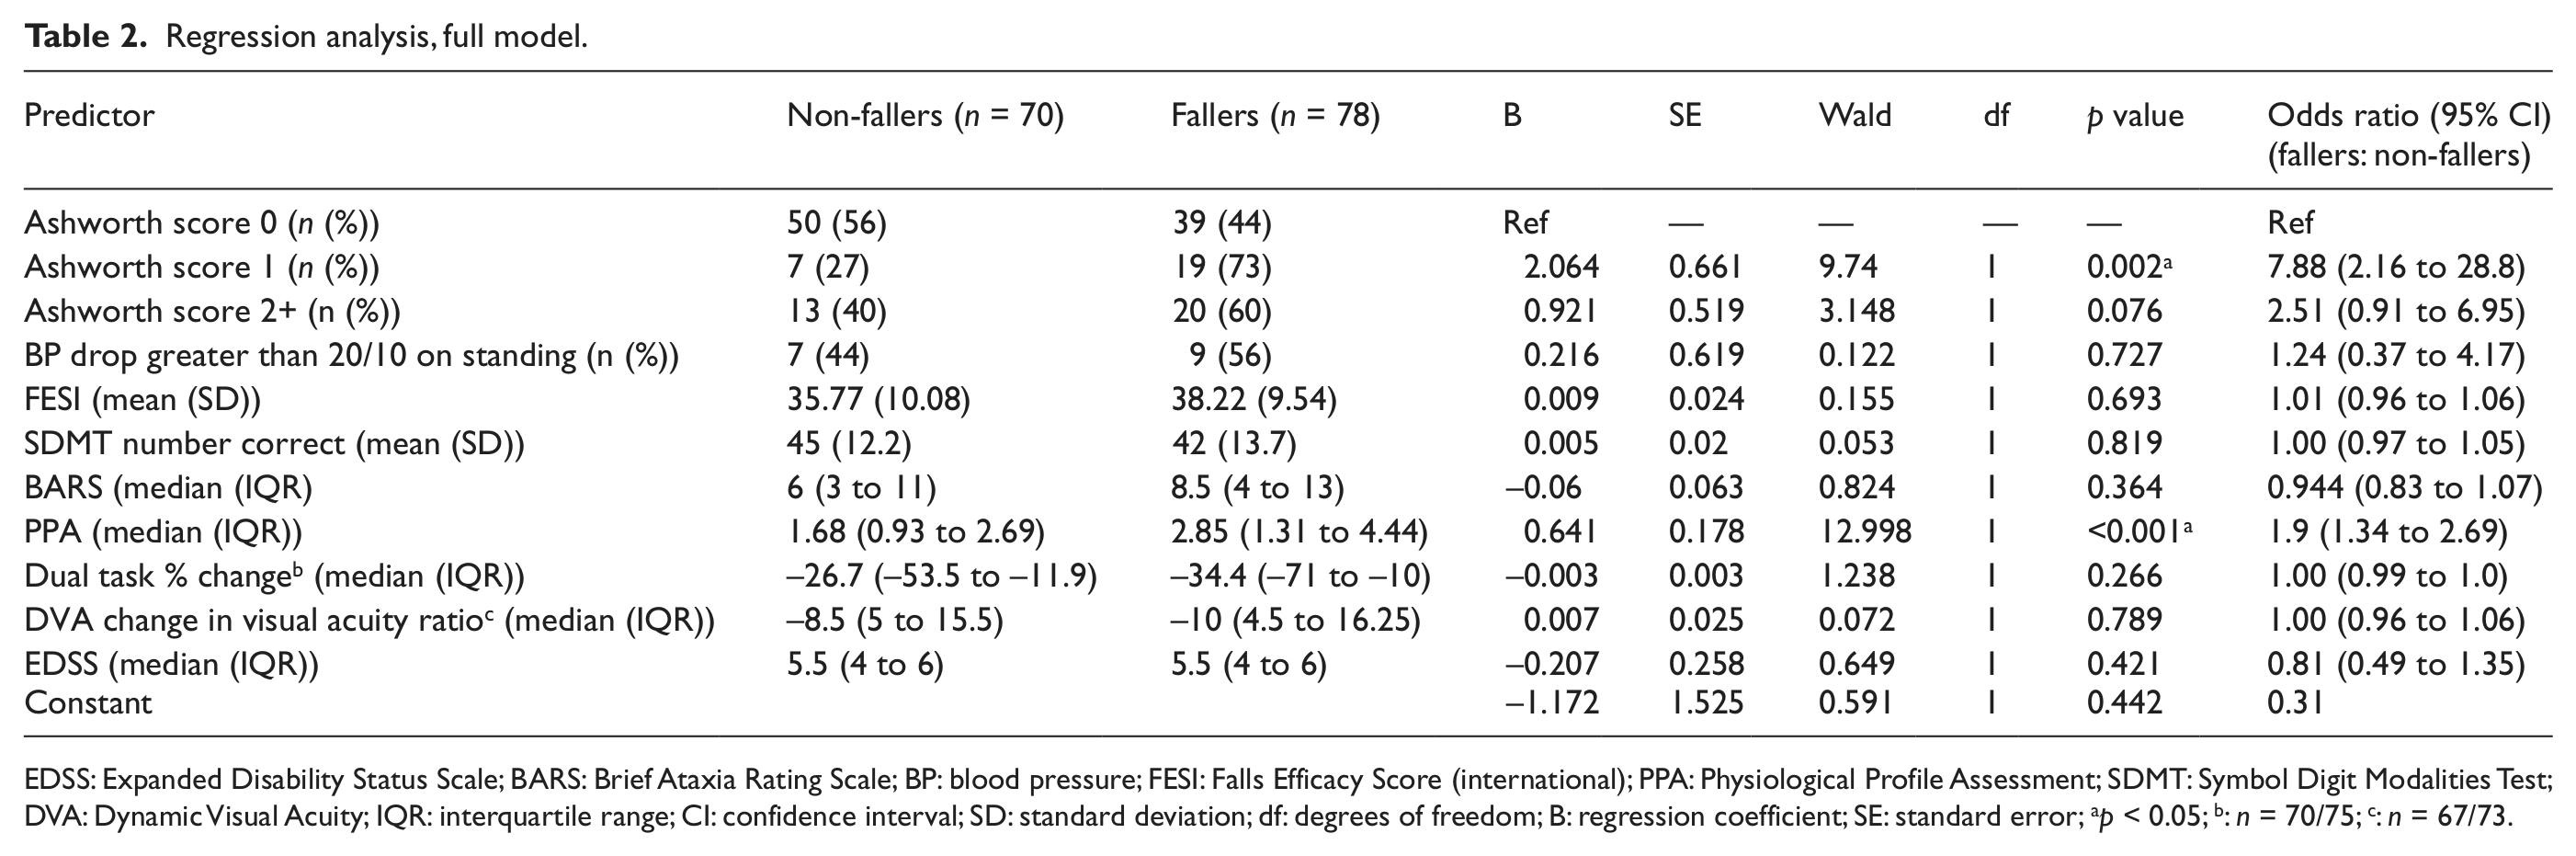
EDSS: Expanded Disability Status Scale; BARS: Brief Ataxia Rating Scale; BP: blood pressure; FESI: Falls Efficacy Score (international); PPA: Physiological Profile Assessment; SDMT: Symbol Digit Modalities Test; DVA: Dynamic Visual Acuity; IQR: interquartile range; CI: confidence interval; SD: standard deviation; df: degrees of freedom; B: regression coefficient; SE: standard error; ap < 0.05; b: n = 70/75; c: n = 67/73.
Analysis of the Physiological Profile Assessment (PPA) individual elements.
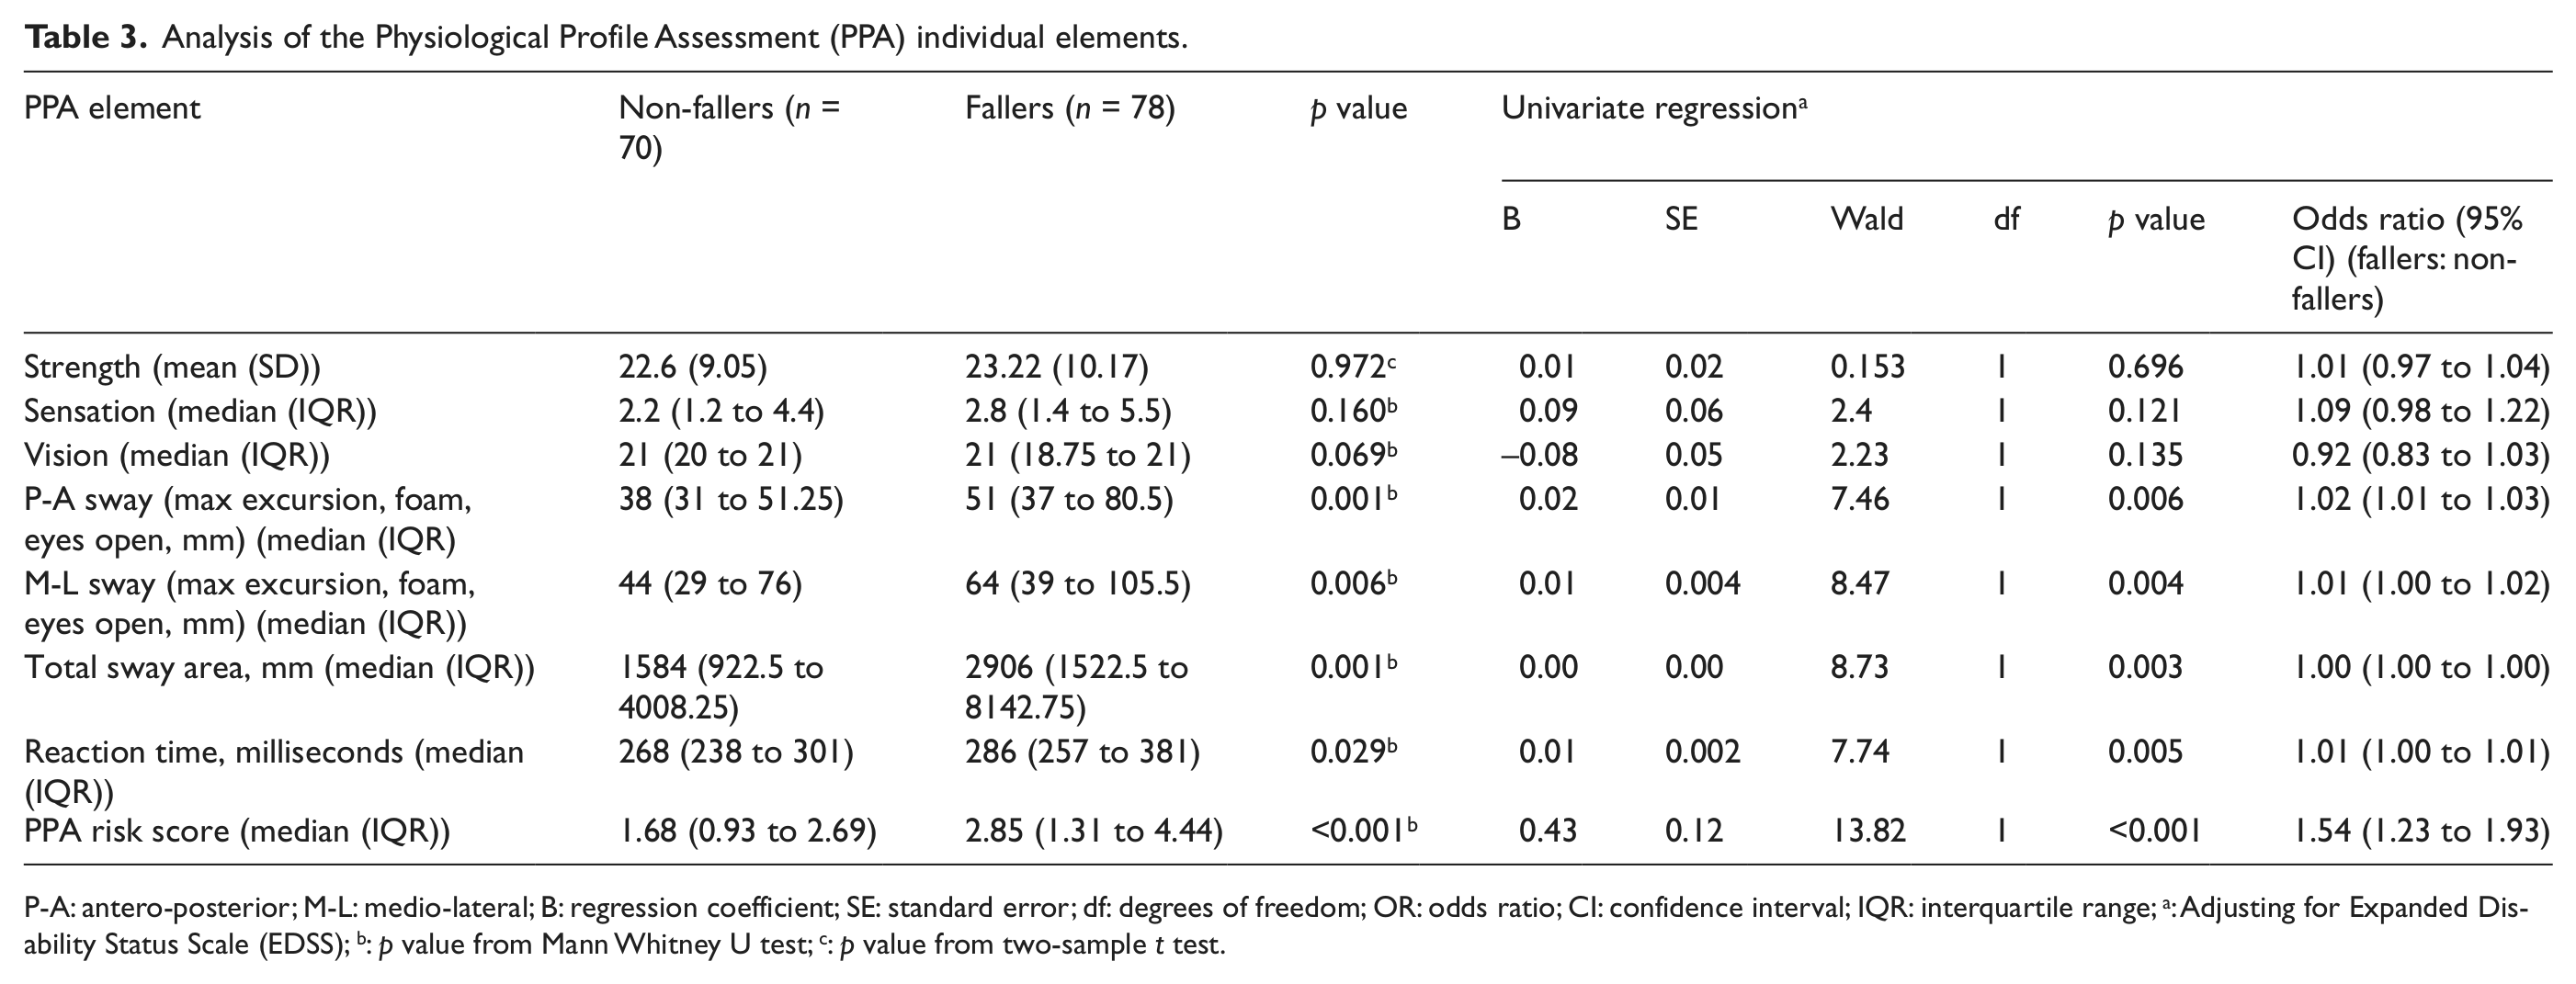
P-A: antero-posterior; M-L: medio-lateral; B: regression coefficient; SE: standard error; df: degrees of freedom; OR: odds ratio; CI: confidence interval; IQR: interquartile range; a: Adjusting for Expanded Disability Status Scale (EDSS); b: p value from Mann Whitney U test; c: p value from two-sample t test.
From the initial full logistic regression model, a reduced model was developed retaining only the significant predictor variables (Ashworth scale and PPA summed score) (Table 4). The EDSS was retained in the final model in accordance with the initial study protocol. The goodness-of-fit of this model was reasonable (Hosmer-Lemeshow test, p = 0.659). Model performance was further assessed using analysis of the ROC curve (Figure 3). 26 The area-under-the-curve c-statistic was 0.73 (95% CI 0.65–0.81), indicating fair-to-good overall predictive ability. 31 Using least distance and Youden index methods, the optimal cut-off point of the model was determined to be 0.51, with sensitivity and specificity at this point being 69% and 70%, respectively. Similar analysis for the best performing single predictor (PPA) yielded a c-statistic of 0.67 (95% CI 0.58–0.76) and sensitivity and specificity values of 56% and 74%, respectively.
Regression analysis, reduced model.
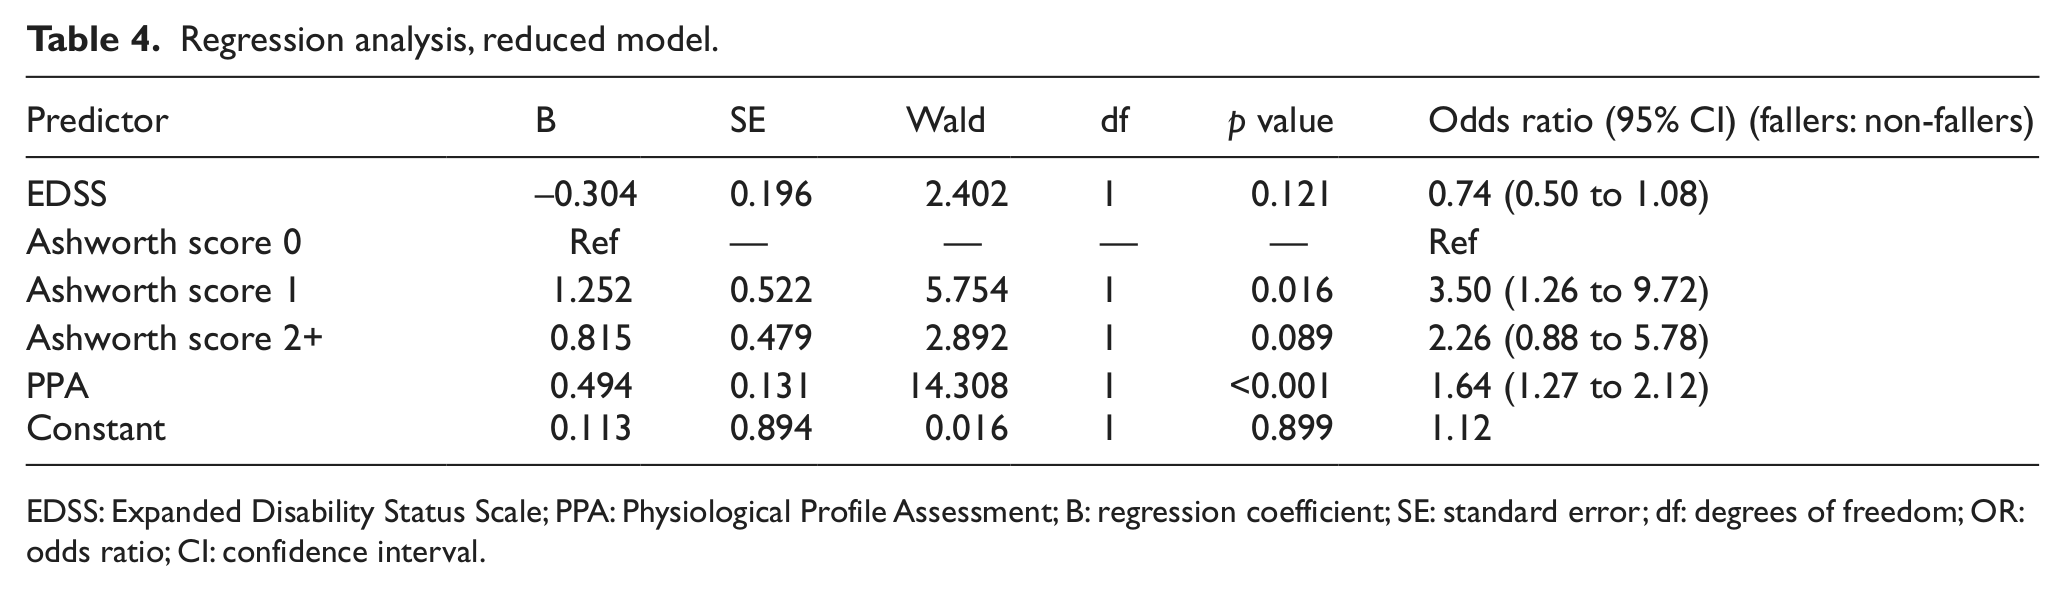
EDSS: Expanded Disability Status Scale; PPA: Physiological Profile Assessment; B: regression coefficient; SE: standard error; df: degrees of freedom; OR: odds ratio; CI: confidence interval.
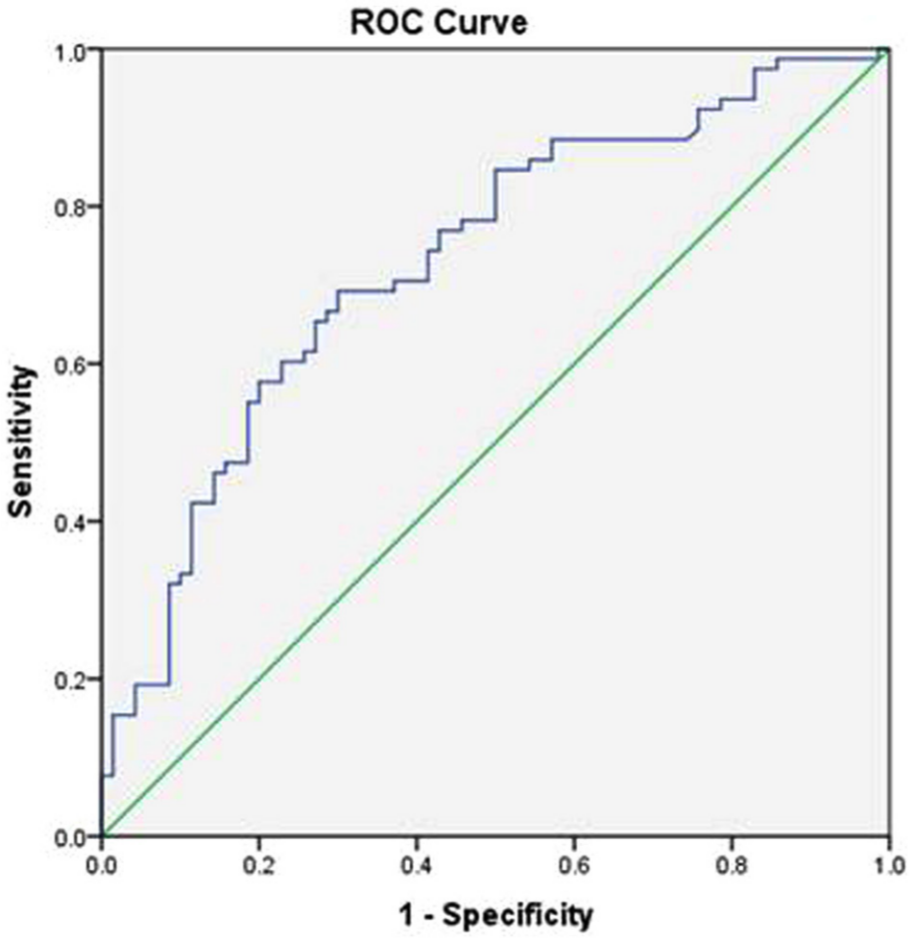
Receiver-operating characteristics curve (ROC) for reduced regression model.
Further diagnostics were run on the reduced model to check that the assumptions for logistic regression were satisfied, 28 with no major violations of the assumptions detected.
Discussion
This study demonstrated a prevalence of accidental falls of 70.3% for people with MS, with 52.7% of the cohort reporting two or more falls in the three-month period. This rate of falling is high relative to other studies, with reported rates of 50%–60% for single falls over a similar time period. 5 This may in part be due to the characteristics of our sample, which included individuals with a higher level of disability than other studies.1,32 However, variations in definitions of falls and falls reporting measures may also, at least in part, account for this discrepancy. Many previous studies used retrospective falls recall,10,11,32 a method known to be associated with significant under-reporting of falls. 33 Our study has been conducted according to best-practice guidelines in order to ensure our data will be as accurate a reflection of the actual frequency of falls as is possible. 16
In our study, there was evidence of significant associations between each of urinary continence issues, previous falls history, prescription medication usage and increased risk of being classified as a faller; however, use of OTC medications (predominantly dietary supplements) was associated with a significant reduction in falls risk. This aspect has not been investigated in previous studies and would merit further evaluation – it is possible that other factors may be contributing to this association.
In contrast to others,1,10,32 our results did not show that either use of a walking aid or EDSS score was significantly associated with falls risk. However, we did observe a pattern of increasing falls risk with EDSS progression from 3.5 to 5.5; the point on the scale just prior to transition from not using a walking aid to using a walking aid. This finding may reflect the clinical characteristics of the different study samples; compared to others our participants tended to have higher EDSS scores1,34 and more people were in the progressive phase of the disease. 1 If confirmed in future work, our results suggest that a key time for falls interventions programmes may be when people first start to consider using a walking aid.
Our finding that fear of falling as measured by the FESI is not related to falls risk is broadly in agreement with existing MS research in which fear of falling was measured using a simple four-point scale. 1 Our study utilises a robust measure which has recently been validated in a sample of people with MS. 35 This finding may reflect different attitudes towards falls risk when compared to other groups such as older people, in whom falls are known to be associated with perceptions of disability and loss of independence. 36 Whilst previous research in MS has highlighted activity curtailment associated with fear of falling, 3 our results suggest that this strategy may not be directly associated with fear of falling, as measured by the FESI. Fear of falling is acknowledged as a multi-dimensional concept. 37 Factors such as age, role and social expectations may all make significant contributions to the perception of and response to falls, and may account for the differences seen in people with MS compared to other populations. These issues require further exploration as it is likely to be an important consideration in the development of MS falls interventions.
In contrast to other MS studies, cognitive function was not significantly associated with falls risk in our study. This may be related to the aspects of cognitive function measured: Previous studies used global measures of cognitive function such as the mini-mental status examination 32 or self-report 10 whereas we used the SDMT as a specific measure of attention and working memory. Similarly, the only previous study to measure dual-task performance 1 used the timed-up-and-go (cognitive) test which is a sit-to-stand, walk and turn task, rather than a straight walking task; this may account for the differing results.
New attributes that have not previously been objectively evaluated include ataxia, postural hypotension and vestibular dysfunction, all of which have been associated with falls in other non-MS samples.21,38 In contrast, our study did not demonstrate evidence that any of these attributes are significantly associated with falls risk, although fallers did perform worse than non-fallers in each aspect.
After adjusting for EDSS, the final model for predicting falls risk included only two of the potential predictor measures, the Ashworth scale and the PPA. Spasticity, as measured by a lower limb total Ashworth score, has been shown to be associated with falls in previous MS studies; 1 however, the association was thought to be linear in nature, with falls risk increasing with each step on the Ashworth scale. In contrast, our findings have shown a non-linear relationship, with a score of one being associated with a much higher OR than a score of two or more. Whilst we recognise the limitations of the Ashworth scale as a measurement instrument, 39 it may be that lower grades of spasticity are more associated with falls risk: One possibility is that less muscle stiffness results in less stability in weak lower limbs.
The PPA has not previously been used in MS studies. Exploratory analysis of the individual dimensions of the PPA assessment suggests that changes to postural sway and delayed reaction time were key attributes, whilst sensory changes, strength and vision did not (individually) predict falls classification. However, whilst the differences in scores between fallers and non-fallers were statistically significant for three of the individual elements, the ORs for each element were much lower than the OR associated with the total PPA risk score. The PPA risk score alone was able to predict falls with a ‘fair’ level of accuracy; however, addition of the EDSS and Ashworth scale to the model improved the accuracy to ‘good’. 31 The sensitivity and specificity of this final model were higher than for previously reported models in MS studies;1,40 confirmation of this is required in future research as this has the potential to form the basis of work to develop an MS-specific falls risk assessment tool.
This study confirms the high prevalence of falls in people with MS and highlights attributes linked to risk of falls. We have also demonstrated that other impairments not investigated previously, such as ataxia, vestibular dysfunction and postural hypotension, may not be significant predictors of falls risk in this group. Strengths of this study are the standardised measures used, which are clinically applicable. Use of specific falls definitions and prospective falls recording using recommended data collection methods also contribute to the methodological strengths of the study. EDSS was measured using the telephone interview method, which has been shown to have good agreement with the original face-to face version (intra-class correlation coefficient: 94.8%), 8 although it is recognised that face-to-face assessment of the EDSS is the gold standard. Limitations to the study include the recognised concerns regarding the validity of the Ashworth scale as a measure of spasticity and potential inaccuracies associated with use of self-report diaries for falls data collection. 16 The use of participant self-report to collect data such as medication use may also have led to some inaccuracies; similarly, detailed information regarding medication dosages and participant adherence was not collected, hence these findings should be interpreted with caution.
A logistic regression model including the PPA and Ashworth scale predicted fallers with a higher degree of accuracy than previously published models. Several of the risk factors identified are modifiable, including postural sway, delayed reaction time, spasticity and urinary continence and are potentially amenable to intervention. Future work will include the development of an intervention targeted to address the modifiable risk factors highlighted by this study.
Footnotes
Acknowledgements
We thank Professor John Zajicek and Dr Wendy Ingram for their help in recruiting participants for this study via the SWIMS database.
Conflict of interest
The authors declare that there are no conflicts of interest.
Funding
This work was supported by a grant from the Chartered Society of Physiotherapists Physiotherapy Research Foundation (UK). Grant number PRF10/17.