
Abstract
Objective:
The objective of this paper is to identify clinical or magnetic resonance imaging (MRI) predictors of long-term clinical progression in a large cohort of multiple sclerosis (MS) patients.
Methods:
A total of 241 relapsing–remitting (RR) MS patients were included in a nine-year follow-up (FU) study. The reference MRIs were acquired at baseline (BL) as part of a multicenter, cross-sectional, clinical-MRI study. Volumetric MRI metrics were measured by a fully automated, operator-independent, multi-parametric segmentation method. Clinical progression was evaluated as defined by: conversion from RR to secondary progressive (SP) disease course; progression of Expanded Disability Status Scale (EDSS); achievement and time to reach EDSS 4.
Results:
We concluded that conversion from RR to SP (OR 0.79; CI 0.7–0.9), progression of EDSS (OR 0.85; CI 0.77–0.93), achievement of EDSS 4 (OR 0.8; CI 0.7–0.9), and time to reach EDSS 4 (HR 0.88; CI 0.82–0.94) were all predicted by BL gray matter (GM) volume and, except for progression of EDSS, by BL EDSS (respectively: (OR 2.88; CI 1.9–4.36), (OR 2.7; CI 1.7–4.2), (HR 3.86; CI 1.94–7.70)).
Conclusions:
BL GM volume and EDSS are the best long-term predictors of disease progression in RRMS patients with a relatively long and mild disease.
Introduction
Multiple sclerosis (MS) is a chronic progressive disease of the central nervous system (CNS) that mostly affects young adults. Histopathologically, the disease consists of multifocal areas of demyelination and axonal loss in white (WM) and gray matter (GM) throughout the CNS. 1
MS clinical features are heterogeneous and change over time, leading to a significant and irreversible disability in about 50% of patients after a median time of 8.6 years.2,3 To assess disability, among several clinical rating scales, the Expanded Disability Status Scale (EDSS) is the most widely used in clinical practice and clinical trials. 4
The prognosis is highly variable and unpredictable.5–7 A subset of patients shows a benign disease course with only a few relapses and none or only minimal disability 15 years after disease onset. 8 On the other side, rapidly progressing disability may lead to some patients needing wheelchairs within a few years from the disease onset. 9
At the present time, there is a definite need for a single or combined objective marker to reliably predict long-term disease evolution, and consequently to optimize patients’ management. Many demographic and clinical markers have been tested in MS, yielding significant results.10,11 Objective magnetic resonance imaging (MRI)-derived markers have also been tested, showing great potential.12–19 Nevertheless, most of the MRI studies conducted so far have been weakened by methodological limitations such as monocentric design,13,15–17,19 small sample size13,15–17,19 and length of follow-up (FU).15,17
In previous studies,15,17–19 including our previous multicenter, clinical-MRI cross-sectional study 20 , in which a very large cohort of MS patients underwent the same MRI protocol on the same mobile scanner and with centralized data analysis, the important role of GM volume in determining disability has already been highlighted. The predictive value of MRI parameters, including GM volume, has been assessed in few longitudinal21,22 studies with adequate sample size and follow-up duration. Therefore, taking advantage of the availability of data coming from our previously mentioned cross-sectional study, we aimed at identifying which baseline (BL) MRI or combined clinical/MRI measure was the best predictor of long-term clinical progression.
Methods
Patients and clinical data
Of the initial cohort of 597 MS patients participating to the previous multicenter clinical-MRI research, 20 303 subjects (50.7%; female (F)/male (M) 202/101; median age 45 years; median age at disease onset 26 years) were enrolled in this nine-year FU study. The number of patients lost at FU was considerable (294; 49.4%), and the reasons were: missing contact information (50.7%), unavailability (24.1%), refusal (20.1%), death (3.4%), and other major medical illnesses (1.7%). However, there were no significant differences in BL demographic or clinical data between patients lost at FU and those participating in the initial cross-sectional study, except for a minor percentage of relapsing–remitting (RR) patients in the dropped-out population (65% RR patients in the dropped-out group, 72.4% in the FU group; p < 0.02). At BL, disease course was RR in 241/303 (79.5%) patients, secondary progressive (SP) in 47/303 (15.5%) and primary progressive (PP) in 15/303 (5%). Because of the purpose of the study, progressive patients at BL (both PP and SP) were excluded from statistical analysis that focused only on RR patients, being the only group suitable to assess all the predefined criteria of disease progression. During FU clinical evaluations were performed at BL and at three six-month intervals or on the occasion of relapse at the same reference MS center. The reference MRI was acquired at BL. Mean FU was 109.3 ± 7.5 months. Clinical data consisted of age at BL, age at first clinical episode (disease onset), disease duration (DD) at BL and at FU, disease course and disability at BL and during FU (as measured by EDSS score), annualized relapse rate (ARR) during FU and use of disease-modifying treatments (DMT) at BL and FU. All participants gave written informed consent and the protocol was approved by local ethic committees.
Mri
At BL, all MS subjects underwent the same imaging protocol as described in the previous cross-sectional study (see Appendix). 20 All the studies were segmented using a multi-spectral fully automated method (see Appendix), based on relaxometric characterization of brain tissues.23,24
The software furnished complete sets of multi-feature images (R1(=1/T1), R2(=1/T2), proton density (N(H))-based) and segmented images, and calculated the volumes of the following intracranial tissues: cerebrospinal fluid (CSF), GM, WM and abnormal white matter (AWM). To normalize for head size variability, the volumes of intracranial tissues were expressed as fractions (f) of the intracranial volume, which were calculated for each subject as the sum of all intracranial tissues. AWM-f is a measure of lesion load as determined by the R1, R2 and N (H) information and morphological characteristics, the reduction of WM-f indicates WM volume reduction, the reduction of GM-f indicates reduction of GM volume, and the increase in CSF-f indicates global brain volume reduction.
Definition of disease progression
To identify long-term clinical and MRI predictors of MS evolution, we defined disease progression as follows:
Conversion from RR to SP disease course;
Progression of EDSS, considered as a one-point increase for EDSS ≤ 5.5 and a 0.5-point increase (confirmed after at least three months) for EDSS > 5.5; 25
Achievement of milestone EDSS 4;
Time to reach milestone EDSS 4.
Statistical analysis
MRI volume data were presented as means and 95% confidence interval (CI). The mean MRI parameters of all subjects were adjusted by age, gender and education using a linear regression model. Before regression analysis, individual variables were checked for skewness and the presence of outliers.
Because of the high inter-correlation of MRI variables (generating multicollinearity), the less statistically correlated measures (AWM-f, GM-f and CSF-f), still representing the main aspect of MS pathology, were included in the multivariate model. Statistical analysis was performed using STATA 12.0, and a p value < 0.05 was considered statistically significant. Shapiro Wilk test was used to evaluate normality assumption; in case of violation of normality distribution, median and interquartile range were used. Kruskall Wallis test and Chi square test were used to compare the two groups (BL RR who remained RR at FU (RR→RR), and RR patients who converted to SP course (RR→SP) during FU), respectively, for quantitative and qualitative data. Mann-Whitney U test was used to compare BL data of RR→SP to RR→RR patients and to compare patients who reached EDSS 4 and patients who did not. Variance inflation factor (VIF) was calculated to evaluate multicollinearity problems of MRI variables in the multivariate regression. Variables correlating with outcomes (p < 0.1) in univariate analysis were used as independent variables in multivariate logistic regression. Data log transformation of the ARR variable was used in multivariate logistic regression because it was not normally distributed, and regression residual study confirmed that the log transformation was more appropriate for statistical analysis. Three logistic regression stepwise analyses were performed with p = 0.10 as the critical value for entering or excluding variables in the model. In the first one, conversion RR→SP was considered as a dependent variable, (independent variables: age, BL EDSS, DD, AWM-f, CSF-f, GM-f): Only GM-f and EDSS remained in the final model. In the second model, EDSS progression (considered as a one-point increase for at least three months for EDSS ≤ 5.5 and a 0.5-point increase for at least three months for EDSS > 5.5) was considered as a dependent variable (independent variables: BL EDSS, GM-f, age, age at onset and DD): Only GM-f remained in the final model. In the third model, the achievement of EDSS 4 was used as a dependent variable (independent variables: age, BL EDSS, AWM-f, CSF-f, GM-f, DD): Only GM-f and EDSS remained in the final model.
In the third model patients with EDSS ≥ 4 who did not stay stable at EDSS 4 were excluded from the analysis. Odds ratio (OR) and their 95% CIs were calculated. Survival analysis was made to evaluate time to reach the milestone EDSS 4. Kaplan-Meier curve of RR→RR and RR→SP patients were compared using the log-rank test. In addition, a Cox proportional hazard model was calculated to estimate the hazard ratio (HR) and their 95% CIs. The included independent variables were those with p < 0.1 in the univariate model. A stepwise model was used with p = 0.10 as the critical value for entering or excluding variables in the model. The EDSS variable did not respect assumption of hazard proportion overtime and for this reason was in the model as time depending.
Results
Descriptive analysis of demographic, clinical and BL MRI data of the investigated cohort, divided by clinical phenotype, is shown in Table 1.
Clinical, demographic and adjusted a BL MRI volumes (as percentage of whole-brain volume) of 241 RRMS patients followed up for nine years.
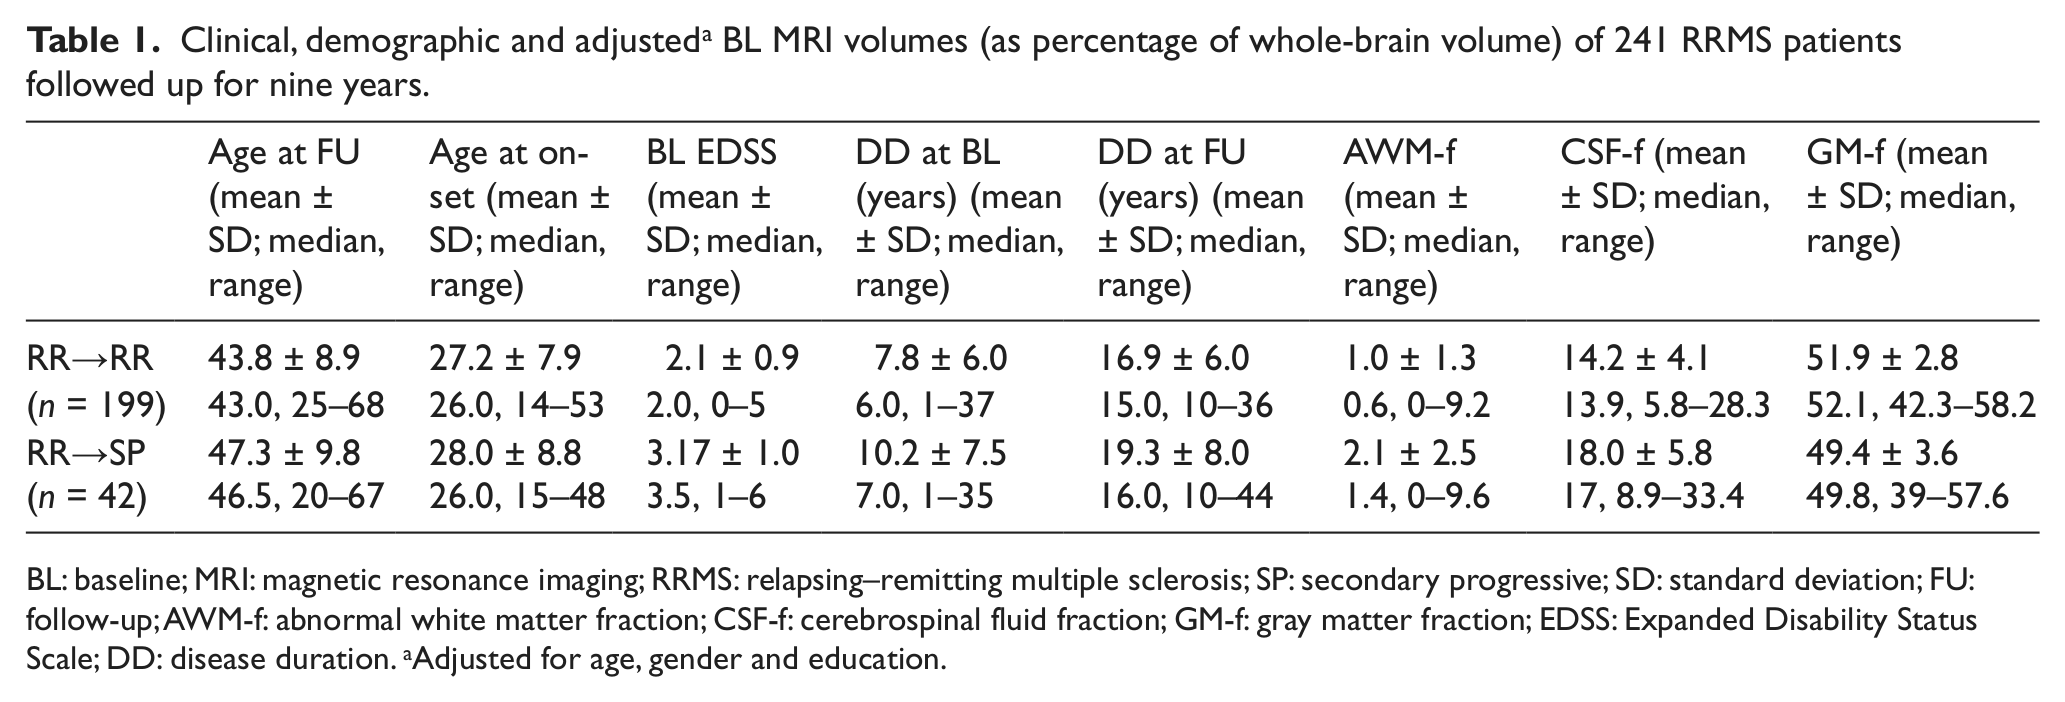
BL: baseline; MRI: magnetic resonance imaging; RRMS: relapsing–remitting multiple sclerosis; SP: secondary progressive; SD: standard deviation; FU: follow-up; AWM-f: abnormal white matter fraction; CSF-f: cerebrospinal fluid fraction; GM-f: gray matter fraction; EDSS: Expanded Disability Status Scale; DD: disease duration. aAdjusted for age, gender and education.
The clinical/demographic and BL MRI characteristics of RR patients are shown in Table 2. Of the 241 RR patients, 199 (82.6%) remained RR (RR→RR), while 42 (17.4%) progressed to the SP course during FU (RR→SP).
Demographic, clinical and adjusted a BL MRI volumes (as percentage of whole-brain volume) of 241 RRMS patients, and of the four subgroups: RR→RR, RR→SP, EDSS < 4 and EDSS > 4.

BL: baseline; MRI: magnetic resonance imaging; RR: relapsing–remitting multiple sclerosis; SP: secondary progressive; SD: standard deviation; FU: follow-up; AWM-f: abnormal white matter fraction; CSF-f: cerebrospinal fluid fraction; GM-f: gray matter fraction; EDSS: Expanded Disability Status Scale; DD: disease duration; IQ: interquartile. aAdjusted for age, gender and education.
ARR was available for 238/241 RR patients: The univariate analysis showed that the raw data of ARR had a negative correlation with age at disease onset (r = −0.22; p < .001), age at BL (r = −0.22; p < .001) and a positive correlation (r = 0.19; p < .003) with GM-f. The multivariate analysis on the log transformation of ARR showed only a significant correlation with age at disease onset (coef = –.02; t = −3.25; p < 0.001; CI –.033 to .008). No correlations were found between ARR and conversion from RR to SP and progression on the EDSS scale, while ARR was significantly higher in patients reaching EDSS 4 (0.33) than in patients who did not reach this outcome (0.22) (p < 0.001).
Median EDSS was 2.0 at BL and 3.0 at the end of FU (p < 0.001).
At BL therapy was β-interferon in 57.8%, glatiramer acetate in 4.6% and immunosuppressants in 5.6%; 32% patients were not under treatment.
At FU visit, 47.8% patients were treated with β-interferon, 11.5% with glatiramer acetate, 5.9% with natalizumab, 6.3% with other immunosuppressant drugs, 0.4% with fingolimod and 28% were not under treatment.
To evaluate the correlations between the complex treatment scenario and disease progression, we divided the whole population of RR patients into four subgroups according to the number of treatments during FU (none, one, two and > 2). The stepwise logistic regression showed that patients treated with > 2 drugs during FU had a significantly higher risk of progression compared to the not treated patients (respectively: RR → SP (OR 13.8; z = 2.34; CI 1.52–125.30); progression of EDSS (OR 4.96; z = 3.03; CI 1.76–13.99); achievement of the milestone EDSS 4 (OR 45.10; z = 3.31; CI 4.72–430.36).
Conversion from RR to SP disease course
Table 2 (right side, left columns) shows group differences between RR→RR and RR→SP.
The BL comparison of RR→SP to RR→RR patients showed for the second group: i) younger age (34 vs 38 years; p = 0.021); ii) lower EDSS (2 vs 3.3; p < 0.001 ), CSF-f (13.9 vs 17.1; p < 0.001) and AWM-f (0.6 vs 1.4; p = 0.002); iii) higher GM-f (52.1 vs 49.8 p < 0.001) and WM-f (33.2 vs 32.4; p = 0.02). The stepwise logistic regression for disease evolution at FU (RR→RR and RR→SP) showed an inverse correlation between GM-f and conversion RR→SP (OR .79; z = −3.49; CI 0.7–0.9), and a positive correlation between EDSS and conversion RR→SP (OR 2.88; z = 5.02; CI 1.9–4.36). In other words, for a 1% reduction of GM-f (i.e. 1% decrease of GM volume fraction) at BL there was a 20% increased probability of RR patients converting to SP, and for each one-point increase on the EDSS at BL there was a threefold increased probability of conversion to SP.
Progression of EDSS
The multivariate analysis for EDSS progression at FU, considering the binomial variable “worsening yes/no,” showed an inverse correlation between GM-f (OR 0.85; z = −3.47; CI 0.77–0.93) and EDSS progression such that a 1% reduction of GM-f at BL determined a 15% increased probability of disease progression.
Achievement of the milestone EDSS 4
Table 2 (right side, right columns) shows the group differences between RR patients reaching/not reaching the milestone EDSS 4.
At BL 222 patients had an EDSS < 4. During FU 73 patients (32.8%) reached EDSS 4, while 135 patients (61%) did not, and 14 patients (6.3%) reached EDSS ≥ 4 but did not stay stable on this score and were not included in the analysis. The univariate analysis showed that patients who reached the milestone during FU, compared to patients who did not, had: i) older age at BL (37 vs 33 years; p = .003); ii) higher AWM-f (1.2 vs 0.6; p = .005) and CSF-f (16 vs 13.7; p < .001); iii) higher EDSS (2.5 vs 2.0; p < .001) and DD (8 vs 6 years; p < .001); and iv) lower GM-f (50.3 vs 52.4; p < .001). The multivariate analysis regarding the achievement of EDSS 4 showed a significant inverse correlation with GM-f (OR 0.8; Z = −3.52; CI 0.7–0.9) and a positive correlation with EDSS (OR 2.7; z = 4.21; CI 1.7–4.2).
Time to reach the milestone EDSS 4
Survival analysis (Figure 1) showed that the median time to reach EDSS 4 was 60 months (minimum two months, maximum 108 months) with a one-point increase on the EDSS in three years in all 73 patients who reached the milestone; while considering only patients with a RR→SP course the increase was faster (one-point increase on the EDSS in two years). Furthermore, there was a different percentage of patients who reached EDSS 4 in the two groups: 25% in the RR→RR group and 95% in the RR→SP one. The multivariate analysis (dependent variable: time to reach EDSS 4; independent variables: age, AWM-f, CSF-f, GM-f, BL EDSS and DD) showed that the risk of reaching EDSS 4 was inversely correlated to GM-f (HR 0.88, z = −3.49; CI 0.82–0.94) and positively correlated to BL EDSS (HR 3.86; z = 3.85; CI 1.94–7.70).
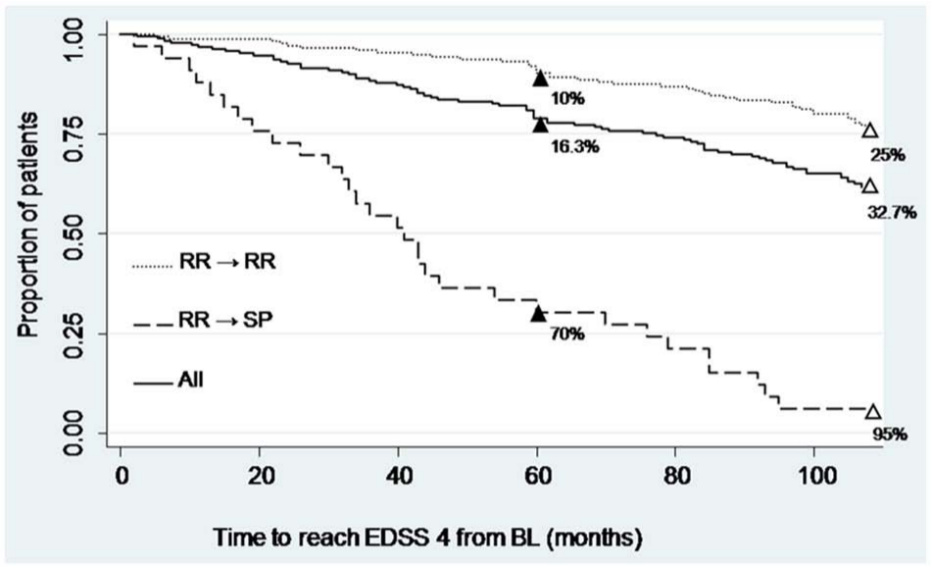
Kaplan-Meier survival analysis: Time to reach EDSS 4.
Discussion
In long-term FU studies several clinical predictors have been identified. In patients with a relapsing onset, higher age at disease onset, male gender, short interval between first and second relapse, high frequency of relapses, and disability at two or five years after onset, all were reported to be unfavorable predictors of long-term disease evolution.5–7,9 In terms of MRI metrics, several cross-sectional and longitudinal MRI studies have reported that T2 lesion load (LL) behaves as a moderate predictor of long-term disability.16,26,27 Contrariwise, T1LL, which is more difficult to standardize between different MRI raters and centers, correlates with disability more than T2LL.16,28
Most of the longitudinal MRI studies conducted so far, focused mainly on early MS, showed that the best predictors of disease progression are the number of gadolinium-enhancing lesions and the rate of GM atrophy over the first years of disease.12,17,21,27,29 Our large cohort of MS patients, not in the early phase of the disease and having a relatively low disability, is highly representative of a common MS outpatient population; in such a context, we aimed at assessing the predictive values of BL clinical data and single BL MRI examination.
None of the MRI parameters at BL showed to be predictive of the ARR at FU. On the other hand, in the univariate analysis ARR was positively correlated to GM-f; it may be hypothesized that patients with a more inflammatory disease may also have GM inflammation/edema as suggested by the higher GM volume.
Conversion to SP course, progression of EDSS and achievement and time to reach the milestone of EDSS 4 were all directly correlated to BL GM volume and (except for EDSS progression) to BL EDSS. Moreover, the milestone EDSS 4 was reached faster in RR patients who converted to SP.
Altogether these data indicate that EDSS and GM volume, respectively as clinical and paraclinical parameters, are the best predictors of disease progression when considering a general outpatient MS population. The fact that GM volume was the best predictor of disability highlights the relevance of selective neurodegenerative markers over more traditional WM inflammatory markers (such as T2LL) in predicting long-term disability.
The present findings consolidate and extend the observation made in previous studies that GM involvement correlates more strongly with measurement of physical disability than WM damage.20,30,31 Nevertheless, only a few long-term FU studies reported specifically on the predictive value of GM volume or damage on disability progression.18,19
The absence of a significant predictive value for the AWM-f in our MS population is in contrast with previous studies in which LL accrual showed a high predictive value in the first years after presentation, 12 while it is in agreement with other studies on MS patients with longer DD (more similar to our patients) showing that LL was less predictive of long-term disability.14,32
In the present study, BL EDSS was positively correlated to the risk of conversion from RR to SP as well as to the achievement and time to reach EDSS 4. These results are in agreement with a previous report 9 in which patients with a BL EDSS < 3 remained fully ambulatory after 10 years in contrast to patients with EDSS 3 through 5 who developed important gait limitations, with half of them requiring a cane over the 10-year period. In another eight-year FU of RR patients, 33 BL EDSS score was one of the significant clinical predictors of future disability.
Altogether our findings suggest that GM volume fraction is the best paraclinical predictor of disability, therefore measures of GM volume fraction will be the most appropriate to evaluate neuroprotective agents in MS clinical trials.
When considering the value of the present findings, it is important to take into account a few limitations: i) the high proportion of patients lost at FU. However, as seen in other long-term FU studies,16,18,33 the loss of more than 50% of patients is quite common; furthermore, in our study the absence of significant differences between the original cohort and the FU MS population attenuates this criticality; ii) the multicenter design of the study and the long-term FU might have negatively affected reliability of EDSS scoring and, therefore, the evaluation of disease progression. Notably, all the evaluating neurologists involved in the study were accustomed to participating in international clinical trials requiring EDSS neurostatus certification; iii) the use of two-dimensional instead of three-dimensional sequences acquired on a 1 Tesla MRI machine; iv) the use of the EDSS in assessing long-term progression of MS is less reliable at lower values (1.0 to 3.5), when interrater agreement is 70% within one EDSS point, compared with an interrater agreement of 80% within 0.5 EDSS point at higher EDSS scores (4.0 to 7.0).34,35 In addition, the EDSS is heavily weighted toward physical disability while MS-related cognitive deficits are largely underestimated. Nevertheless, EDSS is without doubt the most widely accepted measure in MS natural history as well as clinical trial studies; iv) the lack of data on cognitive impairment; vi) the lack of a thorough examination on patients’ treatment; v) the study design was retrospective, although enrolled patients were only those regularly followed at each MS center; vii) spinal cord atrophy, regional LL and cortical lesions could not be evaluated since available BL MRI data did not allow such measurements; vi) no post-contrast images were acquired; however, considering the relatively long DD in our MS cohort, this could be considered a minor caveat. It also has to be considered that the results could be affected by the choice of segmentation method; in the present study we used the MRI data acquired in the previous cross-sectional study, where the need for a fully automated procedure derived from the very large number of MRIs (about 700) to be evaluated.
On the other hand, we believe that the present study takes its advantages from the following relevant issues: i) the long FU; ii) the large cohort studied, representative of the general MS outpatient population; and iii) the application of the same MRI protocol to all patients together with a centralized MRI data analysis.
In conclusion, the present study clearly shows that BL GM volume and EDSS are the best predictors of long-term disease progression in RRMS patients with a relatively long and mild disease. It also confirms the limited contribution of WM damage to long-term disability in MS.
Footnotes
Acknowledgements
We thank Dr Valentina Panetta for providing general advice and technical help in statistical analysis.
Conflict of interest statement
L.L. and S.B. contributed equally to this manuscript.
Dr Lavorgna has received travel payment from Merck-Serono, Novartis and Biogen Idec.
Dr Bonavita has received travel payment from Merck-Serono, Novartis, Biogen Idec and Teva and honoraria for scientific lectures from Novartis.
Drs Ippolito, Valentino, Buccafusca, Paolicelli, d’Ambrosio and Alfano have nothing to declare.
Dr Lanzillo has received travel payment from Merck-Serono, Novartis, Biogen Idec, Schering-Plough and Teva.
Dr Salemi has received funding for a trip from Merck-Serono.
Dr Patti has received honoraria for scientific lectures from Biogen Idec.
Dr Coniglio has received funding for a trip from Novartis.
Dr Bresciamorra has received travel payment from Novartis, Biogen Idec, Schering-Plough and Teva.
Dr Savettieri has received travel payment from Teva and honoraria for scientific lectures from Biogen Idec.
Dr Zappia has received funding for a trip from Schering-Plough.
Dr Gallo has received travel payment from Biogen Idec and Schering-Plough and honoraria for scientific lectures from Biogen Idec.
Dr Simone has received travel payment from Merck-Serono.
Dr Tedeschi has received travel payment from Merck-Serono, Novartis, Biogen Idec and Teva and honoraria for scientific lectures from Novartis, Teva and Biogen Idec.
Funding
This research received no specific grant from any funding agency in the public, commercial, or not-for-profit sectors.
References
Supplementary Material
Please find the following supplemental material available below.
For Open Access articles published under a Creative Commons License, all supplemental material carries the same license as the article it is associated with.
For non-Open Access articles published, all supplemental material carries a non-exclusive license, and permission requests for re-use of supplemental material or any part of supplemental material shall be sent directly to the copyright owner as specified in the copyright notice associated with the article.