
Abstract
Based on current literature, it is not clear if multiple sclerosis (MS) patients are at increased risk to develop impaired glucose tolerance (IGT). Eighty-one MS patients and 45 healthy controls (HC) performed an oral glucose tolerance test. IGT was defined as a fasting glucose concentration of 6.1–6.9 mmol/l and two-hour post-load glucose of 7.8–11.1 mmol/l. The prevalence of impaired fasting glucose concentrations (17% vs 2%) and IGT (11% vs 0%) was higher in MS patients than HC. Accordingly, the areas under the glucose and insulin curves were higher in MS patients. The current study demonstrates an elevated IGT-prevalence in MS.
Introduction
Multiple sclerosis (MS) is often characterised by a more sedentary lifestyle compared to healthy controls (HC). 1 Although physical inactivity in HC is associated with an increased risk of impaired glucose tolerance (IGT), 2 contributing to the development of type II diabetes, existing MS-literature is conflicting, 3 with studies reporting an increased,4–6 similar 7 or decreased8,9 prevalence of IGT and type II diabetes in MS.
In addition, several studies reported only fasting glucose concentrations,10–13 which is insufficient to indicate IGT status since, according to the European Society of Cardiology, a two-hour oral glucose tolerance test (OGTT) is the preferable screening tool. Slawta and colleagues reported elevated fasting glucose concentrations in 8% of their female patients, which was similar to percentages reported for the general population. 10 However, they were not able to confirm these results in a second study, demonstrating normal fasting glucose concentrations. 11 Likewise, White et al. and Mähler et al. reported normal fasting glucose concentrations in small cohorts of MS patients.12,14 In addition, the latter stated that, after an OGTT, glucose tolerance was not impaired in 16 MS patients. 14 In contrast, Sternberg and colleagues reported lower glucose concentrations in MS patients compared to HC and found positive correlations between glucose concentrations and Expanded Disability Status Scale (EDSS) as well as the rate of clinical relapses. 13
In an attempt to clarify the heterogeneous results of the literature, the present cross-sectional controlled study aimed to investigate the prevalence of IGT, using an OGTT, in a large cohort of MS patients.
Methods
Eighty-one MS patients, diagnosed according to the McDonald criteria (EDSS 0.5–6.0) and >18 years, and 45 HC participated in this study, providing a ~2:1 match for gender, age and body mass index (BMI). Exclusion criteria were diabetes mellitus type II and glucose-lowering therapies, other disorders (cardiovascular, pulmonary, renal diseases and cancer), pregnancy, participation in other studies or an MS-exacerbation six months prior to the study. Participants gave written informed consent in accordance with the Declaration of Helsinki and the protocol was approved by the ethical committee (clinicaltrials.gov NCT01845896 and NCT01718392).
An OGTT (1 g glucose/kg body weight), including determination of blood glucose (Analox-GM7 Micro-stat) and serum insulin (Mercodia Insulin enzyme-linked immunosorbent assay (ELISA)) levels, was performed to investigate glucose tolerance. Whole-blood glucose concentrations were converted to plasma concentrations using a multiplier of 1.11. 15 IGT was defined by the World Health Organisation as a fasting plasma glucose concentration of 6.1–6.9 mmol/l and two-hour post-load plasma glucose of 7.8–11.1 mmol/l.Glucose and insulin responses were expressed as the total areas under the curve (tAUC), calculated according to the trapezoidal rule. Glucose tolerance was evaluated using the homeostasis model assessment of insulin resistance (HOMA-IR=fasting plasma glucose (mmol/l) × fasting serum insulin (mU/l)/22.5).
All data were analysed using SAS-9.2-software (SAS Institute Inc, Cary, NC, USA). First normality was checked using the Shapiro-Wilk test for all variables. Glucose and insulin profiles, based on repeated measures equidistant in time, were analysed by a mixed-model repeated-measures analysis of variance (ANOVA) to evaluate a possible disease-effect over time. tAUC and HOMA-IR between groups were analysed by an unpaired student’s t test. Categorical data were compared using Chi-squared and Fisher’s exact tests. Finally, a Pearson correlation analysis was performed. All data are presented as mean ± SEM and p<0.05 represents the threshold for statistical significance.
Results
Subject and disease characteristics are presented in Table 1.
Subject and disease characteristics.
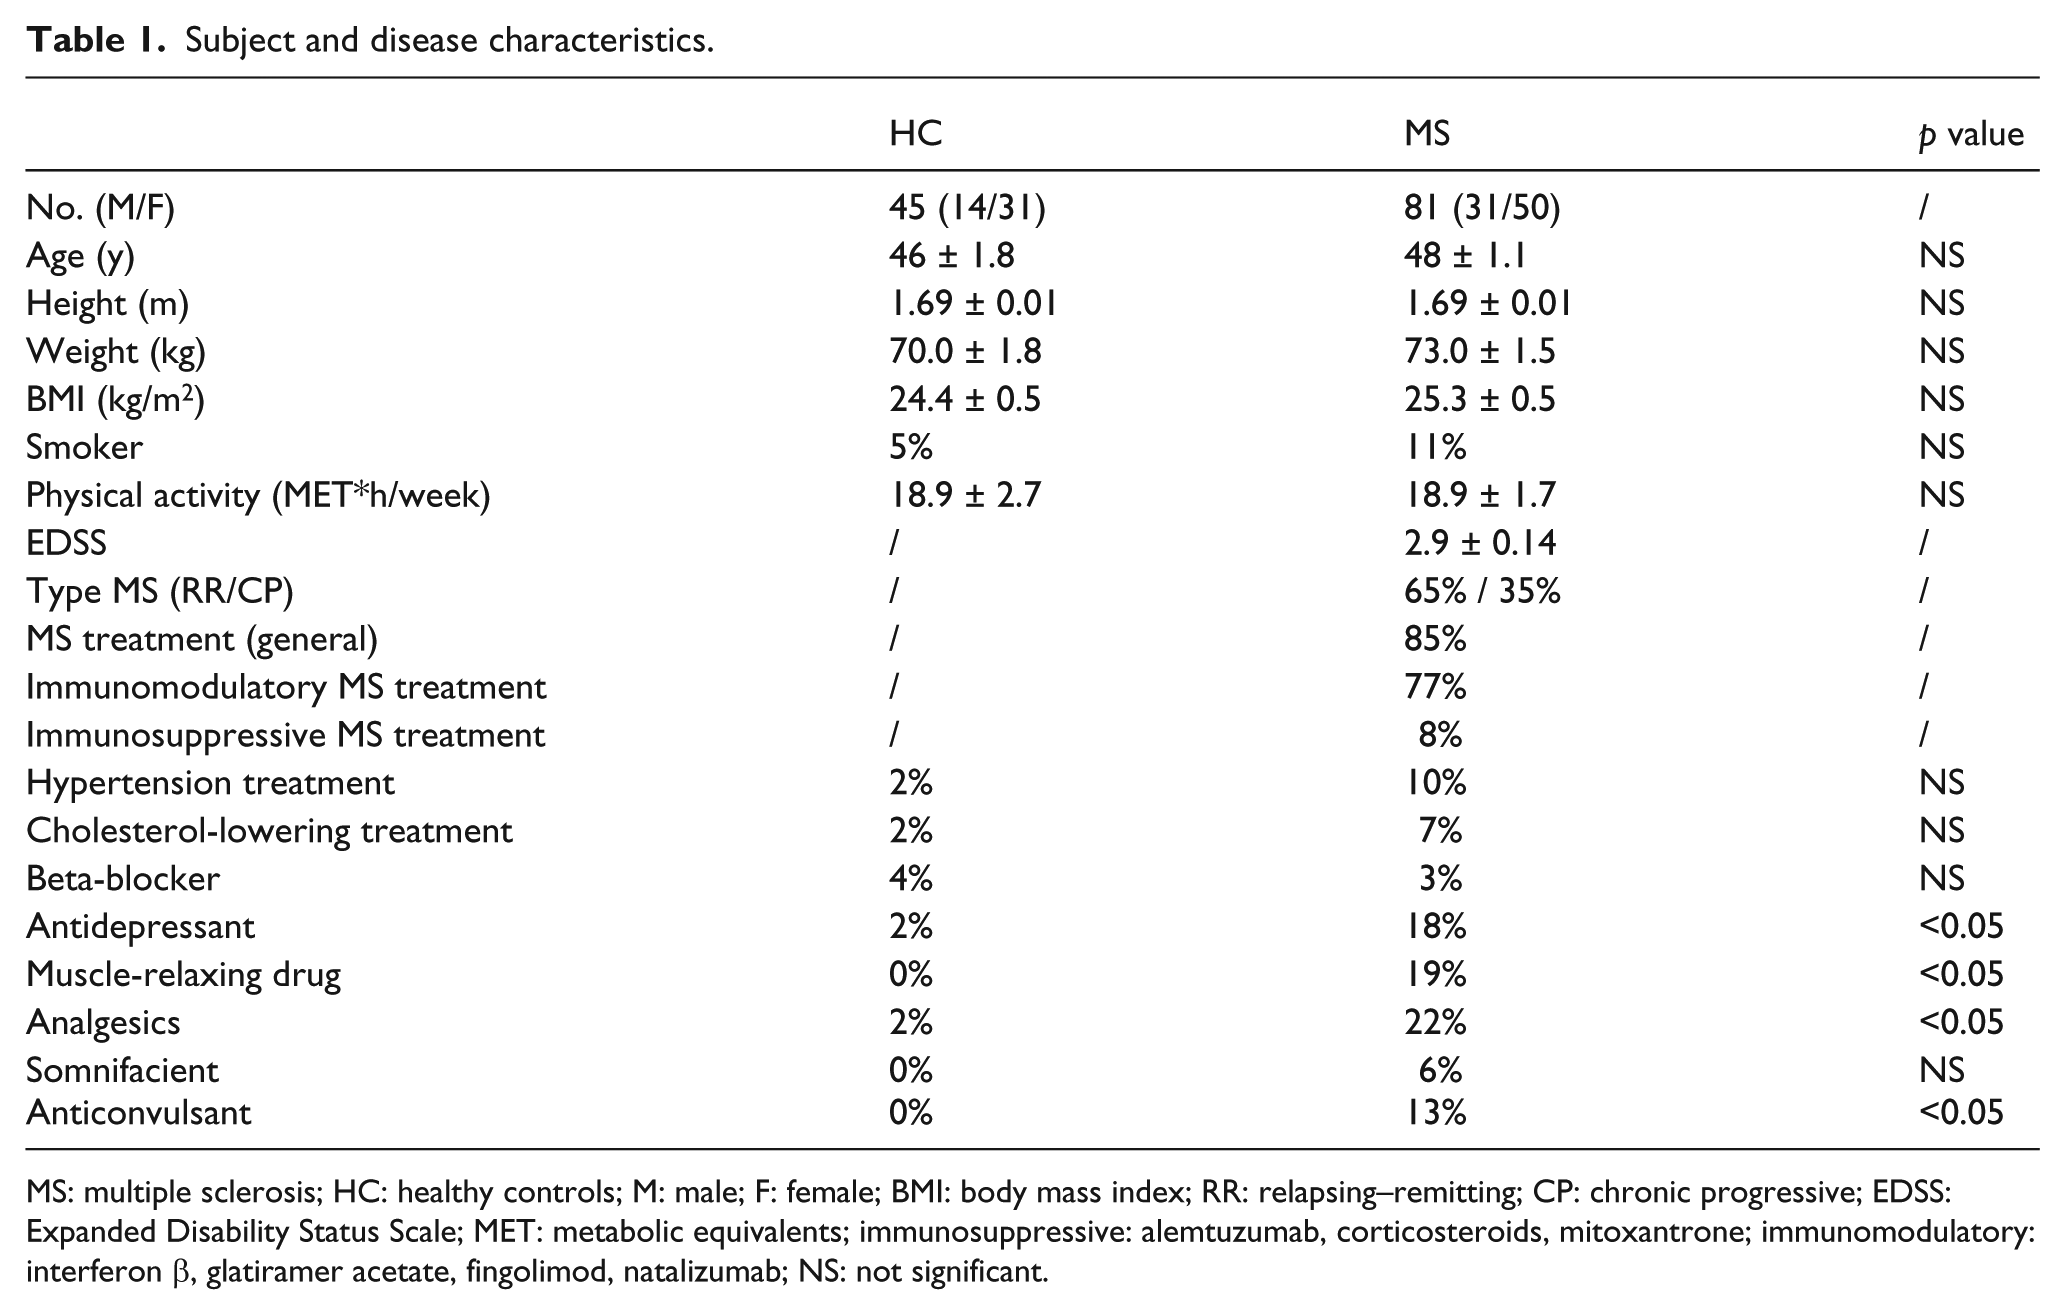
MS: multiple sclerosis; HC: healthy controls; M: male; F: female; BMI: body mass index; RR: relapsing–remitting; CP: chronic progressive; EDSS: Expanded Disability Status Scale; MET: metabolic equivalents; immunosuppressive: alemtuzumab, corticosteroids, mitoxantrone; immunomodulatory: interferon β, glatiramer acetate, fingolimod, natalizumab; NS: not significant.
Compared to HC, plasma glucose concentrations of MS patients were significantly higher at multiple time points during the OGTT (disease*time, p<0.05). In particular, 17% of the MS patients showed elevated fasting plasma glucose concentrations, compared to 2% of the HC (p<0.05). In addition, 5% of MS patients showed plasma glucose concentrations ≥11.1 mmol/l after two hours, while none of the HC displayed diabetic blood values (p=0.1). Furthermore, 11% of the MS patients and none of the HC showed IGT (p<0.05). Accordingly, glucose tAUC was higher in MS patients (p<0.05). Similarly, serum insulin concentrations (disease*time, p<0.05) and insulin tAUC (p<0.05, Figure 1) were higher in MS patients. Compared to HC, the HOMA-IR tended to be higher in MS patients (p=0.07).
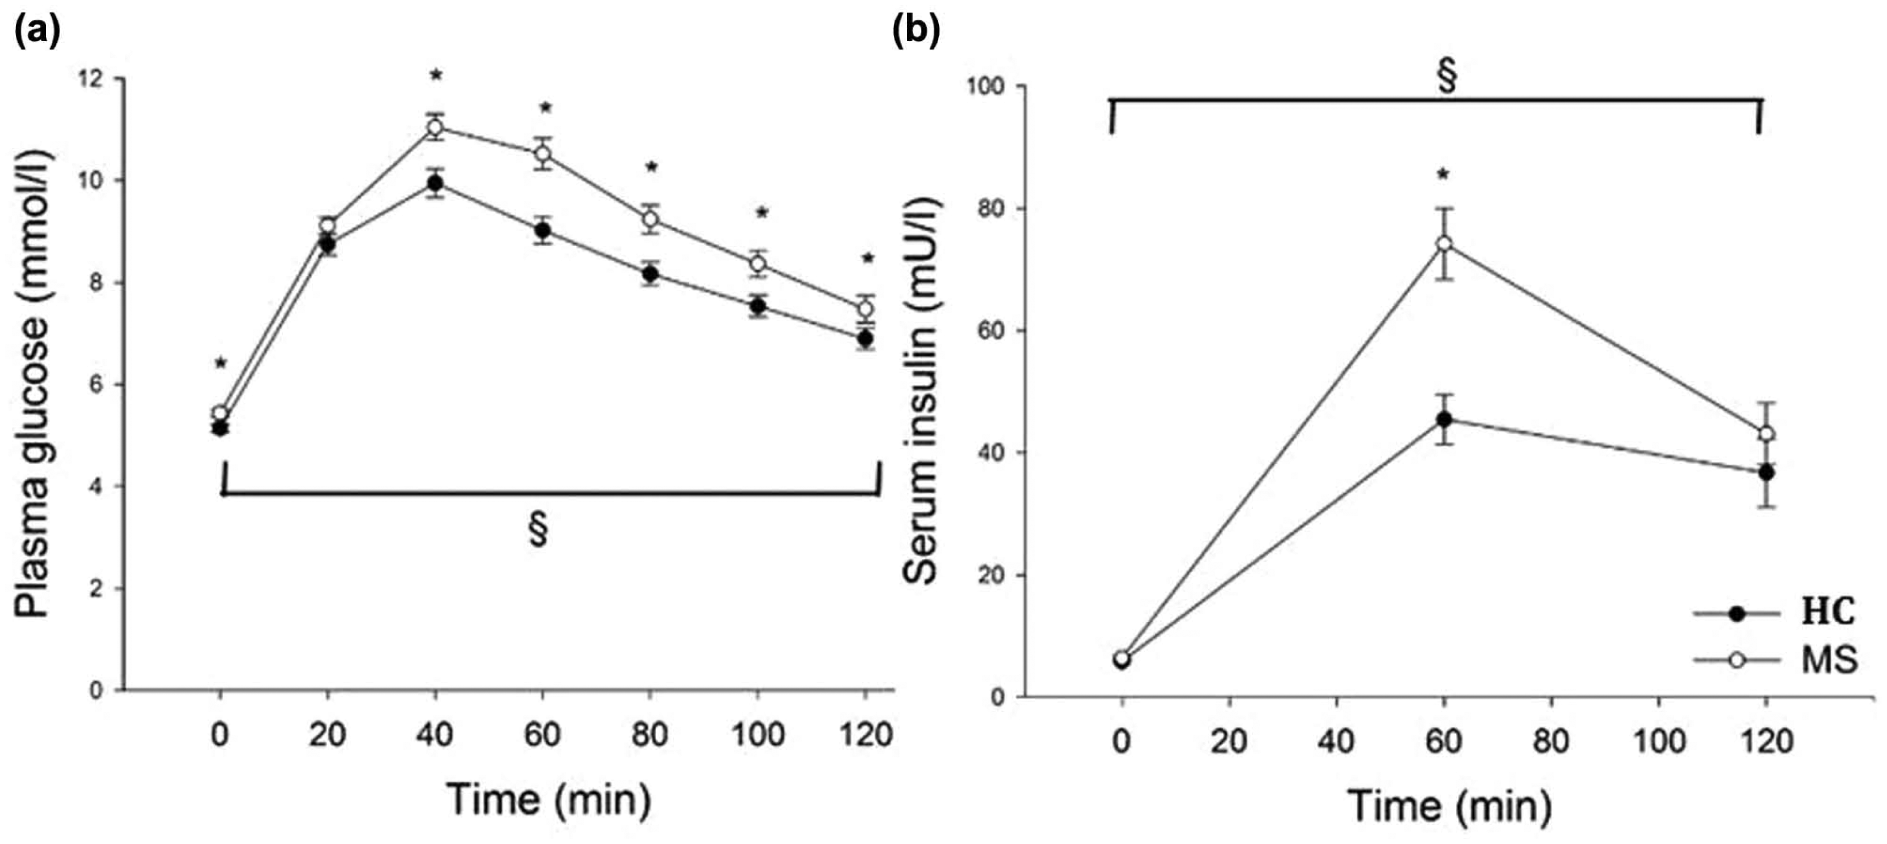
Plasma glucose (a) and serum insulin (b) concentration profiles of MS patients and HC after a two-hour OGTT (1 g glucose/kg body weight). Data are given as mean ± SEM.
Glucose and insulin tAUC of male and female MS patients were significantly higher, compared to their respective HC (p<0.05). Among HC and MS patients, glucose and insulin tAUC did not differ between sexes, albeit insulin tAUC of male MS patients was significantly higher compared to insulin tAUC of female MS patients.
Interestingly, glucose tAUC was higher in chronic-progressive MS patients, compared to relapsing–remitting patients (p<0.05), whereas insulin tAUC was comparable between both groups (p>0.05). Furthermore, MS patients with EDSS>3 had higher glucose and insulin tAUC than patients with EDSS≤3 (p<0.05). Accordingly, EDSS and glucose tAUC (r=0.32, p<0.0001) and EDSS and insulin tAUC (r=0.27, p<0.0001) were positively correlated. In MS, insulin tAUC correlated with BMI (r=0.24, p<0.005) and was significantly affected by gender (r=−0.26, p<0.0001), whereas glucose tAUC correlated only with age (r=0.45, p<0.0001). In HC, glucose tAUC correlated with BMI (r=0.24, p<0.005) and age (r=0.4, p<0.0001), whereas insulin tAUC correlated only with BMI (r=0.35, p<0.005).
Discussion
The present cross-sectional study compared the prevalence of IGT in 81 MS patients and 45 HC and observed a higher prevalence in the MS group.
To our knowledge, only one controlled trial showed that glucose tolerance was not impaired in 16 MS patients, contrasting the present work. 14 Age, gender, obesity, disease type of MS, physical disability (EDSS), medication and lifestyle factors, such as smoking or physical inactivity may be confounding factors in the development of IGT, affecting study outcomes.
Despite the different conclusion of the present study and the study of Mähler and colleagues, 14 there were no differences in age, gender and BMI. 14 However, differences in samples size (16 vs 81), MS-subtypes (relapsing–remitting vs all types), EDSS (median 2, range 1–4.5 vs median 3, range 0.5–6) and medication (glatiramer acetate vs several treatments) were detected. 14 Interestingly, our findings support a possible association between the glucose profile and MS-subtype, indicated by a less impaired glucose profile in relapsing–remitting patients compared to chronic-progressive patients. Furthermore, the impact of physical disability/EDSS on the glucose profile needs to be considered, given the correlation between glucose concentrations and EDSS. 13 In the present study, this was mirrored by higher glucose and insulin profiles in MS patients with EDSS>3, compared to patients with EDSS≤3.
The use of some disease-modifying therapies (DMT),6,16 as well as non-DMT, 17 could be associated with elevated blood glucose and/or insulin levels, which probably becomes more pronounced as the disease progresses. Noteworthy, none of our participants were treated with glucocorticoids, while MS patients used significantly more antidepressants, muscle-relaxing drugs, analgesics and anticonvulsants, than HC.
Since physical inactivity directly contributes to the cascade of events that leads to the ‘exercise-deficient phenotype’, resulting in reduced insulin sensitivity and glucose intolerance, 2 the overall daily activity level might also affect the glucose and insulin profiles in MS. However, in the present study, the self-reported level of physical activity did not differ between MS patients and HC, when measured by the Physical Activity Scale for Individuals with Physical Disabilities (PASIPD) questionnaire. Furthermore other lifestyle factors, including smoking, were comparable between MS patients and HC. Finally, since the skeletal muscle is the most important site of glucose disposal, intramyocellular mechanisms, such as decreased insulin signalling/sensitivity and disturbed muscle energy metabolism, independent of inactivity per se, may also contribute to IGT in MS and warrants further research.
In conclusion, under the conditions of the present study and compared to HC, we demonstrated a higher prevalence of IGT in MS patients, emphasising the need for adjusted guidelines for future patient management and follow-up.
Footnotes
Acknowledgements
We thank all MS patients, as well as healthy controls, for participating in this study. Our gratitude goes to Anne Bogaers for logistical assistance and blood sample collection and to Niel Hens for statistical advice. Biological material obtained for this study is stored in the University Biobank Limburg.
Conflicts of interest
Ulrik Dalgas has received research support, travel grants and/or teaching honoraria from Biogen Idec, Merck Serono and Sanofi Aventis and further serves as PI for the ongoing Biogen-sponsored ACTIMS study.
Funding
Nathalie Cools holds a postdoctoral fellowship of the Fund for Scientific Research (FWO) Flanders.