
Abstract
Metabolomics enables the provision of sensitive bio-markers of disease. We performed 800 MHz 1H-nuclear magnetic resonance (NMR) spectroscopic analyses of cerebrospinal fluid (CSF) specimens to identify biomarkers of multiple sclerosis (MS), yielding reproducible detection of 15 metabolites from MS (n=15) and non-MS (n=17) patients. Mean levels of choline, myo-inositol and threonate were increased, whereas 3-hydroxybutyrate, citrate, phenylalanine, 2-hydroxyisovalerate and mannose were decreased in MS-derived CSF (p<0.05), suggesting alterations to energy and phospholipid metabolism. Multivariate hierarchal cluster analysis indicated a high correlation within the metabolite profiles, significantly clustering samples into the two clinical groups, which was corroborated using principal components analysis. CSF metabolomics have the capacity to yield quantitative biomarkers and insights into the pathogenesis of MS.
Introduction
Currently, diagnosis of MS is based on clinical criteria including signs and symptoms, magnetic resonance imaging (MRI), lumbar puncture to identify inflammatory proteins, and excluding other disorders; 1 for many patients, this process can take months. The lack of a single predictive or diagnostic test at most stages of MS disease remains a major obstacle to patient-oriented care. Metabolomics is the systematic study of the complement of small molecules (metabolites) in a given biological system. 2 Metabolites represent the final end product of the convergence between gene expression and concurrent environmental stimuli, yielding specific molecular signatures of phenotypes. Cerebrospinal fluid (CSF) provides a unique opportunity to investigate the interface between blood and the CNS tissue. Nuclear magnetic resonance (NMR) spectroscopy is one of several metabolomic platforms, offering the key advantages of being quantitative and highly reproducible while also detecting a range of metabolites within a sample.
Several studies have applied NMR-based CSF metabolomic profiling to identify MS-specific biomarkers.3–8 While all the studies reported significant differences in specific metabolite concentrations, cross-study results have been inconsistent due to MS disease heterogeneity as well as technical and chemometric limitations. To date, published data have been acquired using lower field strength NMR spectrometers with only two studies reporting multivariate data analyses.7,8 We hypothesized that by using higher field strength NMR spectroscopy (800 MHz), stringent inclusion criteria for metabolites (discarding metabolites with >10% missing values), and multivariate data analysis techniques, a more robust CSF metabolic profile of MS could be established. Herein, we report the quantification of metabolites in CSF from MS and non-MS patients; unsupervised cluster analyses revealed a strong discriminatory metabolomic profile distinguishing the specimens by clinical diagnosis.
Materials and methods
CSF samples
CSF was collected with consent and prior to treatment, centrifuged and stored at −80ºC within two hours of collection in the Northern Alberta Multiple Sclerosis Care and Research Clinic Laboratory. Diagnosis of MS was predicated on the McDonald criteria with Expanded Disability Status Scale (EDSS) score ranging from 1.0–6.0 9 and included patients with relapsing–remitting (RR), secondary progressive (SP) MS as well as clinically isolated syndrome (CIS). These studies were approved by the University of Alberta Ethics Committee (Health Ethics Board PRO2291).
1H-NMR spectroscopy and data analysis
One-dimensional 1H-NMR spectra of undiluted CSF specimens were acquired on an 800 MHz Varian Inova spectrometer (Varian Inc., Palo Alto, USA) using standard protocols, as previously described. 10 Spectra were analyzed using Chenomx NMR Suite Professional software v5.1 (Chenomx Inc., Edmonton, Alberta, Canada). Metabolomic data were probabilistic quotient normalized (PQN) to equalize signal intensities to a reference profile. Data were log10 transformed and peak autoscaled. Metabolites with >10% missing values were removed; no metabolites were unique to a single group. One-way analysis of variance (ANOVA) tests determined mean differences of individual metabolites between MS and non-MS samples. Unsupervised two-way Agglomerative hierarchical cluster analysis (HCA) assessed multivariate similarities between individual’s metabolomic profiles. This algorithm used a multivariate Euclidean distance metric and Ward’s group linkage. The results were displayed as a heat map (blue=low intensity, red=high intensity) with associated cluster dendrograms; the lower the linkage in the dendrogram, the more similar the feature. Principal components analysis (PCA) was performed to investigate multivariate variance in the data. Highly correlated metabolite variables were projected onto a smaller set of linearly uncorrelated variables called principal components (PCs). For both the HCA and PCA, data were log transformed and autoscaled. Analysis was performed using MATLAB v8.0, with the Statistics Toolbox, (Mathworks, Cambridge, UK) using standard protocols.
Results
MS (RR-MS, n=11; SP-MS, n=3; CIS; n=1) and non-MS (n=17; multiple diagnoses) CSF specimens were analyzed (Table 1). Age and gender distributions were similar between the two clinical groups. About 50 metabolites were expected to be identified using 1H-NMR spectroscopy 11 and 15 were of sufficient concentration to be reproducibly detectable (Supplementary Material, Figure 1). These metabolites included those central to energy, biogenic amine, and phospholipid metabolism (Figure 1(a)); eight differed significantly between the two groups (p<0.05). Citrate, 3-hydroxybutyrate, phenylalanine, 2-hydroxyisovalerate, and mannose were significantly diminished in MS patients; choline, myo-inositol, and threonate were significantly increased in the same clinical group. Using the Benjamini and Hochberg 12 procedure for controlling the false discovery rate (FDR): out of 15 tests, nine were significant using a FDR of 0.1 (Supplementary Material, Table 1). The HCA grouped patients into clusters based on metabolomic profile similarity (Figure 1(b)). These trends were not associated with matching CSF cell counts and protein levels. The greatest degree of similarity was found to be within each clinical group. By using the HCA “sample” dendrogram (y-axis) as a classifier, a contingency table was constructed such that 26 of the 32 specimens were correctly associated with their disease class; leaving five false positives and one false negative, translating into a sensitivity of 93% and specificity of 71%.
Clinical features of multiple sclerosis (MS) and non-MS patients.
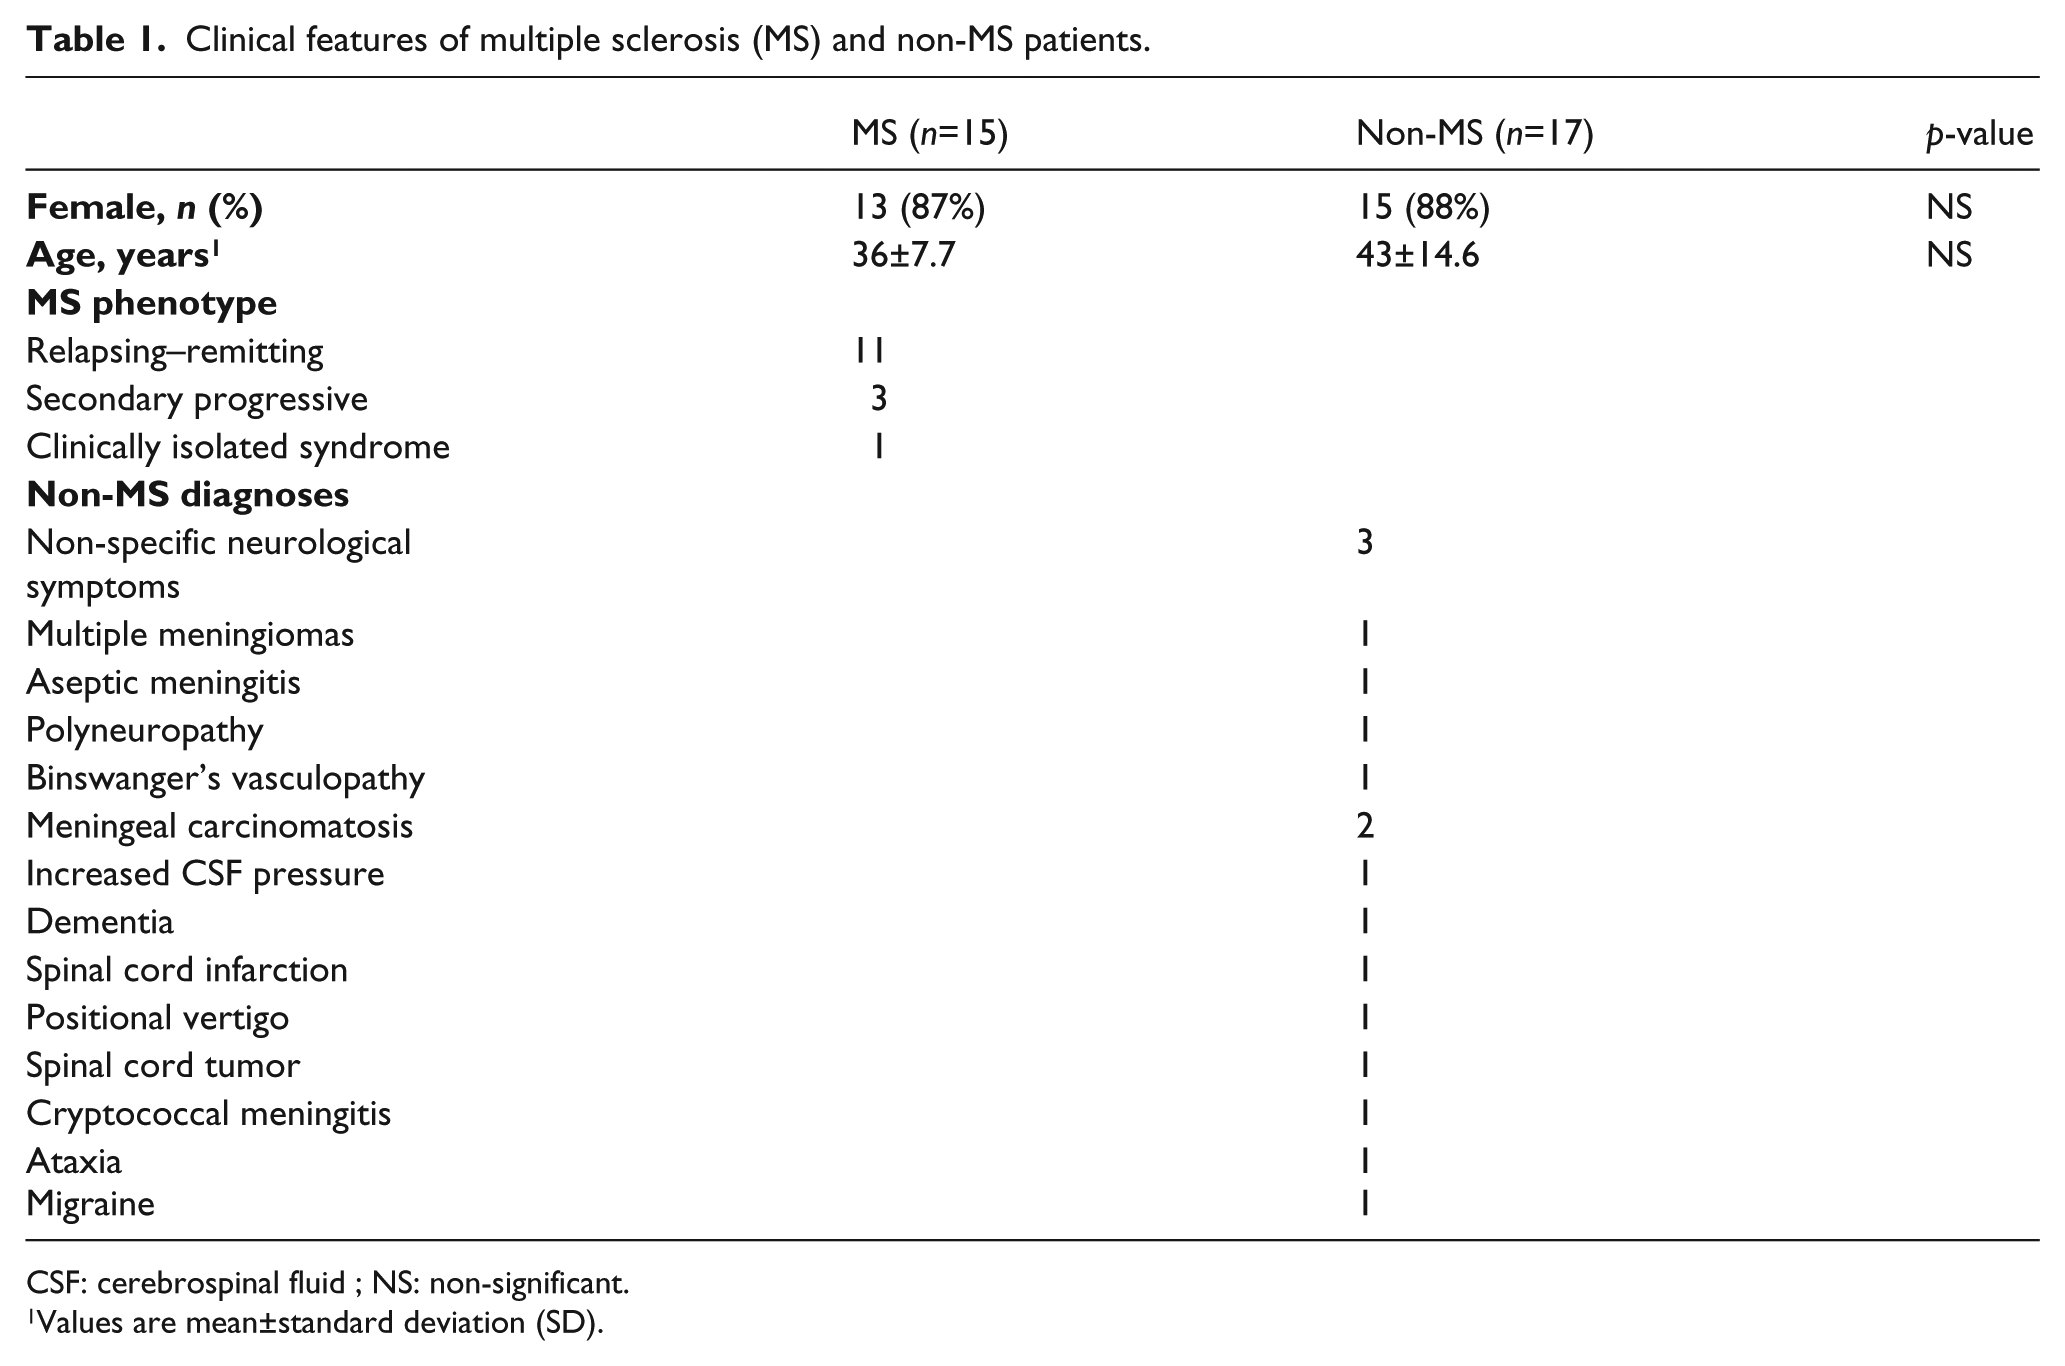
CSF: cerebrospinal fluid ; NS: non-significant.
Values are mean±standard deviation (SD).
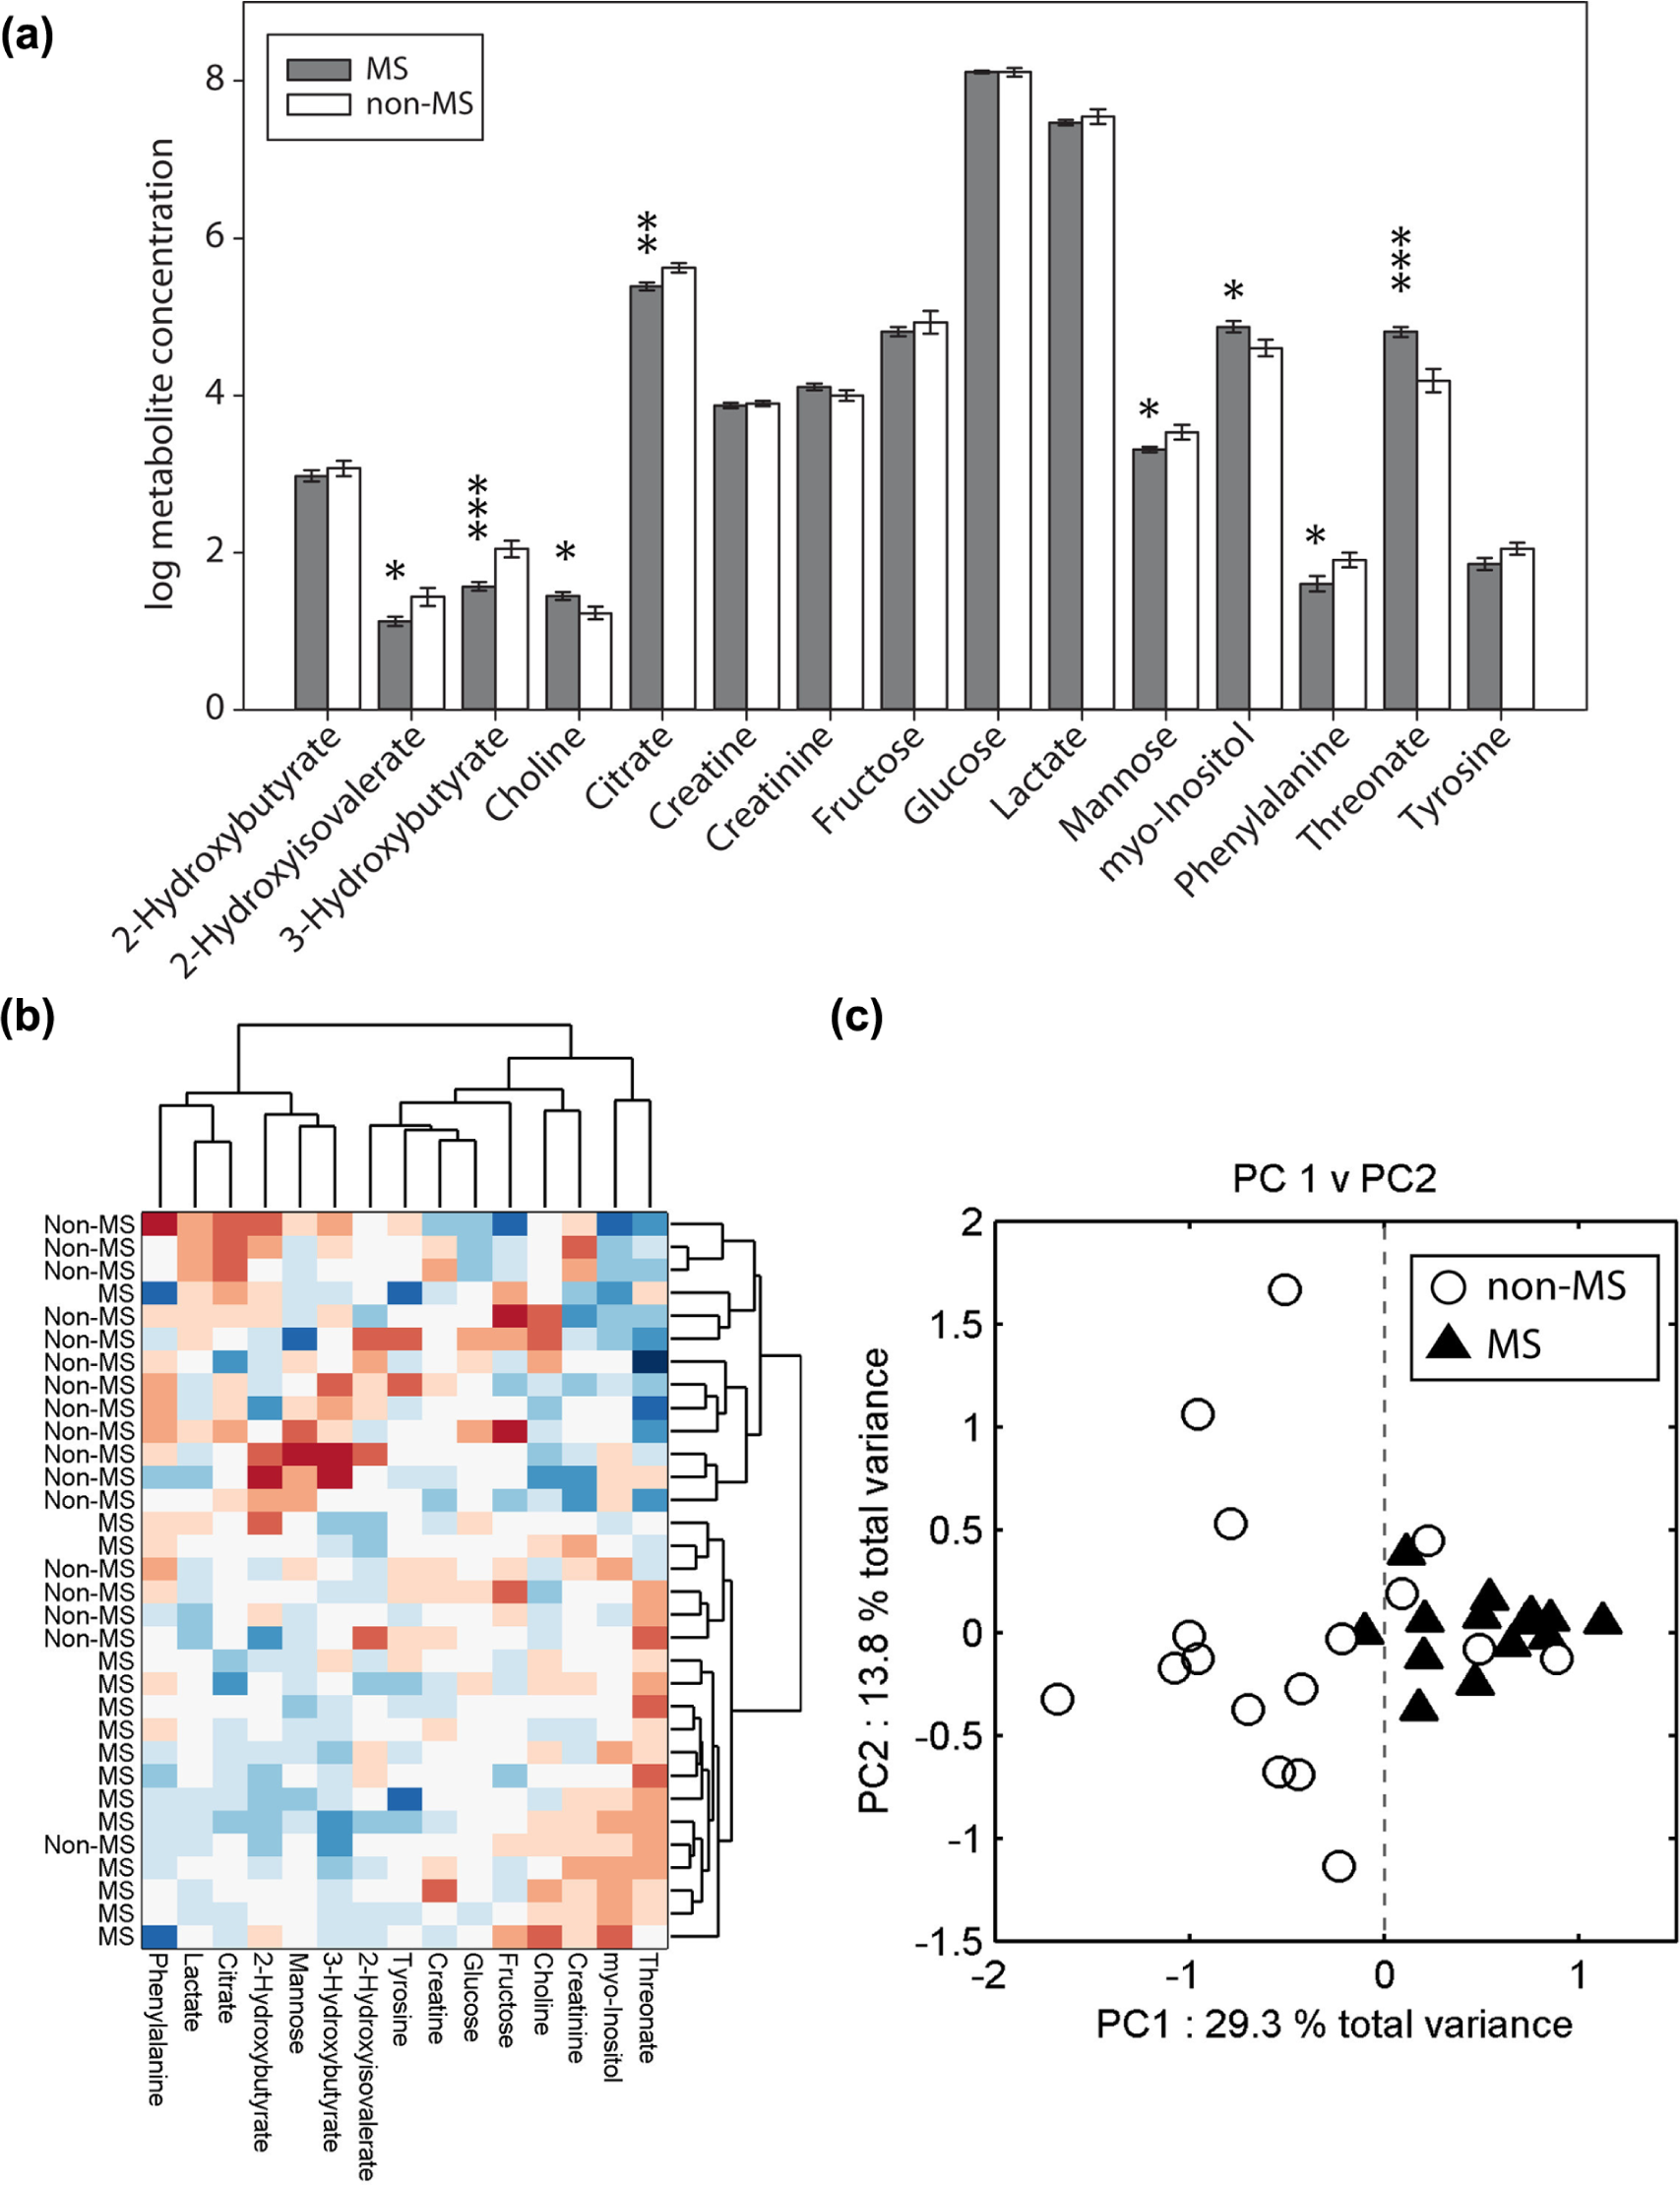
Chemometric analysis of cerebrospinal fluid (CSF) metabolomes. (a) Mean metabolite concentrations (±standard error of the mean (SEM)). Data were log transformed from μM units; normality of residuals was confirmed using the Lilliefor test. Grey bars; multiple sclerosis (MS) and white bars; non-MS. *p<0.05; **p<0.01; ***p<0.001. (b) Hierarchal cluster analysis (HCA), presented as a heat map with associated cluster dendrograms clustered first with respect to sample profiles and then to metabolite peaks. The lower the linkage in the hierarchical tree, the more similar the feature. HCA reveals that patients cluster into the two predefined clinical classes with a sensitivity of 93% and specificity of 71%. Red; positive correlations and blue; negative correlations. (c) Principal components analysis (PCA) projected highly correlated metabolite variables (n=15) onto a smaller set of linearly uncorrelated variables called principal components (PCs). The PCs represent the distribution of maximum variance in the multivariate data (each point representing a single sample). Clustering of data in the plot of the 1st versus 2nd PCs indicates strong correlation between associated metabolite profiles. The first principal component (PC1) explains 29.3% of variance in the data, revealing that the mean profiles of MS and non-MS CSF are significantly different (p<0.001). The dotted line represents the arbitrary decision boundary. PC2 explains an additional 13.8% variance in the data (White circles; non-MS and black triangles; MS).
To determine if the multivariate correlation between MS and non-MS metabolite profiles could separate the two clinical groups, PCA was performed (Figure 1(c)). The first principal component (PC1) explained 29.3% of total variance; this PC revealed that the mean MS and non-MS profiles were significantly different (p<0.001). Additionally, using PC1 as a classifier (threshold set to PC1 score equal to zero) resulted in only four non-MS specimens and one MS specimen being misclassified. PC2 explained an additional 13.8% variance in the total data, revealing that non-MS profiles exhibited a greater degree of within-group variance than MS. Supplementary Material, Figure 2 and Supplementary Material, Table 1 show the contributions of each metabolite to the MS versus non-MS discrimination in PC1, and corroborate the univariate results.
Discussion
To date, a reproducible MS-specific metabolomic profile remains to be identified. This study combined high field NMR spectroscopy with rigorous metabolic inclusion criteria and multivariate data analysis techniques, enhancing the value of metabolic information derived from CSF. Univariate analysis revealed eight significantly changed metabolites in MS patients. Multivariate analysis revealed that the specimens were most metabolically similar to those of the same clinical group and that the profile means were significantly different from each other (Figure 1), thus highlighting the potential for metabolic diagnostic biomarkers of MS.
While variability across previous reports has been largely attributed to disease heterogeneity, specific metabolite trends have consistently identified energy metabolites in general as being important biomarkers of MS. Multivariate analysis of the present data corroborates these findings and supports the growing evidence linking mitochondrial and energy metabolism dysregulation with MS disease pathogenesis. 13 Along with three previous studies,4,5,8 we report significantly reduced citrate in MS patients (Figure 1(a)). Regenold et al. 14 (using gas chromatography-mass spectrometry (GC-MS)) and Nicoli et al. 4 have also shown significantly increased lactate in MS patients. While lactate is not significantly different in the present study, multivariate HCA analysis shows that it is highly correlated with citrate (Figure 1(c)). Sinclair et al. 8 also report significantly reduced oxaloacetate in MS patients. Increased lactate, with decreased citric acid cycle intermediates (citrate, oxaloacetate), indicates an increased reliance on glycolysis and diminished mitochondrial energy generation. Although using GC-MS rather than NMR for analysis, Regenold et al. 14 also reported significantly increased myo-inositol in RRMS patients. Magnetic resonance spectroscopy (MRS) studies have also shown increased lactate, choline, and myo-inositol in MS patient brains. 15 Interestingly, our high-performance liquid chromatography (HPLC) analysis of CSF from MS and non-MS patients showed no significant differences in amino acid levels between groups (Supplementary Material, Table 2), highlighting the utility of NMR in MS.
This study shows that by using higher field strength 1H-NMR spectroscopy, stringent inclusion criteria, and exploratory multivariate data modeling methods, MS and non-MS patients can be discriminated by group with a high level of significance. While this study requires validation with greater sample sizes, it demonstrates the potential for a metabolomic profile-based diagnostic strategy for multiple sclerosis.
Footnotes
Funding
The present studies were supported by grants from the Multiple Sclerosis Society of Canada (CP), Alberta Innovates Health Solutions Collaborative Research and Innovation Opportunities (CP and DIB), Canadian Institutes of Health Research (BDS, #37769), the Bud and Lorna Atkin Endowment Fund for MS Research (IC and KGW) and the Barrhead-Fort Assiniboine Endowment Fund for MS (IC and KGW).
Conflict of interest
DIB holds salary support from Pfizer Canada. SNR held a Multiple Sclerosis Society of Canada Postdoctoral Fellowship. CP holds a Canada Research Chair (T1) in Neurological Infection and Immunity. The other authors have no conflicts of interest.
References
Supplementary Material
Please find the following supplemental material available below.
For Open Access articles published under a Creative Commons License, all supplemental material carries the same license as the article it is associated with.
For non-Open Access articles published, all supplemental material carries a non-exclusive license, and permission requests for re-use of supplemental material or any part of supplemental material shall be sent directly to the copyright owner as specified in the copyright notice associated with the article.