
Abstract
We assess two modified guidelines for monitoring patient safety in multiple sclerosis (MS) trials. These guidelines flag patients with an increase in contrast enhancing lesion (CEL) count above a threshold over the CEL level 1–2 months earlier. We compare the new guidelines to the original guideline where the threshold is set according to the baseline by applying the guidelines to two previous studies. The odds ratios of a subsequent clinical relapse associated with meeting the CEL threshold based on the modified guidelines are similar to those based on the original guideline. There is a need for patient and cohort specific monitoring procedures.
Keywords
Introduction
A safety guideline commonly used by Data Safety Monitoring Boards of multiple sclerosis (MS) clinical trials is to flag patients who, on a follow-up scan, have an increase of five or more contrast enhancing lesions (CELs) above the patient’s baseline level (“Rule of Five”).1,2 Elevated CEL counts meeting this guideline are associated with an increased risk of relapse in the subsequent 28 days.1,2 However, the sensitivity (i.e. the rate of meeting the threshold among those who had a subsequent relapse) can be low (under 0.30 for all thresholds considered in the previous study). 1 As the follow-up time point becomes further removed from the baseline, an increase relative to the patient’s baseline level might also become less relevant. We assess the performance of two modified guidelines based on CEL count increases relative to recent scans.
Materials and methods
We refer to the original guideline as G1 where the threshold is set relative to the baseline level. The two modified guidelines are:
G2: the threshold is set relative to the most recent prior scan.
G3: the threshold is set relative to the average CEL counts on the two prior scans.
Using a threshold of five as an example, if the CEL count of a patient at the third visit is ≥5 above the CEL count on the patient’s second visit, this patient meets the guideline G2 at the third visit. A patient meets the guideline G3 at the third visit if the CEL count at this visit is ≥5 above the average CEL count on the patient’s first and second visits. In lieu of a missing CEL count at a previous visit, we use the last available count. We investigated threshold values from 1–15.
We applied these guidelines to the same Phase II trials assessed previously. 1 Cohort 1 consists of 167 relapsing patients. 3 Cohort 2 consists of 185 secondary progressive (SP) patients. 4 Patients from both studies had magnetic resonance imaging (MRI) visits at screening, baseline and every four weeks for 24 weeks. The clinical visits for relapse assessment roughly coincided with the MRI visits and there was at least one clinical visit after 24 weeks. This study was approved by the University of British Columbia Clinical Research Ethical Board. All patients gave written informed consent for the original studies.
As individual relapses must be at least 28 days apart, a patient currently experiencing a relapse will not experience another one within the pre-specified time frame. Hence, we excluded any MRI visit occurring during a relapse when assessing the association between meeting the guideline and the relapse risk within 28 days. This criterion is only applied to the relapsing cohort since the relapse end dates for the SP cohort are unknown.
Unadjusted odds ratios (ORs), sensitivity and specificity for a subsequent relapse summarize the association between meeting the guideline and the 28-day relapse risk. To adjust for other factors, we applied a logistic regression model with patient-specific random intercepts. In addition to the indicator of meeting the threshold, the model is also adjusted for
Time of visit for cohort 1, and
baseline CELs, SP duration, and relapses in the past two years for cohort 2.
These predictors were selected using backward selection based on the Akaike information criterion prior to including the indicator of meeting the threshold. We also investigated whether meeting these guidelines is associated with disability progression as measured by the Expanded Disability Status Scale (EDSS). The analyses for the three guidelines are conducted separately for each of the two cohorts.
Results
The two modified guidelines tended to identify the same patients as the original guideline (Supplementary Material, Web Tables 1 and 2). Table 1 reports the relapse rates, crude and adjusted ORs, sensitivity and specificity for selected thresholds. The relapse rates of the concordant and discordant cases for the original and modified guidelines based on a threshold of 5 are reported in Supplementary Material, Web Table 3. For the relapsing cohort, Figure 1 (left panel) shows a steady increasing trend in the crude ORs across thresholds 1–10, where the performance of the three guidelines are similar; for thresholds >10 the crude ORs for G2 and G3 are larger than for G1. For the SP cohort, the crude ORs increase steadily across thresholds 1–6 and the three guidelines perform similarly in predicting impending relapses (Figure 1, right panel); for thresholds >6, the crude ORs for G1 and G2 do not increase further, while those for G3 are slightly higher.
Rates of 28-day subsequent relapse and odds ratios (ORs) by threshold (TH).
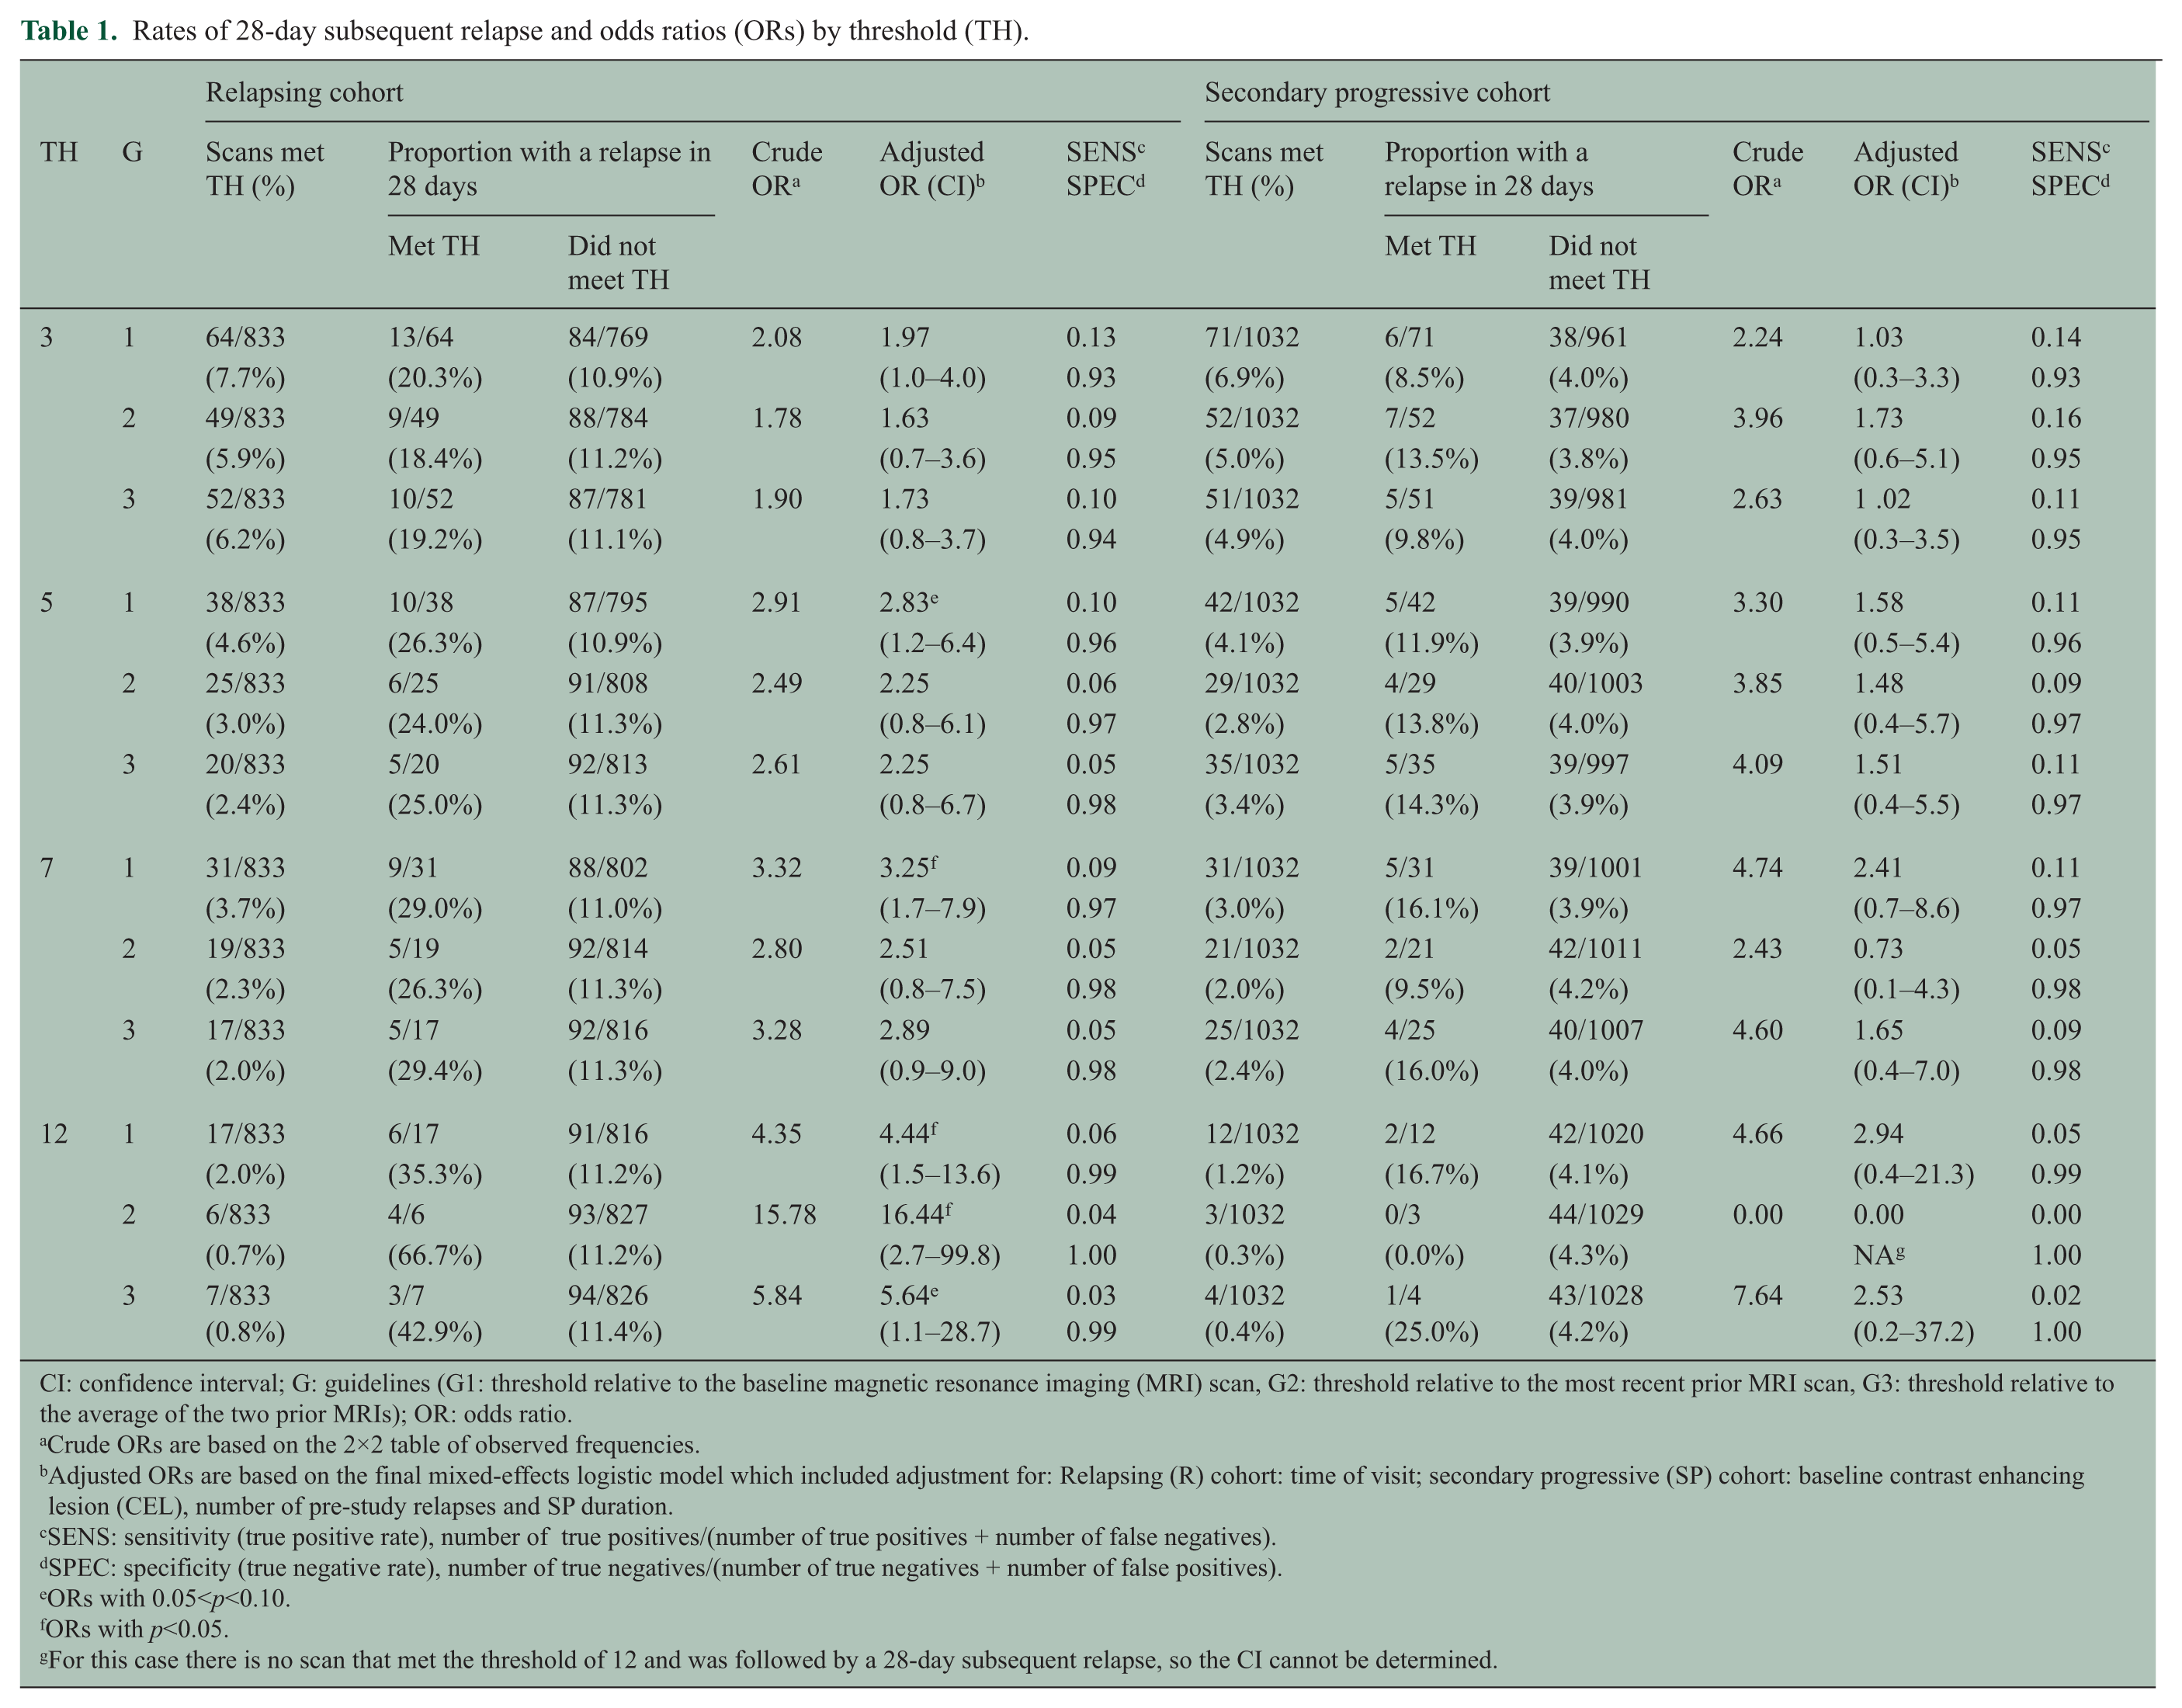
CI: confidence interval; G: guidelines (G1: threshold relative to the baseline magnetic resonance imaging (MRI) scan, G2: threshold relative to the most recent prior MRI scan, G3: threshold relative to the average of the two prior MRIs); OR: odds ratio.
Crude ORs are based on the 2×2 table of observed frequencies.
Adjusted ORs are based on the final mixed-effects logistic model which included adjustment for: Relapsing (R) cohort: time of visit; secondary progressive (SP) cohort: baseline contrast enhancing lesion (CEL), number of pre-study relapses and SP duration.
SENS: sensitivity (true positive rate), number of true positives/(number of true positives + number of false negatives).
SPEC: specificity (true negative rate), number of true negatives/(number of true negatives + number of false positives).
ORs with 0.05<p<0.10.
ORs with p<0.05.
For this case there is no scan that met the threshold of 12 and was followed by a 28-day subsequent relapse, so the CI cannot be determined.
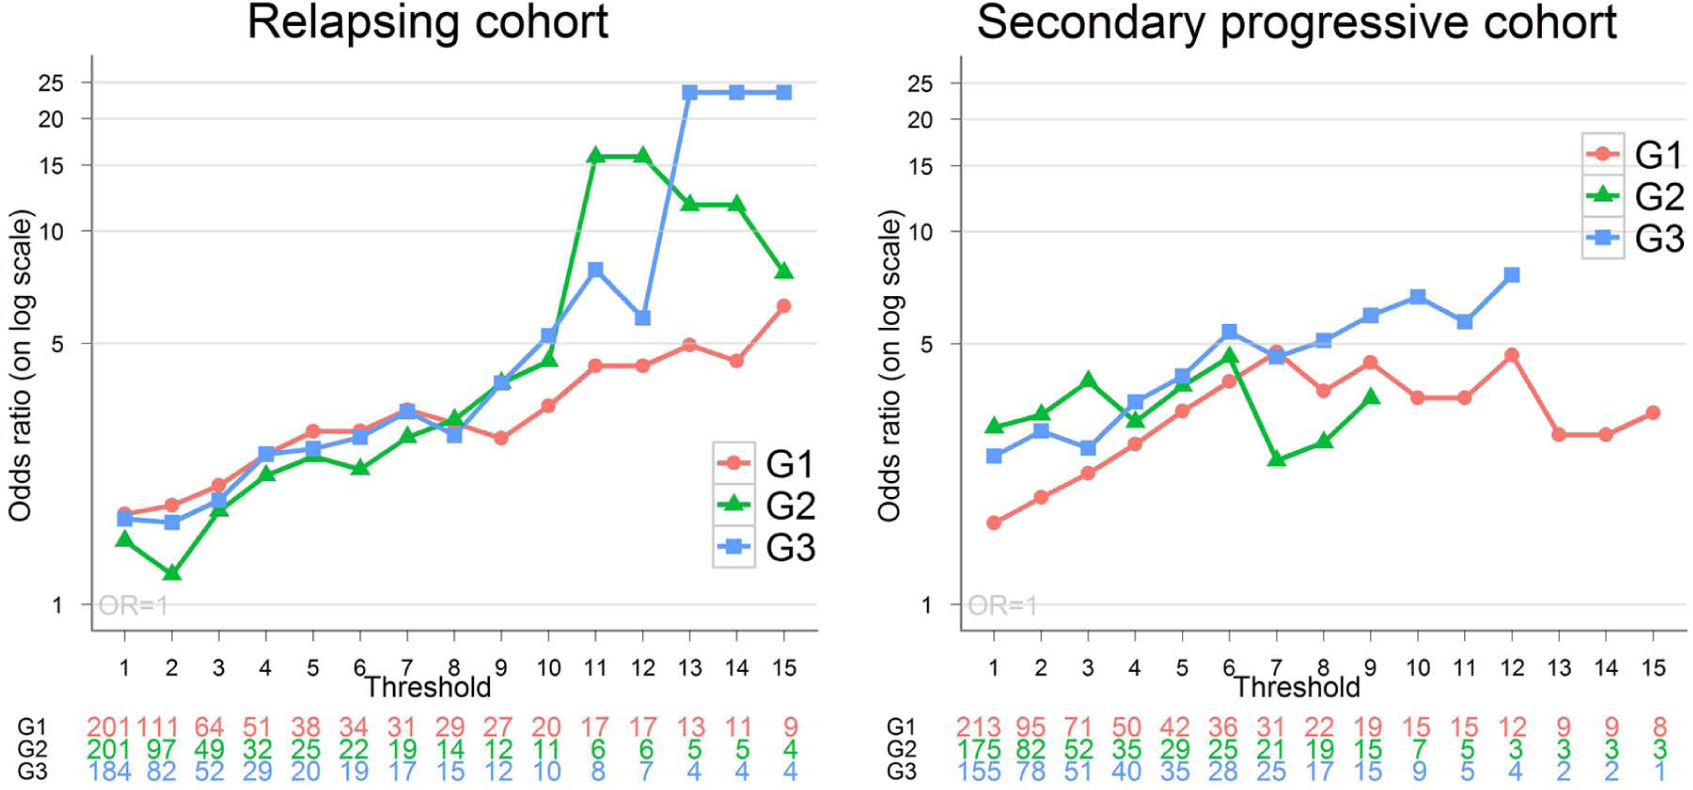
Crude odds ratios (ORs) (on log scale) of a 28-day subsequent relapse (for meeting vs not meeting the contrast-enhancing lesion (CEL) threshold). G1: threshold relative to the baseline magnetic resonance imaging (MRI) scan, G2: threshold relative to the most recent prior MRI scan, G3: threshold relative to the average of the two prior MRIs. The counts below the figures report the number of scans that met the threshold for each guideline. For threshold 10–15 (based on G2) and threshold 13–15 (based on G3), the log OR is infinite because, among patients who met the threshold, none had a relapse. The patterns for the adjusted ORs (based on a logistic regression with patient-specific random effects and adjustment for risk factors) are similar.
In summary, for both cohorts, the patterns of the crude ORs are similar for the different guidelines, especially at lower threshold levels. For larger thresholds, the numbers of patients meeting the guidelines are small and the OR estimates are less reliable. The sensitivity and specificity obtained from the two modified guidelines are also similar to those from the original guideline G1. These conclusions are unchanged based on the logistic regression models that adjust for other characteristics (Table 1).
For the relapsing cohort, we observed an increasing trend between ever meeting the guidelines and confirmed EDSS progression. Meanwhile, no clear trend was observed in the SP cohort. Again the performances of the three guidelines are similar. (See Supplementary Material, Web Figure).
Discussion
The two modified guidelines failed to improve the sensitivity for predicting a future relapse. The lack of improvement may be due to the short study duration of only 24 weeks. It will be useful to further validate the merit of these alternative guidelines with other study cohorts, especially those with a longer duration.
There are limitations of these guidelines. All are based simply on the CEL counts but the size and location of the CELs may influence the clinical presentation of the disease.5,6 Such information is generally not available in the current clinical trial safety monitoring process.
Another limitation is that these guidelines are based on a fixed threshold for all patients. Our results echo the question that has been previously raised: does one guideline fit all? 7 With large variation existing both between studies and among patients within the same study, there is a need for monitoring procedures that are both patient and study specific. 8
Footnotes
Conflict of interest
The authors declare that there is no conflict of interest.
Funding
This research is supported by a research grant from the Multiple Sclerosis Society of Canada.
References
Supplementary Material
Please find the following supplemental material available below.
For Open Access articles published under a Creative Commons License, all supplemental material carries the same license as the article it is associated with.
For non-Open Access articles published, all supplemental material carries a non-exclusive license, and permission requests for re-use of supplemental material or any part of supplemental material shall be sent directly to the copyright owner as specified in the copyright notice associated with the article.