
Abstract
Background:
In relapsing–remitting multiple sclerosis (RRMS), the cerebellum is a known predilection site for atrophy. Neuromyelitis optica (NMO) is characterized by extensive lesions in the spinal cord and optic nerve; however, cerebellar involvement has been less studied. Secondary degeneration of the spinocerebellar tract could impact the cerebellum in NMO.
Objective:
We aimed to investigate whether spinal cord and cerebellar volume measures differ between patients with NMO and RRMS.
Methods:
Volumetric analyses of the cerebellum (TCV), the upper cervical cord (UCV) as well as the whole brain (NBV) of age- and gender-matched patients with NMO (n=30; 56% AQP4 +ve) and RRMS (n=25) were performed on 3T brain magnetic resonance imaging (MRI) and compared with 34 healthy controls (HC).
Results:
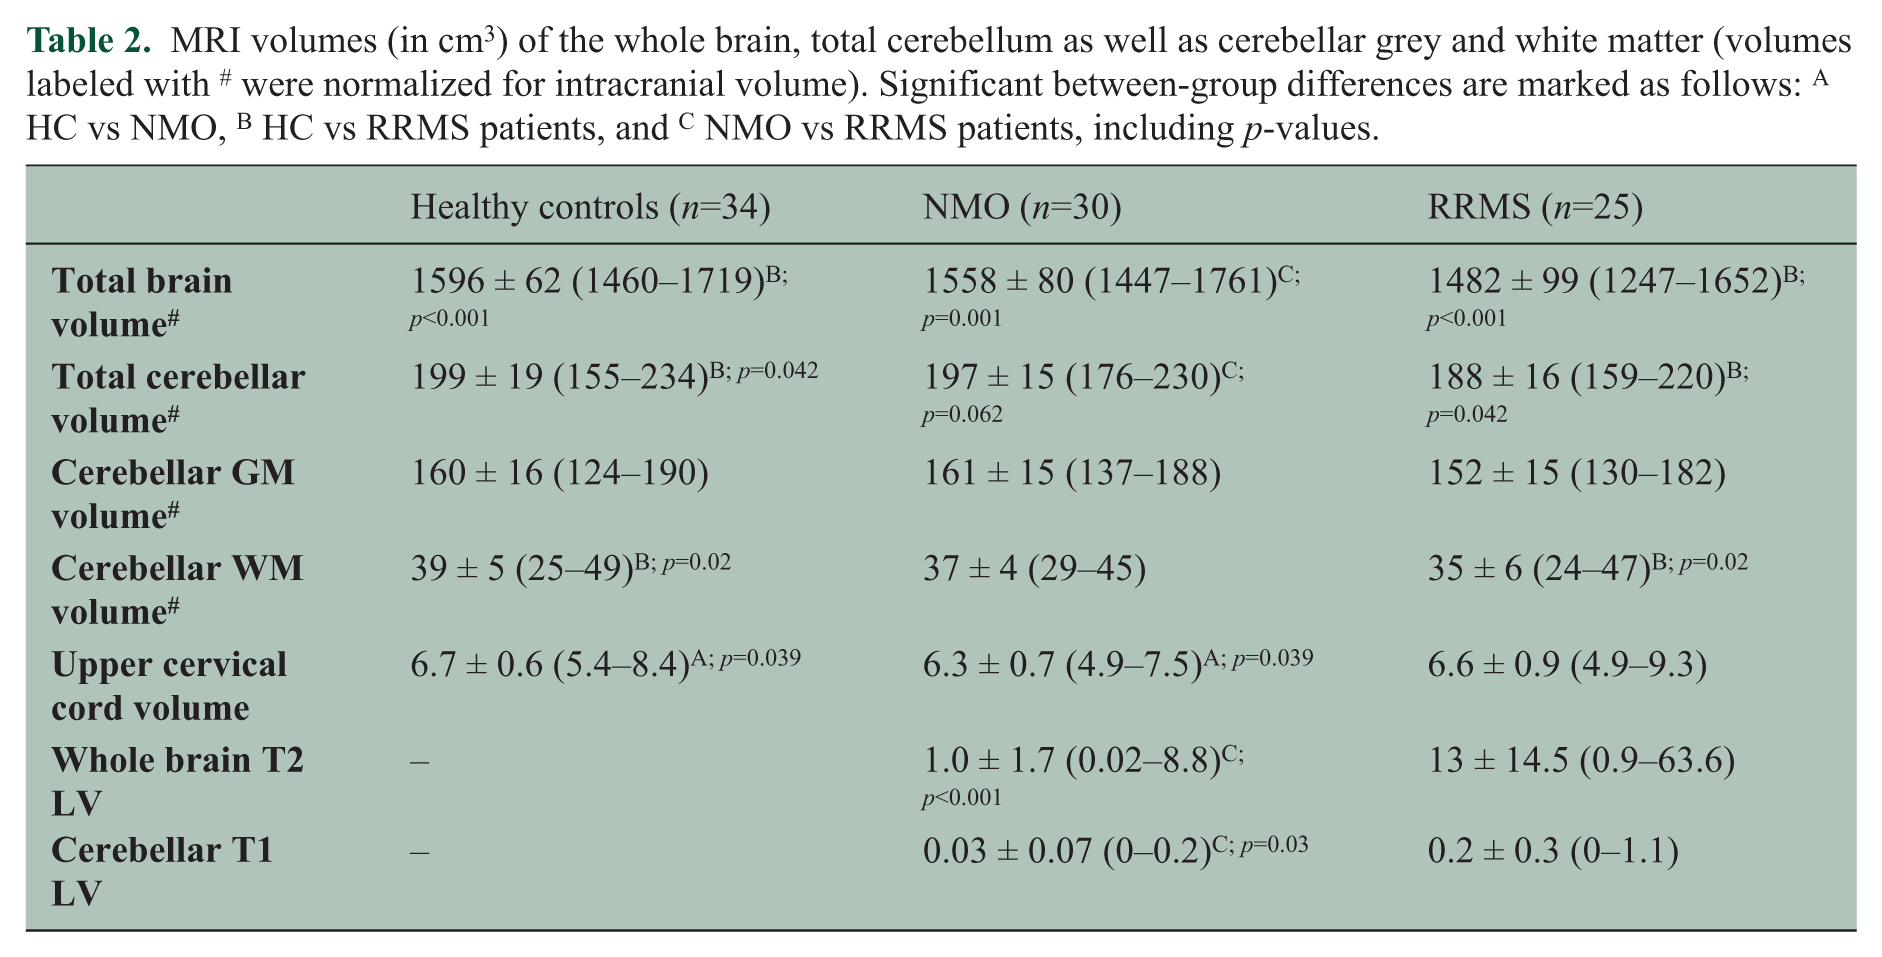
UCV was significantly reduced in NMO patients (6.3 cm3) as compared with HC (6.7 cm3), while patients with MS had reduced brain volumes compared with HC (NBV=1482 cm3; p<0.001; TCV=188 cm3; p=0.042), but UCV close to normal values. Patients with RRMS and NMO differed in NBV (p=0.001; lower in RRMS) and by trend (towards reduction in RRMS) in cerebellar volume (p=0.06).
Conclusions:
While atrophy seems to be diffuse in MS patients, a rather focussed pattern with predominant involvement of the UCV was observed in NMO patients.
Keywords
Introduction
Neuromyelitis optica (NMO) is known to be an inflammatory syndrome which primarily affects the optic nerves and the spinal cord. Historically, it was considered a monophasic, severe and locally destructive subtype of multiple sclerosis (MS). Current evidence suggests that it is a distinct entity associated with the presence of IgG-antibodies against the aquaporin-4 (AQP4) receptor (NMO-IgG)1,2 in a significant proportion of patients. AQP4 receptors are predominantly situated in the astroglial cell membranes of subpial and subependymal zones around the ventricles in the central nervous system. 3 Revised diagnostic criteria 4 have simplified the diagnosis of NMO in patients with first attacks of transverse myelitis and/or optic neuritis, emphasizing the relevance of NMO-IgG in addition to imaging criteria. Characteristic magnetic resonance imaging (MRI) features include longitudinally extensive spinal cord lesions and lesions in either one or both optic nerves; often there are no other evident brain abnormalities on MRI, especially in early stages. Nevertheless, distinction from MS (the most important differential diagnosis) can be difficult. Previous imaging studies have evidenced changes of the normal-appearing grey and white matter in NMO patients compared with healthy controls.5-8 Duan and colleagues recently performed a voxel-based morphometry study of patients with NMO versus patients with MS, 9 showing more prominent grey matter volume changes in the deep grey matter of patients with relapsing–remitting MS (RRMS) as compared with NMO patients.
Grey matter atrophy in NMO may be due to secondary degeneration related to primary injury to the optic nerves or spinal cord. If secondary degeneration leads to remote atrophy, the cerebellum with its direct and dense connections to the spinal cord would be a plausible predilection site of atrophy in NMO. Furthermore, the cerebellum is located in direct proximity to the fourth ventricle, showing a high density of AQP-4 receptors. 3 Therefore we aimed at studying 1) whether there is indeed a prominent cerebellar volume reduction in NMO patients and 2) whether NMO and MS patients differ regarding the degree of cerebellar abnormalities.
Methods
Subjects
The study included 30 patients (26 women, mean age 33.6 years, standard deviation (SD) ± 10.1, range 19–50) with definite NMO (relapsing–remitting) according to the recently revised criteria 4 who attended the MS clinic of Sina hospital, a tertiary centre located in Tehran from 2009 to 2012 and agreed to participate in this study. In addition, 25 age- and sex-matched patients (22 women, mean age 32.9 years, SD ± 32.9, range 21–51) with RRMS according to the revised McDonald criteria 10 were selected from the same MS clinic. A further 34 matched healthy controls (HC; 30 women, mean age 31.3 years, SD ± 8.0, range 20–51) were recruited. All patients underwent a medical and neurological examination, including assessment of the Functional System Scores (FSS) and Expanded Disability Status Scale (EDSS) 11 , the 9-hole-peg test (9-HPT) and timed 25-Foot Walk test (25-FWT) as part of the Multiple Sclerosis Functional Composite (MSFC). 12 All participants were tested for NMO-IgG using an indirect immunofluorescence assay (Bioscientia Institut für Medizinische Diagnostik GmbH, Ingelheim, Germany). All participants gave written informed consent before clinical and MRI examination and the study was approved by the ethical committee at Tehran University of Medical Sciences.
MRI data acquisition
Data analysis was performed using high-resolution T1-weighted MPRAGE images acquired in sagittal plane (TR/TI/TE=2530/1100/3.4 ms; α=7°, 176 slices, isotropic voxel of 1 × 1 × 1 mm). In addition, two sets of axial 3 mm T2-weighted (T2w) images were acquired to determine the whole brain T2 lesion load in patients (turbo spin echo: TR/TE=4000/91 ms; 42 slices with an interpolated in-plane resolution of 0.43 × 0.43 mm and turbo-inversion recovery-magnitude: TR/TE=9000/93 ms; 42 slices with an in-plane resolution of 0.69 × 0.69 mm). All MRI scans were performed at the Imam Khomeini Hospital Imaging Center using a 3 T Magnetom Trio MRI scanner (Siemens Medical Solutions, Erlangen, Germany). Patients were clinically stable at the time of the scanning and none of them had a relapse or received intravenous steroid treatment within 6 weeks prior to the MRI scan.
MRI data post-processing
Total cerebellar volume (TCV), cerebellar grey (CGV) and white matter volume (CWV) as well as upper cervical cord volume (UCV) were analysed on the 3D T1w images semi-automatically with the ECCET software (www.eccet.de). The cerebellum is segmented using a 3D filling algorithm separating brain tissue from cerebrospinal fluid (CSF). The segmented cerebellar volumes can be manually adjusted if required. All MRI post-processing steps for the cerebellum have been previously described in detail elsewhere. 13 The UCV was generated within the original pipeline: 1) preliminary segmentation of the brainstem and upper cervical cord by manual delineation of several (5–7) axial slices and subsequent interpolation between these slices based on an angle-restricted convex hull generation (see also Weier et al. 13 ); 2) refinement of the segmentation using a 3D masking algorithm differentiating between brain tissue and surrounding CSF (Figure 1). The UCV was defined as the volume between the level of the cisterna pontis and the intervertebral disc C2/C3 (Figure 2). Inter- and intra-rater reliability of the UCV segmentation were assessed prior to the study using an Intraclass-Correlation Coefficient (ICC) model 3 (mixed-effect model). 14 For this purpose, an independent cohort of 10 RRMS patients was segmented twice as described above by two investigators (KW and MA) with experience in the analysis of neuroimaging studies. Both tests indicated excellent reliability, with an ICC of 0.98 (inter-rater; 95% confidence interval (CI) = 0.933–0 .996) and 0.99 (intra-rater; 95%CI = 0.994–1.0). All segmentation procedures of the present study were performed by a single investigator (KW) blinded to the diagnostic group and patients’ clinical records. Visual quality control did not reveal any segmentation failure due to intrinsic tissue signal abnormalities (i.e. lesions).
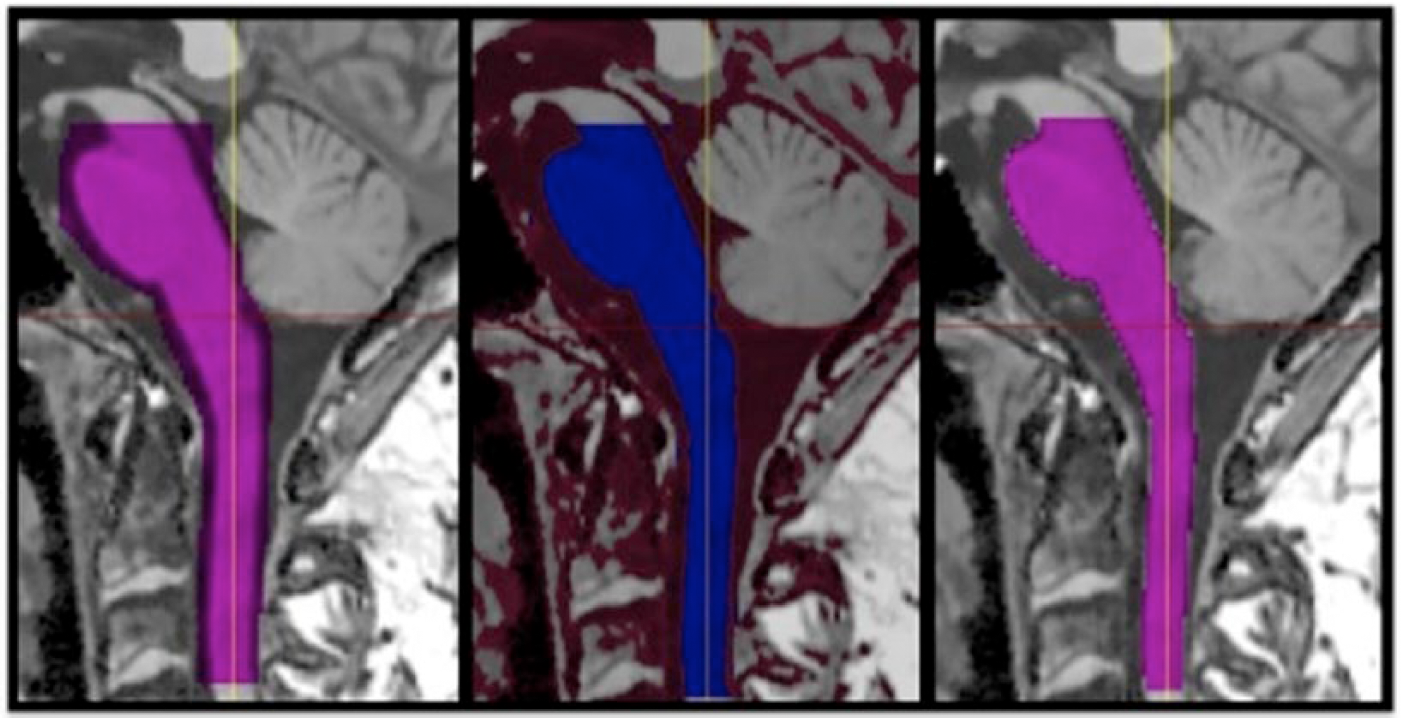
Processing pipeline for upper cervical cord segmentation. From left to right: 1) rough segmentation of brainstem and upper cervical cord; 2) application of refinement mask; 3) final accurate segmentation.
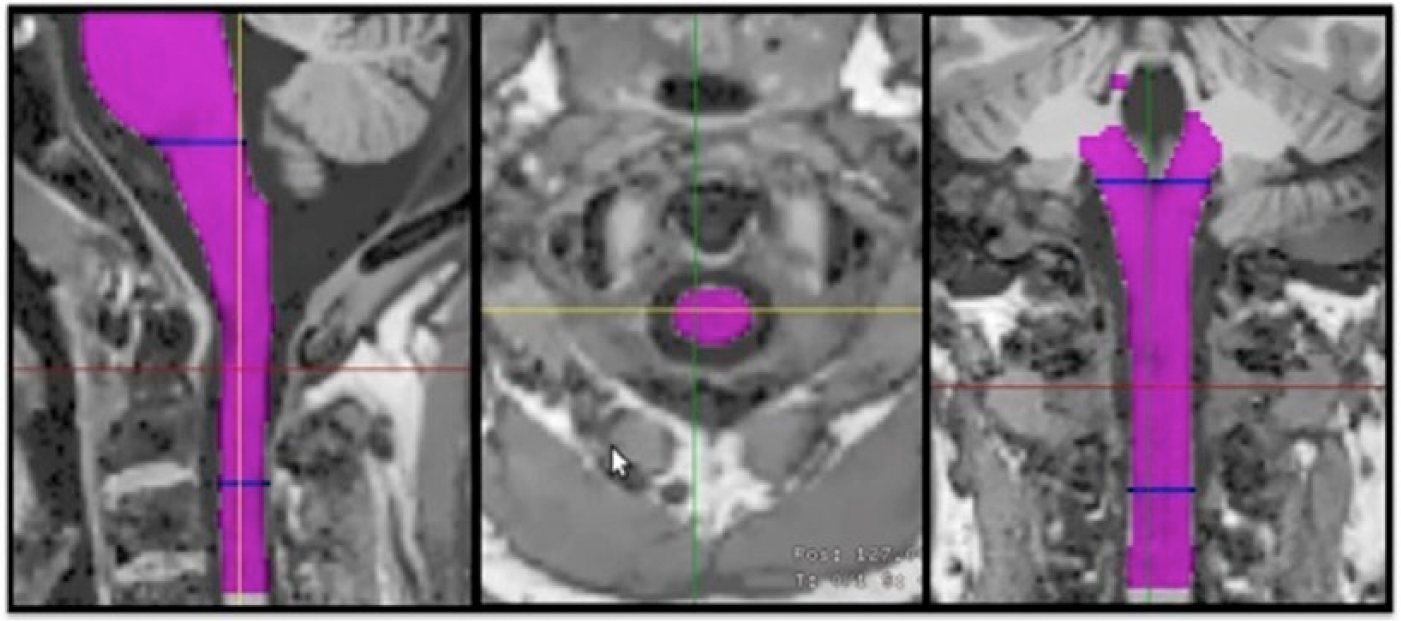
Final upper cervical cord segmentation in three planes: sagittal (left), axial (middle); coronal (right) view. The red line shows the position of the axial slice. The blue lines on the sagittal and coronal views mark the upper and lower boundary of the arbitrary chosen UCV.
Total normalized brain volume (NBV) was computed using SIENAX. 15 In order to avoid tissue misclassification due to lesions, lesions were filled with the mean normal-appearing white matter intensity using a MATLAB script (MATLAB 7.13, The MathWorks Inc., Natick, MA, 2011b). The SIENAX normalization factor (i.e. normalization for head size) was used for normalizing the cerebellar volumes. Additional conventional MRI measures such as total T2w and T1w lesion volumes (LV) were also determined. Lesion volumes of the whole brain were computed automatically using in-house MATLAB scripts. Cerebellar lesions were manually segmented on the high-resolution T1w MPRAGE sequences as this sequence fully covered the cerebellum and is less frequently affected by artefacts in the posterior fossa.
Statistical analysis
Between-group comparisons for cerebellar and whole brain volumes were performed using ANCOVA with age and sex as covariates. Pairwise comparisons were performed using Sidak’s adjustment for multiple comparisons. 16 For each ANCOVA model the assumption of normality (Shapiro–Wilk test 17 ), linearity, homoscedasticity (Levene’s test 18 ), and homogeneity of regression slopes (verifying the significance of the interaction term) were tested. For the variables that did not meet the assumptions (9-HPT, 25-FWT, cerebellar T1 and whole brain T2 LV), a non-parametric ANCOVA 19 was performed. Hierarchical multiple linear regression (MLR) analyses were performed to investigate the relation between atrophy measures (NBV, TCV, CGV, CWV and UCV) and LV (whole brain LV, cerebellar LV), as well as between MRI metrics and clinical scores (EDSS, cerebellar FSS, 25-FWT, 9-HPT). Demographical data (age and sex) were entered into the first block and maintained in order to take them into account in the subsequent block. In the second block, LV metrics or MRI metrics were included stepwise in order to select for significance (variable entry at p<0.05, variable removal p>0.10). All statistical analyses were performed using SPSS 20 (IBM, New York, USA). A p-value of <0.05 was used for statistical thresholding. The freely available G*Power software was used for power calculations. 20
Results
Clinical
The mean disease duration of the NMO patients was 6.1 years (SD ± 3.3, range 1.2–14.8) and did not significantly differ (p=0.47) to the MS patients (mean 6.9 years ± 5.5, range 0–20.5). Of the NMO patients, 17/30 (56%) were seropositive for NMO-IgG. None of the MS patients or HC tested positive for NMO-IgG. NMO patients were on treatment with the following disease-modifying treatments: azathioprine n=18, mycophenolate mofetil n=5, mitoxantrone n=1, cyclophosphamide n=1, methotrexate n=1, oral prednisolone n=1. The remaining three patients were not on a specific treatment. In the group of MS patients, 17 received interferon beta, n=2 azathioprine, n=1 mitoxantrone, and the remaining five patients were without immunomodulatory treatment.
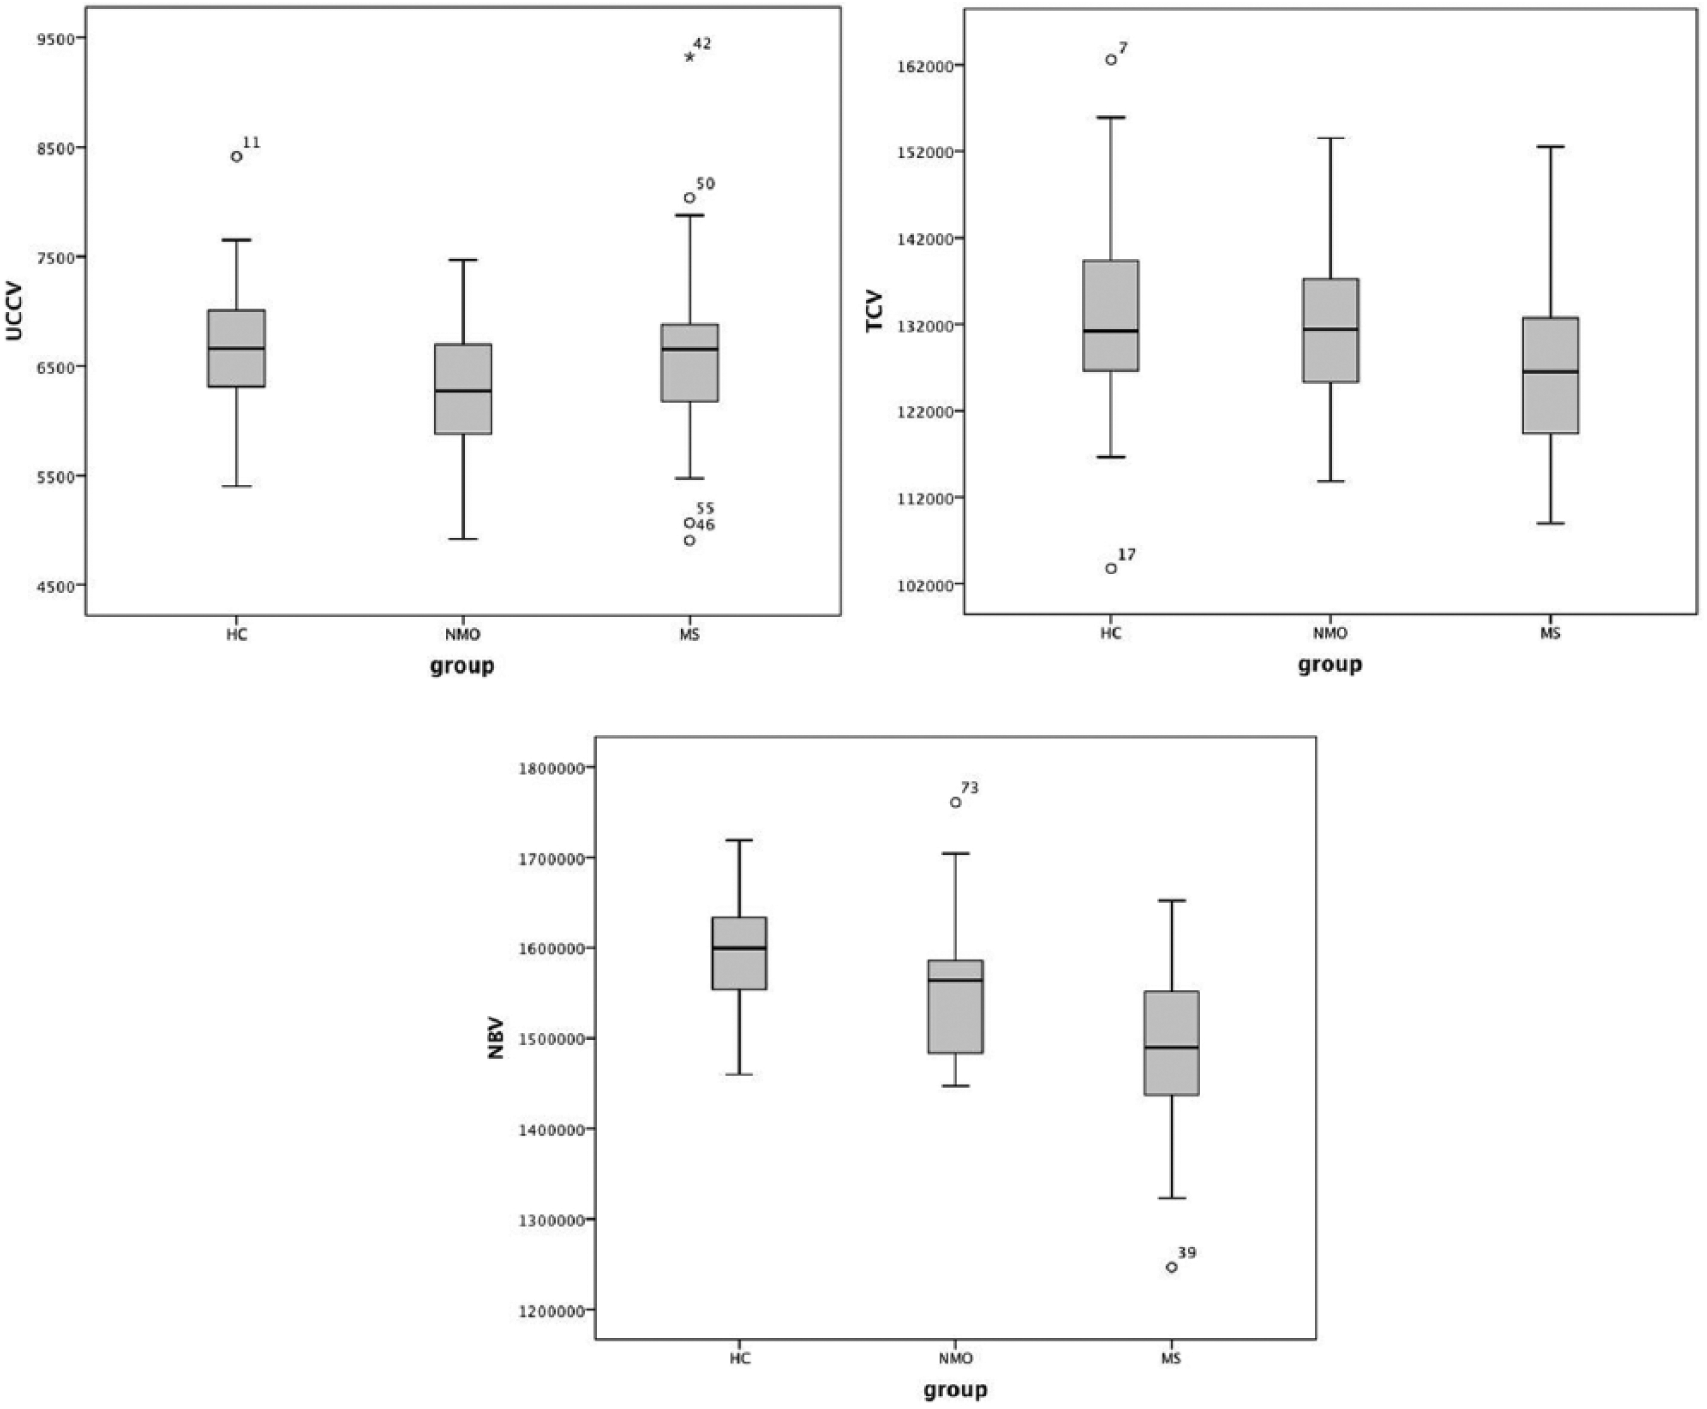
There were no significant differences of clinical data, including EDSS, cerebellar FSS, and 9-HPT between patient groups. All details are summarized in Table 1. The average performance in the 25-FWT was numerically slightly worse in NMO patients (mean 6.8 sec ± SD 2.3; one outlier excluded), when compared with the MS patients (5.9 sec ± SD 1.2); however, this difference did not reach statistical significance (p=0.42).
Group demographics and clinical data. There was no significant between-group differences in any of the parameters. *One outlier with mean walking time of 50.9 seconds in the timed 25-Foot Walk test (25-FWT) was excluded. EDSS: Expanded Disability Status Scale; FSS: Functional System Score; 9-HPT: Nine hole peg test.
MRI data
A power calculation based on effect sizes estimated from previous publications21,22 confirmed that the present sample size of ~90 subjects should allow detection of volume differences between HC, NMO and MS patients with a moderate effect size.
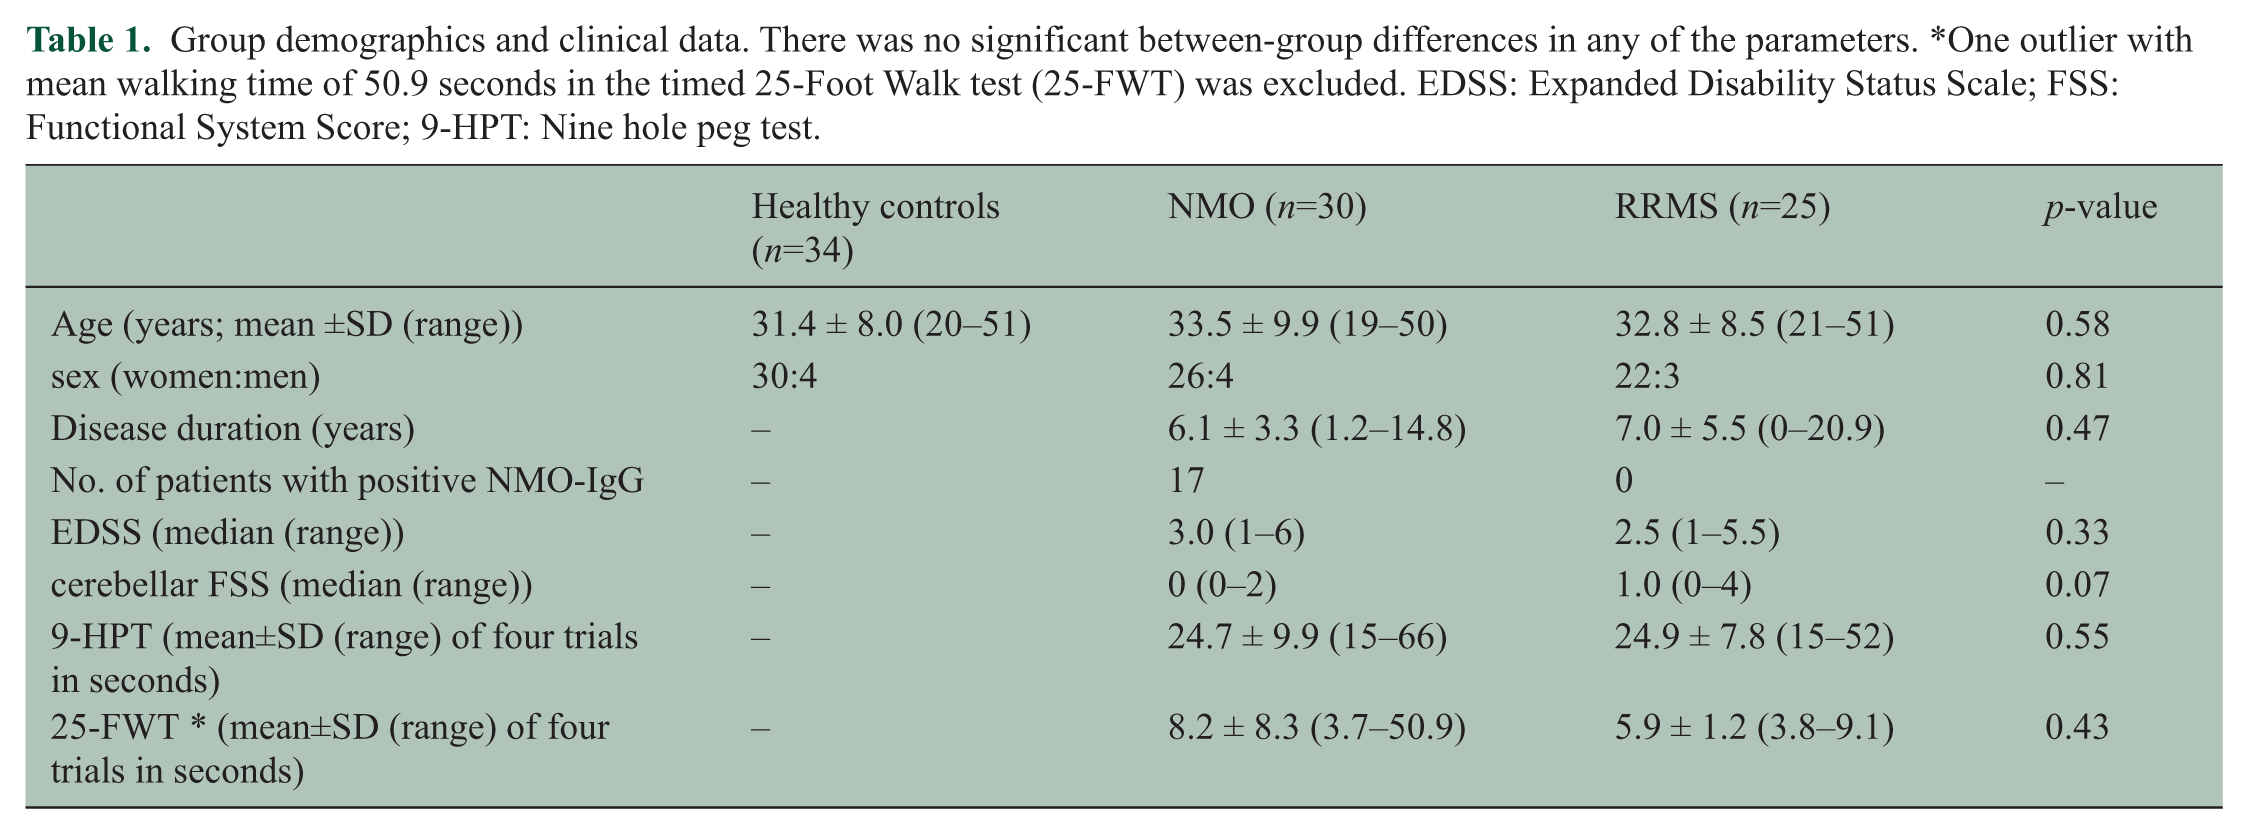
The analysis showed a significant effect of diagnostic group (NMO, MS and HC) on UCV (F(2, 84)=3.4, p=0.038) (Figure 3). Specifically, the pairwise comparisons revealed lower UCV in NMO patients compared with healthy subjects (p=0.039). Detailed results are shown in Table 2. Examples of MR images of all three diagnostic groups are displayed in Figure 4.
Boxplot graphs displaying the median (bold line), the minimum (lower T-line) and maximum (upper T-line) as well as the first quartile (lower part of the box) and third quartile (upper part of the box) of upper cervical cord volume (UCV), total normalized cerebellar volume (TCV) and normalized brain volume (NBV) (from left to right).
MRI volumes (in cm3) of the whole brain, total cerebellum as well as cerebellar grey and white matter (volumes labeled with # were normalized for intracranial volume). Significant between-group differences are marked as follows: A HC vs NMO, B HC vs RRMS patients, and C NMO vs RRMS patients, including p-values.
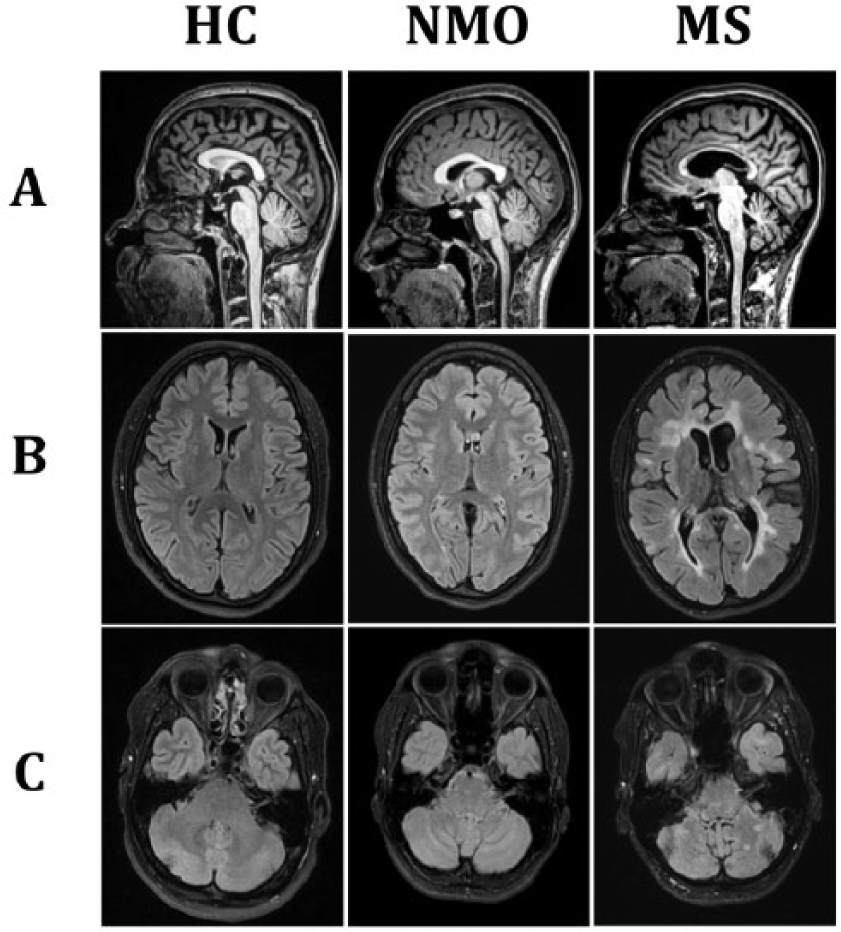
Example images of one healthy control (HC), one patient with neuromyelitis optica (NMO) and one with multiple sclerosis (MS) (from left to right). (A) Sagittal T1w MPPRAGE indicating reduced UCV in the NMO patient. Axial T2w TIRM at level of the lateral ventricles (supratentorial) showing exemplary differences in NBV (B) and TCV (C) infratentorial.
An effect of diagnostic group was also identified on TCV (F(2, 84)=3.8, p=0.026), CWV (F(2, 84)=3.83, p=0.025) and NBV (F(2, 84)=15.19, p<0.001) (Figure 3). Pairwise analysis showed that MS patients had a significant reduction of NBV (p<0.001), CWV (p=0.02) and of TCV (p=0.042) when compared with HC. However, the CGV (p=0.20) and UCV (p=0.9) were similar to the HC. Comparison of both patient groups showed a significantly lower NBV (p=0.001), by trend lower TCV (p=0.062), and again by trend lower CGV (p=0.09) in patients with MS.
Furthermore, more MS patients (66%) had lesions in the cerebellum and MS patients had significantly higher lesion volumes (p<0.001 for whole brain T2 LV; p=0.03 for cerebellar LV) than NMO patients (28.6% with cerebellar lesions). Patients with NMO had both non-specific and specific white matter lesions; 23.3% (7/30) of these patients fulfilled Barkhof criteria. Of the NMO patients, 70% (21/30) had T1 hypointense lesions in their brainstem and/or upper cervical cord. Two-thirds of those had only lesions below the foramen magnum and no lesions in the brainstem above that level. In contrast, 22 (88%) of the patients with MS had T1 hypointense lesions in the brainstem and/or upper cervical cord; in only two patients these lesions were limited to the region below the foramen magnum.
Results from the MLR analysis are summarized in Table 3. In NMO increasing whole brain LV and age was associated with decreased NBV and CGV. None of the LV was associated with the CWV or UCV. In MS patients an increase in whole brain LV was related to reduced NBV; however, no associations between LV and cerebellar or cervical cord volume were found.
Summary of significant predictors of MLR analysis.
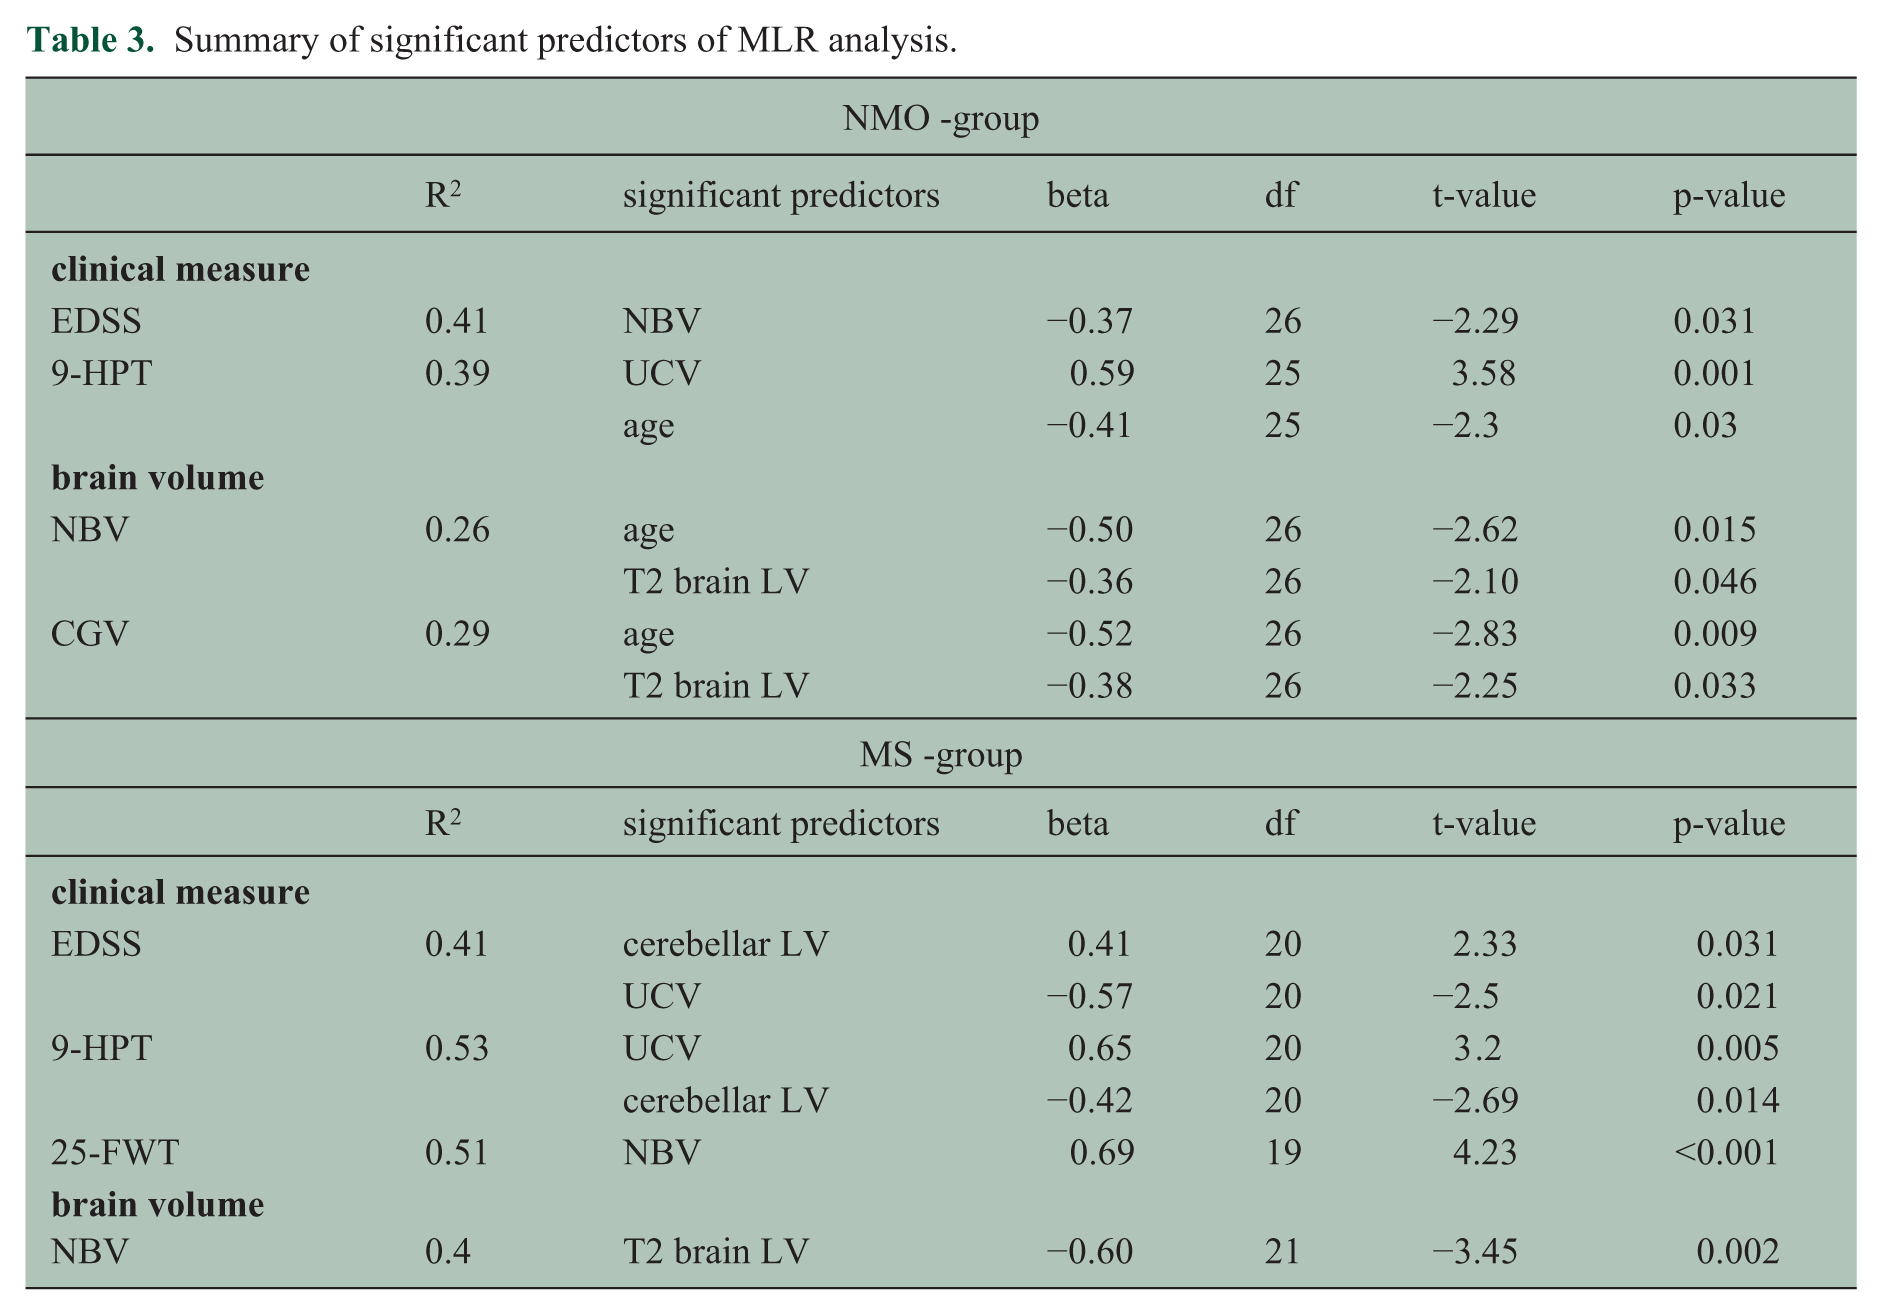
Analysis of clinical scores and MRI metrics in the NMO group showed that reduced NBV is associated with worse EDSS. For the 9-HPT, UCV together with age account for 39% of the variance. None of the MRI metrics showed a correlation with the 25-FWT. In MS reduced UCV and higher cerebellar LV were associated with worse EDSS and 9-HPT. For 25-FWT only reduced NBV showed a relation to worse performance.
Visual assessment of the MRI scans of the HC revealed an incidental finding of an arachnoid cyst at the left temporal pole of one HC. This subject was excluded from the analysis. Furthermore in 23% of HC, 1–3 small, unspecific T2 hyperintense lesions (most frequently located in the frontal lobe) were found. None of the HC had cerebellar or upper cervical cord pathology. None of the HC fulfilled any of the Barkhof criteria. 23
Discussion
We studied patients with NMO and MS with regard to their cerebellar and upper cervical cord volumes and compared those with HC. The groups were matched for age and sex, and patients were furthermore matched for disease duration. The groups did not significantly differ in any of the clinical tests (EDSS, 9-HPT, 25-FWT). Calabrese et al. 22 have previously suggested that retrograde axonal degeneration due to extensive spinal cord lesions may explain thalamic volume reductions in patients with NMO in the absence of a high brain lesion load. Accordingly, one could expect a reduction of cerebellar volumes in NMO patients, especially when taking into account that the extensive lesions seen in NMO affect spinocerebellar pathways. However, despite a significant reduction of UCV in our patients with NMO, there was no reduction of cerebellar volumes when compared with HC. This indicates that secondary degeneration may contribute to volume loss (both in NMO and MS patients) but does not explain the full picture. Atrophy is a cumulative measure of tissue damage and loss, accounting not only for axonal degeneration, but also demyelination and other factors. 24 As cortical demyelination is probably not present as a primary pathology in patients with NMO,21,23 and the cerebellum has an enormous proportion of cortical area, secondary degeneration of axons and white matter demyelination alone may not be sufficient to cause measurable volume reduction. Von Glehn and colleagues used voxel-based morphometry, cortical analysis and diffusion tensor imaging to study volume differences between HC and patients with NMO. 25 They showed regional grey and white matter volume loss in the cerebellar hemispheres; however, the total cortical volume of the cerebellum was not significantly reduced in comparison with HC. This may indicate that measures of global cerebellar volume may not be sensitive enough to depict small regional changes.
In contrary, MS patients had a reduction of TCV and cerebellar white matter volume in comparison with HC as well as by trend when compared with NMO patients, but no clear-cut reduction of UCV. The average TCV of patients with MS and HC was consistent with previously reported data.13,26 Furthermore patients with MS had significantly reduced whole brain volumes when compared with either NMO or HC. This demonstrates a rather diffuse pattern of atrophy in the MS group compared with rather localized abnormalities of the upper cervical cord in patients with NMO. Although one can consider this to be a fairly young patient cohort, the group of MS patients included two women with rather long disease durations of 17 and 20 years, which may explain the more diffuse volume loss in this group. The pairwise comparison of the TCV of MS patients versus HC was no longer significantly different (p=0.06) when these two outliers were excluded. The cerebellar lesion volume of NMO versus MS patients was also no longer statistically different (p=0.07) with the exclusion of these two patients.
The regression analyses revealed that UCV relates to poor performance in 9-HPT, but not the 25-FWT (a measure of ambulation) or EDSS in patients with NMO. Recent diffusion tensor imaging studies focussing on the cervical cord of NMO patients showed associations between cervical cord damage and clinical metrics.21,27 Associations were even stronger when tract-specific changes were considered.28,29 The UCV in our study does not account for tract-specific changes, which might partly explain why we did not find a clear relationship between UCV volume and EDSS and 25-FWT.
In RRMS patients, regional cortical thickness reduction has previously been shown to be associated with higher lesion load in the adjacent white matter; 30 however, no data exist on the correlation between lesion load and atrophy in patients with NMO. In our cohort, MS patients had more lesions in the posterior fossa and also a higher lesion load in the cerebellum compared with NMO patients; however, we did not find any correlation between cerebellar LV and cerebellar atrophy measures. Lu et al. 31 have also shown that patients with MS have significantly more lesions than NMO patients in the cerebellum, but did not report on associations between LV and other measures. Studies applying lesion probability mapping have produced partially contradicting results: Matthews and colleagues described a similar lesion distribution pattern in the posterior fossa in MS and NMO, 32 with the exception of the medulla oblongata, which was more involved in the NMO spectrum disorder group. In contrast, Huh et al. did not find any difference in the frequency of midbrain or posterior fossa lesions when comparing MS with NMO patients. 33 Due to the lack of whole spinal cord MRI data in our study, we cannot comment on whole spinal cord involvement and possible correlations between the spinal cord lesion load and the UCV or cerebellar volume. Visual inspection of the brainstem and upper cervical spinal cord, which was covered on the T1w MPRAGE sequence, showed that in patients with NMO the cord below the foramen magnum was more affected than the brainstem/medulla oblongata region right above it (the opposite was true in the MS group). However, this finding needs to be interpreted with caution, as we did not systematically analyse the volume of upper spinal cord lesions. Moreover, this preliminary finding is in contrast to results of Matthews et al., who reported a higher probability of NMO spectrum disorder patients to have lesions in the medulla oblongata when compared with the RRMS group. 32 Multimodal neuroimaging approaches including whole spinal cord and larger patient cohorts may better address this issue.
Study limitations
In this study patients received various first or second-line disease-modifying treatments, including immunosuppressive drugs. As treatment allocation was not random and the effect of a specific treatment on atrophy was not the focus of this study, we did not further analyse this aspect in detail. However, we are aware that different treatments may bias the results. Furthermore, we used high-resolution T1-weighted MRI scans of the brain to segment the upper spinal cord. Due to the relatively large field of view, these scans included several spinal cord levels and have been previously shown to be suitable for cervical spinal cord segmentation; 34 still, these data are certainly not optimal for spinal cord segmentation as only a limited portion of the spinal cord is covered. Moreover, the spinal cord is not in the centre of the magnet, leading to suboptimal image quality. The segmentation software for the UCV was also not systematically tested in NMO patients; however, it showed an excellent reliability in MS patients, and visual quality control in the NMO patients did not reveal any segmentation errors, e.g. due to lesions. Finally, although the segmentations were performed in a blinded manner, bias towards the diagnostic groups due to lesion distribution cannot be fully excluded.
In conclusion, we observed a focussed atrophy pattern with predominant involvement of the upper cervical cord in patients with NMO, while in patients with MS a rather diffuse pattern was found. The cerebellum seems to be less affected, at least at early stages in NMO.
Footnotes
Acknowledgements
The authors are particularly grateful to the patients who were willing to participate in the study. We wish to acknowledge the contributions of our clinical colleagues, who were involved in the care of the patients in this study. We thank Dr. A. Beck for technical and material support. He has developed the ECCET Toolkit, which is currently provided free of charge for research purposes by his company ‘Beck Datentechnik’.
Conflict of interest
K. Weier, A. Eshaghi, S. Magon, M. Andelova and A.R. Azimi have nothing to disclose.
E.W. Radue has received personal compensation from Biogen Idec, Genzyme, Novartis, Merck Serono, Synthon and MorphoSys for consulting and speaking services. He has received financial support for research activities from Actelion, Basilea Pharmaceutica Ltd, Biogen Idec, Novartis, SAKK and Synarc.
Dr. Kappos’ Institution (University Hospital Basel) received and used exclusively for research support: steering committee, advisory board and consultancy fees (Actelion, Addex, Bayer Health Care, Biogen, Biotica, Genzyme, Lilly, Merck, Mitsubishi, Novartis, Ono Pharma, Pfizer, Sanofi-Aventis, Santhera, Siemens, Teva, UCB, Xenoport); speaker fees (Bayer Health Care, Biogen, Merck, Novartis, Sanofi-Aventis, Teva ); support of educational activities (Bayer Health Care, Biogen, CSL Behring, Genzyme, Merck, Novartis, Sanofi, Teva); royalties (Neurostatus Systems GmbH); grants (Bayer Health Care, Biogen, Merck, Novartis, Roche, Swiss MS Society, the Swiss National Research Foundation, the European Union, Roche Research Foundations).
M.A. Sahraian has received travel support and lecture fee from Biogen Idec, Merck Serono, Bayer-Schering, Novartis and Cinnagen.
T. Sprenger has received no personal compensation. His employer, the University Hospital Basel, has received compensation for his serving on scientific advisory boards or speaking fees from Novartis, ATI, Genzyme, Actelion, Jansen, Teva, Mitsubishi Pharma Europe and Biogen Idec. These fees were used for funding of research.
Funding
The study was supported by the University of Basel (research grant “Nachwuchsförderung Klinische Forschung” - DMS2172). K. Weier received funding from the Swiss National Science Foundation (PBSKP3_145838).