
Abstract
Background:
Fatigue is one of the most distressing symptoms of multiple sclerosis (MS). Measuring MS fatigue poses a number of challenges. Many measures confound definitions of severity and impact of fatigue and/or lack psychometric validation in MS.
Objective:
To evaluate the psychometric properties of an 11-item fatigue severity measure, the Chalder Fatigue Questionnaire (CFQ) in MS including validity of the factor structure, internal reliability, discriminant validity and sensitivity to change.
Methods:
Data were pooled from four previous studies investigating MS fatigue using the CFQ (n=444). Data analysis included confirmatory factor analysis to determine the factor structure and model fit, correlations to assess discriminant validity and effects sizes to determine sensitivity to change.
Results:
A bi-factor model with one general fatigue factor, incorporating two smaller group factors (mental and physical fatigue) had good model fit and appeared the most appropriate factor structure underlying the CFQ scale. The CFQ had high internal consistency, showed small to moderate correlations with impact of fatigue and mood, and was sensitive to change across low and high intensity behavioural interventions.
Conclusions:
The CFQ measuring a composite of physical and mental fatigue severity (i.e. a total score) is a psychometrically sound measure of fatigue severity in MS.
Keywords
Introduction
Fatigue is reported as one of the most common and disabling symptoms of multiple sclerosis (MS).1,2 MS fatigue has been defined as ‘a subjective lack of physical and/or mental energy that is perceived by the individual or caregiver to interfere with usual and desired activities’, 3 and remains a complex and debilitating phenomenon. Fatigue can be distinguished from fatigability, whereby fatigue is conceptualised as the subjective sensation and fatigability the objective changes in mental or physical performance. 4 Subjective reports of MS fatigue have a significant impact on quality of life, and are associated with negative psychosocial factors including unemployment.5,6 MS fatigue can be distinguished from fatigue occurring in healthy persons by its rapid onset, heat sensitivity and tendency to interfere with day-to-day activities.7,8
Fatigue is clearly an important symptom, but the assessment of fatigue in MS poses a challenge due to its subjective and multifaceted nature. Although attempts at objective measures of fatigability have been made, self-report questionnaires are the most common and possibly the most effective way of evaluating fatigue in both research and clinical settings.9,10 There are numerous fatigue self-report scales. The most commonly used in MS are the Fatigue Severity Scale (FSS) 8 and Fatigue Impact Scale (FIS). 11 The 11-item FSS was initially developed and validated on people with MS. However, whether the FSS measures severity specifically is questionable. The items represent a conglomerate of effects of fatigue on daily life (e.g. fatigue interferes with my daily functioning), triggers of fatigue (exercise brings on fatigue) and miscellaneous items (I am easily fatigued). Although the FSS shows good psychometric properties in MS 12 it measures multifacets of fatigue rather than severity of the symptom experience specifically.
The FIS and modified FIS11,13 provide a clearer operational definition. Items measure impact of fatigue on physical, cognitive and psychosocial functioning in MS. The measure is psychometrically sound. 14 However, a recent evaluation of the face validity of the FIS by MS health professionals concluded that the items were non-specific to fatigue impact. 14 In addition, impact is not the same as severity of fatigue. Guidelines in the pain literature suggest outcomes of clinical interventions for pain should include both measures of the impact of pain on daily life and the severity or intensity of pain. 15 Although pain interference and impact are correlated they are sufficiently distinct that interventions can show change in one but not the other. 16
This may also be true for fatigue. Including measures of perceived severity and impact of fatigue in MS will not only help us understand fatigue better but elucidate intervention effects on fatigue. This is consistent with a recent review on measuring fatigue in neurological illness, which emphasised the need for measures that clearly define specified components of fatigue. 4 As both the FSS and FIS incorporate measurement of impact of fatigue, a validated measure specific to fatigue severity in MS is warranted. The Chalder Fatigue Questionnaire (CFQ) was originally developed for use among patients with chronic fatigue syndrome. 17 It consists of 11 items loading onto two dimensions of fatigue severity – mental fatigue and physical fatigue, which map onto to the operational definition of MS fatigue presented in the opening paragraph. The instrument has been found to have good clinical validity and internal consistency within this population.18,19 Given its efficiency and easy utilisation, the CFQ is a popular assessment of fatigue within a range of illnesses. However, there has been no formal assessment of the validity and consistency of this scale in the specific context of MS-related fatigue. Furthermore, the multidimensionality of fatigue scales has been widely debated, with data suggesting that most measures, including the CFQ, are in fact unidimensional. 20
The overarching objective of this study was to consider whether the CFQ is a suitable tool to be used in the evaluation of fatigue severity in people with MS. Our aims were to evaluate the psychometric properties of the CFQ with respect to its factor structure, internal reliability, sensitivity to change following intervention and discriminant validity. To assess discriminant validity we explored relationships between the CFQ and measures of both fatigue impact and depression. Previous work suggests there is a relationship between fatigue and depression but that depression can improve independently of fatigue and vice versa.4,21 We would therefore only expect small to moderate correlations between fatigue and depression. Similarly, as we argued that severity and impact should be considered independently, we expected only moderate relationships between the CFQ and measures of impact of fatigue.
Methods
Participants and design
Participants were drawn from four recent studies (n=444), which either investigated correlates of MS fatigue22,23 or trialled cognitive behavioural therapy (CBT)-based treatments for MS fatigue.21,24 The data included in the main analysis were either cross-sectional or at baseline in the context of the two randomised controlled trials (RCTs). Demographic and illness characteristics for each study are shown in Table 1 and the ethical approvals for each cohort are described in the relevant publications.
Baseline demographic and illness characteristics of MS participants across four studies related to the treatment of fatigue.
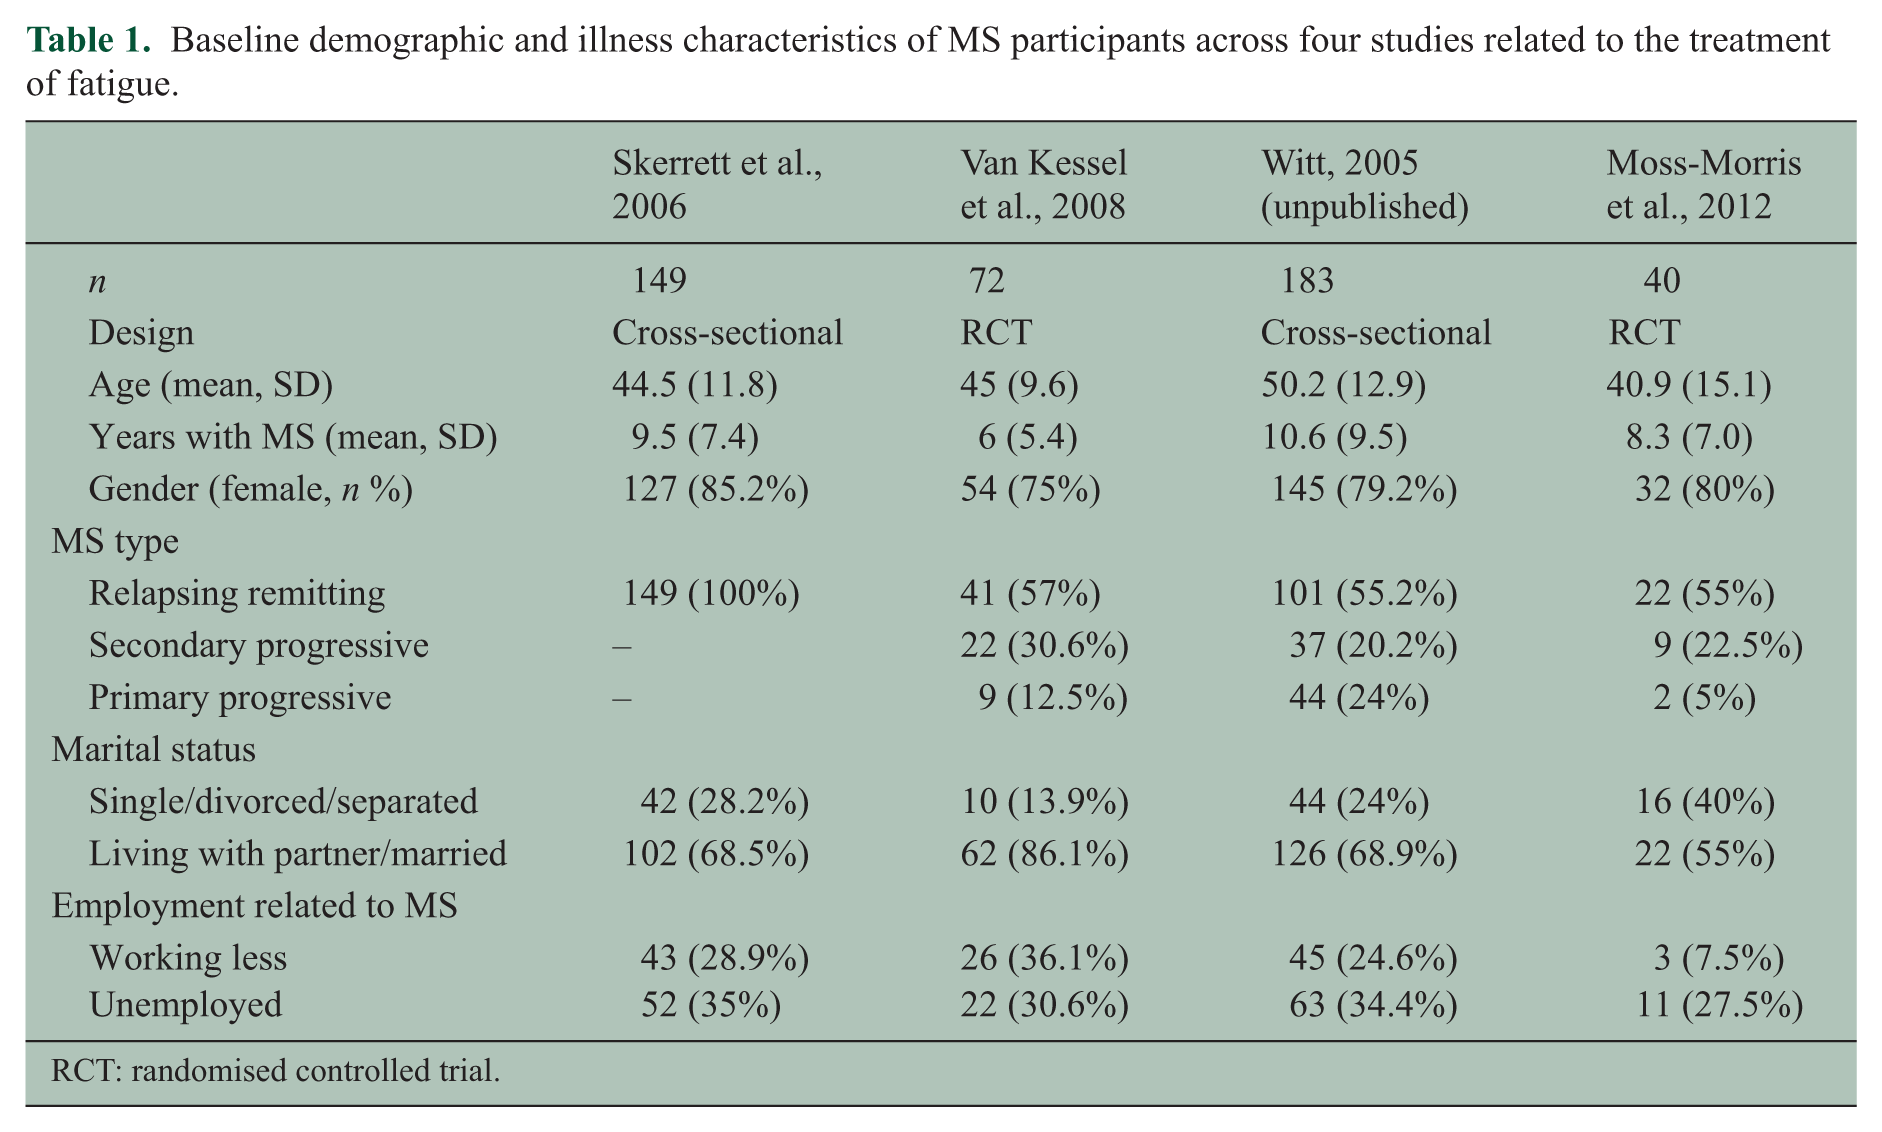
RCT: randomised controlled trial.
Instruments
The CFQ, 17 also referred to as the Chalder Fatigue Scale, is an 11-item questionnaire measuring the severity of physical and mental fatigue on two separate subscales. Seven items represent physical fatigue (items 1–7) and four represent mental fatigue (items 8–11). The studies from which the pooled data were collected used a slightly updated version of the CFQ,25,26 which has been used widely including in the PACE trial. 27 In this version the item ‘Do you have problems thinking clearly?’ is replaced with ‘Do you find it more difficult to find the correct word?’. Cella and Chalder 25 state that this slight amendment improves the scale’s reliability, although either item could be used without impacting on the measures interpretation. 26 Within the context of MS the questions are asked with the following stem ‘We would like to know more about any problems you have had with fatigue in the last month. Please answer ALL the questions simply by ticking the answer, which you think most, applies to you. We would like to know how you feel at the moment, or recently, compared to when you were last well’. Each item is scored 0–3; less than usual (0), no more than usual (1), more than usual (2) and much more than usual (3). The ratings of items are added together to calculate the total score (range 0–33). High scores represent high levels of fatigue.
Discriminant validity was assessed through:
The Work and Social Adjustment Scale (WSAS) is a valid and reliable five-item self-report measure of impairment in relation to an identified disorder or symptom. 28 In the context of these studies items measured impact of fatigue on home management, work, social leisure activities, private leisure activities and the ability to form and maintain close relationships.
The Modified Fatigue Impact Scale (MFIS) is a shortened version of the FIS validated in people with MS. 11
The Hospital Anxiety and Depression Scale (HADS) 29 is a commonly used self-report measure of mood in patients with medical illnesses. Seven items relate to anxiety and seven items relate to depression.
Statistical methods
The factor structure of the CFQ was examined using Confirmatory Factor Analysis (CFA) in MPlus 7.1. Competing models were estimated using weighted least-squares with mean and variance adjustment estimation, testing one, two factor and bi-factor models of fatigue. In the bi-factor models, all 11 items were loaded onto a general fatigue factor. In addition, items were also loaded onto a number of group factors, with correlations between each of these latent factors fixed to zero. Assessment of goodness of fit based on standard structural equation modelling criteria: root mean squared error of approximation (RMSEA) <0.08, confirmatory fit index (CFI) >0.95, and Tucker–Lewis index (TLI) >0.95. 30 Reliability of the total and subscale scores was assessed using the omega index, along with an indicator of the saturation of a multidimensional scale by a general factor, omega-hierarchical, for the bifactor models.31,32 Discriminant validity between the fatigue factors with other patient reported outcomes (depression, anxiety and disability) was evaluated using Pearson’s correlation.
Sensitivity to change was assessed using the data from the two RCTs.21,24 Treatment effects, in terms of post-treatment standardised mean differences (Cohen’s d) on the CFQ were estimated for CBT versus treatment as usual 24 and for CBT versus relaxation. 21 Following the intention-to-treat principle, missing post-treatment scores were imputed by carrying forward the baseline score. In addition to the treatment effects, the proportion of individuals showing a reliable improvement in fatigue following the method proposed by Jacobson et al. 33 was calculated. In order to assess if the measure remains relatively stable over a 10-week period without treatment we calculated Pearson’s correlations between baseline and follow-up CFQ in the no treatment control group.
Results
Confirmatory factor analysis of the CFQ
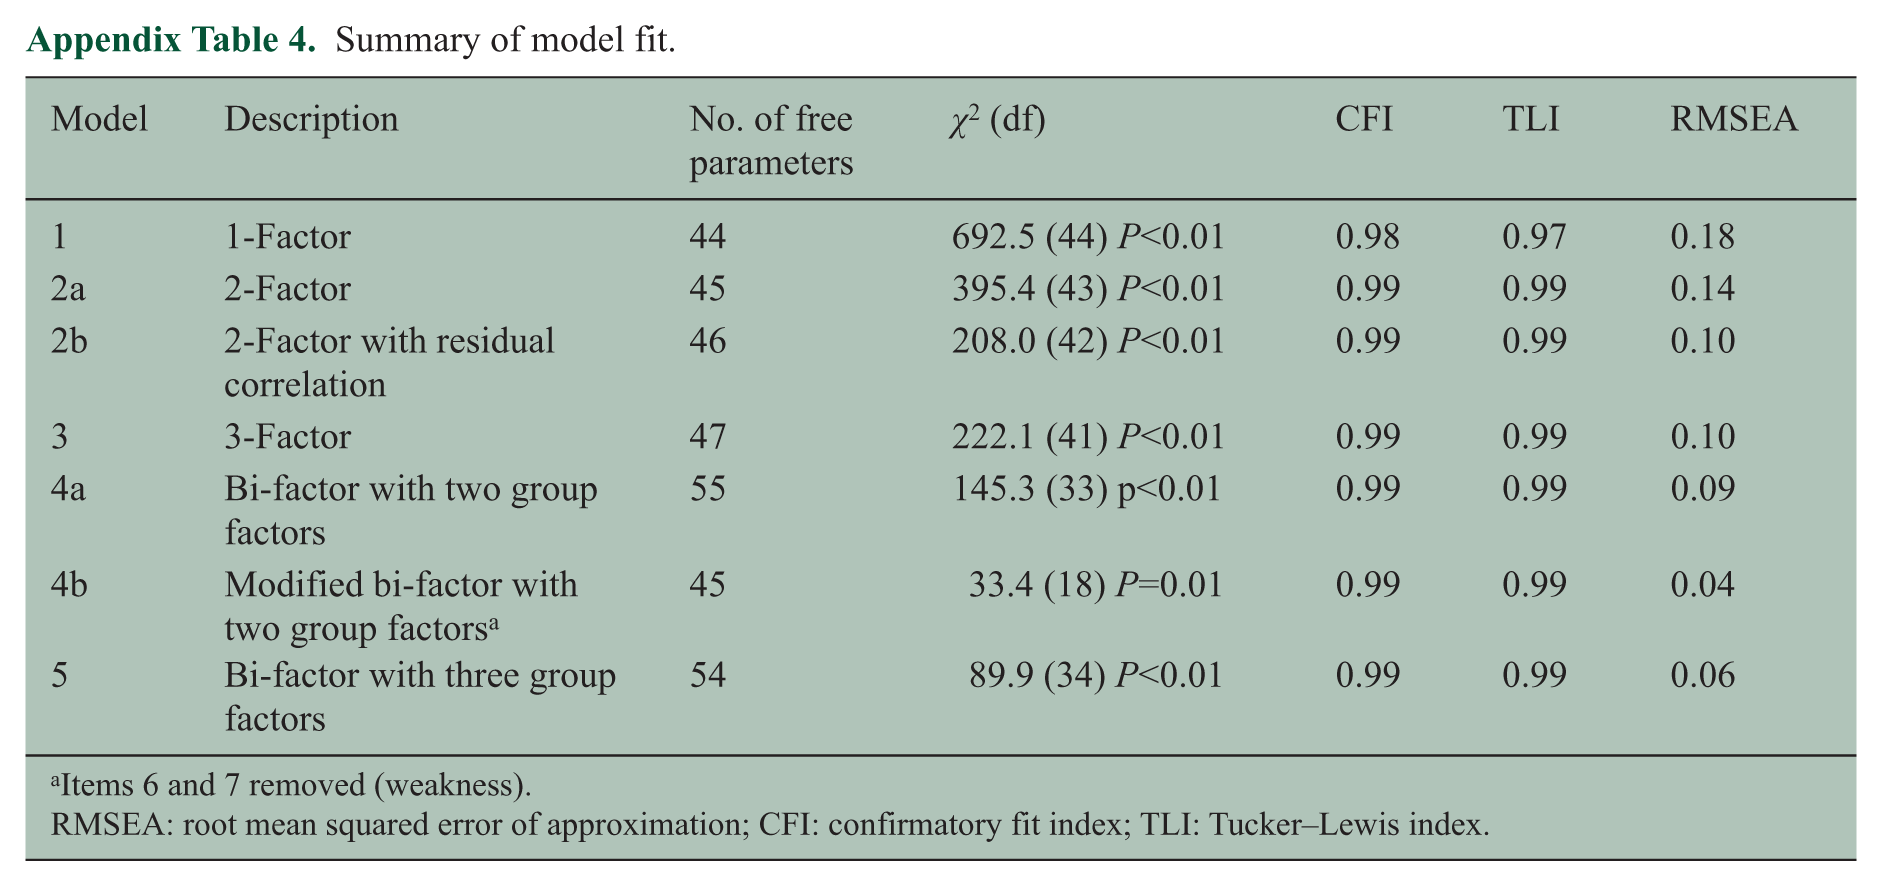
A series of CFA models was examined. The details of the five models are presented in the Technical appendix together with a table of the summary statistics for the fit of each model. The first three models illustrated that items 6 (less strength in muscles) and 7 (feeling weak) of the original CFQ negatively impacted the fit indices. Since these items appear to measure weakness rather than fatigue, they were dropped in the final two models. The model with the best fit and most satisfactory face validity was a nine-item bi-factor model with two group factors (see Technical appendix Table 4; model 4b). Model estimates from this analysis are shown in Table 2. The general factor explained 81.4% of the common variance between items. The mental (four items) and physical group (five items) factors explained only a small amount of common variance − 12.4% and 6.2%, respectively. Omega hierarchical was 0.89, indicating that the total score across all items included in the scale predominantly reflects a general fatigue factor. Considering the mental and physical subscales separately, the reliability coefficients were both 0.96. However, controlling for the part of the reliability attributable to the general factor the coefficients drop to 0.20 and 0.10, respectively. Together this indicates that, even though the scale is multidimensional, the total score for the scale is a reliable indicator for general fatigue. Total scores for the physical and mental subscales are saturated by the general factor and thus reflect general fatigue rather than separate constructs of physical and mental fatigue.
Nine-item bi-factor model for the Chalder Fatigue Questionnaire (model 4b, see Technical appendix).
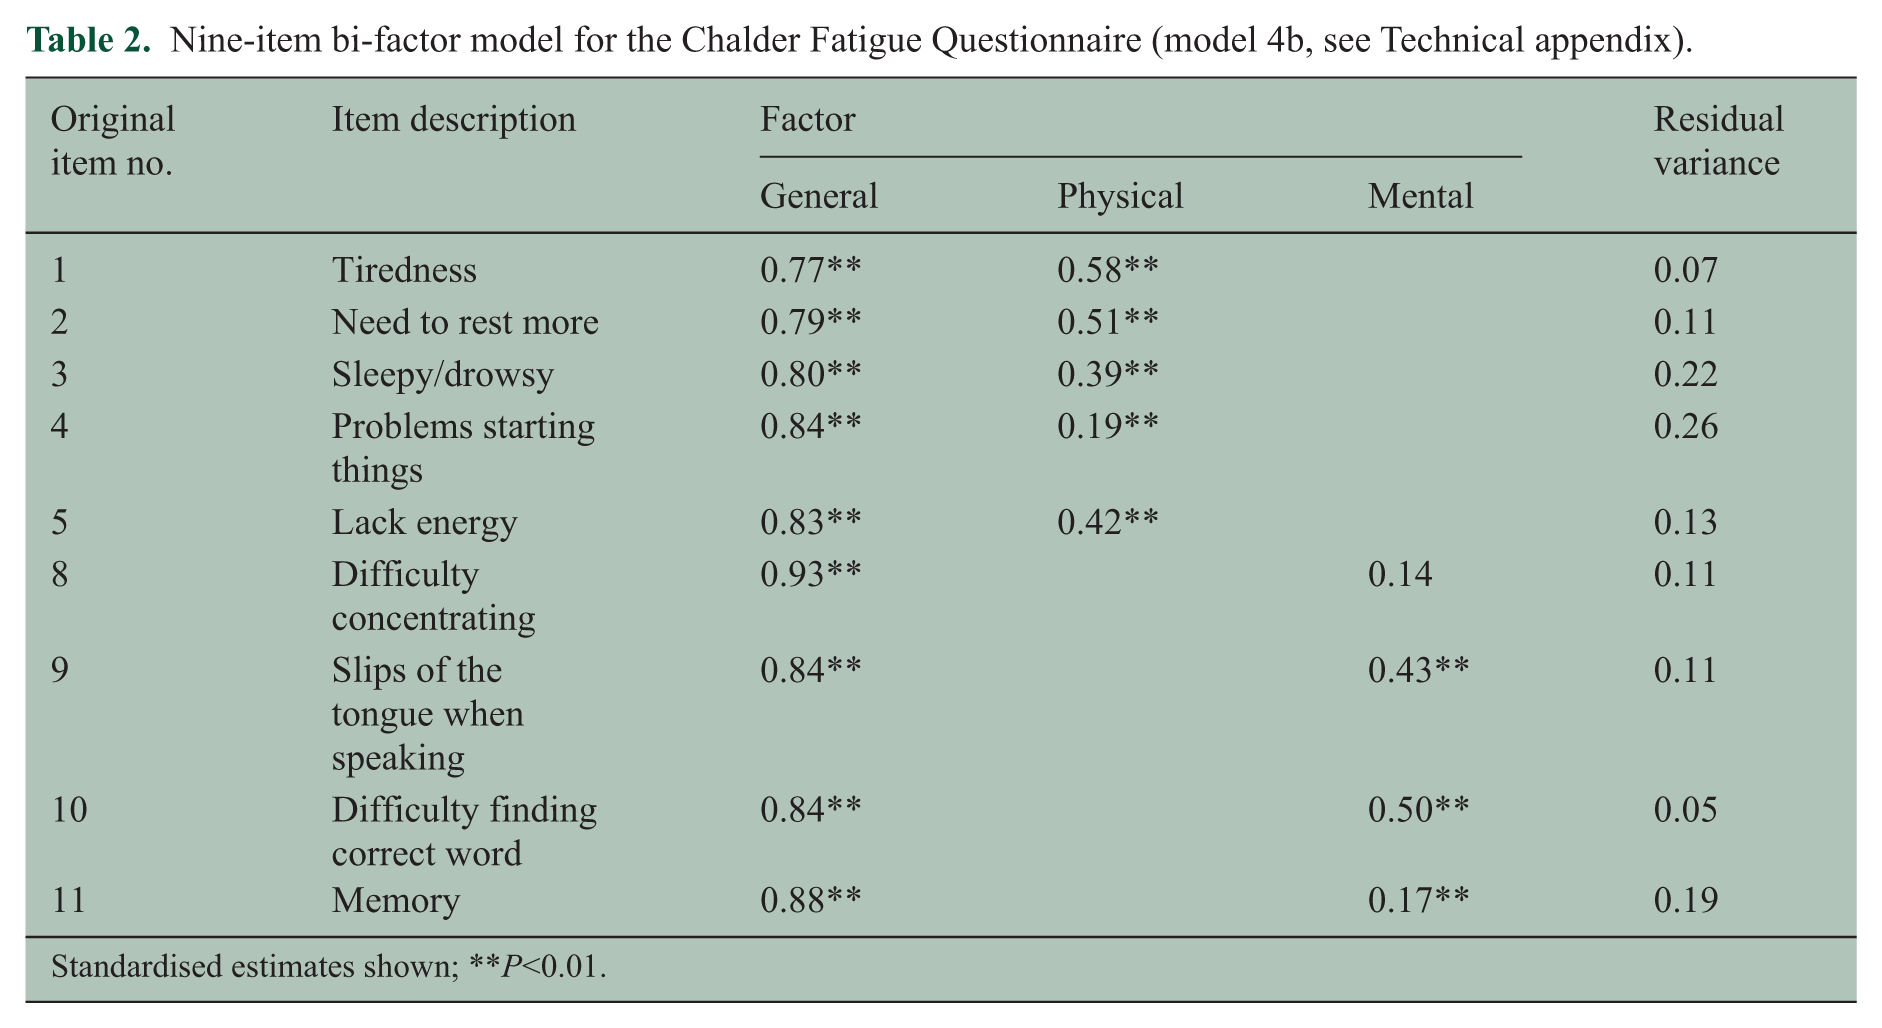
Standardised estimates shown; **P<0.01.
Discriminant validity: correlations between fatigue, depression, anxiety and disability
The original total CFQ sum score (11 items), and shortened sum score (nine items) were correlated with the HADS (depression and anxiety sum scores) and WSAS (see Table 3) to determine discriminant validity. As hypothesised, depression, anxiety and impact of fatigue (WSAS) all had significant but small to moderate positive associations with the total CFQ fatigue factor (bi-factor model), original (11 item) and shortened sum (nine item) scores. The size of the correlations was very similar for the 11 and nine- item versions. In a small subset of the total population, the nine-item summed CFQ showed a small correlation with the modified FIS supporting the argument that severity and impact may be distinguishable (r=0.22, P=0.19 (n=39; data from Moss-Morris et al., 2012)). 24
Correlates of the CFQ general factor scores.
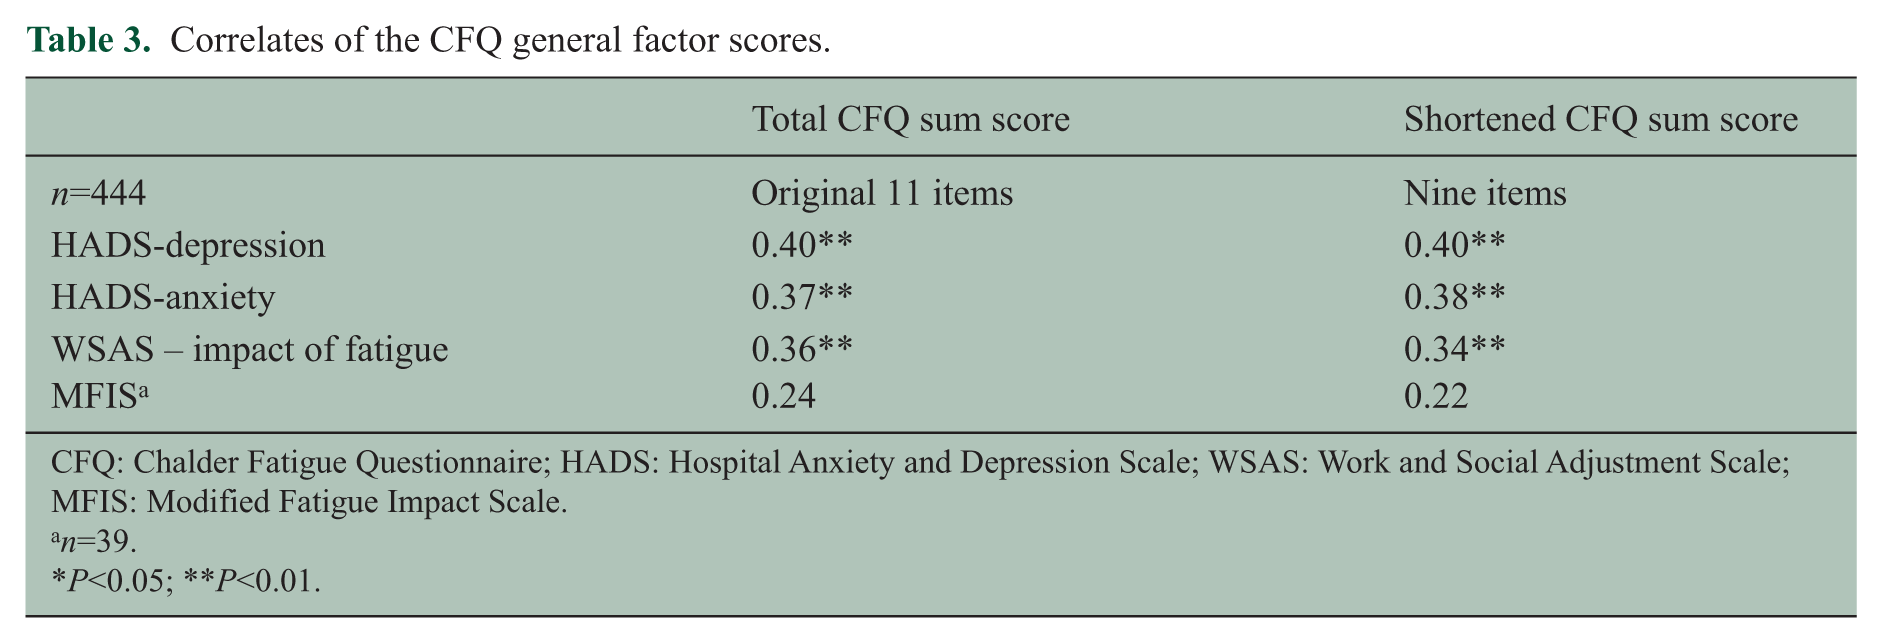
CFQ: Chalder Fatigue Questionnaire; HADS: Hospital Anxiety and Depression Scale; WSAS: Work and Social Adjustment Scale; MFIS: Modified Fatigue Impact Scale.
n=39.
P<0.05; **P<0.01.
Sensitivity to change was comparable for the 11 and nine-item CFQ versions in terms of the treatment effects of CBT versus treatment as usual 24 and versus relaxation. 21 Compared to treatment as usual, the post intervention between group effect size for CBT using the 11 and nine-item versions summed fatigue score was d=1.19 and 1.15, respectively. Compared to relaxation, the post intervention between group effect size for CBT was d=0.76 and 0.81, respectively.
For both the 11 and nine-item versions a reliable change was estimated to be a three-point difference. There was no difference between versions in the number of people in the intervention group that exhibited a reliable improvement in fatigue between the baseline and post-treatment assessments. In Moss-Morris et al. 24 16 of 23 (69.5%) and in van Kessel et al. 21 34 of 35 (97.1%) patients in the CBT group exhibited a reliable improvement. For the treatment as usual group, the correlation between CFQ at baseline and follow-up (10 weeks later) was r=0.58; P=0.02 suggesting without treatment scores remain moderately stable.
Discussion
The primary purpose of this study was to evaluate whether the CFQ is a valid and reliable measure of fatigue severity in MS patients. In terms of factor structure, early development of the CFQ with patients with chronic fatigue syndrome and healthy controls revealed two factors, measuring physical and mental symptoms of fatigue. 17 However, our findings failed to support a two-factor model underlying the CFQ, as evidenced by poor model fit and two highly correlated factors. Given this, we tested bi-factor models, which allows the separation of variance into components related to a general factor, group factors and unique variance. This modelling approach is increasingly used to test whether multidimensional measures can be considered sufficiently unidimensional to allow for the use of a total score, measuring one general construct.34,35
A bi-factor model, containing a general fatigue factor and two smaller group factors (physical and mental) most appropriately fitted the data. Items 6 and 7 correlated highly and appeared to measure something specific to weakness, rather than physical fatigue per se. Following examination of models with these items correlated, loaded onto a third group factor (weakness) or removed, model fit appeared most satisfactory when these items were removed. The two group factors explained relatively low variance, whereas the general factor, with all nine items loaded on it, explained approximately 80% of the common variance. Therefore, while the CFQ includes two dimensions of fatigue, it remains sufficiently unidimensional for the total score (i.e. the sum score) to be used as a reliable measure of general fatigue severity. The group factors remain only fragile indicators of separate constructs, namely mental and physical fatigue. The saturation of total subscale scores by the general factor means the subscales would be unreliable indicators of the unique constructs, thus we recommend using the total score as a general fatigue measure in future studies. These findings support those of others,20,36 and cast significant doubt over the practical distinction between physical and mental constructs of fatigue in MS patients. Further support for this assertion regards the poor criterion validity of the physical and mental subfactors in relation to other patient-reported outcomes (depression, anxiety and disability). That is, all of the association with these measures is due to common variance accounted for by the general component of fatigue. The unidimensional nature of the CFQ is also supported in the general population, 37 thus we encourage future research to use the measure as a total score measuring fatigue severity, rather than subscales of mental and physical fatigue.
A secondary aim was to assess whether this measure of fatigue severity could be discriminated from measures of impact of fatigue (WSAS and MFIS) and measures of mood. While fatigue severity was correlated with negative mood and the impact of fatigue on the ability to carry out day-to-day tasks, the overlap between these constructs was small to moderate in size (accounting for between 5% and 16% of the shared variance). These data suggest that it is worth including separate measures of fatigue severity and impact, although it should be noted with respect to MFIS the available sample size was small. The data also suggest that fatigue severity can be discriminated to some extent from negative mood because the correlations between fatigue and distress were moderate in size. Correlations were very similar in size for both the 11- and nine-item versions of the CFQ. The CFQ showed excellent sensitivity to change and large effect sizes in relation to CBT designed specifically to reduce fatigue in MS, both when the therapy was delivered by a therapist and through a website with some minimal support. Sensitivity to change was comparable for both the 11-item total score and the reduced nine-item version. This suggests removing the two items relating to weakness did not impact on the properties of the total score. That is, internal reliability, and thus precision, was not affected. This along with the other analysis suggests that, in practice, the use of either the 11 or nine-item version to assess fatigue is supported in the MS population. The two items removed in the bi-factor model related to weakness and it is conceivable that responses are confounded by disease symptoms in MS. These items may be stronger indicators of fatigue in other populations. However, as there is no evidence that the original 11-item version biases the validity of the instrument, we recommend the continued use of the 11-item version as it allows comparisons with non-MS samples. There appears to be little utility for using the nine-item version over the 11-item version.
While our study has a number of strengths including the sample size and representative nature of the MS patient sample, a few limitations are worthy to note when interpreting these data. Firstly, our results are specific to the MS population and thus may not generalise to other populations. Second, English speakers only completed the measure, therefore these data may not be generalised to other languages or cultures. Specifically, the measurement models of fatigue tested here may not be robust in other cultures, due to possible differences in the representation and expression of fatigue symptoms. Furthermore, the available follow-up data from the two pilot RCTs reported here21,24 had insufficient sample sizes to determine model invariance over time, using multiple group confirmatory factor analysis. The test–retest reliability yielded a moderate coefficient (0.58). This is likely to be because the retest data were taken from a small control arm of a fatigue intervention study. Therefore the retest period was 10 weeks, which is not a typical time frame employed when evaluating retest reliability. Other studies show that the CFQ has good retest reliability; 38 however, within individuals with MS this needs further evaluation. Finally, it is possible that some of the CFQ items overlap with muscle weakness and perception of cognitive dysfunction such as problems with memory.
In conclusion, the CFQ appears to be a valid and internally reliable measure of fatigue severity in people with MS, which is sensitive to change. We discourage the separation of physical and mental fatigue by means of two factor scores; rather suggesting that a total sum score provides an appropriate and internally reliable measure of general MS fatigue symptoms. Although the CFQ was associated with measures of impact of fatigue the size of these correlations was small to moderate suggesting that when measuring fatigue in MS including measures of both fatigue severity and impact are warranted. Future studies should also explore the relationships between the CFQ (measuring severity of fatigue) and measures of performance fatigability including central factors relating to cognitive networks and peripheral factors such as loss of muscle force.
Footnotes
Technical appendix
Summary of model fit.
| Model | Description | No. of free parameters | χ2 (df) | CFI | TLI | RMSEA |
|---|---|---|---|---|---|---|
| 1 | 1-Factor | 44 | 692.5 (44) P<0.01 | 0.98 | 0.97 | 0.18 |
| 2a | 2-Factor | 45 | 395.4 (43) P<0.01 | 0.99 | 0.99 | 0.14 |
| 2b | 2-Factor with residual correlation | 46 | 208.0 (42) P<0.01 | 0.99 | 0.99 | 0.10 |
| 3 | 3-Factor | 47 | 222.1 (41) P<0.01 | 0.99 | 0.99 | 0.10 |
| 4a | Bi-factor with two group factors | 55 | 145.3 (33) p<0.01 | 0.99 | 0.99 | 0.09 |
| 4b | Modified bi-factor with two group factors a | 45 | 33.4 (18) P=0.01 | 0.99 | 0.99 | 0.04 |
| 5 | Bi-factor with three group factors | 54 | 89.9 (34) P<0.01 | 0.99 | 0.99 | 0.06 |
Items 6 and 7 removed (weakness).
RMSEA: root mean squared error of approximation; CFI: confirmatory fit index; TLI: Tucker–Lewis index.
Conflict of interest
The authors declare that there is no conflict of interest.
Funding
This research received no specific grant from any funding agency in the public, commercial, or not-for-profit sectors.
References
Supplementary Material
Please find the following supplemental material available below.
For Open Access articles published under a Creative Commons License, all supplemental material carries the same license as the article it is associated with.
For non-Open Access articles published, all supplemental material carries a non-exclusive license, and permission requests for re-use of supplemental material or any part of supplemental material shall be sent directly to the copyright owner as specified in the copyright notice associated with the article.