
Abstract
Objectives:
To assess the association between optic nerve double inversion recovery (DIR) hypersignal length and retinal axonal loss in neuroinflammatory diseases affecting optic nerves.
Methods:
We recruited patients previously affected (> 6 months) by a clinical episode of optic neuritis (ON). We had 25 multiple sclerosis (MS) patients, eight neuromyelitis optica spectrum disorder (NMOSD) patients and two patients suffering from idiopathic caused ON undergo brain magnetic resonance imaging (MRI); including a 3-dimensional (3D) DIR sequence, optical coherence tomography (OCT) examination and visual disability evaluation. Evaluation criteria were retinal thickness/volume, optic nerve DIR hypersignal length and high/low contrast vision acuity.
Results:
In the whole cohort, we found good associations (< 0.0001) between optic nerve DIR hypersignal length, peripapillary retinal nerve fiber layer thickness, inner macular layers volumes, and visual disability. We found subclinical radiological optic nerve involvement in 38.5% of non-ON MS eyes.
Conclusions:
Optic nerve DIR hypersignal length may be a biomarker for retinal axonal loss, easily applicable in routine and research on new anti-inflammatory or neuroprotective drug evaluation. Detection of subclinical ON with 3D-DIR in a non-negligible proportion of MS patients argues in favor of optic nerve imaging in future OCT MS studies, in order to achieve a better understanding of retinal axonal loss in non-ON eyes.
Keywords
Introduction
Optic neuritis (ON) is an acute inflammatory disorder of the optic nerve with an estimated incidence of 1–2 cases per 100,000/year. It can be isolated or occur in a context of autoimmune diseases of the central nervous system (CNS), mainly multiple sclerosis (MS) and neuromyelitis optica spectrum disorders (NMOSD), or other systemic diseases. 1 Optical coherence tomography (OCT) is a precise tool for quantifying optic nerve injury. Optic nerve magnetic resonance imaging (MRI) enables us to rule out an alternative diagnosis and to highlight optic nerve inflammation. 1 For optic nerve imaging, coronal T2-weighted sequences with both fat and water suppression achieve consensus.
Some studies report that a greater T2 hypersignal length at the acute phase could predict at a distance of the ON episode higher visual disability evaluated by visual acuity (VA), 2 and visual field defect or color vision, 3 whereas others do not.4,5 Studies coupling T2 hypersignal length assessment at the acute phase of ON and retinal axonal loss measured by OCT at a distance of ON failed to show any correlation between both parameters.6–8 Peripapillary retinal nerve fiber layer (pRNFL) thinning at a chronic stage (three years after ON) is not correlated to the T2 hypersignal length at the same time. 9
All MRI studies previously investigating T2 hypersignal length on optic nerves assess indirectly the length, by multiplying the number of slices with abnormal signal by the slice thickness. Recently, two studies demonstrated that three-dimensional (3D)-fluid-attenuated inversion recovery (FLAIR) 10 and 3D-double inversion recovery (DIR) 11 sequences were better for optic nerve lesion detection than classical coronal 2D-fast spin echo T2 fat-suppressed and coronal 2D-short tau inversion recovery FLAIR, respectively. The possibility of reconstruction with 3D sequences makes suitable the direct and precise measurement of T2 hypersignal length on pathological optic nerves.
The objective of our study was to evaluate correlations between optic nerve DIR hypersignal length and retinal axonal loss at a chronic stage of ON. Intra- and inter-observer agreement on a length measurement method will also be assessed.
Methods
Population
This is a prospective cohort study conducted between June 2013 and June 2014, in our hospital in Lille, France. The included patients were followed up in our center since the beginning of their disease (MS or NMOSD or idiopathic ON (ION)) and presented at least one clinical episode of ON. The ON diagnosis was based on clinical findings and neuro-ophthalmological examination. The diagnosis of ION was made after a complete negative diagnosis work-up 1 and 12 months follow-up.
This study was approved by our local ethical committee of the Centre Hospitalier Régional et Universitaire of Lille. Written informed consent was obtained for all participants. Consenting adults (18–65 years of age) diagnosed with a history of clinical ON (⩾ 6 months) were prospectively recruited. Subjects with other retinal pathology (e.g. glaucoma, uveitis, surgery or traumatism), or severe ametropia (⩾ 6 dioptries), were excluded. The delay between OCT and MRI was < 3 months.
Magnetic resonance imaging
Brain MRI were performed on a 3-Tesla (3-T) MRI (Achieva; Philips, Best, the Netherlands) using 32-channel array head coils. The imaging protocol notably included a 3D-DIR sequence (Figure 1(a) to 1(d); see MRI methodology appendix in supplementary data). During the 3D-DIR acquisition, patients were asked to close their eyes and to avoid eye movements as much as possible.
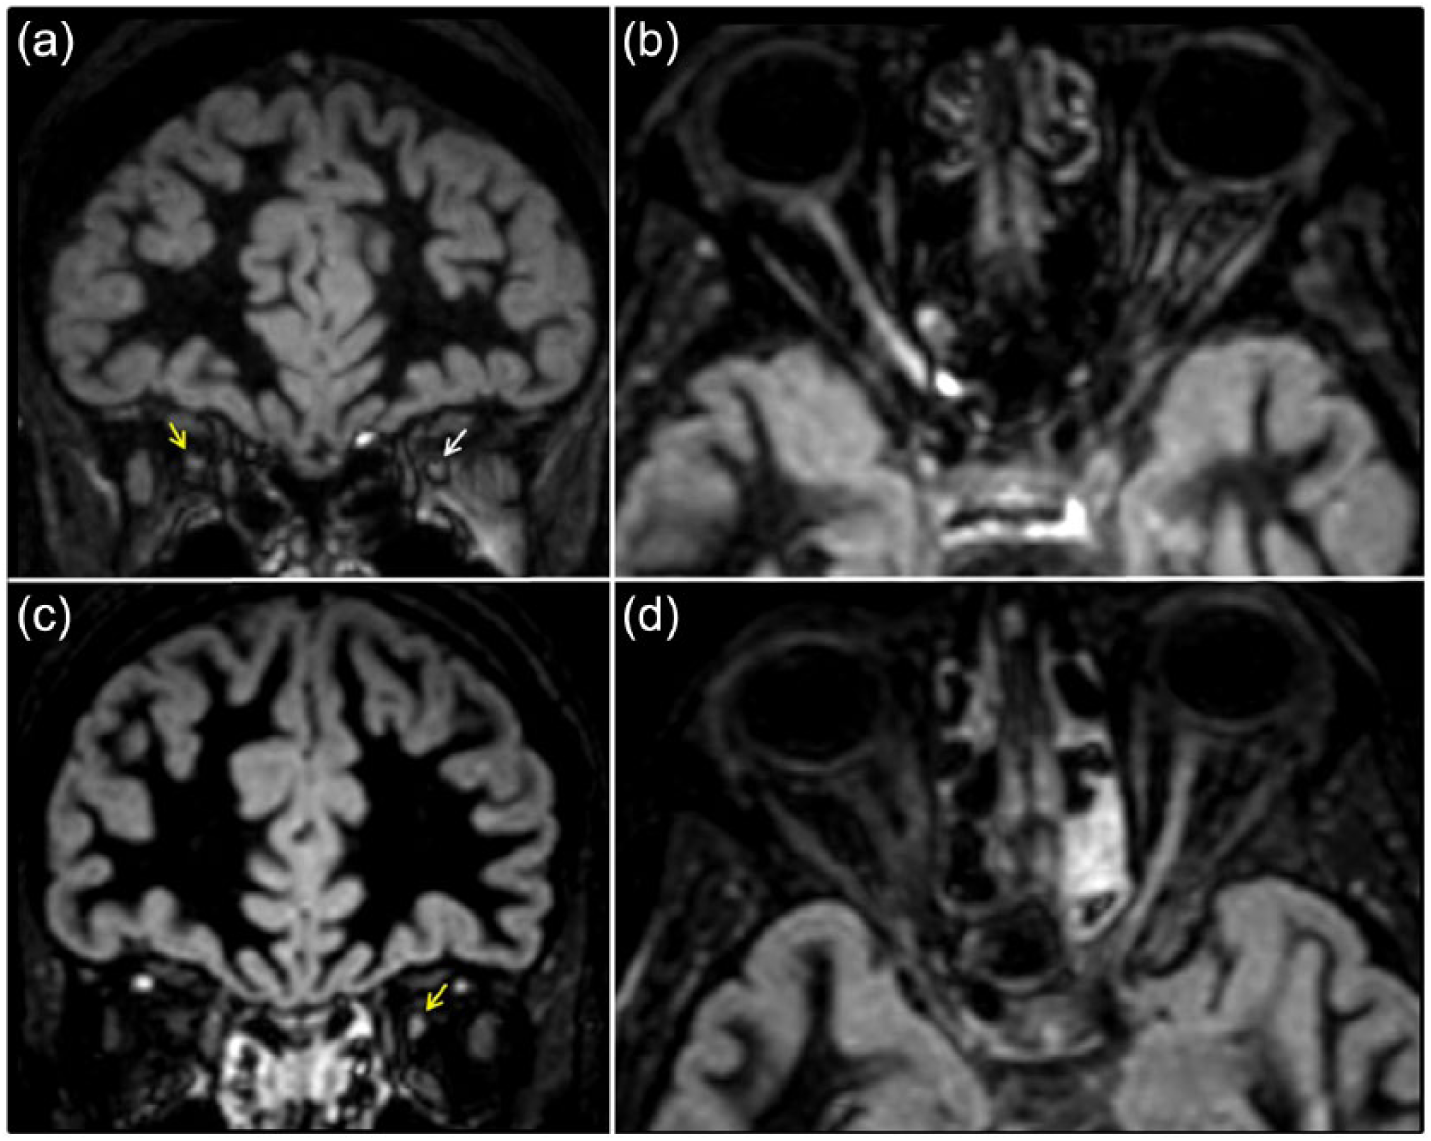
Optic nerve imaging with 3D-DIR sequence.
For each pathological optic nerve, the length of DIR hypersignal was measured by two trained independent observers (Obs 1 and Obs 2) on anonymized MRI data. They were aware that patients presented at least one clinical episode of ON and had previously established a consensual method of measurement, directly on the MRI workstation. First, optic chiasma was spotted in the neuro-ocular plane. Then, the observer looked for the oblique reconstruction plan enabling the analysis of the entire optic nerve and lesion(s). Optic nerves were studied one after the other, in 3-mm-thick reformatted sections of 3D-DIR images (using post-acquisition processing: Multi-planar, maximum-intensity projection). The optic nerve was divided into three segments (orbital, canalicular and pre-chiasmal). For each optic nerve, the presence/absence, the number and the total length of DIR hypersignal were recorded. If a patient presented several hyperintensities, we added the different lengths. Obs 1 made the measurement once and Obs 2, twice.
Optical coherence tomography
OCT examination was performed with a Spectral Domain-OCT (Spectralis®, Heidelberg Engineering, Germany). Our OCT protocol included a peripapillary scan for measuring pRNFL (12°, 3.4 mm circular scan around the optic nerve, with a minimum of 50 automatic real time (ART) and respecting OSCAR-IB criteria 12 and a macular scan consisting of 25 vertical scans centered on the fovea (minimum of 25 ART).
A macular segmentation was performed with a beta software version (multilayer segmentation algorithm, Heidelberg Engineering, version 6.0.0.3.) in an anonymized manner. The mean volume (early treatment diabetic retinopathy study (ETDRS), 6 mm) was calculated for each macular layer.
OCT scan parameters included in our analysis were global pRNFL, temporal pRNFL, macular RNFL (mRNFL), macular ganglion cell layer (GCL), macular inner plexiform layer (IPL), macular inner nuclear layer (INL), macular outer plexiform layer (OPL) and macular outer nuclear layer (ONL).
Microcystic macular oedema (MMO) was defined as the presence of cystic lesions on at least one scan.
Visual disability
At the time of OCT, we collected the VA (Snellen charts) and the low-contrast monocular VA with the best available correction, if needed (2.5% Precision Vision ETDRS charts). Contrast VA score was established by the number of correctly reported letters (maximum of 60 letters, with 12 lines of five letters). 13
Statistical analysis
Intra- and inter-observer agreements of optical nerve imaging analysis were assessed using Kappa coefficient for qualitative parameters and intraclass correlation coefficient (ICC) for quantitative parameters. The associations between length of optic nerve DIR hypersignal and retinal axonal loss or visual disability parameters were studied using linear mixed models, including patient as random effect, to take into account the correlation between eyes in the same patient: In these models, the length of optic nerve DIR hypersignal was the fixed effect. From the linear mixed model, we derived the R-squared (R2) measure, based on a likehood ratio test. INL, OPL and ONL volumes were compared between subgroups of eyes with and without optic nerve DIR hypersignal using linear mixed models including group as fixed effect and patient as random effect. Finally, retinal axonal loss or visual disability parameters were compared between subgroups of eyes defined by the localization of DIR hypersignal using linear mixed models adjusted for length of optic nerve DIR hypersignal.
In these models, the fixed effects were group and length of optic nerve DIR hypersignal, and the patient was the random effect. We checked the normality of model residuals with the normal probability plot. We did not adjust for multiple comparisons, given the small sample size and the exploratory nature of this study. Statistical testing was done at the 2-tailed α level of 0.05. Data were analyzed with SAS version 9.4 (SAS Institute, Cary, NC, USA).
Results
Population
We recruited ON patients presenting relapsing–remitting MS (n = 25), NMOSD (n = 8) and ION (n = 2). The demographic and clinical characteristics of patients are summarized in Table 1. We had 15 patients with a past history of a bilateral clinical episode of ON. Twelve were MS and three were NMOSD patients. Among all the NMOSD patients, five were anti-aquaporin 4 antibody positive (62.5%). No patient presented with any new visual complaint nor clinical relapse between MRI and OCT examinations. The median for delay between performance of the OCT and MRI was 1 (range, 0–12) week, within the whole cohort. For patients with last ON episode ⩽ 12 months, the median delay between OCT and MRI performance was 1 (range, 0–1) week. Within the whole cohort, the median delay between the performance of MRI and OCT represented 0.52 % (range, 0–3.92%) of the delay from the last ON.
Demographic and clinical characteristics of study.
EDSS: Expanded Disability Status Scale; F: female; ION: idiopathic optic neuritis; M: male; MS: multiple sclerosis; NMOSD: neuromyelitis optica spectrum disorder; ON: optic neuritis.
Optical coherence tomography and MRI quality
The quality of the OCT scans was good. No OCT scan was rejected. In one MS patient with a past history of bilateral ON, macular scans of both eyes were missing due to hard-drive failure. The MRI quality of the 3D-DIR sequence was good without any significant ocular motion artefact. No optic nerve lesions were gadolinium enhanced.
Intra and inter-observer’s agreement for optical nerve imaging
Concerning detection of the optic nerve hypersignal, the optimal intra-observer (kappa = 1.00) and excellent inter-observer (kappa = 0.96; 95% CI (0.88–1.00)) agreements were noted.
Concerning assessment of the number of optic nerve hypersignals, excellent intra-observer (kappa = 0.95; 95%CI (0.88–1.00)) and moderate inter-observer (kappa = 0.60; 95%CI (0.43–0.77)) agreements were noted. Disagreement was mainly observed for considering one or two hypersignals within one optic nerve. Some lesions could be contiguous, so it was sometimes difficult to distinguish one or two separate hypersignals. For both observers, the median number of DIR hypersignals was 1 (0–2).
Concerning measurement of optic nerve DIR hypersignal length, excellent intra-observer (ICC = 0.98) and very good inter-observer (ICC = 0.83) agreements were noted. As the results of both observers were very close, we randomly selected the evaluation of Obs 1 for the next analyses.
MRI and OCT findings
We had 50 eyes (from 35 patients) previously affected by at least one clinical episode of ON. Among these ‘ON eyes’, a DIR hypersignal was always detected. Within non-ON eyes (‘NON eyes’; n = 20), at least one DIR hypersignal was detected in five MS patients. No NMOSD nor ION patients presented any subclinical optic nerve hypersignal. Table 2 shows the OCT values and DIR hypersignal length of ON eyes, NON eyes, eyes with optic nerve DIR hypersignal (DIR + eyes) and eyes without optic nerve DIR hypersignal (DIR – eyes).
Length of optic nerve DIR hypersignal, retinal thickness/volume and visual disability within different eye groups.
The median length of optic nerve DIR hypersignal is only calculated among the five NON eyes presenting subclinical radiological involvement.
DIR: double inversion recovery; DIR + eyes: eyes with optic nerve double inversion recovery hypersignal, DIR – eyes: eyes without optic nerve double inversion recovery hypersignal; GCL: ganglion cell layer; INL: inner nuclear layer; ION: idiopathic ON; IPL: inner plexiform layer; mRNFL: macular retinal nerve fiber layer; MS: multiple sclerosis; NMOSD: neuromyelitis optica spectrum disorder; NON eyes: eyes without a past history of ON; ON: optic neuritis; ON eyes: eyes with a past history of ON; ONL: outer nuclear layer; OPL: outer plexiform layer; pRNFL: peripapillary retinal nerve fiber layer; TMV: total macular volume.
Association between length of optic nerve DIR hypersignal, retinal thickness/volume and visual disability
Within the whole cohort, the length of optic nerve DIR hypersignal was very well associated with visual disability and all OCT parameters; except INL, OPL and ONL (Table 3). All significant associations argued in favor of greater retinal atrophy and visual disability, when the length of DIR hypersignal increases. For example, a 1-mm increase in length of the DIR hypersignal was associated with a 0.86 (± 0.16) µm decrease in global pRNFL. The R2 value measuring the association between global pRNFL and length of DIR hypersignal was 35.9% (Figure 2).
Associations between the length of optic nerve DIR hypersignal and retinal thickness/volume or visual disability.
For associations between macular volumes and length of hyper T2-DIR lesions, analysis included 53 eyes within the whole population and 40 eyes within the MS population.
β indicates regression coefficient, which corresponds to the change in retinal thicknesses/volumes or visual disability per mm increase in length of optic nerve DIR hypersignal.
DIR: double inversion recovery; GCL: ganglion cells layer; INL: inner nuclear layer; ION: idiopathic optic neuritis; IPL: inner plexiform layer; mRNFL: macular retinal nerve fiber layer; MS: multiple sclerosis; NMOSD: neuromyelitis optica spectrum disorder; ONL: outer nuclear layer; OPL: outer plexiform layer; pRNFL: peripapillary retinal nerve fiber layer; SE: standard error; TMV: total macular volume.
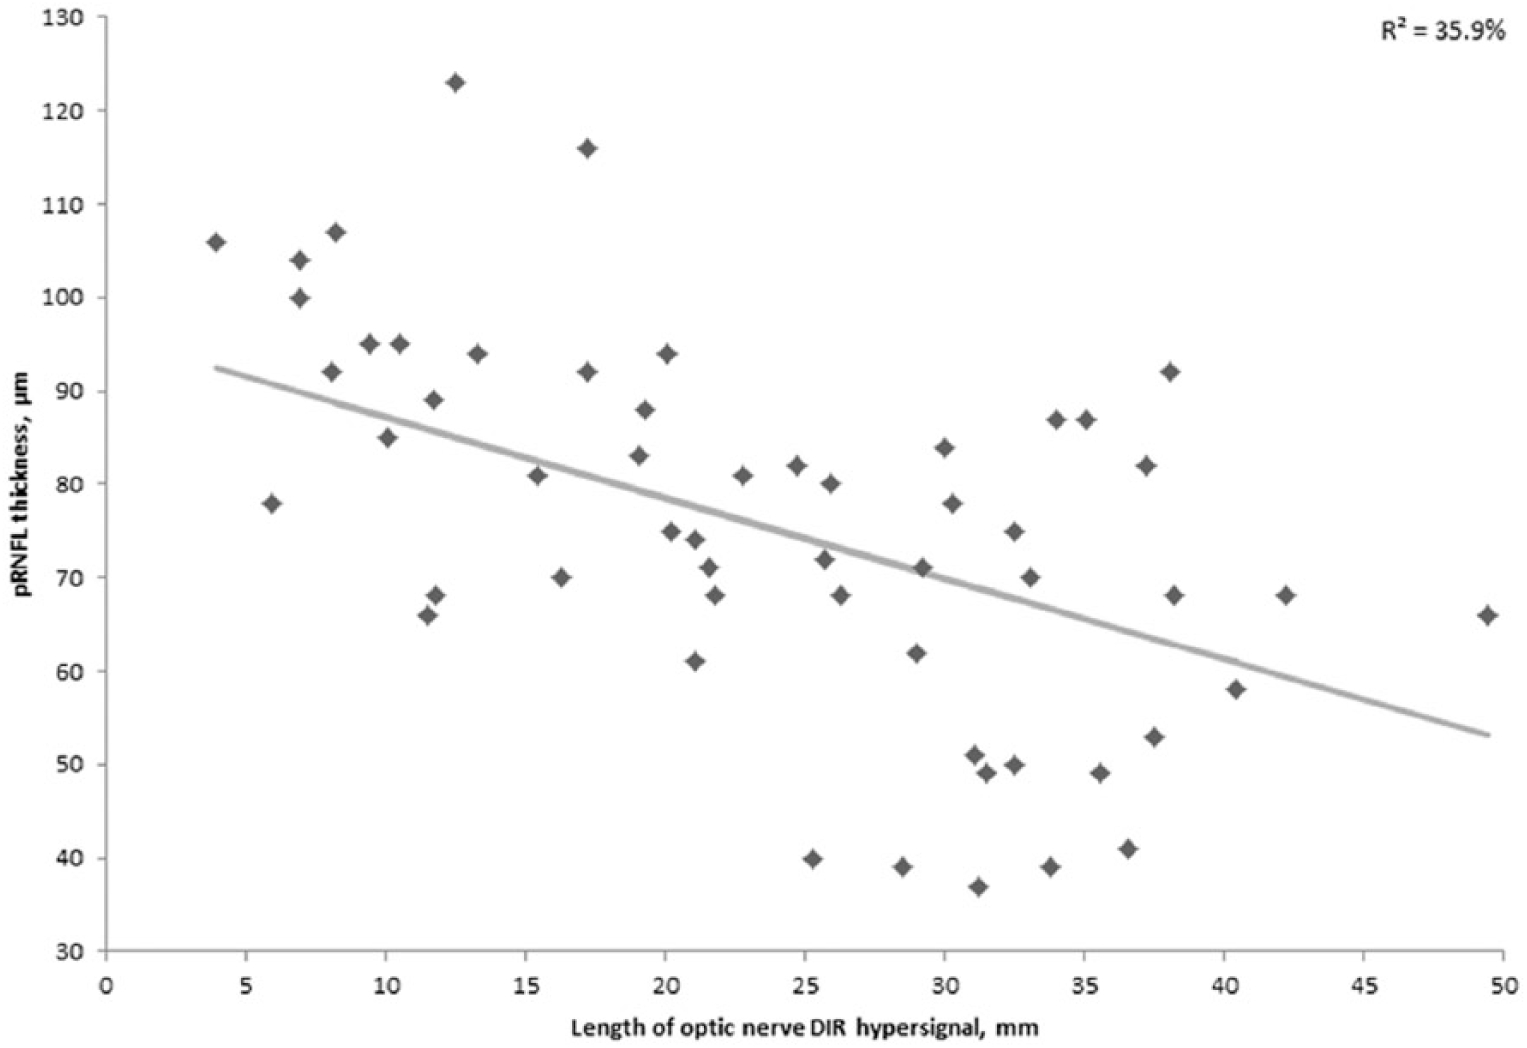
Association between length of optic nerve DIR hypersignal and global pRNFL thickness.
Similar results were found when analyses were repeated separately in MS and NMOSD/ION subgroups, except for TMV and visual disability in the NMOSD/ION subgroup (p < 0.1).
Comparisons of INL, OPL, ONL volumes according to the presence of optic nerve hypersignal
For the macular INL, we considered an additional sub-analysis, excluding the eyes with MMO (n = 7). MMO was identified in seven of the MS ON eyes (19.4% of MS-ON eyes, 14.6% of ON eyes) and always located on the INL.
Mean volume of INL was significantly greater (p = 0.02) in DIR + eyes (0.98 ± 0.02 mm3) versus DIR – eyes (0.91 ± 0.03 mm3). If we excluded the MMO eyes, the mean volume of INL remained significantly greater (p = 0.03) in the DIR + eyes (0.97 ± 0.01 mm3) versus the DIR – eyes.
We found a trend towards significance in favor of ONL thickening in DIR + eyes (p = 0.06). OPL thickness was similar between the DIR + and DIR – eyes.
Patients with optic nerve DIR hypersignal, but no past clinical ON history
No subclinical optic nerve hypersignals were observed in the NMOSD/ION group. Of the MS patients, 20% presented subclinical radiological involvement of one optic nerve. Among MS NON eyes, an optic nerve hypersignal was found in 38.5%. Among the MS eyes, the median (range) of global pRNFL thicknesses was 91 (87–100), 81 (75–116) and 78 (39–123) µm for healthy eyes (n = 8), subclinically-involved eyes (n = 5) and ON eyes (n = 37), respectively. The median (range) of temporal pRNFL were 55.5 (52–75), 53 (48–67) and 40 (25–85) µm for healthy eyes, subclinically-involved eyes and ON eyes, respectively. The median (range) of DIR hypersignal length was 17.2 (8.1–25.9) and 24.7 (3.9–49.4) mm for the subclinically-involved and ON eyes, respectively. Because of the small size of our subgroups, statistical comparisons were not possible.
Topography of optic nerve DIR hypersignal and retinal atrophy
Among the DIR + eyes (Table 4), the orbital segment was involved in 92.7% (n = 51), canalicular segment in 74.6% (n = 41) and pre-chiasmal segment in 47.3% (n = 26).
Comparison of retinal axonal loss according to the presence of canalicular involvement or not, with adjustment to length of DIR hypersignal. a
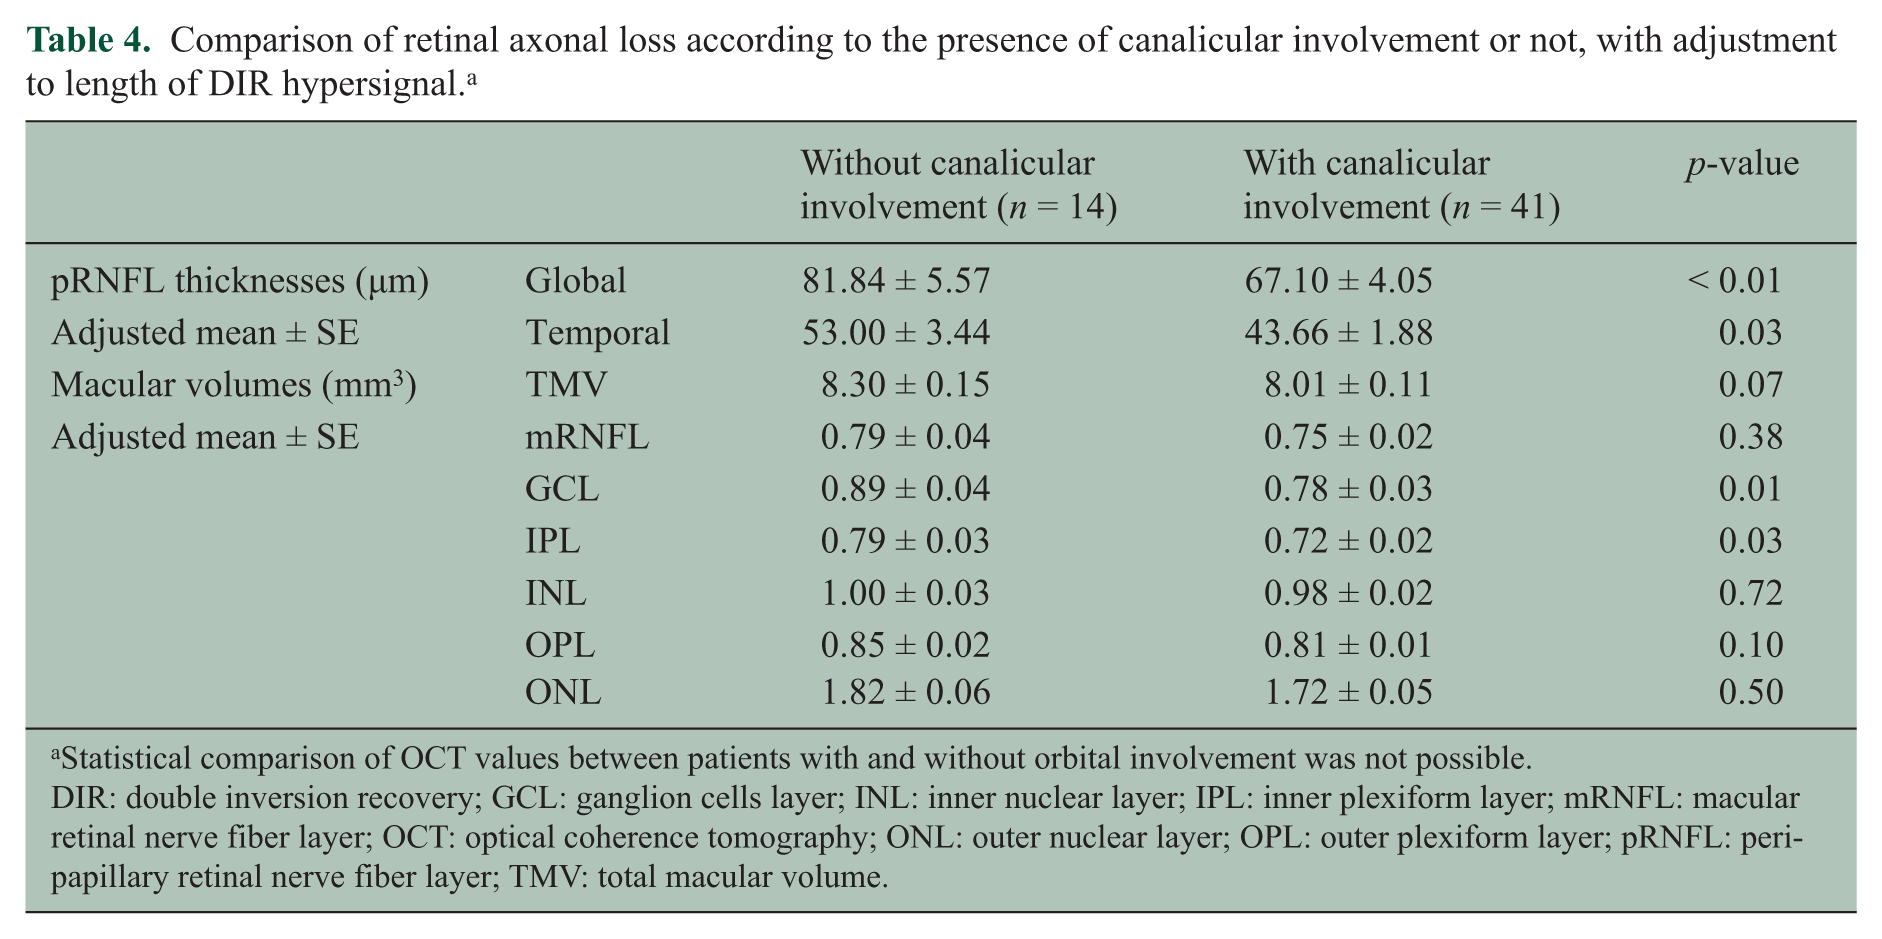
Statistical comparison of OCT values between patients with and without orbital involvement was not possible.
DIR: double inversion recovery; GCL: ganglion cells layer; INL: inner nuclear layer; IPL: inner plexiform layer; mRNFL: macular retinal nerve fiber layer; OCT: optical coherence tomography; ONL: outer nuclear layer; OPL: outer plexiform layer; pRNFL: peripapillary retinal nerve fiber layer; TMV: total macular volume.
By adjusting to the DIR hypersignal length, the eyes with canalicular involvement presented a significantly greater global pRNFL, temporal pRNFL, GCL and IPL atrophy than those without. Pre-chiasmal involvement did not influence retinal atrophy. The same analysis was not possible for orbital involvement, because very few patients presented no orbital involvement.
Discussion
In the present study, we showed that 3D-DIR sequence enable us to measure the optic nerve hypersignal length with an excellent intra-observer and very good inter-observer agreement, and that the optic nerve DIR hypersignal length measured at a chronic stage of ON was well correlated to retinal axonal loss and visual disability. Furthermore, we detected subclinical radiological optic nerve involvement in a non-negligible proportion of MS patients and showed that canalicular involvement favored a greater retinal axonal loss.
The methodology for DIR hypersignal length measurement was manual and our high inter-observer reproducibility was in contrast with the low inter-observer reproducibility of manual brain T2 lesion load measurement in MS; however, we measured a length and not a volume, we used a very sensitive sequence with a high contrast rate 11 and the number of optic nerve hypersignals was low. The moderate inter-observer agreement concerning the number of detected DIR hypersignals was not associated with a low inter-observer agreement concerning DIR hypersignal length measurement. The only difficulty found was to be able to differentiate two confluent lesions from two closed, but distinct lesions. The median length of DIR hypersignal that we measured remained within the range of previous studies.2–9,14–19
We demonstrated that at a chronic stage of ON, the DIR hypersignal length was well correlated to retinal axonal loss evaluated by a 4th-generation OCT. Good correlation between retinal thickness and visual disability had been reported,20,21 and we also found good correlation between visual disability and the length of optic nerve DIR hypersignal. Thus, the DIR hypersignal length appears as a potential biomarker of retinal axonal loss at a chronic stage of ON in neuroinflammatory diseases. Lower statistical significance was observed in NMOSD/ION, but we assumed that it was due to the small size of this group. Interestingly, INL/OPL/ONL thicknesses were not correlated to DIR hypersignal length. Considering INL, this result seemed to be due to INL thickening after ON, whether or not there was presence of MMO. This is in total agreement with a recently-published MS/NMOSD/CRION OCT study. 22
Studies show that in ON eyes, outer retinal layers (ONL/OPL) were spared by the atrophic process and slightly thickened at the chronic phase 23 or transiently at the acute phase. 24 ONL thickening has also been described in MMO eyes versus healthy controls. 25 Comparing eyes with and without DIR hypersignal, the ONL thickening might also be discussed in our study. OPL remained unchanged. We did not include healthy controls in our study, but we considered OPL and ONL separately and looked for subclinical optic nerve involvement. If INL, OPL and ONL may thicken after ON with25,26 or without MMO,23,24,26 this thickening does not seem to be correlated with retinal axonal loss, and predominates in both INL and ONL.
If we demonstrated at a chronic stage of ON, that there was a good correlation between hypersignal length and numerous retinal layer thicknesses, including the most relevant (global pRNFL and macular GCL); a previous study demonstrating the correlation between visual disability and optic nerve T2 hypersignal length at a chronic stage, did not. 9 In this previous study, nine OCT (3rd generation) and MRI (1.5T and quadrature head coil) devices were different, the imaging sequence was less sensitive than a 3D sequence 10 and the hypersignal length was estimated indirectly: This might explain the conflicting results also observed in correlation studies between hypersignal length and visual disability3,4 or amplitude of visual-evoked potential (VEP).9,14
Previous studies coupling OCT and optic nerve imaging focus on lesion length at the acute phase and retinal thicknesses at the acute 3 or chronic phase.6–9 They show a link between pRNFL thickening and lesion length at the acute phase, but do not show any prognostic value in terms of retinal atrophy away from ON; however, it has been shown that greater T2 lesion length on the optic nerve at the acute phase is associated with a worse visual prognosis.2,3 The evolution of T2 lesion length after ON is quite variable. It might slightly decrease 14 or increase,4,19 or may be stable.3,5,8 Thus, it is difficult to predict if DIR hypersignal length at the acute phase would be predictive of retinal atrophy.
In our study, canalicular involvement was associated with a greater retinal atrophy. In fact, three previous studies report a worse visual prognosis when canalicular involvement is observed at the acute phase on T22,3 or T1 with gadolinium 27 sequences. In the optic canal, the optic nerve injured by an oedematous inflammatory process is more cramped than in orbital or prechiasmatic locations. Although it is probably not the main pejorative factor of axonal loss, it adds a compressive process to the inflammatory process.
Subclinical DIR hypersignals were detected in 38.5% of the NON MS eyes and none was detected in the NMOSD/ION population. Subclinical alterations of the visual system in MS have been demonstrated on VEP, 28 OCT 21 and MRI.2,29,30 Subclinical optic nerve involvement is considered much less frequent in NMOSD than in MS. 31 Subclinical retinal atrophy in MS is presumed to be due to subclinical ON with retrograde degeneration and/or to the inflammatory process on optic radiations, with retrograde transynaptic degeneration.23,30 The correlations between VEP latencies and diffusion tensor imaging optic radiations parameters may argue in favor of a predominant retrogenicular demyelinating process, 29 and subclinical VEP alterations have been reported in a large proportion of MS patients (33%) 32 ; however, Miller et al. 2 have already reported a non-negligible proportion of MS patients (16.2%; or 20% in MS NON eyes) presenting subclinical optic nerve lesions. This previous study and ours strongly argue in favor of optic nerve imaging implementation in future OCT MS studies, in order to achieve a better understanding of retinal axonal loss in NON eyes. MS NON eyes presented lower retinal atrophy than MS ON eyes. 20 In the same way, subclinical radiological optic nerve involvement in our MS group might be associated with smaller hypersignal length and lower retinal atrophy.
We acknowledge some limitations in our study. Firstly, our exploratory study was limited by its quite small size, but despite this significant constraint, some good associations were highlighted. We did not adjust for multiple comparisons, given the small sample size and the exploratory nature of the study. Secondly, we did not perform VEP to detect additional subclinical involvement of optic ways, but the 3D-DIR sequence enabled us to detect 20% of subclinical ON. Thirdly, part of our MS patients may have had a quite severe past history of ON, since MMO was found in 19.4% of MS ON eyes; but MMO assessment has a low reproducibility and we applied less stringent MMO diagnostic criteria than the reference paper. 33 We possibly had a recruitment bias with some severe patients, but the visual disability and retinal atrophy presented by our population remained comparable to the literature 20 and we assume that it does not preclude the validity of our results.
If the DIR sequence has been much more developed for the detection of cortical pathology, 34 we showed its interest in T2 optic nerve inflammatory lesion detection 11 and that optic nerve hypersignal length measured on 3D-DIR may be considered as a biomarker for retinal axonal loss at a chronic stage of ON. Thus, the DIR sequence could be an interesting complement to OCT or an alternative to OCT, for evaluating retinal axonal loss after ON, in the case of OCT unavailability or unreliability (myopia > 6 dioptries, diabetes, uveitis…). The DIR hypersignal is not pathologically specific and has been considered much more as a marker of demyelination than of axonal loss. Both a previous study showing an association between DIR cortical lesions volumes and cognitive impairment in RRMS 35 and our results suggest that the DIR sequence may be more pathologically specific by focusing on a specific part of the CNS. Furthermore, subclinical radiological involvement of the optic nerve seems frequent in MS. This argues in favor of having optic nerve imaging in future OCT studies in MS.
Footnotes
Conflict of interest
JH, SDD, AD, ED, JPP and XL have nothing to disclose.
NH reports funding for travel from Teva Phamaceutical Industries, outside the submitted work.
HZ reports personal fees and funding for travel from Biogen-Idec, Bayer, Novartis, Genzyme-Sanofi and Teva Pharmaceutical Industries, and funding for travel from Merck-Serono, outside the submitted work.
PV reports a grant for research from Novartis; grants and personal fees from Merck-Serono and Bayer; personal fees from Biogen-Idec, Almirall, Genzyme-Sanofi and Teva Pharmaceutical Industries, outside the submitted work.
OO reports a grant for research from Novartis; grants and personal fees from Biogen-Idec; and funding for travel from Biogen-Idec, Genzyme-Sanofi, Merck-Serono, Novartis and Teva Pharmaceutical Industries, outside the submitted work.
Funding statement
This research received no specific grant from any funding agency in the public, commercial, or not- for-profit sectors.