
Abstract
Background:
Descriptive epidemiological studies documenting the incidence and prevalence of multiple sclerosis (MS) and studies that report morbidity, mortality, and economic burden provide essential information for patients, healthcare providers, and policymakers. However, the quality of reporting of observational studies is often poor, limiting the ability to evaluate the validity of the findings. The Standards of Reporting of Neurological Disorders (STROND) reporting guideline comprises recommendations and a 15-item checklist of reporting items to aid high-quality reporting of incidence and prevalence studies of neurological disorders.
Methods:
We explain the basic reporting items of the STROND checklist for the methods, results, and discussion sections in the context of the MS literature and searched for examples of good reporting of those items.
Results:
We identified examples of good reporting of the basic reporting items from previous systematic reviews of the descriptive epidemiologic literature in MS.
Conclusion:
The adoption of the STROND reporting guidelines should improve the quality of reporting of descriptive epidemiological studies in MS. Along with efforts to improve methodological aspects of epidemiological studies and harmonization of data collection efforts, improved reporting could contribute to furthering our understanding of the epidemiology of MS.
Introduction
Epidemiological studies that report the incidence and prevalence of multiple sclerosis (MS) and studies that report morbidity, mortality, and economic burden provide essential information for multiple stakeholders. To be useful, these studies must be methodologically sound and appropriately reported. However, the quality of reporting of observational studies is often poor, including in MS,1,2 limiting the ability to evaluate the validity of the findings. Failure to publish or report findings adequately wastes the limited resources available for health research. 3
To address these concerns, reporting guidelines were introduced for observational studies (Strengthening the Reporting of Observational Studies in Epidemiology (STROBE)). 4 Adoption of such guidelines by journals may be associated with improved reporting. 5 However, these guidelines are geared toward analytic studies rather than descriptive epidemiological studies. The Standards of Reporting of Neurological Disorders (STROND) reporting guideline includes recommendations and a 15-item checklist of basic and ideal reporting items to aid high-quality reporting of incidence and prevalence studies of neurological disorders (Table 1). 43 The development of the guideline is described elsewhere, 43 as are the explanations of the items. 44
Standards of Reporting of Neurological Disorders (STROND): a guideline for the reporting of incidence and prevalence studies in neuroepidemiology. a
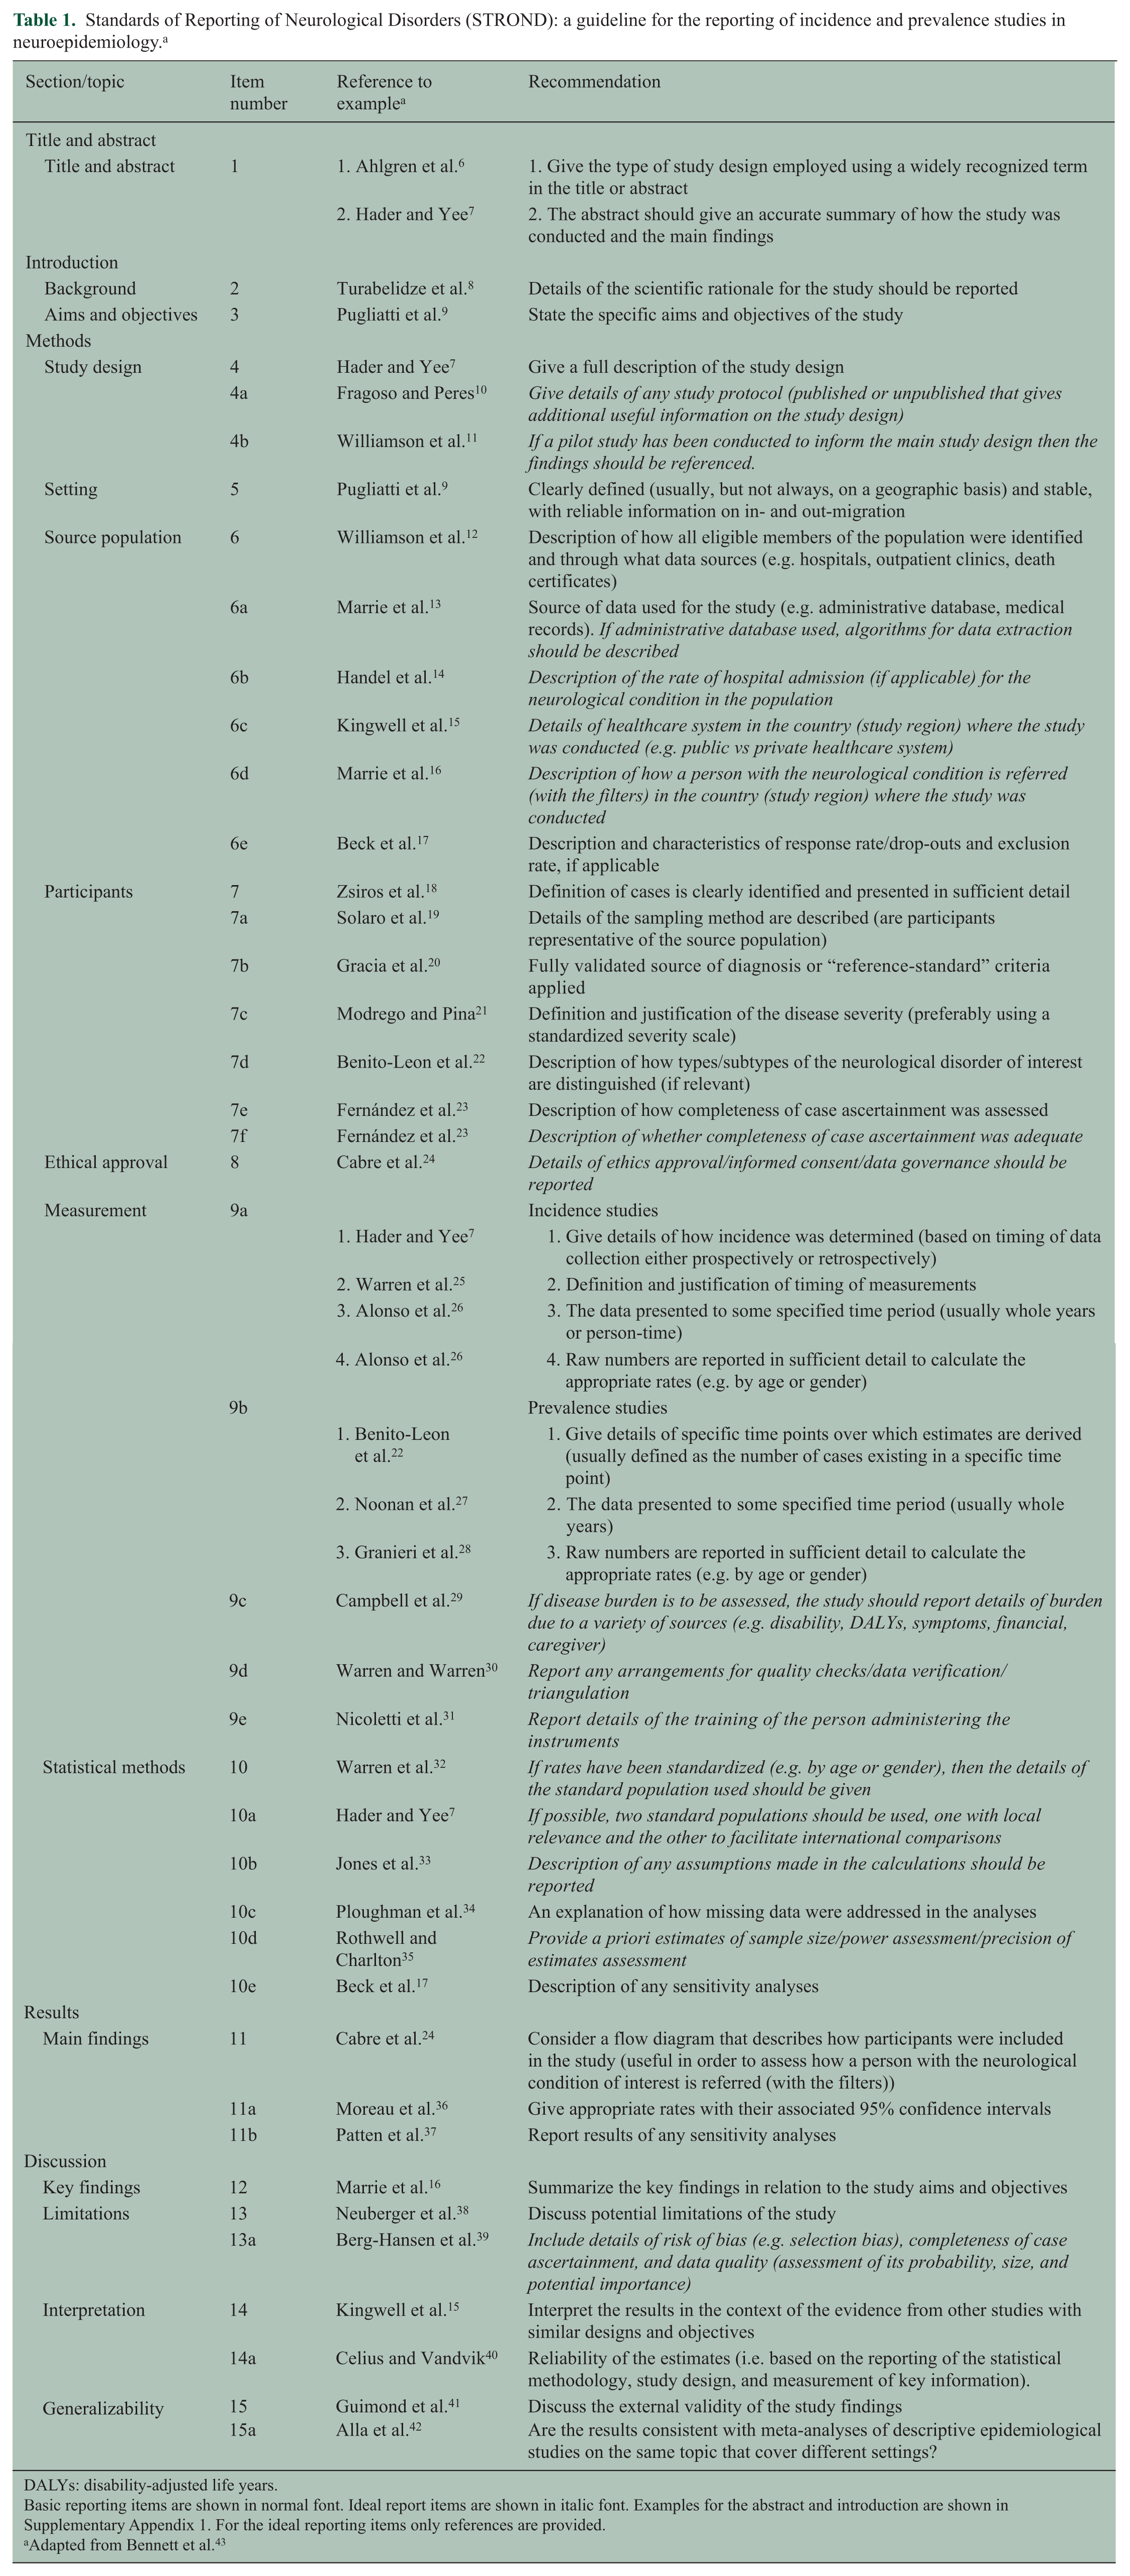
DALYs: disability-adjusted life years.
Basic reporting items are shown in normal font. Ideal report items are shown in italic font. Examples for the abstract and introduction are shown in Supplementary Appendix 1. For the ideal reporting items only references are provided.
Adapted from Bennett et al. 43
To improve awareness of how to employ the STROND checklist, we provide examples of good reporting of basic reporting items for the methods, results, and discussion sections in the context of the MS literature and a description of the item’s intent (underneath the example). The examples were identified using quality scores from systematic reviews of the descriptive epidemiology of MS.2,45–47 Examples of basic reporting items for the title and introduction sections are given in Supplementary Appendix 1.
Methods
Give a full description of the study design
Example: The aims of this population-based prospective study were to determine the incidence of MS over the past 35 years; to estimate the innate risk or the resident at onset rate of MS on January 1, 2005; to identify potential factors influencing the incidence and prevalence rates; and to compare rates with the standardized Canadian, US, European, and world populations.
7
Presenting key elements of the study design early in the publication helps readers to understand the basic aspects of the study.
Setting: clearly defined (usually, but not always, on a geographic basis) and stable, with reliable information on in- and out-migration
Example: The study covered the province of Sassari, in northern Sardinia, that lies between latitudes 40°30′N and 41°N … area of 7520 square kilometers … In the 1991 census, the total population was 454,904 (224,984 men and 229,920 women). Over the past 30 years, the population of the province increased from 381,191 to 454,904 … Migration flow was moderate: in 1995, 1.7% of the total population was registered as resident from other Italian provinces and from foreign countries …
9
To assess the context and study generalizability, readers need to know the study setting and location(s).
Description of how all eligible members of the population were identified and through what data sources
Example: The primary data source used to ascertain cases was medical records from the offices of neurologists practicing in the study area … Additional data sources, such as self-reported cases or cases that were identified through MS advocacy groups, nursing homes, hospital discharge records, and death certificates were also explored to ensure complete case ascertainment.
12
To assess selection bias and generalizability of the findings, readers need a comprehensive description of study participants.
Source of data used for the study (e.g. administrative database, medical records)
Example: To identify residents with possible MS, we searched all physician claims and hospital discharge abstracts from April 1, 1984, through March 31, 2007, for diagnostic codes (ICD-9-CM/ICD-10-CA) for demyelinating diseases of the CNS … We also searched DPIN for MS-specific prescription drugs, including …
13
Multiple data sources can be used to conduct descriptive epidemiological studies; therefore, they need to be described to allow replicability.
Description and characteristics of response rate/drop-outs and exclusion rate if applicable
Example: The sample was constructed in two stages: first, households were selected, mostly by a multistage stratified cluster design (83%), but partially by random digit dialling (7%) and random sampling from telephone lists (10%). Secondly, one or two respondents were chosen within each household … The overall response rate for the survey was 84.7%.
17
Response rates may indicate whether study participants were representative of the target population, validity, and applicability of the findings.
Definition of cases is clearly identified and presented in sufficient detail
Example: All suspected MS cases are referred to the MS Centre at the University from the region of the Southern Great Plain to confirm or exclude the diagnosis. The diagnosis was established by neurology specialists, who applied the criteria of Poser until 2001, but subsequently the criteria of McDonald were introduced … All patients with diagnoses of MS (ICD-9 code 340) according to Poser were reviewed according to the McDonald criteria.
18
The diagnostic criteria for MS and other demyelinating disorders such as neuromyelitis optica have changed over time.48,49 These changes may affect estimates of incidence and prevalence 50 and determine whether findings are applicable to a region where different diagnostic criteria are used.
Details of the sampling method are described (are participants representative of the source population)
Example: MS cases were identified using the following means: hospital records where a neurological or a rehabilitation ward existed, local private practice neurologists, records from the local branches of the Italian MS Society, national healthcare coding system, records for disability pensions and requests for oligoclonal bands analysis … All registered primary care physicians were contacted by letter.
19
The reader needs to know how the sample was identified to determine whether it is representative of the source population and whether appropriate techniques have been employed to account for the sampling scheme used.
Fully validated source of diagnosis or “reference-standard” criteria applied
Example: The study included all patients whose MS diagnosis had been confirmed by a panel of neurologists by clinical findings, neuroimaging such as magnetic resonance imaging (MRI), when cerebral spinal fluid (CSF) was available … Up to 2002, diagnoses performed complied with the Poser criteria and from 2003 until 2005, besides the former, diagnoses should also comply with McDonald’s criteria.
20
Using a specific reference standard allows readers to compare studies employing the same standard.
Definition and justification of the disease severity (preferably using a standardized severity scale)
Example: Disability was assessed by means of EDSS.
21
Describing the severity of the disease in the study population allows the reader to determine how the findings may apply to their own patients or population. The Expanded Disability Status Scale (EDSS) 51 is one commonly used instrument; regardless of the instrument used it should be reported.
Description of how types/subtypes of the neurological disorder of interest are distinguished (if relevant)
Example: Patients were categorized as relapsing-remitting (RRMS), secondary progressive (SPMS), or primary progressive (PPMS). PPMS was defined as being progressive from onset without relapses or remissions, although periods of apparent stability were allowed. Patients with SPMS, after an initial relapsing-remitting period, had entered a progressive phase with or without relapses over at least the previous 6 months.
22
Trajectories of disease may differ by disease course and definitions of subtypes may differ. Subtype classification needs to be described so that the reader can understand the characteristics of the sample.
Description of how completeness of case ascertainment was assessed
Example: We used four sources of information from hospitals located in the province of Malaga: The database of … After … a database was created with the name, surname, sex, address and date of birth based on the registries provided by the four sources. Patients with identical names and at least one other variable in common were considered overlaps. After identifying the overlaps, log-linear models for the [capture-recapture method] were used to estimate the total number of MS patients (undetected and detected) and the prevalence rate.
23
A thorough explanation of ascertainment methods allows readers to understand the strategies and sources used to ensure complete case ascertainment. When estimating incidence and prevalence, all cases of the condition must be found during the specified estimation period. The use of multiple sources may result in duplicate individuals, and a description of how this was mitigated is important. The location of ascertainment is also important, as the severity of cases may differ between settings (i.e. a tertiary care MS center vs community setting).
Incidence studies: (1) give details of how incidence was determined (based on timing of data collection either prospectively or retrospectively)
Example: In the 35-year period from January 1, 1970, to December 30, 2004, there were 558 incidence cases identified in Saskatoon, 402 women and 156 men, for a sex ratio of 2.6:1 (Table 1).
Readers must know how incidence was defined and over what period.
Incidence studies: (2) definition and justification of timing of measurements
Example: To separate incident from prevalent cases, a “run-in” period of 10 years was used. Therefore, a person was defined as an incident case if there was no record of medical service related to MS for at least 10 years before first notation of a diagnosis after 1990 in these databases. A 10-year “run-in” period was considered sufficient given that the average annual relapse rate is thought to be about one in each 2 years.
25
A description of timing is important for incidence studies to ensure that incident, rather than prevalent cases of disease are ascertained. The time frame for data collection and the run-in to data collection are important because disease latency periods may differ.
Incidence studies: (3) the data presented to some specified time period (usually whole years or person-time)
Example: The crude incidence rate was 5.5 cases per 100,000 person-years (95% confidence interval (CI) 5.1, 5.9) for the entire population, 7.4 per 100,000 person-years (95% CI 6.8, 8.1) for women, and 3.4 for men (95% CI 3.0, 3.9).
26
The reader must know the time unit of the denominator in which incidence is described to understand the magnitude of the results and their comparability with other work.
Incidence studies: (4) raw numbers are reported in sufficient detail to calculate the appropriate rates (e.g. by age or gender)
Example: During the study period, we estimated 444 new diagnoses of MS among 5,763,668 person-years in women, and 198 newly diagnosed cases among 5,981,973 person-years in men.
26
Detailed reporting of numbers allows replication of the findings and supports future meta-analyses.
Prevalence studies: (1) give details of specific time points over which estimates are derived (usually defined as the number of cases existing in a specific time point)
Example: Eighty-five MS patients were identified who were alive on prevalence day; 50 (58.8%) had clinically definite MS, 24 (28.2%) laboratory-supported definite MS, and 11 (12.9%) clinically probable MS … One clinically definite MS patient who died before prevalence day was not included. The crude prevalence for definite and probable MS was 43.4/100,000 (95% CI, 34.7 to 53.7).
22
The authors should report whether cases were ascertained at a single period of time (point prevalence) or over a pre-defined period (period prevalence) for clarity and to support statistical comparisons.
Prevalence studies: (2) the data presented to some specified time period (usually whole years)
Example: We calculated age- and sex-specific period prevalence estimates by using the definite and probable MS cases ascertained from 1998 through 2000 as the numerator and the 2000 census counts for the study areas as the denominator.
52
Defining the time period of ascertainment is relevant for understanding when the data apply and allows for comparability to studies in other time periods when secular trends may apply.
Prevalence studies: (3) raw numbers are reported in sufficient detail to calculate the appropriate rates (e.g. by age or gender)
Example: On the prevalence day, December 31, 2004, 423 patients (300 women and 123 men) suffering from definite (n = 399, 282 women and 117 men) or probable (n = 24, 15 women and 9 men) MS were living in the province of Ferrara … Table 1 shows age- and sex-specific prevalence rates.
28
The reporting of raw numbers facilitates future meta-analyses, and stratifying by age and gender provides valuable information with which to compare studies.
An explanation of how missing data were addressed in the analyses
Example: Missing data were imputed using three techniques: (1) deductive imputation, (2) person mean substitution (PMS) and (3) “hot deck” imputation … If less than half of the data were missing on a section, scale or subscale, PMS was used …
34
A description of how missing data are dealt with allows the reader a level of understanding of the accuracy of the data.
Results
Consider a flow diagram that describes how participants were included in the study (useful in order to assess how a person with the neurological condition of interest is referred (with the filters))
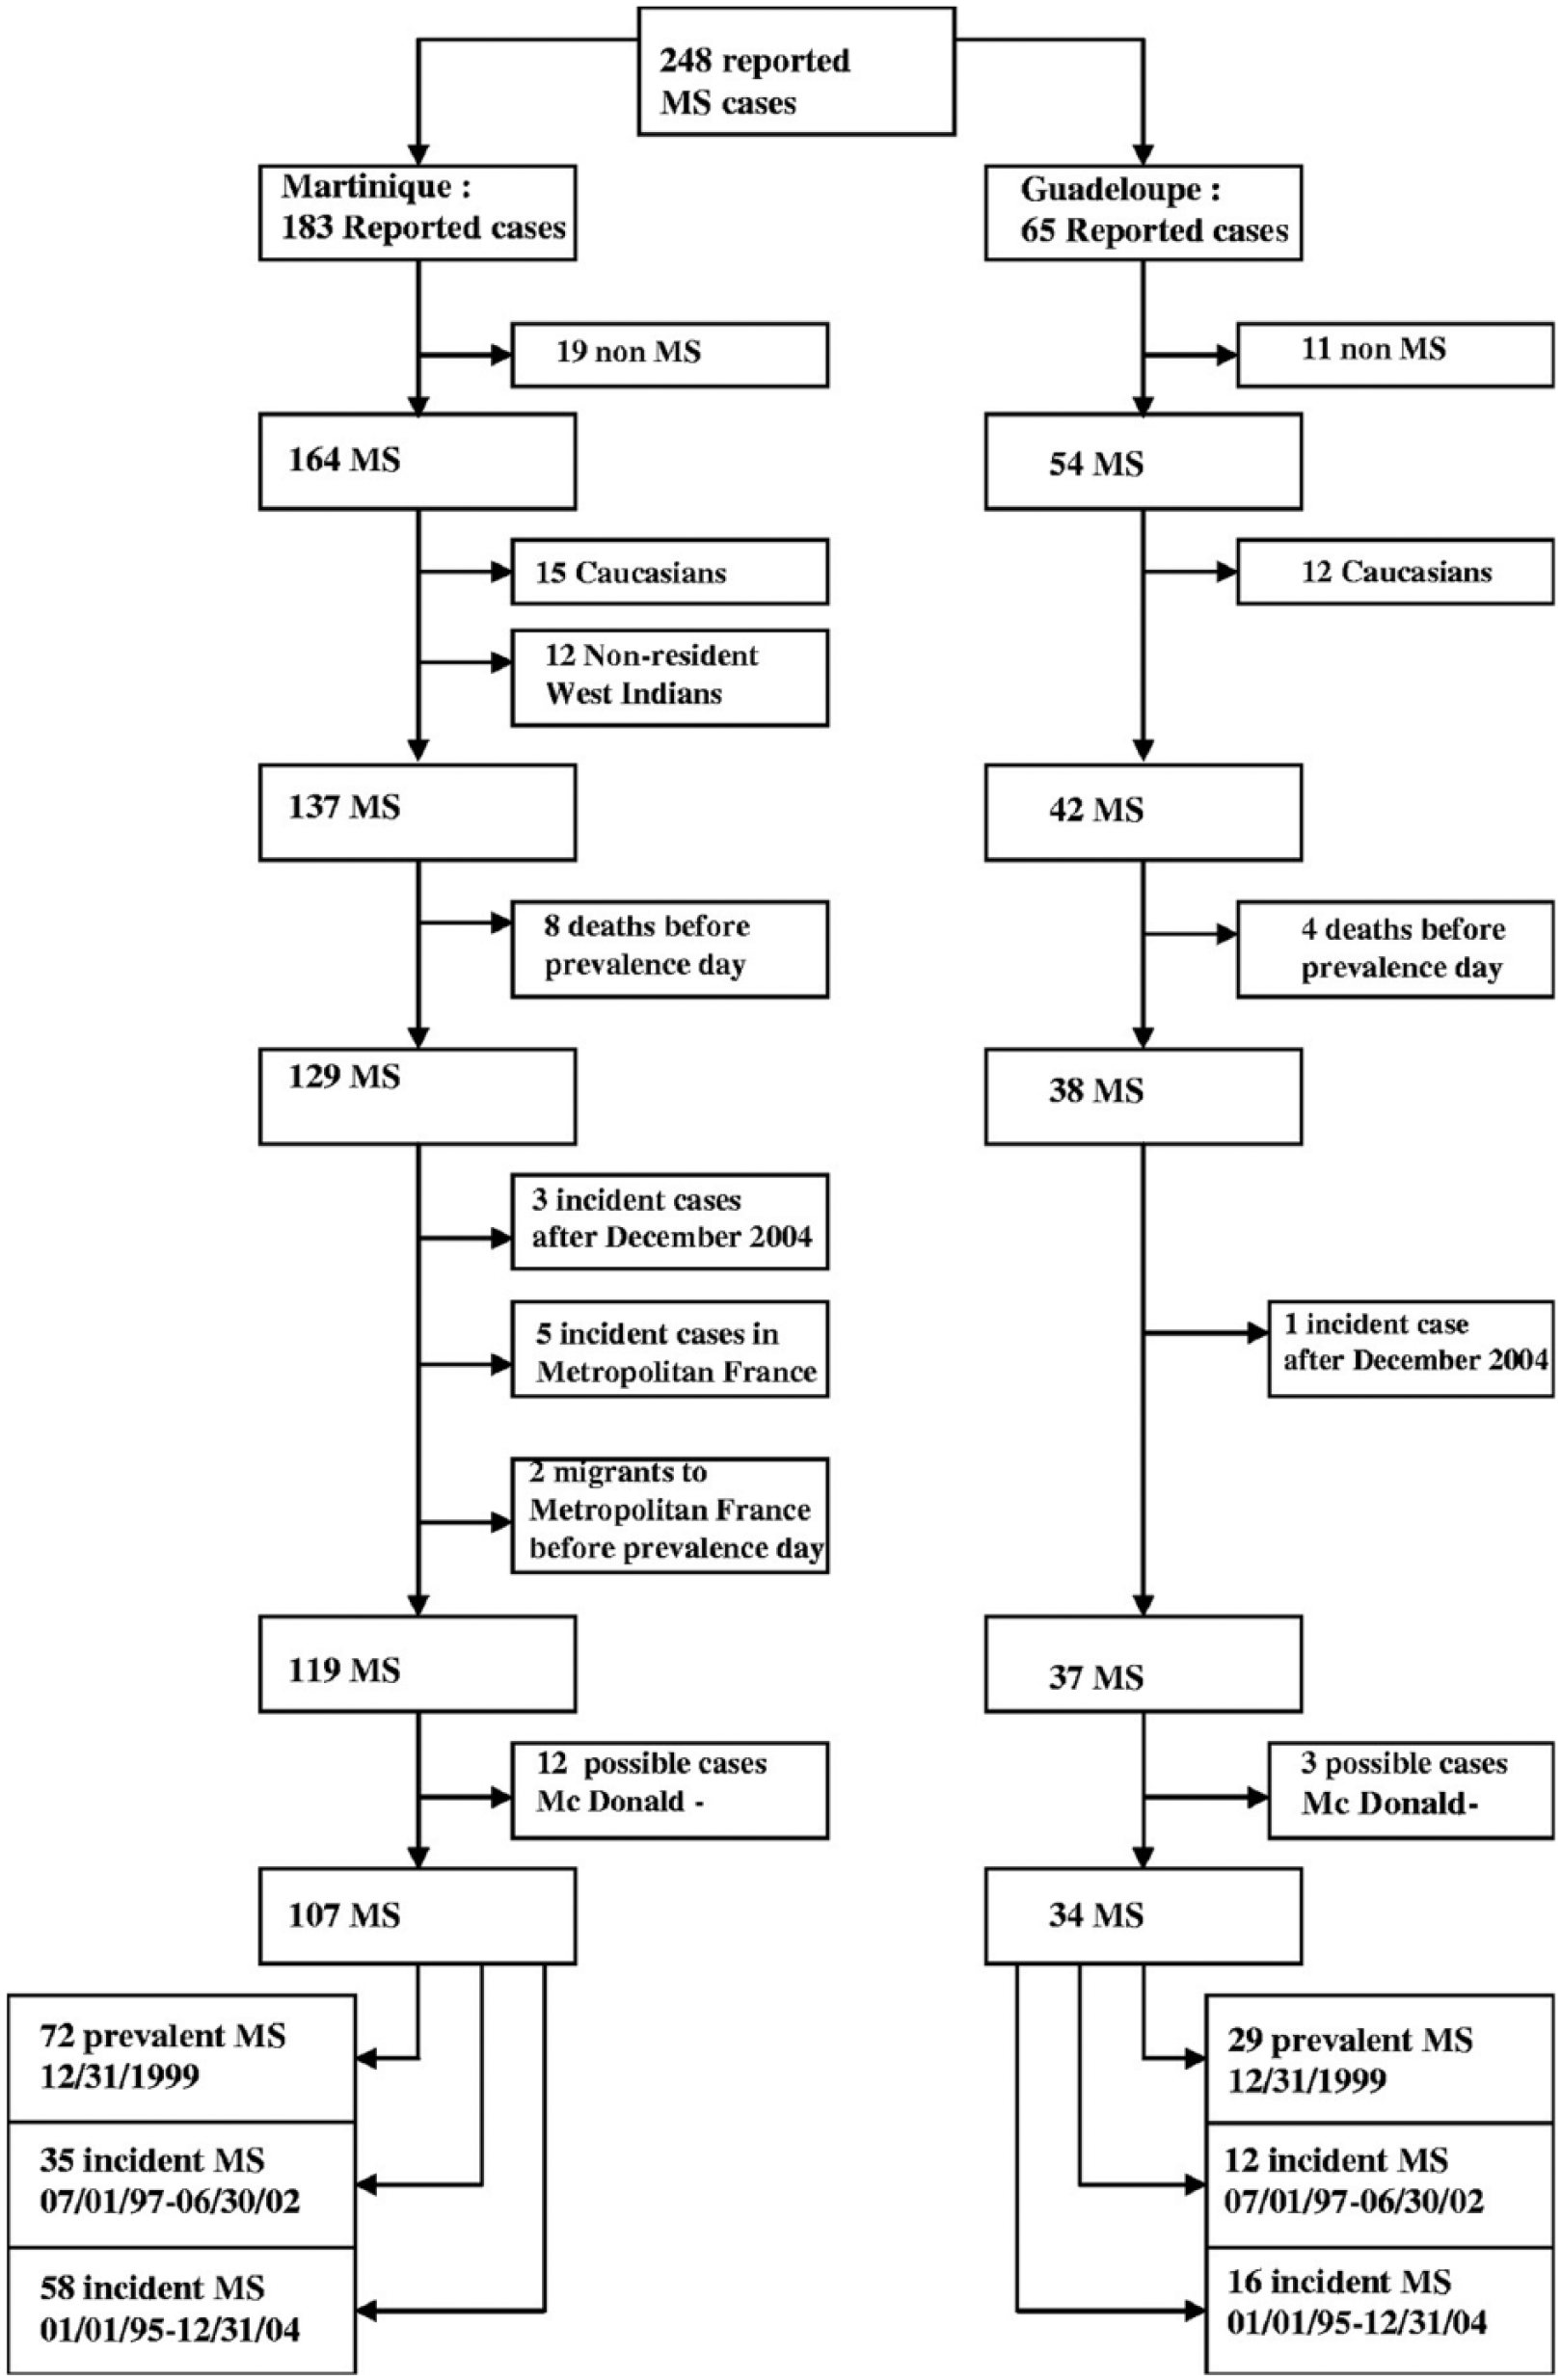
Prevalent and incident cases of MS in the French West Indies. 24
A flow diagram efficiently conveys information regarding the selection of study participants, allowing the reader to determine whether the study population represents the target population.
Give appropriate rates with their associated 95% confidence intervals
Example: The crude annual incidence for both sexes for the 5-year-period was 4.3 cases per 100,000 (95% CI = 2.91–7.18).
36
Confidence intervals provide information regarding the precision of the estimate. 53
Report results of any sensitivity analyses
Example: Table 1 also presents a set of estimates deriving from the modified scoring of the CIDI-SFMD. When fatigue and cognitive dysfunction were excluded from the scoring, the prevalence estimates were lower. However, the pattern of higher prevalence in MS was unchanged.
37
Authors should describe the impact of sensitivity analyses on the main findings.
Discussion
Summarize the key findings in relation to the study aims and objectives
Example: We demonstrated health administrative data to be a useful, valid information source for the surveillance of both the incidence and prevalence of MS. Using the best administrative case definition for MS, the crude prevalence was 266.9 (95% CI: 257.0-277.1) and average annual incidence was 9.77 per 100,000 population.
16
The discussion should summarize the primary findings as they relate to the study aims, to remind the reader and aid him in determining whether the authors’ interpretation of the findings is appropriate.
Discuss potential limitations of the study
Example: The primary limitation is the possibility for underascertainment of cases, through either population mobility or other reasons. In recent years, a number of individuals have left the Sugar Creek area after having their property purchased by the oil company during the 1999 to 2001 period. Sixty-six houses and nine lots with demolished houses have been purchased. It is not known if all the previous owners (n = 112) continue to reside within the study boundary area. Some of these families probably also had children. Thus, the total number of individuals involved in the buyouts is unknown. If these individuals left the Sugar Creek area and have MS, then this would have the effect of reducing the true prevalence in Sugar Creek …
38
The discussion should describe study limitations, including those related to study design and execution, selection of the study population, and other biases that may affect study findings.
Interpret the results in the context of the evidence from other studies with similar designs and objectives
Example: There are no previous estimates of MS incidence in BC with which to compare our observations. However, using the same validated administrative MS case definitions age standardized to the same population, a similar annual incidence rate was recently found in central Canada (11.4/100,000 in Manitoba using the more sensitive case definition). While a somewhat higher annual incidence was found in eastern Canada (9.8/100,000 in Nova Scotia using our primary case definition), the 95% confidence intervals overlapped with those in our study.
15
The purpose of the discussion is to interpret the study findings, by placing them in the context of prior related work and explaining similarities and differences.
Reliability of the estimates (i.e. based on the reporting of the statistical methodology, study design, and measurement of key information)
Example: The present prevalence rate of MS in Oslo of 120.4/105 is the highest so far reported in Norway … These prevalence rates in Oslo are significantly higher than the prevalence rates previously observed in Norway … Some differences exist in both the diagnostic and the inclusion criteria used between the cited studies. Only definite cases according to the Poser criteria were included in this study, whilst cases of probable MS were included in several of the other studies. This would underestimate rather than overestimate the prevalence rate compared with the other Scandinavian studies.
54
Consideration should be given to the magnitude and direction of potential biases resulting from selection, measurement, and confounding. Longitudinal studies should discuss issues related to loss to follow-up, and all studies should consider measurement bias and issues of unmeasured confounders.
Discuss the external validity of the study findings
Example: Secondly, it cannot be assumed that the immigrant Iranian population of BC is representative of the general population of Iran, both in terms of environmental exposures in their native Iran nor ethnic/genetic background.
41
Generalizability refers to the degree to which study findings are applicable to other settings and populations. 55
Are the results consistent with meta-analyses of descriptive epidemiological studies on the same topic that cover different settings?
Example: A recent meta-analysis with data from 13 countries from throughout the world found a modest increase in sex ratio from 2.35 to 2.73 over time among MS patients, particularly in females with the relapsing-remitting MS phenotype … However, we did not observe a significant change in sex ratio over time between the studies.
42
Consistency is one criterion used to judge causality in epidemiological studies. 56 Meta-analyses provide a quantification that may be more precise than individual studies and can detect previously underpowered associations. When study results are consistent with previous meta-analyses, it provides support for the validity of the findings.
Conclusion
The adoption of the STROND reporting guidelines may improve the quality of reporting of descriptive epidemiological studies in MS. Along with efforts to improve methodological aspects of epidemiological studies and harmonization of data collection efforts, improved reporting could contribute to furthering our understanding of the epidemiology of MS. Future studies should evaluate how well the STROND guidelines are applied by comparing pre- and post-STROND publications of descriptive MS studies.
Footnotes
Acknowledgements
The authors thank Suzanne Barker Collo for her helpful comments on earlier versions of this manuscript.
Conflict of interest
Kirsten Fiest reports no disclosures. Ruth Ann Marrie receives research funding from Canadian Institutes of Health Research (CIHR), Public Health Agency of Canada, Manitoba Health Research Council, Health Sciences Centre Foundation, Multiple Sclerosis Society of Canada, Multiple Sclerosis Scientific Foundation, and Rx & D Health Research Foundation and has conducted clinical trials funded by Sanofi-Aventis. Nathalie Jette is the holder of a Canada Research Chair Tier 2 in Neurological Health Services Research and receives research support from CIHR, Alberta Innovates—Health Solutions (AIHS), Hotchkiss Brain Institute, the University of Calgary, and Pfizer Canada. Derrick Bennett reports no disclosures.
Funding
This study was supported (in part) by a Manitoba Research Chair from Research Manitoba (to R.A.M.) and a Don Paty Career Development Award from the Multiple Sclerosis Society of Canada (to R.A.M.). N. Jette is the holder of a Canada Research Chair (Tier 2) in Neurological Health Services Research. The funding source(s) had no role in the study design, collection, analysis, or interpretation of the data, nor in the decision to submit the article for publication.