
Abstract
Background:
Body fluid and structural imaging biomarkers give information on neurodegeneration. The relationship over time is not known in multiple sclerosis.
Objective:
To investigate the temporal relationship of elevated cerebrospinal fluid (CSF) neurofilament (Nf) protein levels, a biomarker for axonal loss, with magnetic resonance imaging (MRI) atrophy measures.
Methods:
In patients with multiple sclerosis, CSF Nf heavy chain (NfH) phosphoform levels were quantified at baseline and dichotomised into ‘normal’ and ‘high’. Atrophy was assessed by MRI at baseline and 15-year follow-up using SIENAX and FreeSurfer software.
Results:
High baseline CSF NfH SMI35 levels predicted pronounced atrophy at 15-year follow-up (odds ratio (OR): 36, p < 0.01), in the absence of baseline brain atrophy (OR: 28, p < 0.05), for the averaged MRI normalised brain volume (1.44 L vs 1.33 L, p < 0.05), normalised grey matter volume (0.77 L vs 0.69 L, p < 0.01) and putamen (12.7 mL vs 10.7 mL, p < 0.05). Region-specific calculations including the spinal cord showed that a power of >80% is reached with 14–50 patients.
Conclusion:
These data suggest that high CSF NfH levels are an early predictor of later brain and spinal cord atrophy using structural imaging biomarkers and can be investigated in reasonably sized patient cohorts.
Introduction
The assessment of clinical function in patients suffering from multiple sclerosis (MS) relies on validated clinical scales. 1 The major pathological process driving irreversible loss of function is progression of neurodegeneration. 2 The in vivo quantification of mechanisms of neurodegeneration relies on indirect data from biomarkers. 3 A strong study design in demyelination combines the well-timed use of body fluid biomarkers and structural imaging biomarkers. 4 Neurofilament (Nf) proteins have been validated as a body fluid biomarker for neurodegeneration in MS.3,5 Disintegration of neurons and axons causes proteolysis and release of Nf proteins into the adjacent body fluid compartment. 6 In the acute phase, inflammation-related oedema and glial activation can mask imaging biomarker quantification of atrophy. 7 With time and resolution of inflammation, atrophy becomes more visible and quantification more reliable.8–10 Therefore, a logical sequence of events is that neurodegeneration in MS causes a rise of Nf and irreversible disability, which is followed over time by central nervous system (CNS) atrophy. 4
Consistent with this line of argumentation, cross-sectional data from patients with MS did show elevated Nf levels. 11 The baseline data did, however, fail to show a relationship between cerebrospinal fluid (CSF) NfH protein concentration and brain atrophy. Subsequent 3-year follow-up data demonstrated that elevated CSF Nf heavy chain (NfH) protein concentrations were significantly related to irreversible disease progression. 12 This relationship between CSF NfH and disability has since been confirmed by other groups.3,5 Long-term clinical data of our original cohort confirmed the prognostic value of CSF NfH levels. 13 Importantly, the 15-year follow-up data revealed that the strongest relationship of phosphorylated CSF NfH levels was with the visual, pyramidal, cerebellar and sensory systems. 13 It was discussed that degeneration of the very long axons of the posterior columns and spinothalamic tracts may be a relevant source for CSF NfH.
The pathological process responsible for brain atrophy following axonotmesis is bi-directional trans-synaptic axonal degeneration. 14 Therefore, extending on our 3-year follow-up data, the aim of this study was to test whether high CSF NfH levels at baseline would predict more severe CNS atrophy after 15 years.
Materials and methods
This study was approved by the Institutional Review Board and written informed consent was obtained from all patients.
Patients
Fifteen patients from a previously reported cohort 13 with clinically definite MS 15 agreed to participate in brain and spinal cord magnetic resonance imaging (MRI). All patients have been started with disease-modifying treatment (interferon beta). The Expanded Disability Status Scale (EDSS) 16 score was assessed at baseline and follow-up. The disease course was classified as relapsing remitting (RR), primary progressive or secondary progressive (PP/SP). 15
MRI
At baseline, a 1.5-T system (Siemens AG, Erlangen, Germany) consisted of an axial T1- and T2-weighted spin echo MRI with 3-mm slice thickness and 1 × 1 mm in-plane resolution. Brain atrophy and lesion load measurements were analysed as described. 11 More severe atrophy was indicated by a smaller brain parenchymal fraction (BPF)
At 15-year follow-up, MRI was performed on a 3-T whole body system (GE Signa HDxt, Milwaukee, WI, USA). The detailed acquisition parameters have been described previously. 17 Lesion volumes were automatically quantified using ‘k nearest neighbour classification with tissue type priors’ (kNN-TTP). 18 Normalised brain volumes (NBVs), normalised grey matter volumes (NGMVs) and normalised white matter volumes (NWMVs) were determined with SIENAX (part of FSL 5.04, fsl.fmrib.ox.ac.uk) after lesion filling. 19 We did use FIRST to determine the normalised deep grey matter volumes (NDGMVs). In addition, the mean upper cervical cord area (MUCCA) was measured as a measure of spinal cord atrophy.20,21
CSF
Samples of CSF were obtained by routine lumbar puncture. Aliquots of CSF were stored at −80°C until assayed. The levels of NfH phosphoforms were quantified by enzyme-linked immunosorbent assay (ELISA). 22 NfH phosphoforms were indicated with the capturing antibody in the superscript, with SMI34 for hyperphosphorylated NfH (NfH SMI34 ) and SMI35 for phosphorylated NfH (NfH SMI35 ) adhering to a published nomenclature. 22 Consensus guidelines were followed for analysis and classification of CSF oligoclonal bands (OCBs). 23 General CSF findings were summarised as recommended. 24
Data analysis
SAS software (v9.4) was used for statistical analyses and preparation of figures. Non-Gaussian data were reported as median and 25%–75% interquartile range (IQR), and normally distributed data as mean ± standard deviation (SD). Two-tailed tests were used and a p < 0.05 is accepted as statistically significant.
Our previously published hypothesis on the prognostic value of CSF NfH levels was tested. Consistent with our previous publications, high CSF NfH SMI35 levels were defined as ⩾20 pg/mL and high CSF NfH SMI34 levels as ⩾11 pg/mL.12,13 Group comparisons were made according to distribution using either the exact non-parametric Wilcoxon two-sample test or the t-test. In addition, general linear models (GLMs) were applied to the segmented FreeSurfer data to detect possible localised atrophy. Power calculations were performed using proc power in SAS with alpha set to 0.05 to calculate the total sample size required to reach a power of 80%.
Results
The baseline characteristics of the entire patient cohort are summarised in Table 1. Patients were dichotomised at baseline according to pre-defined CSF NfH cut-off values.12,13 Patient characteristics for this biomarker-driven dichotomisation are presented for baseline and 15-year follow-up.
Characteristics of the patients with MS.
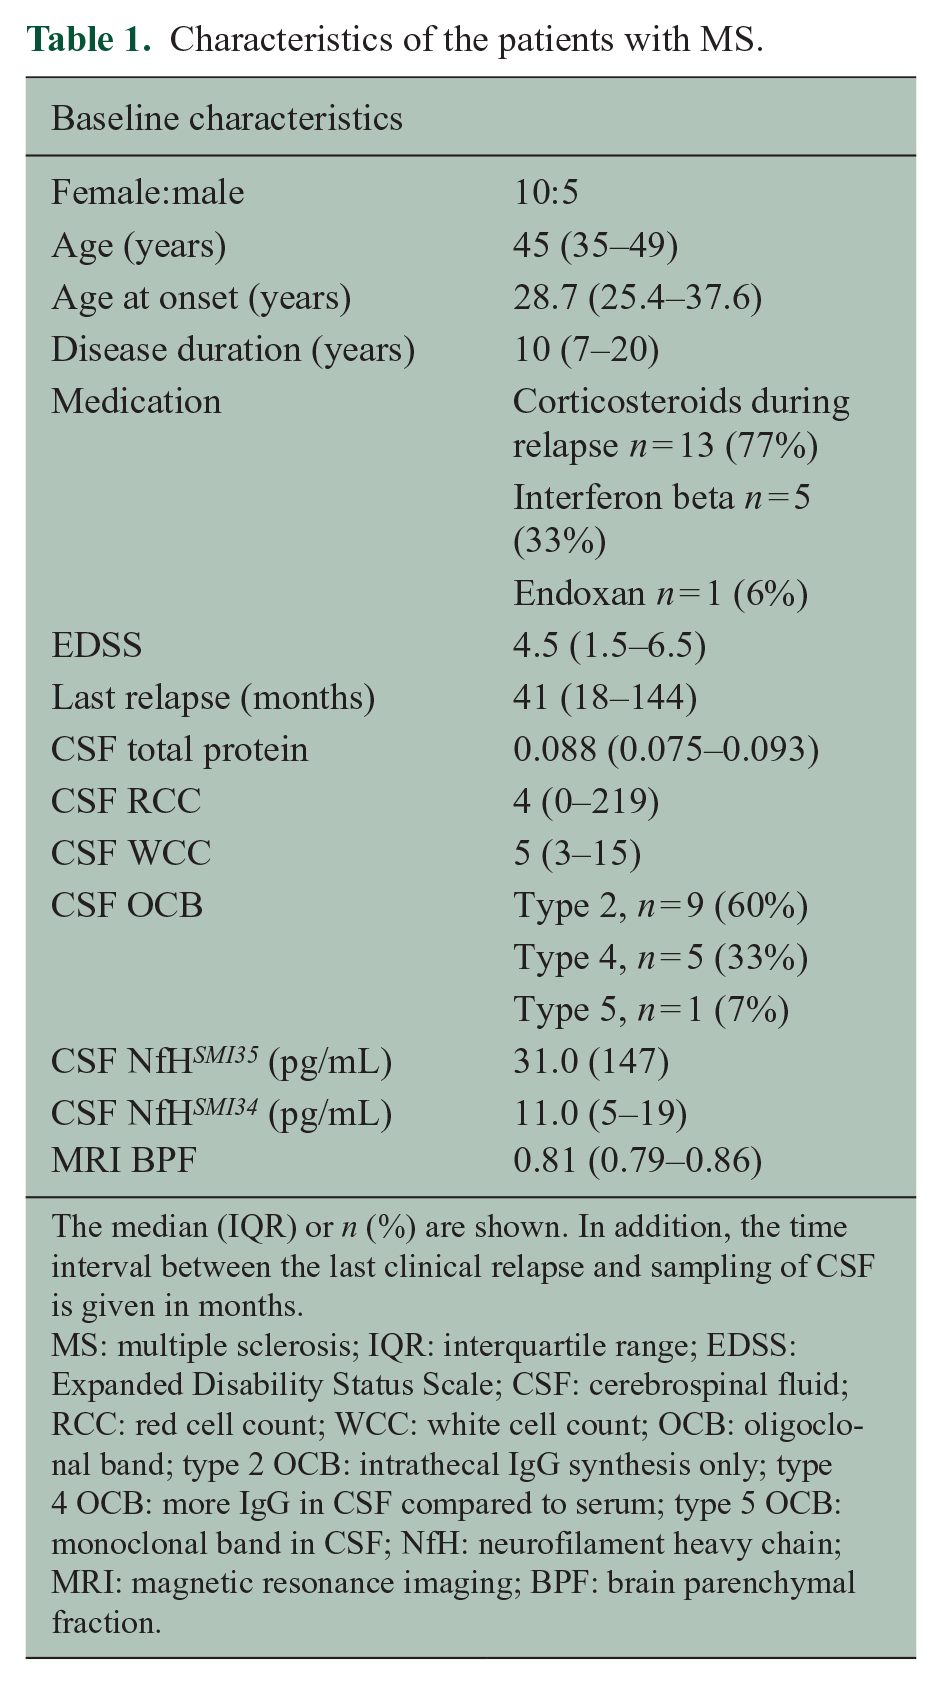
The median (IQR) or n (%) are shown. In addition, the time interval between the last clinical relapse and sampling of CSF is given in months.
MS: multiple sclerosis; IQR: interquartile range; EDSS: Expanded Disability Status Scale; CSF: cerebrospinal fluid; RCC: red cell count; WCC: white cell count; OCB: oligoclonal band; type 2 OCB: intrathecal IgG synthesis only; type 4 OCB: more IgG in CSF compared to serum; type 5 OCB: monoclonal band in CSF; NfH: neurofilament heavy chain; MRI: magnetic resonance imaging; BPF: brain parenchymal fraction.
Patient characteristics at baseline
Five patients had normal and 10 had elevated CSF NfH SMI35 levels at baseline. For CSF NfH SMI34 , elevated levels were present in eight and normal in seven patients (Table 2). The disease course was RR in seven, SP in six and PP in two of the patients. The time delay from the last relapse to CSF sampling was long (median 18 months) and not related to CSF NfH SMI35 or CSF NfH SMI34 levels. Age did not differ significantly between the CSF Nf subgroups (p = 0.84). Patients with high CSF NfH SMI35 levels had a smaller BPF (more atrophy) compared to those with normal CSF NfH SMI35 levels, but this narrowly failed to reach statistical significance (p = 0.052, Table 2).
High baseline CSF NfH SMI35 levels are related to clinical but not MRI parameters.
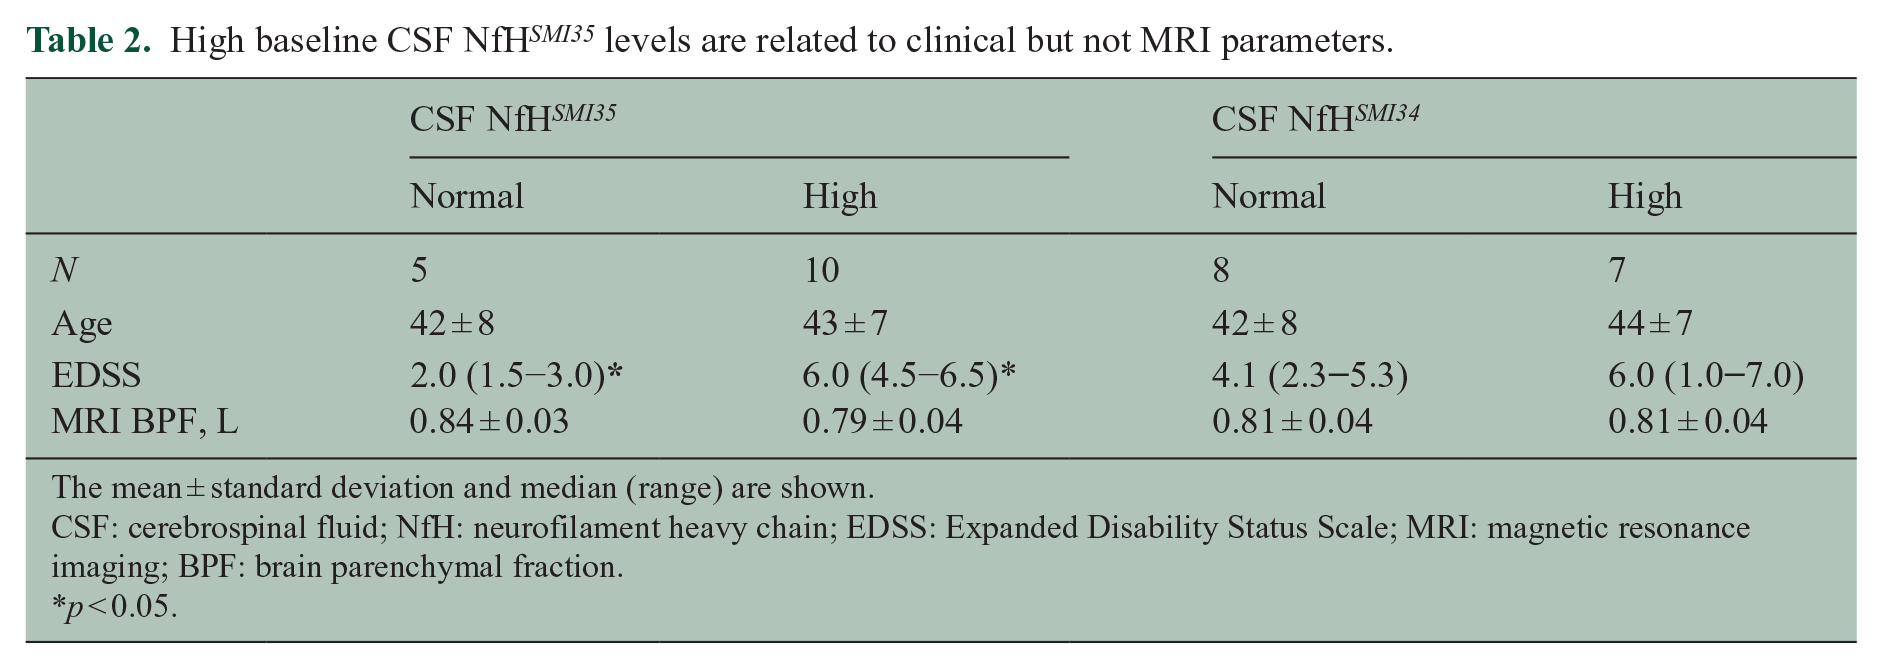
The mean ± standard deviation and median (range) are shown.
CSF: cerebrospinal fluid; NfH: neurofilament heavy chain; EDSS: Expanded Disability Status Scale; MRI: magnetic resonance imaging; BPF: brain parenchymal fraction.
p < 0.05.
Patients with high CSF NfH SMI35 levels had a worse EDSS compared to those with normal CSF NfH SMI135 levels (p = 0.043).
There was no correlation between age and the CSF concentration of either NfH SMI35 (R = 0.17, p = 0.55) or NfH SMI34 (R = 0.09, p = 0.74). There was no correlation of the baseline CSF NfH SMI35 or CSF NfH SMI34 levels with either the EDSS or the BPF.
Patient characteristics at 15-year follow-up
Patients with high CSF NfH SMI35 levels at baseline were significantly more disabled at 15-year follow-up compared to those with normal CSF NfH SMI35 levels (p = 0.01, Table 3). Progression on the EDSS was, however, minimal and changes did not reach statistical significance (Table 3). The disease course changed from RR to SP in two of the patients. One patient thought to have a PP disease course at baseline developed clinical and MRI documented relapses and was reclassified as having an SP disease course. This patient was also treated with corticosteroids during relapses.
High baseline CSF NfH SMI35 levels predict accelerated CNS atrophy at 15-year follow-up.
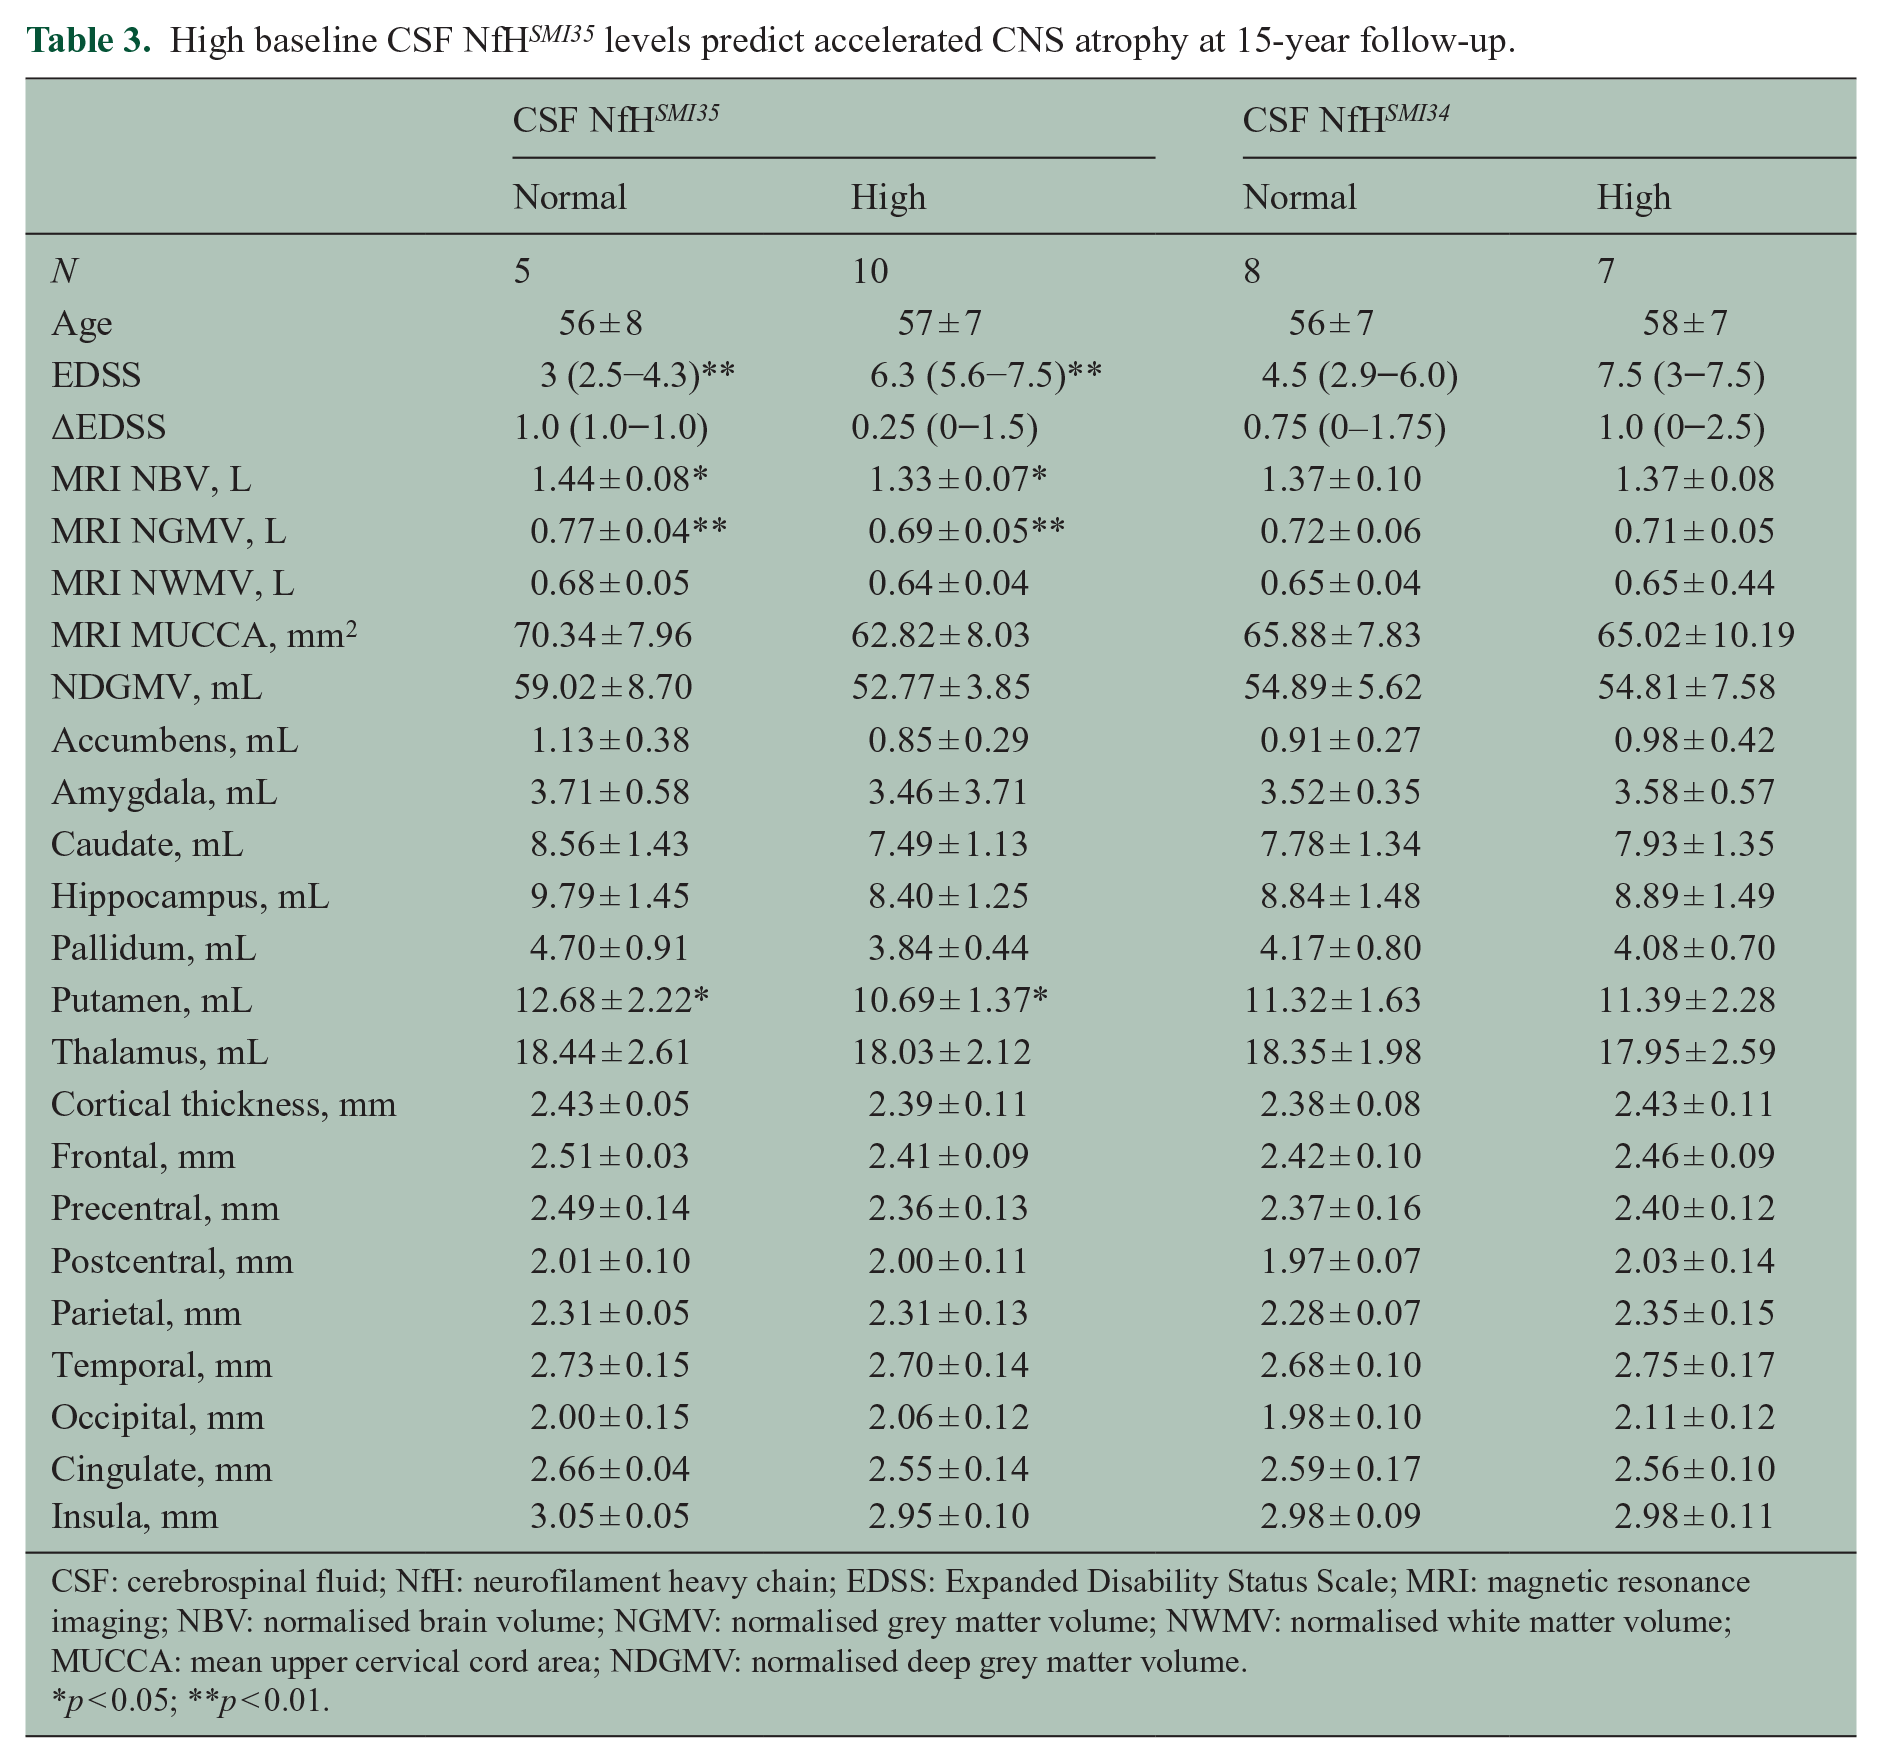
CSF: cerebrospinal fluid; NfH: neurofilament heavy chain; EDSS: Expanded Disability Status Scale; MRI: magnetic resonance imaging; NBV: normalised brain volume; NGMV: normalised grey matter volume; NWMV: normalised white matter volume; MUCCA: mean upper cervical cord area; NDGMV: normalised deep grey matter volume.
p < 0.05; **p < 0.01.
Brain atrophy was significantly more pronounced in the patients with high CSF NfH SMI35 levels compared to those with normal CSF NfH SMI35 levels for the NGMV (p = 0.007) and the NBV (p = 0.014). Significance was not reached when comparing the NWMV (p = 0.11) and MUCCA (p = 0.12) between patients with high or normal CSF NfH SMI35 levels.
No statistical significant relationships were found for any of the demographic, clinical or MRI parameter for the comparison of patients with high or normal CSF NfH SMI34 levels (Table 3). Likewise, a subgroup analysis considering the clinical disease course did not reveal any differences, but statistical power was poor for this subgroup analysis (RR, n = 5; SP, n = 9). A subgroup analysis was not possible for PP (n = 1).
There was an inverse correlation of the absolute concentration of baseline CSF NfH SMI35 levels with the follow-up NGMV (Figure 1, Spearman’s R = −0.62, p = 0.014). No significant correlation was found for absolute concentration of CSF NfH SMI34 . There were no significant correlations of either Nf phosphoform with age or EDSS at follow-up.
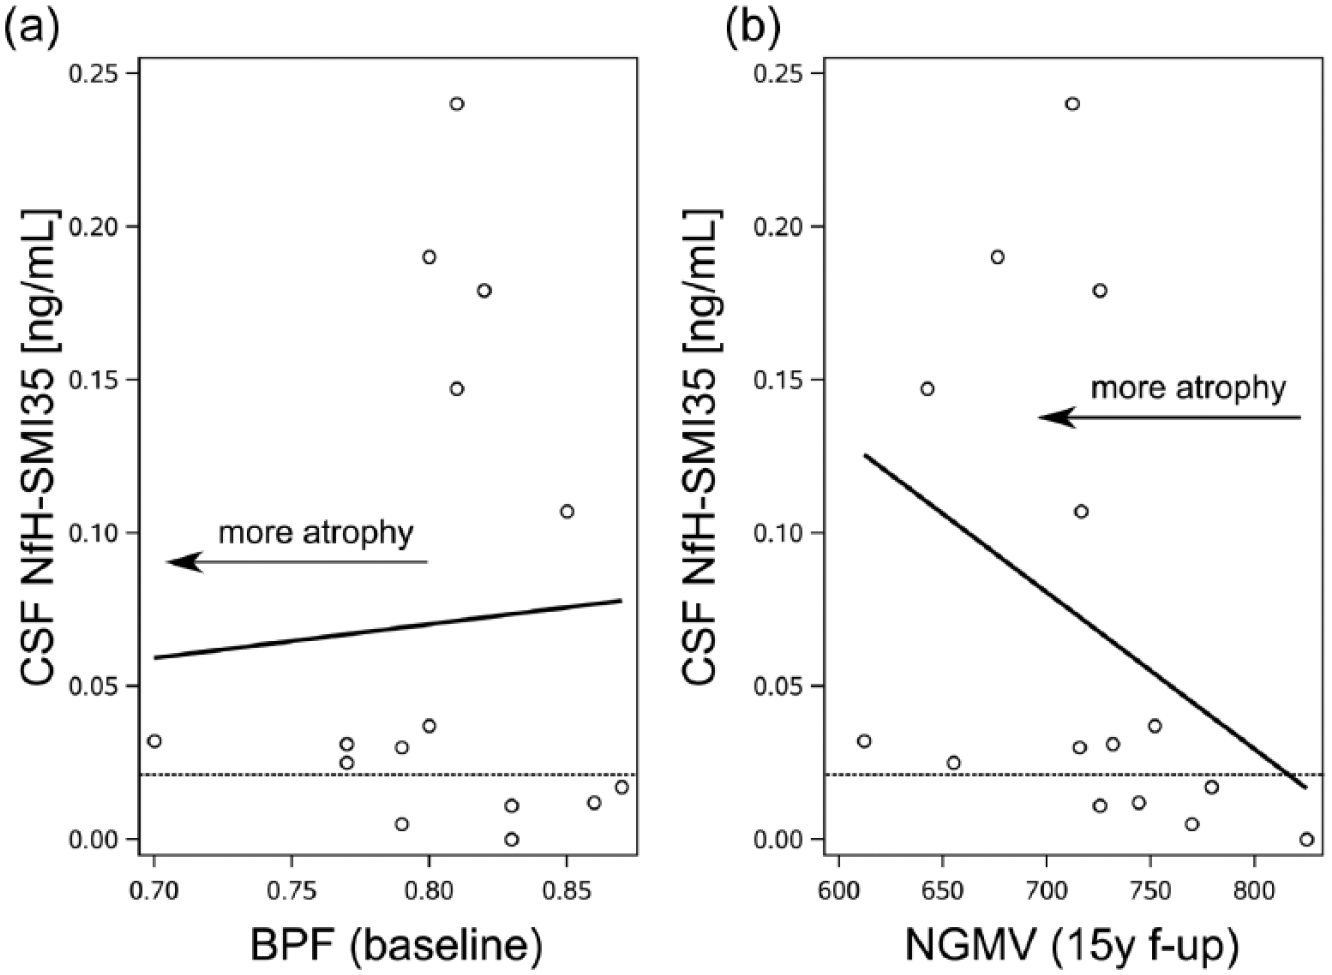
Brain atrophy and CSF NfH SMI35 levels. (a) Higher CSF NfH SMI35 levels were seen in those patients with a higher BPF indicating absence of significant brain atrophy at baseline (Table 2). (b) After 15 years, those patients with high CSF NfH SMI35 levels developed more pronounced atrophy of the NGMV (p < 0.01, Table 3) which also correlated inversely with the absolute CSF NfH SMI35 levels (R = −0.62, p = 0.014). The dashed horizontal reference line indicates the pre-defined CSF NfH SMI35 cut-off value of 20 pg/mL. 12
The relationship between dichotomised CSF NfH SMI35 levels and progression of brain atrophy on MRI is summarised in Figure 2. At baseline, 12/15 (80%) of MS patients had a normal BPF. There were signs of atrophy only in 3/15 (20%), all of whom had high CSF NfH SMI35 levels (Figure 2, red dots in yellow shaded area). At 15-year follow-up, six patients with high CSF NfH SMI135 levels developed more pronounced atrophy of the NGMV (Figure 2, red dots in blue shaded area). Four patients with normal CSF NfH SMI35 levels remained within the normal range for age (Figure 2, green triangles in white area). Taken together, high baseline CSF NfH SMI35 levels have an odds ratio of 36 (95% confidence interval (CI): 1.8–731.6, p = 0.0067) for more pronounced NGMV atrophy after 15 years. If the three cases with manifest brain atrophy at baseline are excluded, the odds ratio is 28 (95% CI: 1.4–580.6, p = 0.0149).
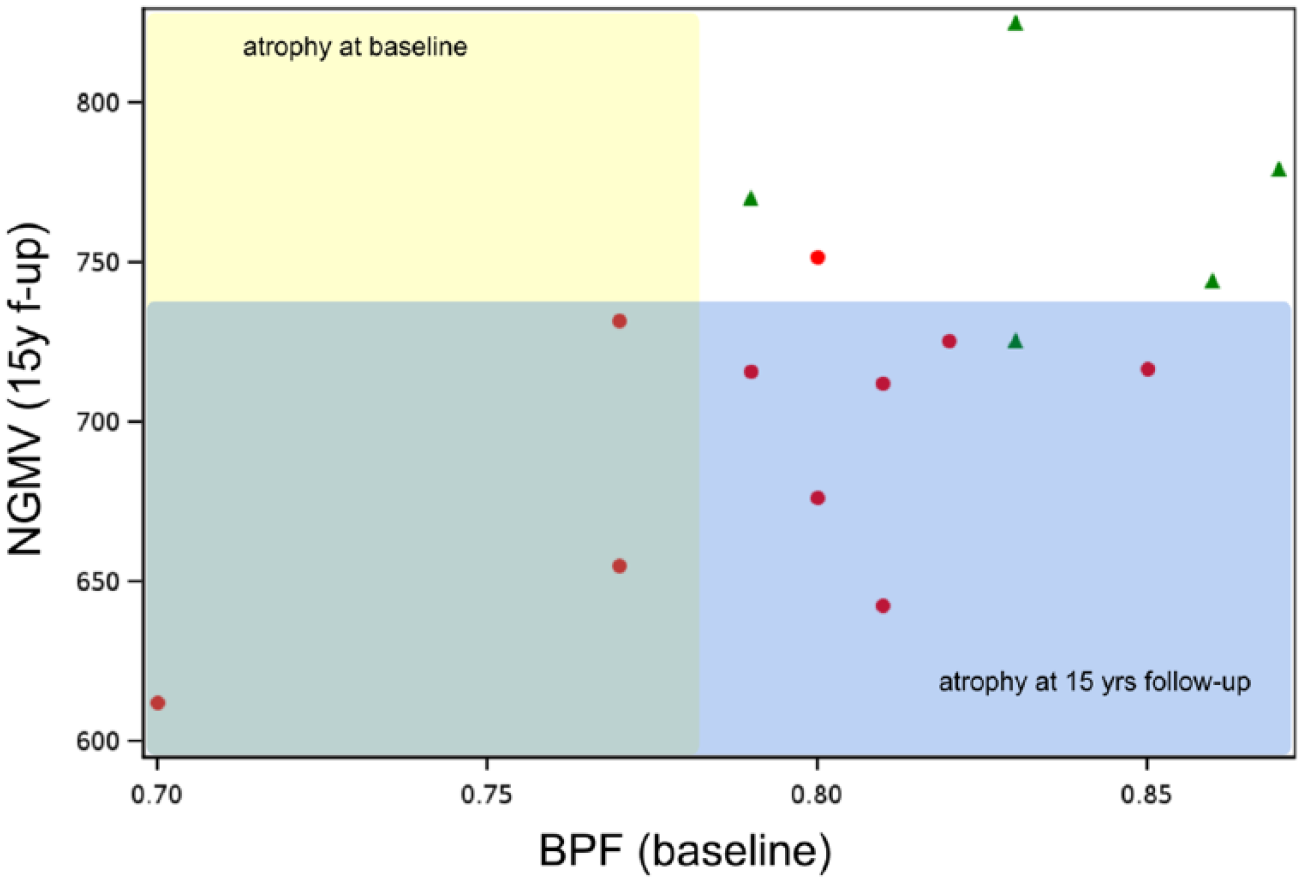
Progression of atrophy between baseline (yellow shaded area) and 15-year follow-up (blue shaded area) in relation to dichotomised CSF NfH SMI35 levels (high = red dots, normal = green triangles).
There was significant more atrophy of the putamen in patients with high baseline CSF NfH SMI35 levels compared to those with normal CSF NfH SMI35 levels (p < 0.05, Supplementary Table 1). For all other regions of interest, statistical significance was not reached probably due to small group size. Consistently, however, smaller average thickness data, suggestive of localised atrophy, were observed in patients with high CSF NfH SMI35 levels for the accumbens, amygdala, caudate, hippocampus, pallidum and thalamus (Supplementary Table 1). Likewise, the absolute cortical thickness values were smaller, suggesting localised atrophy, in patients with high CSF NfH SMI35 levels for the frontal, precentral, postcentral, temporal areas, the cingulate and insula.
Power calculations for detecting localised atrophy
Power calculations were performed to estimate how many patients were needed to test whether or not there is a statistical relationship between dichotomised baseline CSF NfH levels and localised atrophy on MRI. Table 4 summarises the actual power of this study and numbers needed to reach a desired power of 80%.
Sample sizes required to test the predictive value on dichotomised CSF NfH SMI35 levels on subsequent localised CNS atrophy.
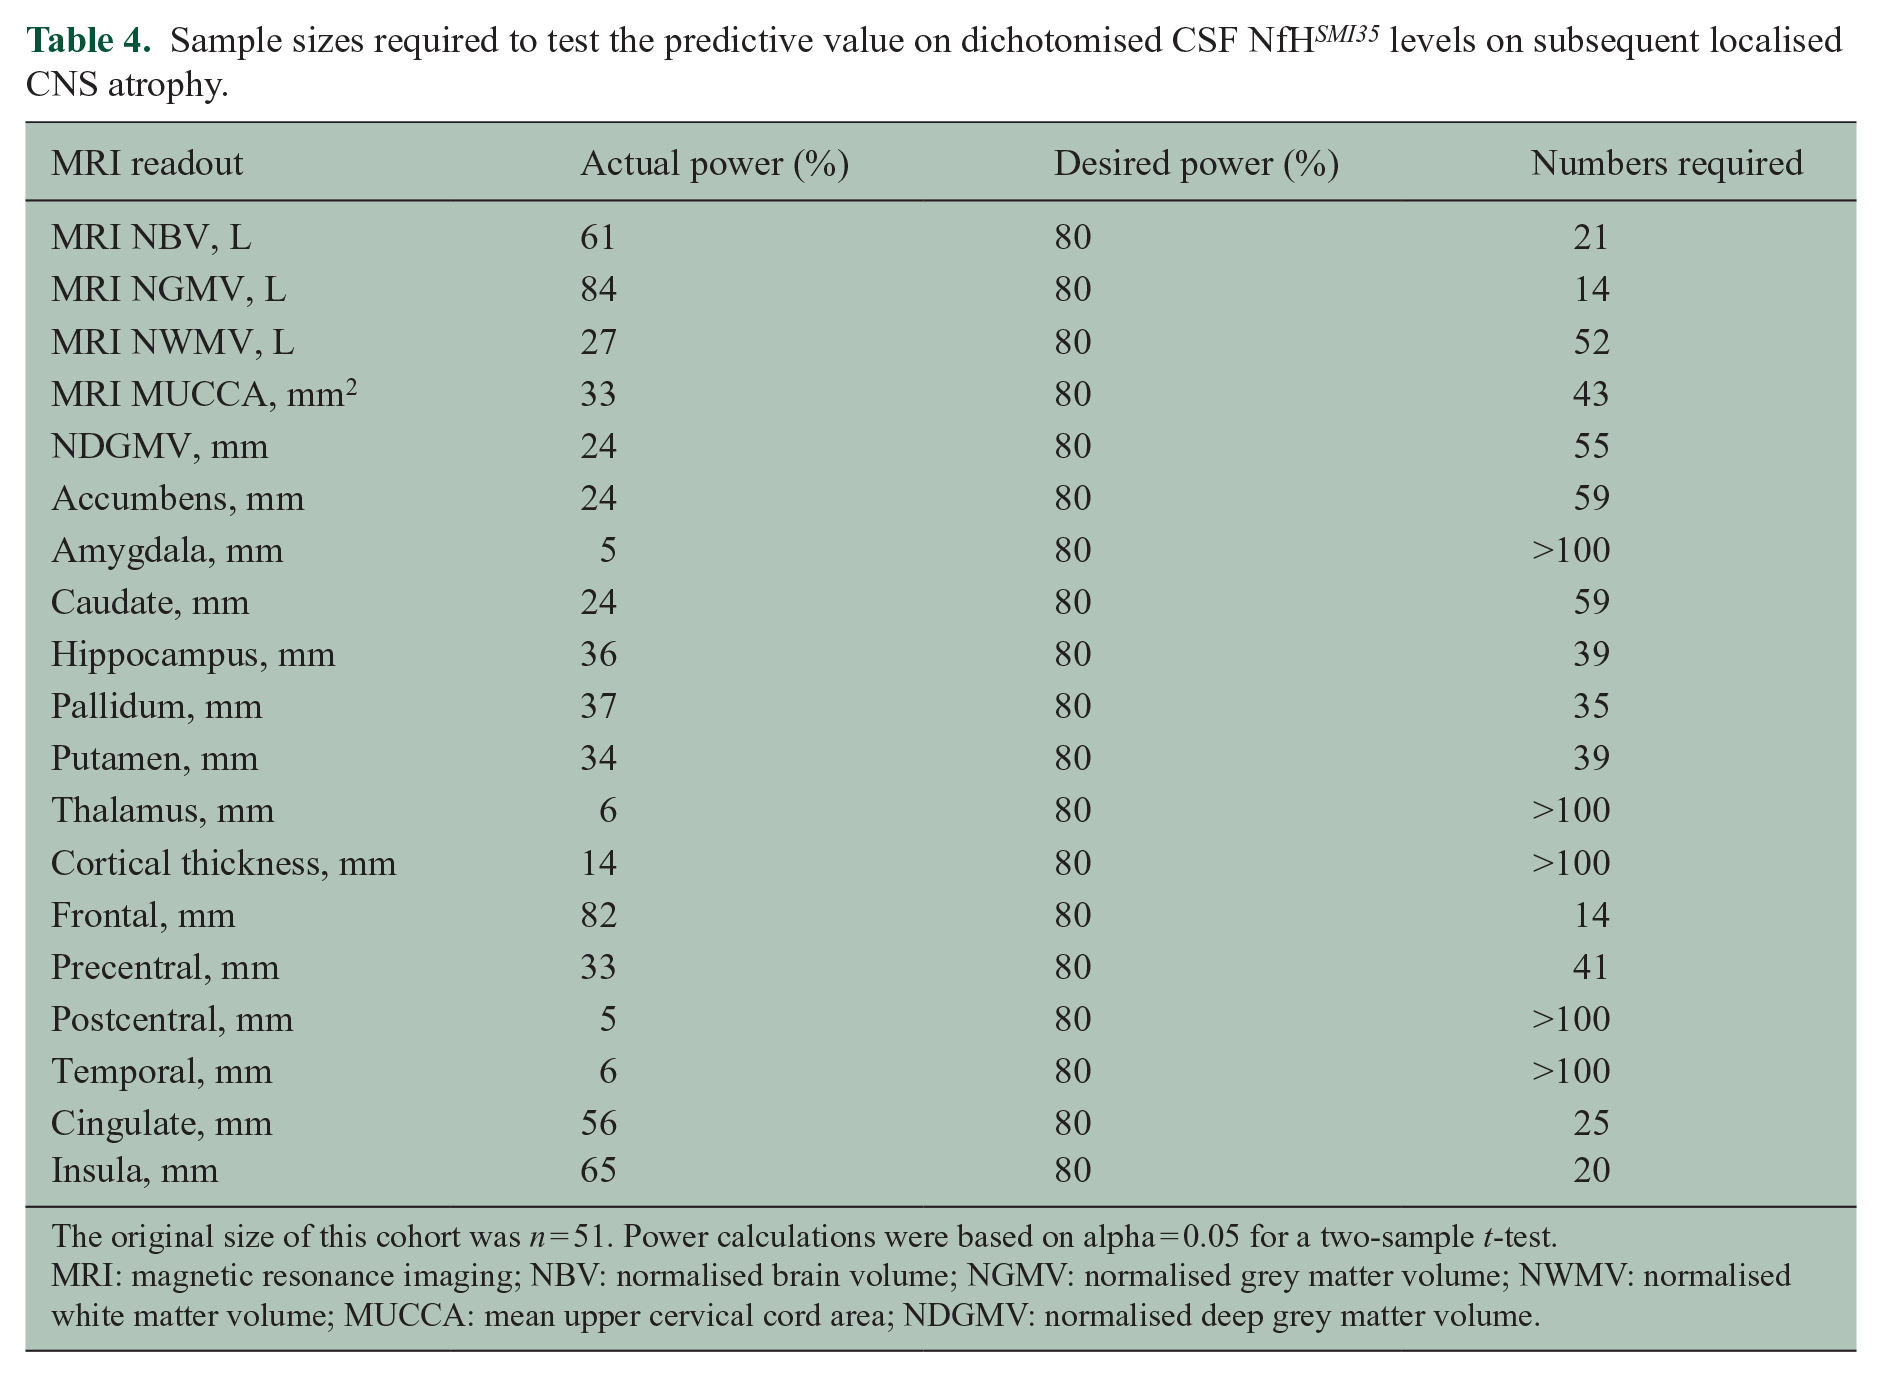
The original size of this cohort was n = 51. Power calculations were based on alpha = 0.05 for a two-sample t-test.
MRI: magnetic resonance imaging; NBV: normalised brain volume; NGMV: normalised grey matter volume; NWMV: normalised white matter volume; MUCCA: mean upper cervical cord area; NDGMV: normalised deep grey matter volume.
The power calculations show for which areas testing the longitudinal relationship will be possible given the original cohort size of n = 51.
A sample size of n < 51 is sufficient to test the predictive value of dichotomised baseline CSF NfH SMI135 levels for atrophy of the MRI NBV, NGMV, MUCCA, hippocampus, pallidum, putamen, frontal lobe, precentral cortical thickness, cingulate and insula.
Discussion
The long-term follow-up data of this cohort are unique because they provide evidence that development of brain atrophy is preceded by rise of a clinically relevant biomarker for axonal damage. To better develop the argument, one has to recall the principal hypothesis underlying this research. An increase in CSF Nf levels was thought to reflect on axonal disintegration.3,5,25 Logically, therefore one would expect that those patients who suffer axonal degeneration at baseline also suffer from disability as axonal loss is held responsible. 26 The inflammatory plaques found in MS can, however, not only cause axonal degeneration but also demyelination and conduction block from which patients may recover. To be attributable to axonal degeneration, disability will have to be sustained, which it was in this study. To close the argument, one needs to demonstrate that elevated CSF Nf levels also relate over time to development of more severe brain and or spinal cord atrophy. We were unable to demonstrate this relationship at baseline and 3-year follow-up.11,12 Only 15 years later, the association between rise of CSF Nf levels and subsequent brain atrophy emerged.
There is a debate on the time course of axonal degeneration in the CNS. The relative timing of these cellular events differs considerably between the CNS and peripheral nervous system.27,28 In general terms, the CNS response is much slower.29–31 In MS, there is emerging evidence that this is related to the presence of trans-synaptic axonal degeneration.14,32 The association of development of disability related to long tract spinal cord axons 13 suggests that the dominant source of CSF NfH SMI35 levels at baseline is likely to be of spinal cord origin. Therefore, axonal damage far remote from the brain grey matter would be a convenient explanation for high CSF NfH SMI35 levels at baseline, association with functional system disability on the EDSS and a long time lag through trans-synaptic axonal degeneration until brain grey matter atrophy becomes manifest on MRI.
Conceptually comparable, on a much shorter time scale, this association was already shown for the visual system in MS. An elevation of plasma NfH SMI35 levels had been associated with poor visual acuity following optic neuritis and preceded optic disc pallor on funduscopy. 33 This clinical observation has since been confirmed quantitatively using optical coherence tomography. 34 But then the distance from the optic nerve to the brain is much closer compared to the distal spinal cord, substantially shortening time requirements for trans-synaptic axonal degeneration.
Importantly, the power calculations preformed suggest that it will be possible to test the hypothesis that dichotomised baseline CSF NfH SMI35 levels may be predictive of more localised CNS atrophy (Table 4). The association with the putamen, where motor fibres interconnect, has been shown in this study. Extending on the present finding, it would be particularly interesting testing a likely association of high baseline CSF NfH SMI35 levels with atrophy of the precentral gyrus (Brodman area 4) as the pathway of trans-synaptic axonal degeneration would predict. Another interesting new finding was the unexpected strong association of CSF NfH SMI35 levels with frontal lobe atrophy. This has not previously been reported in MS, but was earlier brought out by a systematic review on the CSF Nf data in dementia. 35 Impairment of frontal lobe function and cognition is also an important feature of MS pathology.
This study did not find CSF Nf levels to be influenced by factors previously reported in the literature, such as time from last relapse or disease course. This former was most likely due to the long delay between relapse on CSF sampling, far exceeding the reported crucial 3 months. The latter might be a negative finding due to the low statistical power for subgroup analyses of clinical groups. Of note, those patients with high CSF NfH SMI35 levels had a non-significant, lower MRI BPF at baseline compared to those with normal CSF NfH SMI35 levels. Also, significance was missed in this study, and this is likely related to power.
In this study, findings were only significant for CSF NfH SMI35 but not for CSF NfH SMI34 . The argument might be valid that this could only be a statistical phenomenon. A known autoimmune phenomenon might also be considered. 25 The presence of auto-antibodies against NfH can cover epitopes relevant to detection by immunological techniques. Because hyperphosphorylation of tissue NfH has been related to pathology in many neurodegenerative diseases (reviewed in Petzold 25 ), further research in this field is warranted.
There are, however, important limitations to this study. First, there might be a potential bias towards more severely disabled patients. At both time points, those patients with high CSF NfH SMI35 levels also were those who had a poorer EDSS. From a biomarker point of view, this bias might be expected because of the association between high CSF Nf levels and disability.3,5,25 From a clinical point of view, one would like to see these results confirmed in a cohort of less severe disabled patients and also more rapidly progressing patients prior to extrapolating from the present data to patients with MS in general. Likewise, the development of MRI techniques from 1.5 to 3 T in this study did not permit to calculate progression on the same variable. This will remain a problem as the average life time of a magnet is about 10 years and therefore short of the long-term clinical follow-up time. Another potential bias is the dropout of patients from the original cohort. This dropout was at least in part related to the request for a second lumbar puncture at 3-year follow-up. 12 This bias might also be related to the trend of the current diagnostic criteria relying on non-invasive examinations, with MRI representing the current consensus cornerstone of MS diagnostics. We would be hesitant to draw any conclusion from potential effect of treatment on brain atrophy from this small cohort with heterogeneous treatments stretched over a long time. The dropout also reduced the power of the study such that our attempts to investigate for more localised atrophy, for example, in the primary motor cortex failed to reach statistical significance. This important limitation is further highlighted by the power calculations. The larger SD for the MUCCA already exemplifies to what extend the accuracy of a method impacts on the required sample size. Compared to the tighter, smaller SD data for brain volumes requiring only about 21 patients, 43 are needed to be in a powerful enough situation to test for the hypothesised association between high baseline CSF NfH SMI35 levels and subsequent spinal cord atrophy. These limitations discussed, this study was sufficiently powered (power 84%, alpha 0.05) to test for a relationship between dichotomised baseline CSF NfH SMI35 levels and NGMV atrophy.
Taken together, the 15-year follow-up data strengthen the argument that elevation of CSF Nf protein levels in patients with MS is related to axonal loss responsible for sustained disability and precedes CNS atrophy by about 3–15 years (Figure 3).
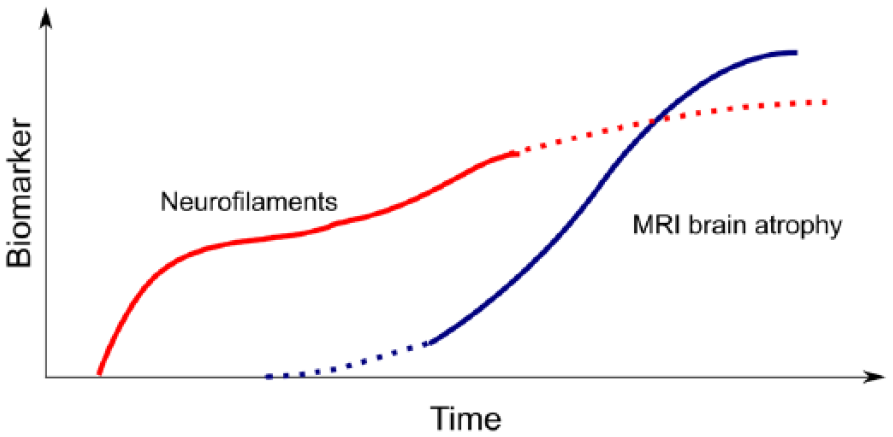
Model suggesting that development of disability related to axonal degeneration directly causes an increase in CSF neurofilament levels. Elevated neurofilament levels precede global brain atrophy on MRI.
Footnotes
Acknowledgements
This research has been executed within the VUmc MS Center Amsterdam and the UCL Institute of Neurology.
Declaration of Conflicting Interests
The author(s) declared no potential conflicts of interest with respect to the research, authorship, and/or publication of this article.
Funding
The author(s) disclosed receipt of the following financial support for the research, authorship, and/or publication of this article: The MS Center VUMC is partially funded by a programme grant of the Dutch MS Research Foundation (grant 09-358d MS).
Supplemental material
Supplementary data are available in the Journal’s website.