
Abstract
Background:
Spinal cord pathology is an important substrate for long-term disability in multiple sclerosis (MS).
Objective:
To investigate longitudinal changes in spinal cord lesions and atrophy in patients with a non-spinal clinically isolated syndrome (CIS), and how they relate to the development of disability.
Methods:
In all, 131 patients with a non-spinal CIS had brain and spinal cord imaging at the time of CIS and approximately 5 years later (median: 5.2 years, range: 3.0–7.9 years). Brain magnetic resonance imaging (MRI) measures consisted of T2-hyperintense and T1-hypointense lesion loads plus brain atrophy. Spinal cord MRI measures consisted of lesion number and the upper cervical cord cross-sectional area (UCCA). Disability was measured using the Expanded Disability Status Scale (EDSS). Multiple linear regression was used to identify independent predictors of disability after 5 years.
Results:
During follow-up, 93 (71%) patients were diagnosed with MS. Baseline spinal cord lesion number, change in cord lesion number and change in UCCA were independently associated with EDSS (R2 = 0.53) at follow-up. Including brain T2 lesion load and brain atrophy only modestly increased the predictive power of the model (R2 = 0.64).
Conclusion:
Asymptomatic spinal cord lesions and spinal cord atrophy contribute to the development of MS-related disability over the first 5 years after a non-spinal CIS.
Introduction
Disability in people with multiple sclerosis (MS) is frequently referable to the spinal cord. Pathological studies in MS show focal lesions involving grey and white matter, neuroaxonal loss and atrophy. 1 Magnetic resonance imaging (MRI) often detects spinal cord abnormalities in established MS.1,2 Focal T2-hyperintense lesions are seen in 75% or more of patients, most commonly in the cervical cord.2–4 Spinal cord atrophy can also be detected in vivo by measuring the upper cervical cord cross-sectional area (UCCA) 5 and has robust correlations with disability.3–13
A clinically isolated syndrome (CIS) represents the first clinical manifestation of relapse-onset MS. 14 Up to half of CIS patients have asymptomatic spinal cord lesions, and these can be helpful in establishing a diagnosis of MS.15–17 Spinal cord lesions may also be of some prognostic value; in clinically isolated optic neuritis, asymptomatic cord lesions are associated with an increased risk of disability after 5 years. 18 Spinal cord atrophy has been reported in CIS patients with T2-hyperintense brain lesions,19,20 a group known to be at high risk of developing MS. Only one previous study has investigated spinal cord atrophy longitudinally in patients with CIS, and no detectable change in UCCA was found over a follow-up period of 1 year. 19 This contrasts with findings in patients with established MS where progressive spinal cord atrophy is evident over follow-up periods of 12–36 months10–12 and may be associated with progression of disability.10,12
We wanted to investigate longitudinal changes in spinal cord lesions and UCCA over the first 5 years after a CIS to elucidate whether spinal cord involvement is one of the mechanisms underlying disability in early relapse-onset MS.
Methods
Patients
Between 1995 and 2004, patients seen at Moorfields Eye Hospital and the National Hospital for Neurology and Neurosurgery with first demyelinating events were invited to take part in a prospective CIS cohort study. Patients aged 16–50 years with a typical CIS suggestive of MS and no previous neurological symptoms were included in the study. The patients were seen at baseline (within 12 weeks of CIS) and were followed up after approximately 5 years. Disability was measured using the Expanded Disability Status Scale (EDSS). 21 All follow-up, EDSS assessments were done >4 weeks after a relapse or receiving corticosteroids. The currently used McDonald 2010 criteria 17 were retrospectively applied to classify the diagnosis (i.e. MS or CIS) at follow-up. Patients who presented with a spinal cord CIS were excluded because we wanted to investigate the significance of clinically silent spinal cord MRI abnormalities at presentation.
The study was approved by relevant institutional ethics committees. Informed consent was obtained at the time of study entry and at follow-up.
MRI acquisition
MRI brain and spinal cord was done at baseline and follow-up on the same 1.5T Signa scanner (General Electric, WI, USA). There was a scanner upgrade during the study period that was considered in statistical analyses (see below).
The acquisition protocol has been described in detail elsewhere.18,19 MRI of the brain included 46 mm × 3 mm contiguous axial proton density (PD)/T2-weighted images obtained using a dual-echo fast spin sequence (repetition time (TR): 3200 ms, time to echo (TE): 15/90 ms, matrix: 256 × 256, field of view (FOV): 24 cm) and post-contrast T1-weighted fast spin echo axial images (TR: 600 ms, TE: 14 ms, matrix: 256 × 256, FOV: 24 cm). MRI of the spinal cord comprised 9 mm × 3 mm contiguous sagittal PD/T2-weighted images (TR: 2500 ms, TE: 56/92 ms) of the whole cord and a volume-acquired inversion-prepared fast spoiled gradient echo (FSPGR) scan of the cervical cord (TR: 15.6 ms, TE: 4.2 ms, matrix: 256 × 256, FOV: 25 cm) with 60 mm × 1 mm sagittal slices.
Image analysis
Lesion measures
The number of T2-hyperintense brain and spinal cord lesions plus T1-hypointense brain lesions was recorded at baseline and follow-up. The lesions were identified by a single experienced neuroradiologist, who was blinded to the patient’s clinical status. T2-hyperintense and T1-hypointense brain lesions were outlined using a semi-automated edge finding tool (JIM6, Xinapse systems, Aldwincle, UK). T2 lesion volume (T2LV) and T1 lesion volume (T1LV) were calculated by multiplying lesion area by slice thickness. The change in T2LV, T1LV and spinal cord lesion number between baseline and follow-up was calculated (Figure 1).
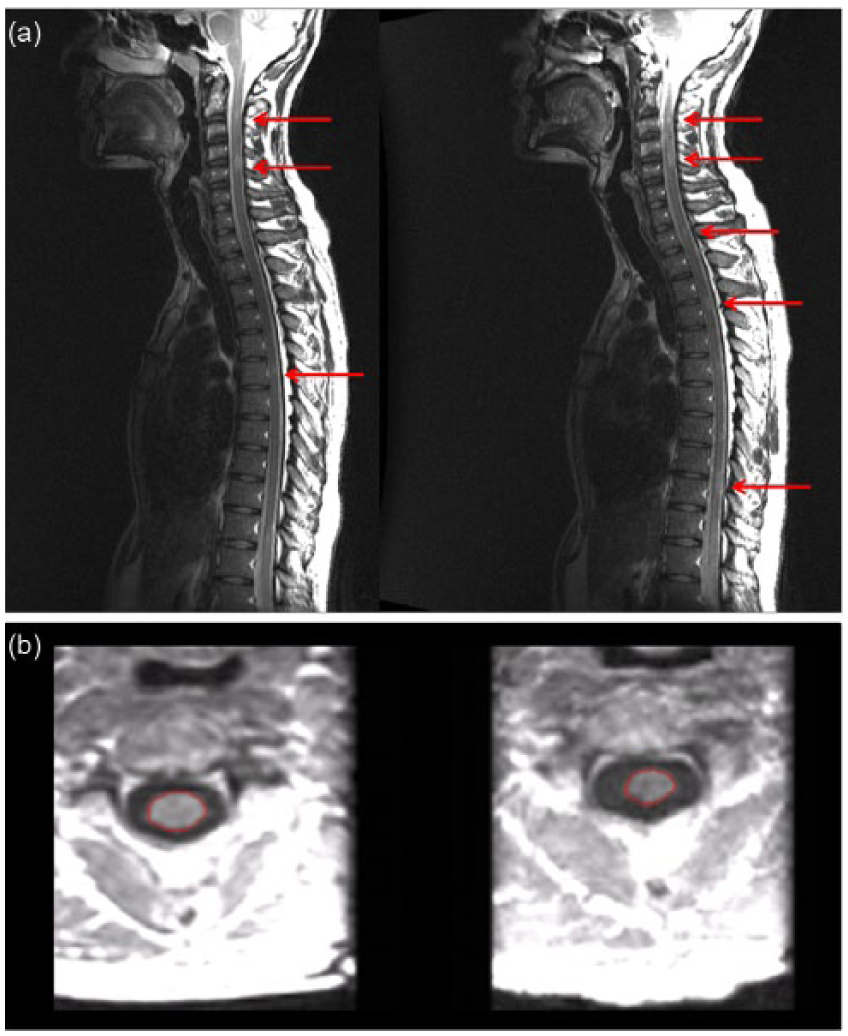
(a) T2-weighted sagittal images of the whole spine and (b) reformatted axial images from volumetric T1-weighted scans of the cervical spinal cord at the level of C2/C3, obtained at baseline (left) and follow-up (right). Figure 1(a) shows three spinal cord lesions at baseline and five lesions at follow-up (arrows). Figure 1(b) shows the upper cervical cord cross-sectional area (outlined in red). The mean UCCA was 72.08 mm2 at baseline and 61.28 mm2 after 5 years.
Brain atrophy
Normalised brain volume (NBV) at baseline was calculated using SIENAX and the percentage brain volume change (PBVC) between baseline and follow-up using SIENA from T1-weighted fast spin echo scans after filling T1-hypointense lesions.22,23 SIENAX and SIENA analyses were done using FMRIB Software Library (FSL) version 5.0.2.
Spinal cord atrophy
UCCA was measured from FSPGR scans of the cervical cord at baseline and follow-up. In line with previously described studies, sagittally acquired images were reformatted in the axial plane to obtain five contiguous 3 mm slices at the level of the C2/C3 disc, 5 and an active surface model was used to measure the mean UCCA over the five slices6,24,25 All UCCA measurements were done by a single observer. Change in UCCA between baseline and follow-up was recorded (Figure 1).
Statistical analysis
Patients were grouped based on clinical status at follow-up as CIS, MS with EDSS <3 and MS with EDSS ⩾3. Univariable comparisons of MRI measures between binary groups (disabled or not, MS or CIS) were examined using the Wilcoxon rank-sum test for lesion and brain atrophy measures due to their skewed distribution. Linear regression was used for comparisons of UCCA, with age and sex as covariates.
Multiple linear regression models were used to identify independent MRI predictors of EDSS at follow-up and the change in EDSS between baseline and follow-up. First, separate models were constructed for brain and spinal cord MRI measures in order to compare the proportion of variance explained using the R2 statistic and to restrict the number of covariates. Only variables with p < 0.08 were retained in models. Potential confounding by age and sex was examined by entering these into the final models; non-linear effects of continuous MRI predictors and their changes were examined by fitting quadratic terms and of count predictors by entering these in categorical form. Second, the predictor variables from the separate brain and spinal cord models were combined, and manual backward stepwise elimination was used to find the best combined model. Omitted MRI variables were then entered singly and retained if p < 0.08. Disease duration (i.e. time from CIS onset to follow-up) was included as a covariate in all models. The potential effect of a scanner upgrade during the follow-up period was assessed by adjusting for those subjects whose baseline and follow-up straddled the upgrade.
Linear regression allows convenient and valid identification of independent predictors of EDSS and assessment of the proportion of variance explained. Two possible disadvantages are as follows: (1) potential violation of the regression residual assumptions; it is important to note that the required assumption is not the normal distribution of EDSS but of the residuals after regression; however, although there was no evidence of residual non-normality or heteroscedasticity, inference from final models was confirmed using a non-parametric bias-corrected and accelerated bootstrap 26 with 1000 replicates; (2) although regression p values, confidence intervals and R2 are valid after the residual checks above, the regression coefficients for EDSS must be interpreted with caution and used comparatively rather than absolutely since the EDSS scale is non-linear.
Statistical analysis used Stata 13.1 (Stata Corporation, TX, USA). Significance is reported at the level of p < 0.05.
Results
131 non-spinal CIS patients (mean age: 32.6 years, 83 (63%) females) were seen at baseline (mean: 47 days after CIS, range: 6–88 days) and for follow-up after a mean of 5.3 years (median: 5.2 years, interquartile range: 1.6 years, range: 3.0–7.9 years). A total of 78 (60%) patients were seen for follow-up within 5 ± 1 year of CIS. The cohort included 114 (87%) patients with optic neuritis, 16 (12%) patients with a brainstem/cerebellar syndrome and 1 (1%) patient with a hemispheric syndrome.
During follow-up, 93 (71%) patients were diagnosed with MS using the McDonald 2010 criteria. 15 (16%) patients had an EDSS score of ⩾3 at follow-up (median EDSS: 3.5, range: 3–6.5) and were classified as disabled. Four of these patients had developed secondary progressive MS. In total, 78 (84%) MS patients had not developed significant disability (median EDSS: 1, range: 0–2.5). Disability was similar at follow-up in patients with optic neuritis and other CIS presentations (median EDSS: 1 in both groups). During follow-up, 23 (18%) patients started disease-modifying treatment (DMT, either beta interferon or glatiramer acetate). Only one CIS patient was treated before a second clinical attack. The proportion of males was higher among patients who remained CIS (53% vs 37%) which is in keeping with female sex being a risk factor for a final diagnosis of MS in patients with CIS.
Characteristics of the CIS cohort grouped by clinical status at follow-up are shown in Table 1.
Baseline demographic characteristics and MRI findings at baseline and follow-up grouped by clinical status after 5 years.
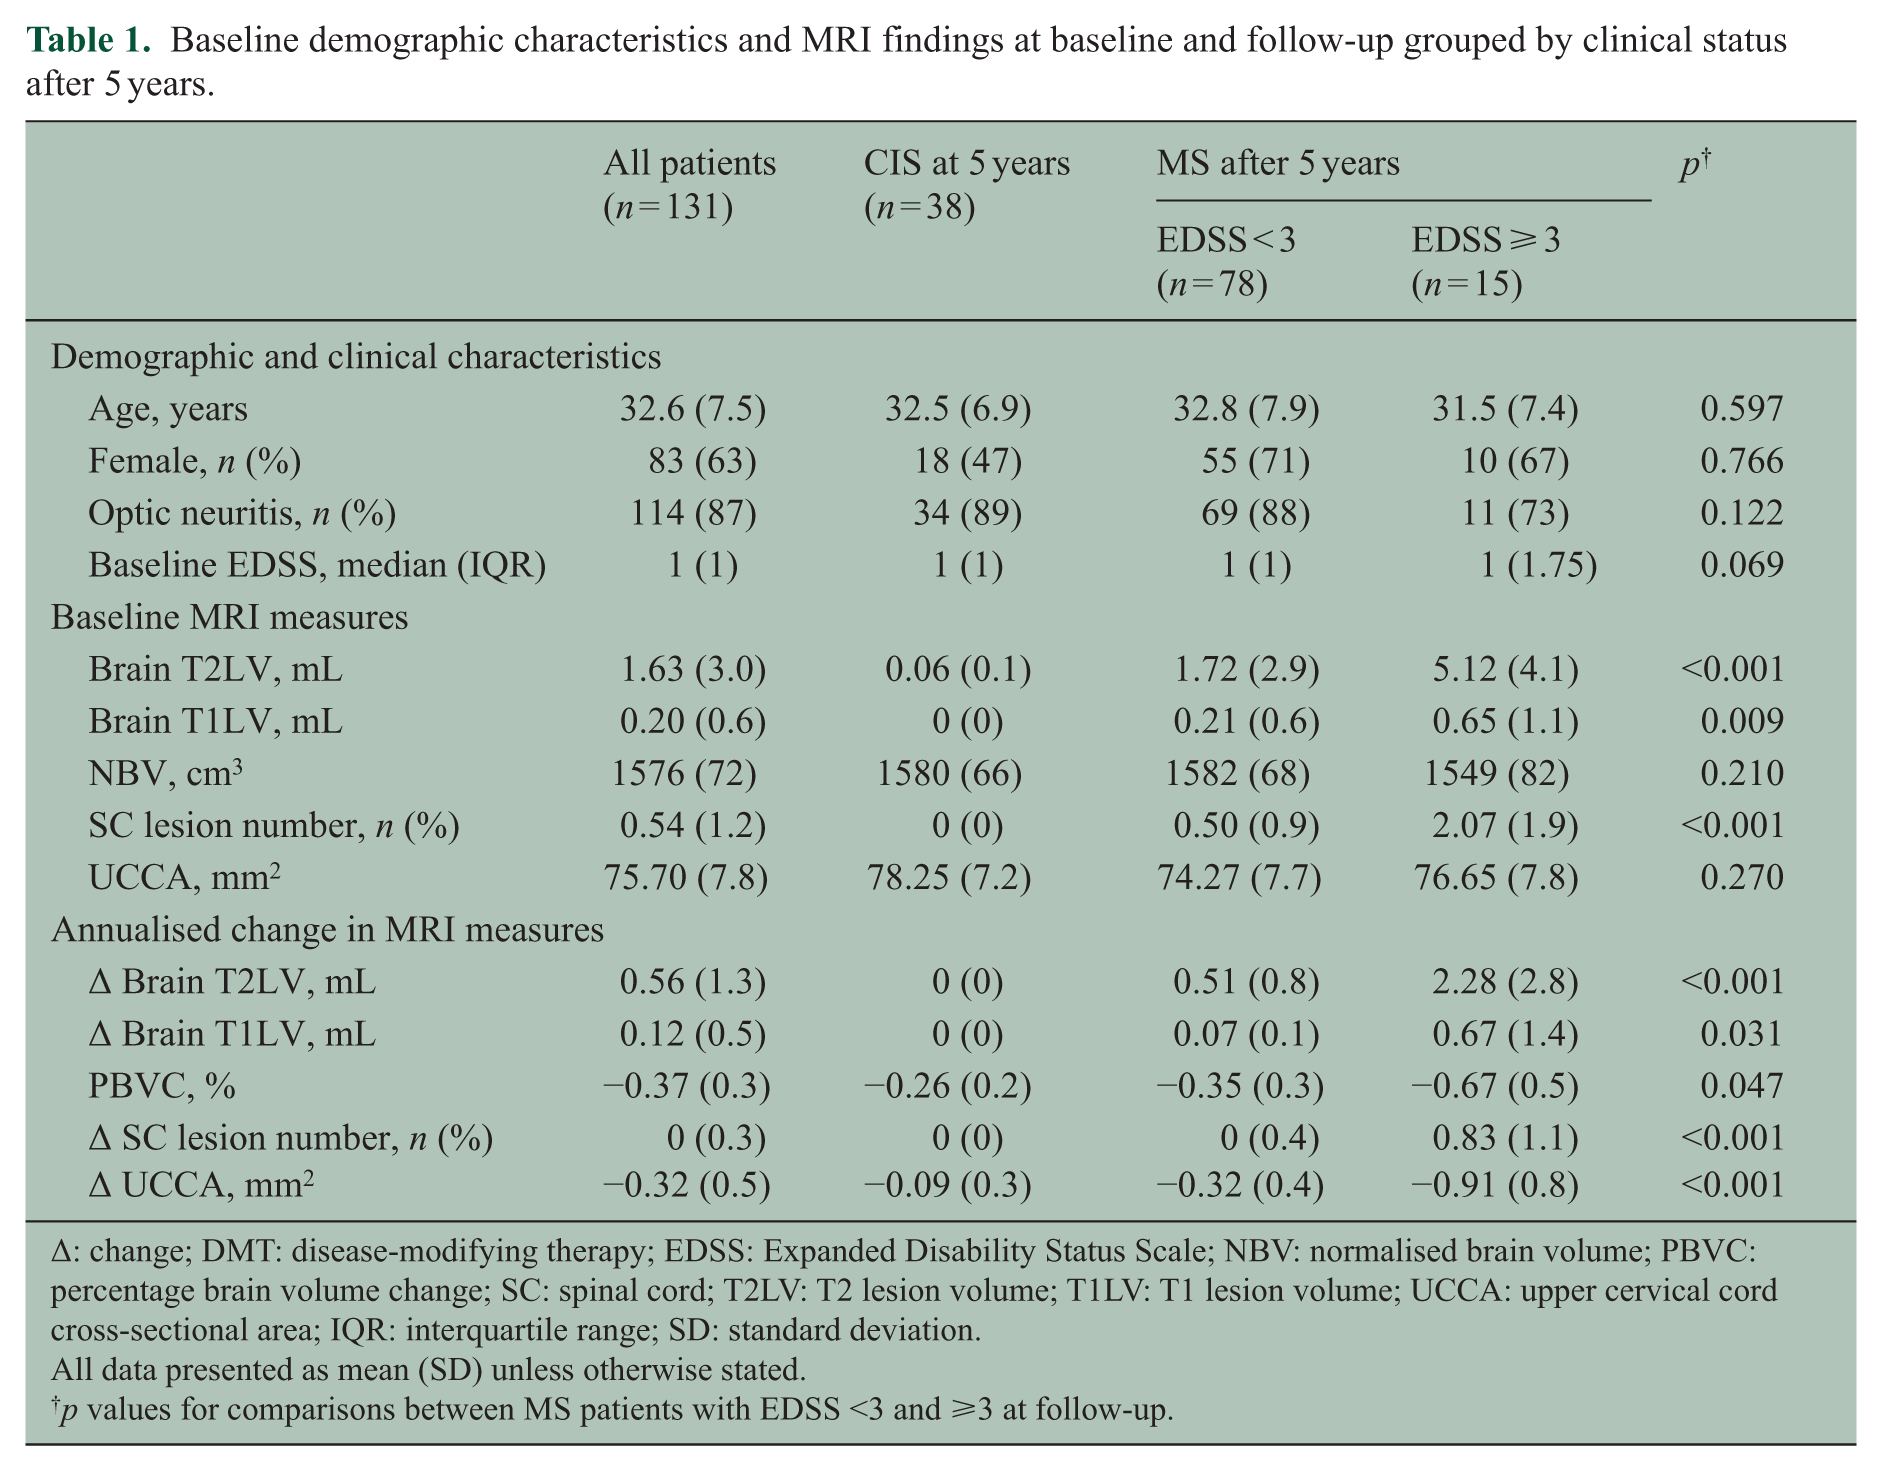
Δ: change; DMT: disease-modifying therapy; EDSS: Expanded Disability Status Scale; NBV: normalised brain volume; PBVC: percentage brain volume change; SC: spinal cord; T2LV: T2 lesion volume; T1LV: T1 lesion volume; UCCA: upper cervical cord cross-sectional area; IQR: interquartile range; SD: standard deviation.
All data presented as mean (SD) unless otherwise stated.
p values for comparisons between MS patients with EDSS <3 and ⩾3 at follow-up.
Brain MRI abnormalities
Brain MRI findings at baseline and at follow-up are shown in Table 1. MS patients classified as disabled at follow-up (EDSS ⩾ 3) had a greater T2LV at baseline (means 5.12 vs 1.72 mL, p < 0.001) and at follow-up (18.20 vs 4.89 mL, p < 0.001) compared with the MS patients without significant disability. The findings were similar for brain T1LV at baseline (0.65 vs 0.21 mL, p = 0.009) and at follow-up (5.06 vs 0.64 mL, p = 0.031). The annualised PBVC showed significantly more atrophy in patients with MS compared with those who remained CIS (−0.40% vs −0.26%, p = 0.009) and in the MS patients who were disabled at follow-up compared with those without disability (−0.67% vs −0.35%, p = 0.047).
Spinal cord MRI abnormalities
Spinal cord MRI measures at baseline and follow-up are shown in Table 1.
Spinal cord lesions
There was no difference in the number of spinal cord lesions at baseline in patients with optic neuritis and a non-optic neuritis CIS. None of the patients who remained CIS had spinal cord lesions either at baseline or follow-up. Among patients who were diagnosed with MS, the number of spinal cord lesions at baseline (median (range): 2 (0–7) vs 0 (0–5), p = 0.001) and at follow-up (median (range): 5 (1–14) vs 1 (0–9), p < 0.001) was higher in patients with disability compared with those without significant disability.
Spinal cord atrophy
The mean UCCA at baseline and follow-up grouped by clinical status at follow-up is shown in Figure 2.

Change in upper cervical cord area from baseline to 5 years grouped by disability status at follow-up.
There was no difference in the mean UCCA at baseline in patients with optic neuritis and a non-optic neuritis CIS. After adjusting for age and sex, there was no significant difference in the UCCA at baseline in patients who were diagnosed with MS compared with those who remained CIS (unadjusted means: 74.66 vs 78.25 mm2, adjusted difference in means: −2.21, p = 0.11) or in MS patients with and without disability at follow-up (unadjusted means: 76.65 vs 74.27 mm2, adjusted difference: 2.22, p = 0.27). The mean annualised change in UCCA showed significantly more atrophy in patients with MS compared with those who remained CIS (unadjusted means: −0.42 vs −0.09 mm2/year, adjusted difference: −0.37, p < 0.001) and in MS patients with disability compared with those without significant disability (unadjusted means: −0.91 vs −0.32 mm2/year, adjusted difference: −0.59, p < 0.001).
Independent associations between MRI measures and disability
Multivariable regression models were constructed that included brain MRI measures only, spinal cord MRI measures only and the combination of both (Tables 2 and 3) in order to determine independent associations between MRI measures and disability. Age, sex and scanner upgrade all had a negligible effect on regression coefficients and were not retained in the models. Change in T2LV showed evidence of a non-linear association with EDSS, and the squared term was therefore retained in models.
Multiple linear regression models investigating independent associations of MRI measures with EDSS after 5 years in patients with a non-spinal CIS.
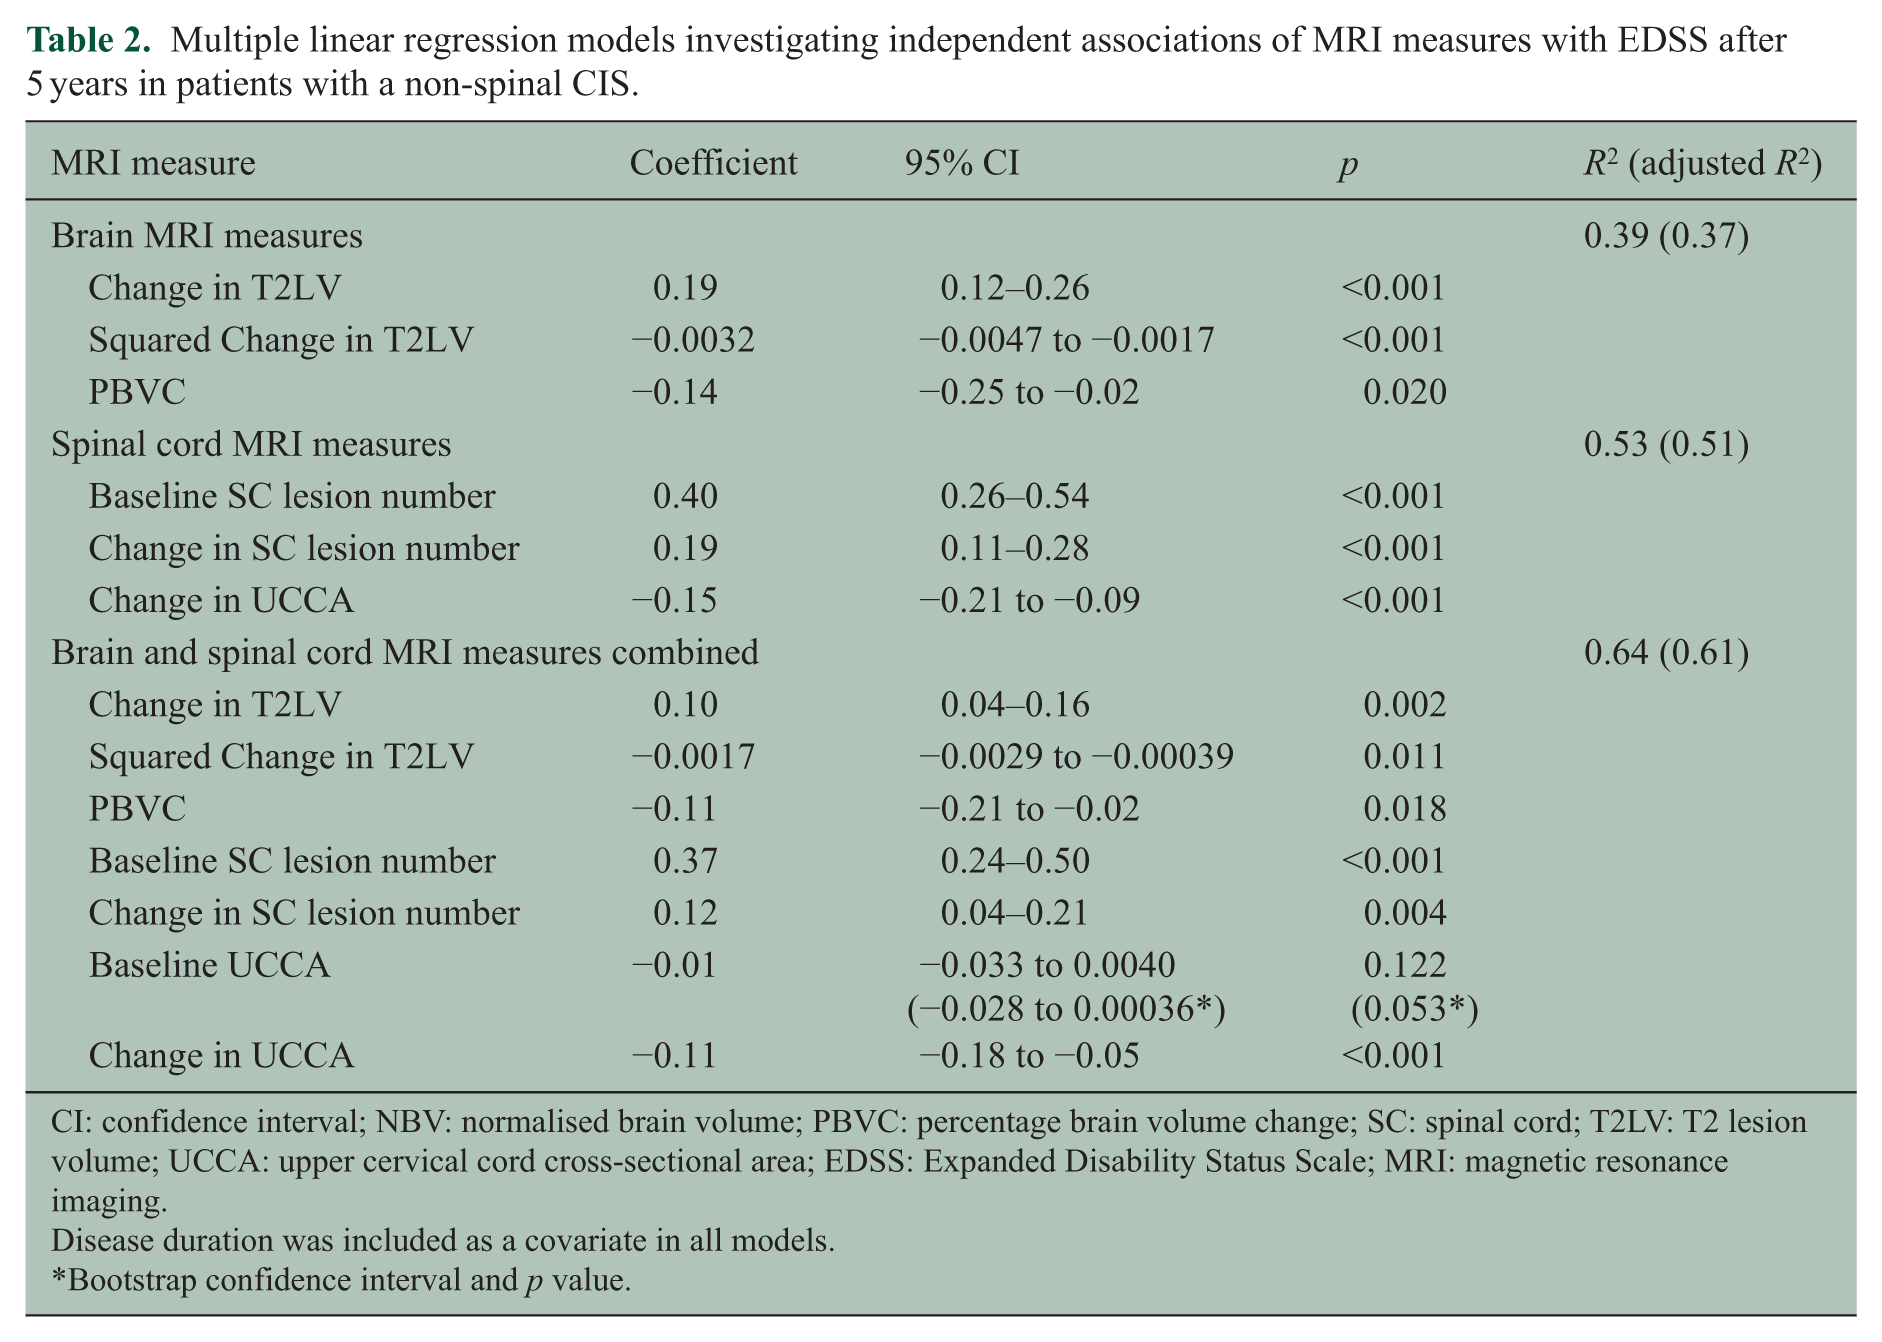
CI: confidence interval; NBV: normalised brain volume; PBVC: percentage brain volume change; SC: spinal cord; T2LV: T2 lesion volume; UCCA: upper cervical cord cross-sectional area; EDSS: Expanded Disability Status Scale; MRI: magnetic resonance imaging.
Disease duration was included as a covariate in all models.
Bootstrap confidence interval and p value.
Multiple linear regression models investigating independent associations of MRI measures with change in EDSS from baseline to follow-up in patients with a non-spinal CIS.
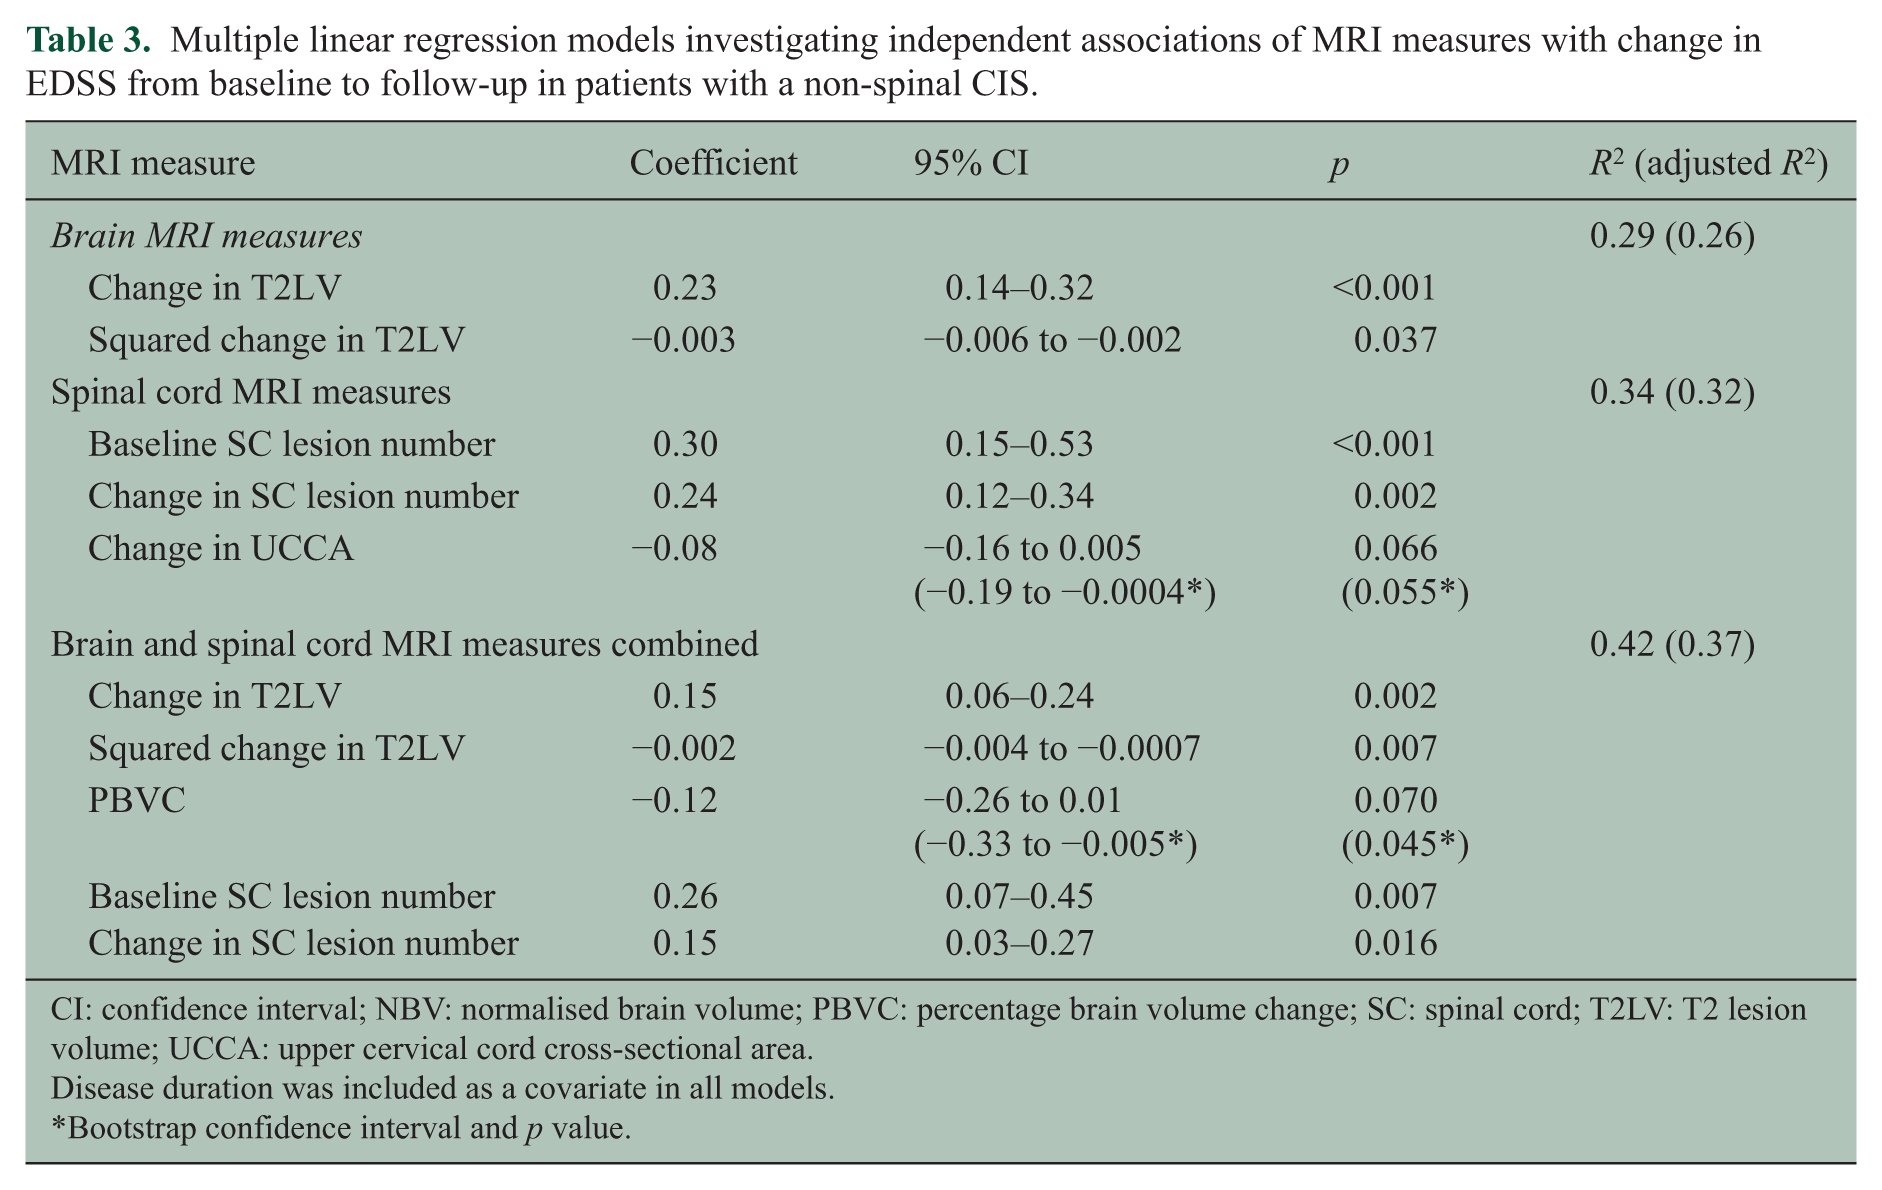
CI: confidence interval; NBV: normalised brain volume; PBVC: percentage brain volume change; SC: spinal cord; T2LV: T2 lesion volume; UCCA: upper cervical cord cross-sectional area.
Disease duration was included as a covariate in all models.
Bootstrap confidence interval and p value.
Multivariable linear regression: EDSS at follow-up
In the brain MRI model, the change in T2LV, squared change in T2LV and PBVC were independently associated with EDSS (R2 = 0.39). The small negative coefficient for squared change in T2LV suggests a levelling off, as volume increases of association between T2LV growth and higher EDSS. In the spinal cord model, baseline cord lesion number, change in cord lesion number and change in UCCA were independently associated with EDSS (R2 = 0.53).
When the brain and spinal cord MRI measures were combined, all the measures from the separate models above remained significant, and baseline UCCA became borderline significant. Combining brain and spinal cord MRI measures only modestly increased the predictive power of the model (adjusted R2 = 0.61) compared to spinal cord measures alone (adjusted R2 = 0.51). Bootstrapping confirmed the regression results, except for baseline UCCA in the combined model which became borderline significant (Table 2). Excluding patients with a non-optic neuritis presentation (n = 17) made no material difference to any of the models.
Spinal cord lesion number was the only baseline MRI measure associated with disability at follow-up. Univariably, baseline spinal cord lesion number explained a significant proportion of the variability in EDSS at follow-up (adjusted R2 = 0.24).
Because of differences in the length of follow-up from presentation with CIS (range: 3.0–7.9), we adjusted for disease duration (i.e. from onset of CIS to last follow-up) in all models reported. Omission of disease duration from the models did not materially affect the results. We did not adjust for DMT use in the models. Patients who started DMT had greater disability at follow-up (mean EDSS: 2.28 vs 1.21, p < 0.001), likely reflecting reverse causality with more severely affected patients receiving treatment. This is consistent with the greater change in T2LV (p < 0.001), PBVC (p = 0.003), cord lesion number (p < 0.001) and UCCA (p = 0.034) in patients who received DMT. Since these differences also likely reflect reverse causality, adjustment for DMT is not appropriate 27 being plausibly in the causal pathway between the MRI measures and EDSS, with a DMT covariate tending to ‘steal’ the effect of MRI variables. Nevertheless, when DMT was entered into the model, it was no longer associated with EDSS (p = 0.174) and all of the MRI variables remained significant, except baseline UCCA.
Multivariable linear regression: change in EDSS baseline to follow-up
We repeated analyses using change in EDSS from baseline to follow-up as the dependent variable (Table 3), largely confirming the above findings. In the brain-only model, change in T2LV and the squared change in T2LV were associated with the change in EDSS (adjusted R2 = 0.26), while in the spinal cord–only model, baseline spinal cord lesion number, change in spinal cord lesion number and change in UCCA with borderline significance were associated with the change in EDSS (adjusted R2 = 0.32). In the combined model, all of the MRI measures remained significant except the change in UCCA, and PBVC became borderline significant (confirmed with bootstrapping). The adjusted R2 for the combined model for change in EDSS was 0.37.
Discussion
In this prospectively recruited CIS cohort followed longitudinally from disease onset, spinal cord MRI abnormalities explained more of the variability in disability after approximately 5 years than brain MRI measures. These findings suggest that spinal cord abnormalities, detected using MRI, may be important in the evolution of disability in the early years following a non-spinal CIS.
Previous studies in patients with established MS have generally found a poor correlation between spinal cord lesion load and disability.2–4 Many studies have been cross-sectional in nature and included MS patients with different disease durations and clinical courses, whereas our cohort was followed longitudinally from disease onset. We have previously reported in a subgroup of these patients with optic neuritis that asymptomatic spinal cord lesions at the time of CIS are associated with disability after 5 years. 18 In this study, we confirmed the importance of cord lesions at baseline in a larger cohort and also found that change in cord lesion load was independently associated with disability.
Because of their location in or close to pathways involved in locomotor and sphincter function, spinal cord lesions may cause physical dysfunction more often than brain lesions (although the latter may also do so when they are in clinically eloquent locations, for example, the brainstem). New spinal cord lesions seen on MRI are more likely to be symptomatic than new brain lesions 28 and cord relapses are more likely to leave residual neurological impairment. 29 The spinal cord lesions seen at baseline in our study were clinically silent. How they contribute to future disability is uncertain, although one potential explanation is that axonal loss in focal lesions reduces the functional reserve to prevent permanent deficits when new pathological changes develop in the future. Whether the importance of focal spinal cord lesion accumulation lessens over time, particularly after the onset of secondary progression, is uncertain. Previous studies in patients with progressive MS have found no relationship between cord lesions and disability.3,4 However, a recent study at 3T that quantified cervical cord lesion load on axial images with high in-plane resolution found cord lesion load was independently associated with disability in relapsing and progressive forms of MS, and a higher lesion load was seen in patients with progressive MS. 30
In addition to focal lesions, we found that the change in UCCA was independently associated with disability at follow-up. Spinal cord atrophy in MS reflects neuroaxonal loss from the effects of axonal transection and Wallerian degeneration (arising from focal lesions) but also diffuse changes in the normal-appearing grey and white matter. 1 Spinal cord atrophy, as measured by the UCCA, has been correlated with disability in established MS.3–9,13 Spinal cord atrophy begins early in the course of MS with evidence of spinal cord atrophy in CIS patients with MRI brain abnormalities19,20 (a group at high risk of MS), compared with healthy controls. Few studies have evaluated longitudinal changes in spinal cord atrophy in patients with CIS. In a pilot study from this cohort, no change in UCCA was seen over a follow-up period of 1 year. 19 In a small study of patients with early relapsing-remitting MS (disease duration <3 years), the rate of spinal cord atrophy was significantly greater than in healthy controls. 11 However, there was no correlation between cord atrophy and change in disability over 3 years. This contrasts with our own findings that significantly greater spinal cord atrophy occurred in MS patients and that the change in UCCA was associated with EDSS at follow-up. Our positive findings might be explained by the longer duration of follow-up, larger sample size or the use of a more robust method for detecting spinal cord atrophy.5,25 It is noteworthy that the baseline UCCA was similar in CIS patients and MS patients with and without significant disability at follow-up. However, the change in UCCA was significantly greater in MS patients and particularly the subgroup with an EDSS ⩾3 at follow-up.
Spinal cord imaging is technically challenging and adds additional time to the brain MRI. 31 In clinical practice, spinal cord MRI is not always used in the diagnosis and monitoring of patients with MS. Recent European and North American guidelines recommend that spinal cord imaging be considered in CIS patients presenting with a spinal cord syndrome and in those patients where brain imaging is not diagnostic of MS.32,33 Whether routine spinal cord imaging should be done in patients with a non-spinal CIS is controversial. 34 Our findings suggest that spinal cord imaging may not only be helpful diagnostically 16 but may also provide significant prognostic information. Spinal cord atrophy is currently not able to be monitored in the clinical setting, although fully automated methods for measuring the UCCA are in development and appear to have a good correlation with semi-automated measures. 35
Some limitations should be noted. First, only a minority of patients developed significant disability over the 5-year follow-up period. Whether early spinal cord MRI abnormalities retain their prognostic significance in the longer term is uncertain. Future work in this and other CIS cohorts should address how early changes in brain and spinal cord MRI measures relate to the development of long-term disability. Second, the study did not include a matched healthy control group for comparison. However, in a previously reported study, the annualised decrease in UCCA was significantly greater in early relapsing-remitting MS patients than in healthy controls, and in that study, no significant change in UCCA was observed in the healthy control group over a follow-up period of up to 3 years. 11 Third, patients with optic neuritis are over-represented in this cohort with only a relatively small number of patients with other non-spinal CIS types. In some studies, optic neuritis appears to be associated with a better prognosis than other CIS types. 36 However, almost 80% of the cohort had an abnormal baseline MRI scan, indicating a group at high risk of the development of MS. Fourth, we did not consider the location of brain and spinal cord lesions. Infratentorial lesions in patients with CIS have been associated with an increased risk of future disability in previous studies that have not included spinal cord imaging. 37 Also, the level of spinal cord lesions (e.g. cervical, thoracic or lumbar) may influence clinical symptoms and disability, and this was not recorded in this study. Fifth, although much of the disability observed over the follow-up period is likely to be related to the effects of relapses, information on the number of relapses during the follow-up period was not available to include as a covariate in statistical models. Finally, we measured disability using the EDSS score, a scale that is weighted towards locomotor and ambulatory dysfunction and therefore potentially more sensitive to spinal cord dysfunction and less sensitive to other aspects of MS-related disability. The EDSS is, nevertheless, still the most widely used and accepted scale for monitoring the evolution of MS in clinical trials and natural history studies. It should be noted that EDSS assessments were done cross-sectionally at follow-up and not confirmed after 3 or 6 months which would be more robust, although confirmed disability progression is still prone to fluctuations. 38
In conclusion, we found that spinal cord MRI measures were more strongly associated with physical disability than brain MRI measures in the first 5 years after a non-spinal CIS. These findings suggest that spinal cord lesions and atrophy may be important in the evolution of disability in early relapse-onset MS.
Footnotes
Acknowledgements
The authors thank Dr Arman Eshaghi and Dr Ferran Prados who assisted with the SIENAX and SIENA analysis.
Declaration of Conflicting Interests
The author(s) declared no potential conflicts of interest with respect to the research, authorship, and/or publication of this article.
Funding
The author(s) declared receipt of the following financial support for the research, authorship, and/or publication of this article: The Queen Square MS Centre is supported by the United Kingdom MS Society and the UCL/UCLH NIHR Biomedical Research Centre. Dr Brownlee is supported by the Neurological Foundation of New Zealand.
References
Supplementary Material
Please find the following supplemental material available below.
For Open Access articles published under a Creative Commons License, all supplemental material carries the same license as the article it is associated with.
For non-Open Access articles published, all supplemental material carries a non-exclusive license, and permission requests for re-use of supplemental material or any part of supplemental material shall be sent directly to the copyright owner as specified in the copyright notice associated with the article.