
Abstract
Objective:
We combined double inversion recovery (DIR) and diffusion tensor (DT) magnetic resonance imaging (MRI) to quantify the severity of cortical lesion (CL) microstructural tissue abnormalities in a large cohort of relapse-onset multiple sclerosis (MS) patients and its contribution to cognitive dysfunction.
Methods:
DIR, DT, dual-echo, and three-dimensional (3D) T1-weighted scans were acquired from 149 MS patients and 40 controls. Cognitively impaired (CI) patients had ⩾2 abnormal neuropsychological tests. Diffusivity values in CLs, cortex, white matter (WM) lesions, and normal-appearing (NA) WM were assessed. Predictors of cognitive impairment were identified using a random forest analysis.
Results:
Compared to controls, MS patients had lower normalized brain volume (NBV), gray matter volume (GMV), WM volume, lower fractional anisotropy (FA), and higher mean diffusivity in cortex and normal-appearing white matter (NAWM). A total of 44 (29.5%) patients were CI. Compared to cognitively preserved (CP), CI patients had higher T2 WM lesion volume (LV), lower NBV and GMV, and more severe diffusivity abnormalities in WM lesions, cortex, and NAWM. CL measures did not differ between CI and CP patients. Cortex FA, age, disease duration, T2 WM LV, and GMV best predicted MS-related cognitive impairment (C-statistic = 0.88).
Conclusion:
“Diffuse” GM and NAWM damage and WM lesions, rather than intrinsic CL damage, contribute to cognitive impairment in MS.
Introduction
Despite multiple sclerosis (MS) has been classically defined as an inflammatory-demyelinating white matter (WM) disorder, several pathologic and magnetic resonance imaging (MRI) studies have provided evidence that there is an extensive gray matter (GM) involvement, in terms of secondary degenerative phenomena (due to the accumulation of damage in the WM) and focal lesions.1–3 In vivo imaging of cortical lesions (CLs) in MS patients is challenging due to technical issues and to the pathologic features of such lesions compared to those located in the WM.
During the past few years, different sequences have been proposed to visualize at least a portion of lesions located in the cortex, including double inversion recovery (DIR). 4 Using such an approach, it has been consistently demonstrated that CLs (1) are present in the main disease clinical phenotypes, from the earliest phases, even if they are more frequent in patients with progressive MS, 1 (2) have a role in the identification of clinically isolated syndromes subjects at a higher risk of evolution to definite MS, 5 and (3) are associated with clinical disability and cognitive impairment in patients with established MS. 6
Only a few studies have applied quantitative MR techniques, such as diffusion tensor (DT) MRI, to grade the severity of CL damage and its clinical relevance in MS.7–10 A consistent finding of these investigations is that differently from WM lesions (which usually show a decreased fractional anisotropy (FA)), CLs have an increased FA compared to cortical GM. Such a higher FA, combined with increased mean diffusivity (MD), can contribute to distinguish patients with the main disease clinical phenotypes. 9 One aspect that has not been explored yet is the contribution of CL damage, assessed using quantitative MRI techniques, to cognitive impairment in MS patients.
Against this background, we combined DIR and DT MRI to quantify the severity of CL microstructural abnormalities in a large cohort of relapse-onset MS patients and its contribution to cognitive dysfunction. Since many previous studies found an association between the presence of cognitive impairment in MS and several MRI measures of WM and GM involvement (at lesional and normal-appearing tissue level), 11 the role of these imaging measures in explaining the cognitive status of our patients was also assessed.
Materials and methods
Ethics committee approval
Institutional Review Board approval and written informed consent were obtained.
Subjects
In this prospective study, subjects were recruited from February 2010 to November 2013. The inclusion criteria for this study required all subjects to be right-handed and aged between 18 and 70 years. Patients had to have a diagnosis of relapse-onset MS. 12 Exclusion criteria were contraindication to MRI acquisition, relapses or steroid administration within the month prior to study enrollment, a history of major medical disorders other than MS, or drug and alcohol abuse.
Neurological and neuropsychological evaluation
Within 3 days from MRI acquisition, neurological examination, with Expanded Disability Status Scale (EDSS) score rating, was performed by an experienced neurologist blinded to the MRI findings, while cognitive performance was assessed using the Brief Repeatable Battery of Neuropsychological Tests (BRB-N) 13 (see supplementary material for details).
Patients with at least two abnormal tests (defined as a score more than 2 standard deviations (SDs) below the Italian normative values 14 were considered as cognitively impaired (CI). For each patient, a cognitive impairment index (CII) was also computed. 15
MRI acquisition
Using a 3.0-T scanner, the following brain axial images were acquired in a single session: (1) two-dimensional (2D) DIR, (2) dual-echo (DE) turbo spin-echo (TSE), (3) three-dimensional (3D) T1-weighted fast field echo (FFE), and (4) pulsed-gradient SE echo-planar (EP) sequence (see Supplementary material for details).
MRI analysis
All images were assessed by consensus of two experienced observers blinded to the subjects’ identities.
Lesion identification
On DIR images, particular attention was paid to the exclusion of artifacts, and CLs were identified and counted (Figure 1) following published recommendations. 16 CLs included (1) lesions confined to the cortical ribbon without involving the underlying subcortical WM (pure intracortical lesions—types II, III, and IV) and (2) mixed WM/GM lesions (type I) with a predominant extension in the cortex. WM lesions, which also included those located juxtacortically (contiguous to the cortex, and mixed WM/GM with a predominant extension in the WM), were also identified on DE and DIR images. Volumes of CLs and WM lesions were estimated using Jim 6.0 software (www.xinapse.com).
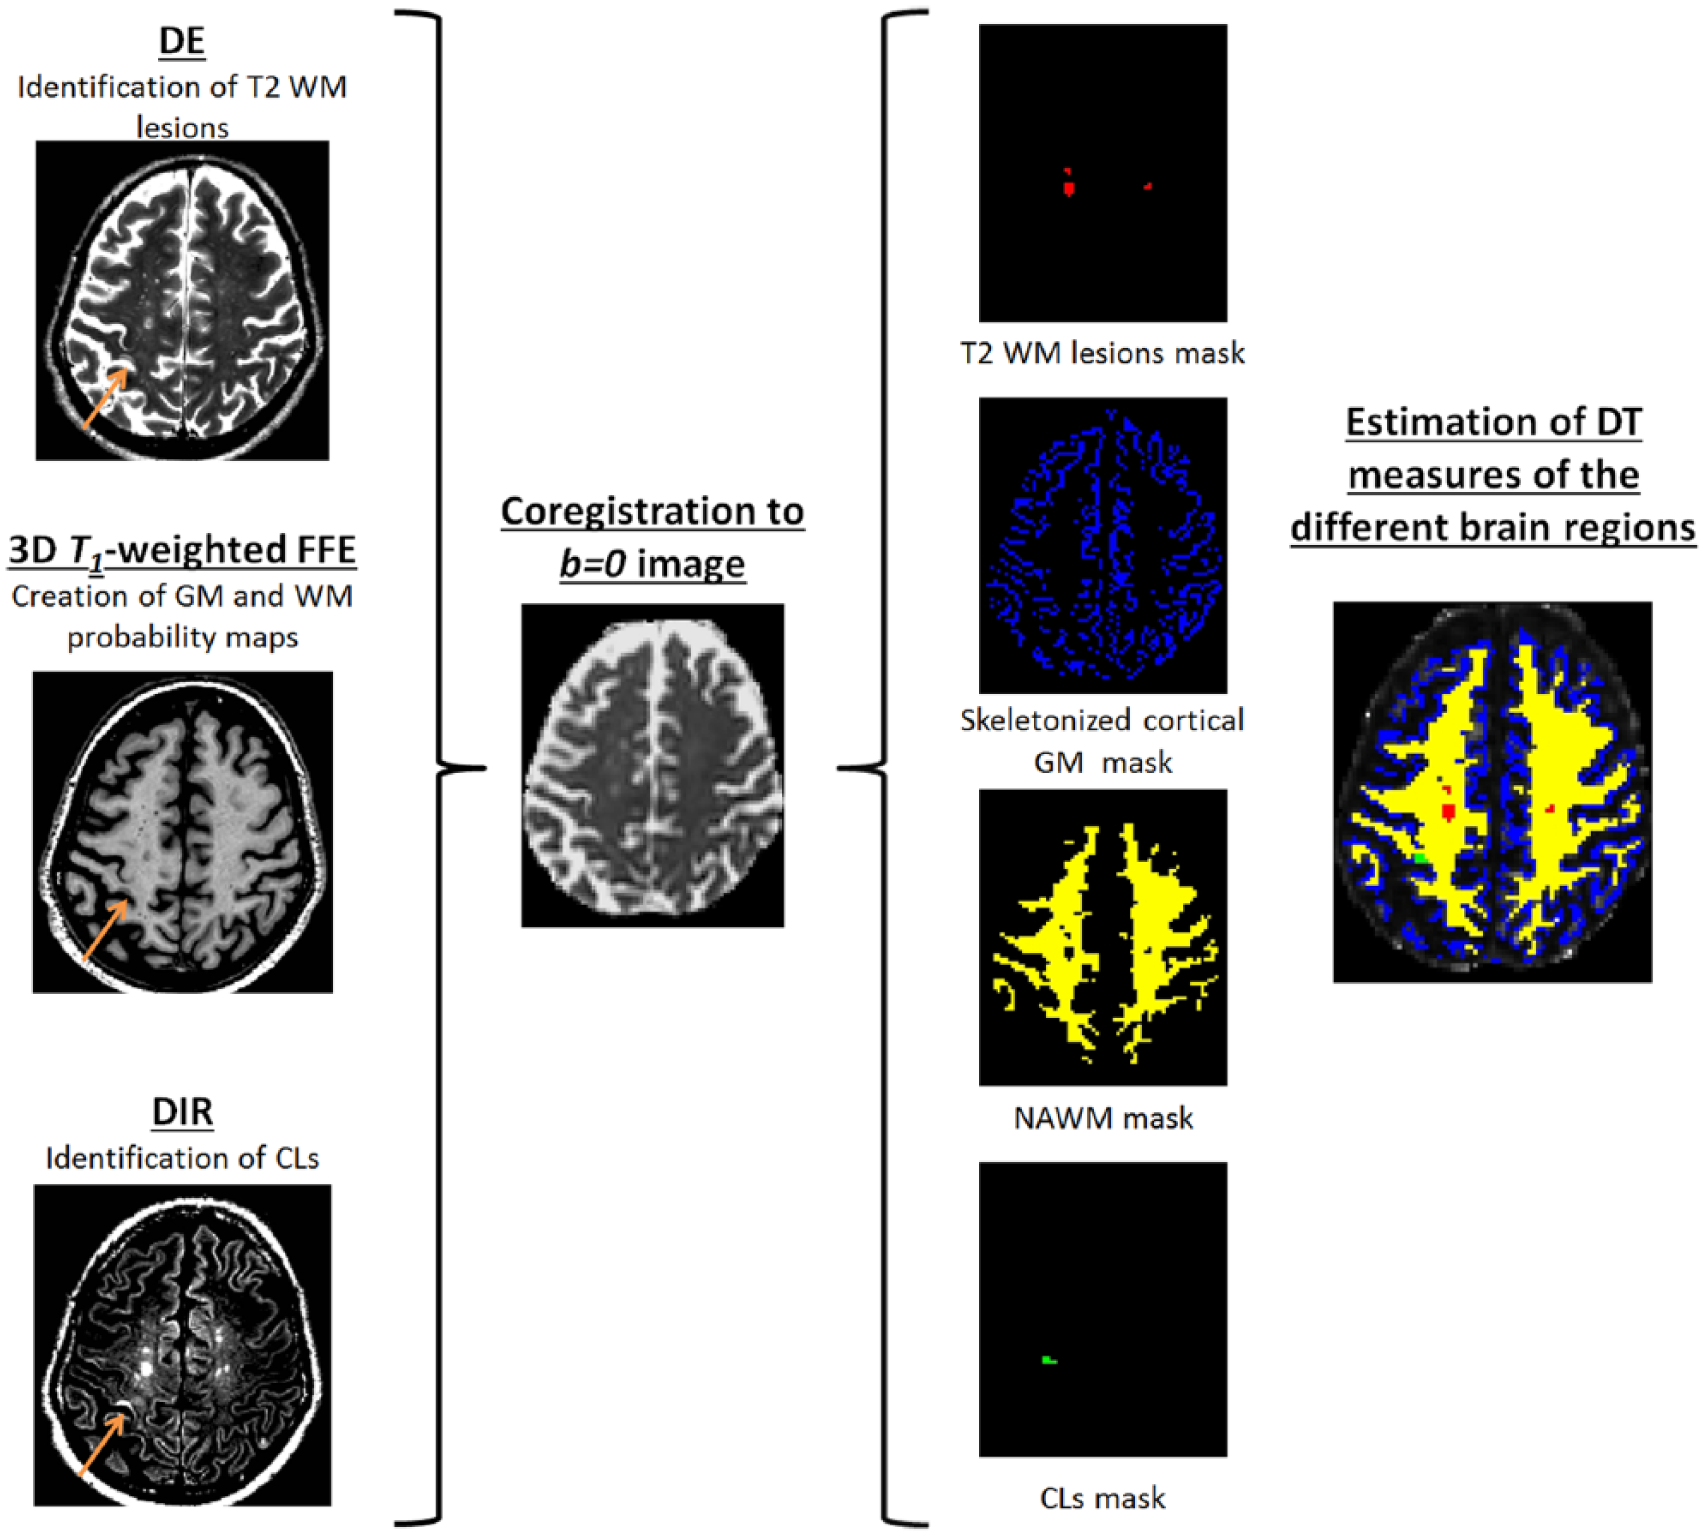
Schematic representation of methods applied to quantify diffusivity values in cortical lesions (CLs), skeletonized cortex gray matter (GM), white matter (WM) lesions, and normal-appearing (NA) WM. CLs and T2 WM lesions were identified on double inversion recovery (DIR) and double echo (DE), respectively. Probability maps of cortical GM and WM were obtained using 3D T1-weighted FFE. DIR, T2-weighted, and 3D T1-weighted images were separately coregistered to the distortion-free b = 0 image, and the calculated transformations were applied to the binary masks of CLs, WM lesions, WM, and GM probability maps. Finally, diffusivity values of different brain regions were calculated. See text for further details.
DT MRI postprocessing
Using in-house software, diffusion-weighted images were corrected for distortions caused by the eddy currents 17 and motion, and the DT was estimated by linear regression. 18 Subsequently, the eigenvalues of the DT were calculated by diagonalizing the tensor matrix and MD, and FA maps were derived. 19 To compensate for distortions normally associated with echo-planar imaging (EPI), the T2-weighted scan was registered to the b = 0 image (non-diffusion-weighted volume) with a rigid-body transformation, 20 after automatic removal of the skull and other non-brain tissues. 21 Then, the b = 0 image was deformed to match the T2-weighted image. 22 The non-linear transformation was applied to the b = 0 image and to the MD and FA maps.
3D T1-weighted postprocessing
3D T1-weighted images were corrected for signal intensity inhomogeneity (SPM8 bias field correction options). To avoid segmentation errors due to the presence of lesions, T1-hypointense WM lesions were segmented using Jim 6.0 and refilled, then probability maps of the GM, WM, and cerebrospinal fluid (CSF) compartments were created using the standard unified segmentation model in SPM8 (Figure 1).
After T1-hypointense lesion refilling, normalized brain volumes (NBV), GM, and WM volumes were assessed on 3D T1-weighted images using the SIENAx software.
Quantification of DT MRI metrics in lesions, NAWM, and cortex
DIR, T2-weighted, and 3D T1-weighted images were separately coregistered to the distortion-free b = 0 image, and the calculated transformations were applied to the binary masks of CLs and WM lesions and also to the WM/GM/CSF probability maps previously derived (Figure 1). After transformation, CL, WM lesion, WM, and CSF maps were thresholded at a probability value of 0.5. The CSF mask was used to null out the signal from the CSF in DT maps. To limit partial volume effects, the GM maps were skeletonized and masked to remove the cerebellum and basal ganglia, since our acquisition parameters were not optimized to achieve an optimal segmentation of the WM and GM in these structures (Figure 1). 9 Finally, the average MD and FA values were calculated in CLs intersecting the skeletonized cortex, in WM lesions, normal-appearing white matter (NAWM), and the cortex (after lesion removal).
Statistical analysis
Demographic and clinical variables were compared between groups using the Mann–Whitney U-tests and Pearson’s chi-square test as appropriate.
CL numbers were compared between groups using negative binomial models for count data adjusting for patients’ age. Conventional, DIR, and DT MRI measures were compared between groups using analysis of covariance (ANCOVA) model adjusting for age, and p values were Bonferroni corrected for multiple comparisons. Analyses were repeated adjusting also for disease clinical phenotype.
CL DT MRI quantities were compared between mixed WM/GM lesions and purely intracortical lesions (within the same subject) using paired t-test. In MS patients, Spearman’s rank correlation coefficient was estimated to evaluate the correlations between the different MRI measures of GM and WM brain damage.
To evaluate whether CL MRI measures explained the presence of cognitive impairment, a random forest (RF) analysis (SAS Release 9.1, randomForest package)23,24 was performed to identify demographic, clinical, and MRI measures significantly different between CI versus cognitively preserved (CP) MS patients that best predict the presence of cognitive impairment and to rank predictors importance.
RF 23 is a powerful machine learning statistical algorithm based on an ensemble of classification trees. For the RF method, 100,000 classification trees were built. The training set used to grow each tree was a 0.632+ bootstrap resample of the observations. The best split at each node was selected from a random subset of covariates. The left-out observations (i.e. “out-of-bag” observations) were then used to obtain the classification error of each tree considered. The goodness of the fit of the RF was assessed by averaging the individual tree classification errors. Furthermore, the RF framework estimates the importance of a predictor by examining how much the classification error increases when out-of-bag data for that variable are permuted, while all others are left unchanged. The importance of variables was ranked by assigning to each measure a score based on its ability to classify correctly the subjects according to the increase in classification error when values of that covariate in a node were permuted randomly. Variable importance was normalized with respect to the best predictor. The bootstrap resampling and the permutation strategy simulate, de facto, the natural variability of measures and provide an internal validation of the results: using a different bootstrap sample of the data and a different subset of predictors, randomly chosen to build each tree of the forest, RF overcomes the concern of false positive discoveries. By introducing an appropriate level of randomness, it provides accurate estimates of associations handling the problem of correlated predictors and showing which, among them, are the best ones. Multivariate logistic regression analysis with stepwise variable selection was performed to confirm the RF results. A p value < 0.05 was considered as significant.
Results
Demographic, clinical, and neuropsychological findings
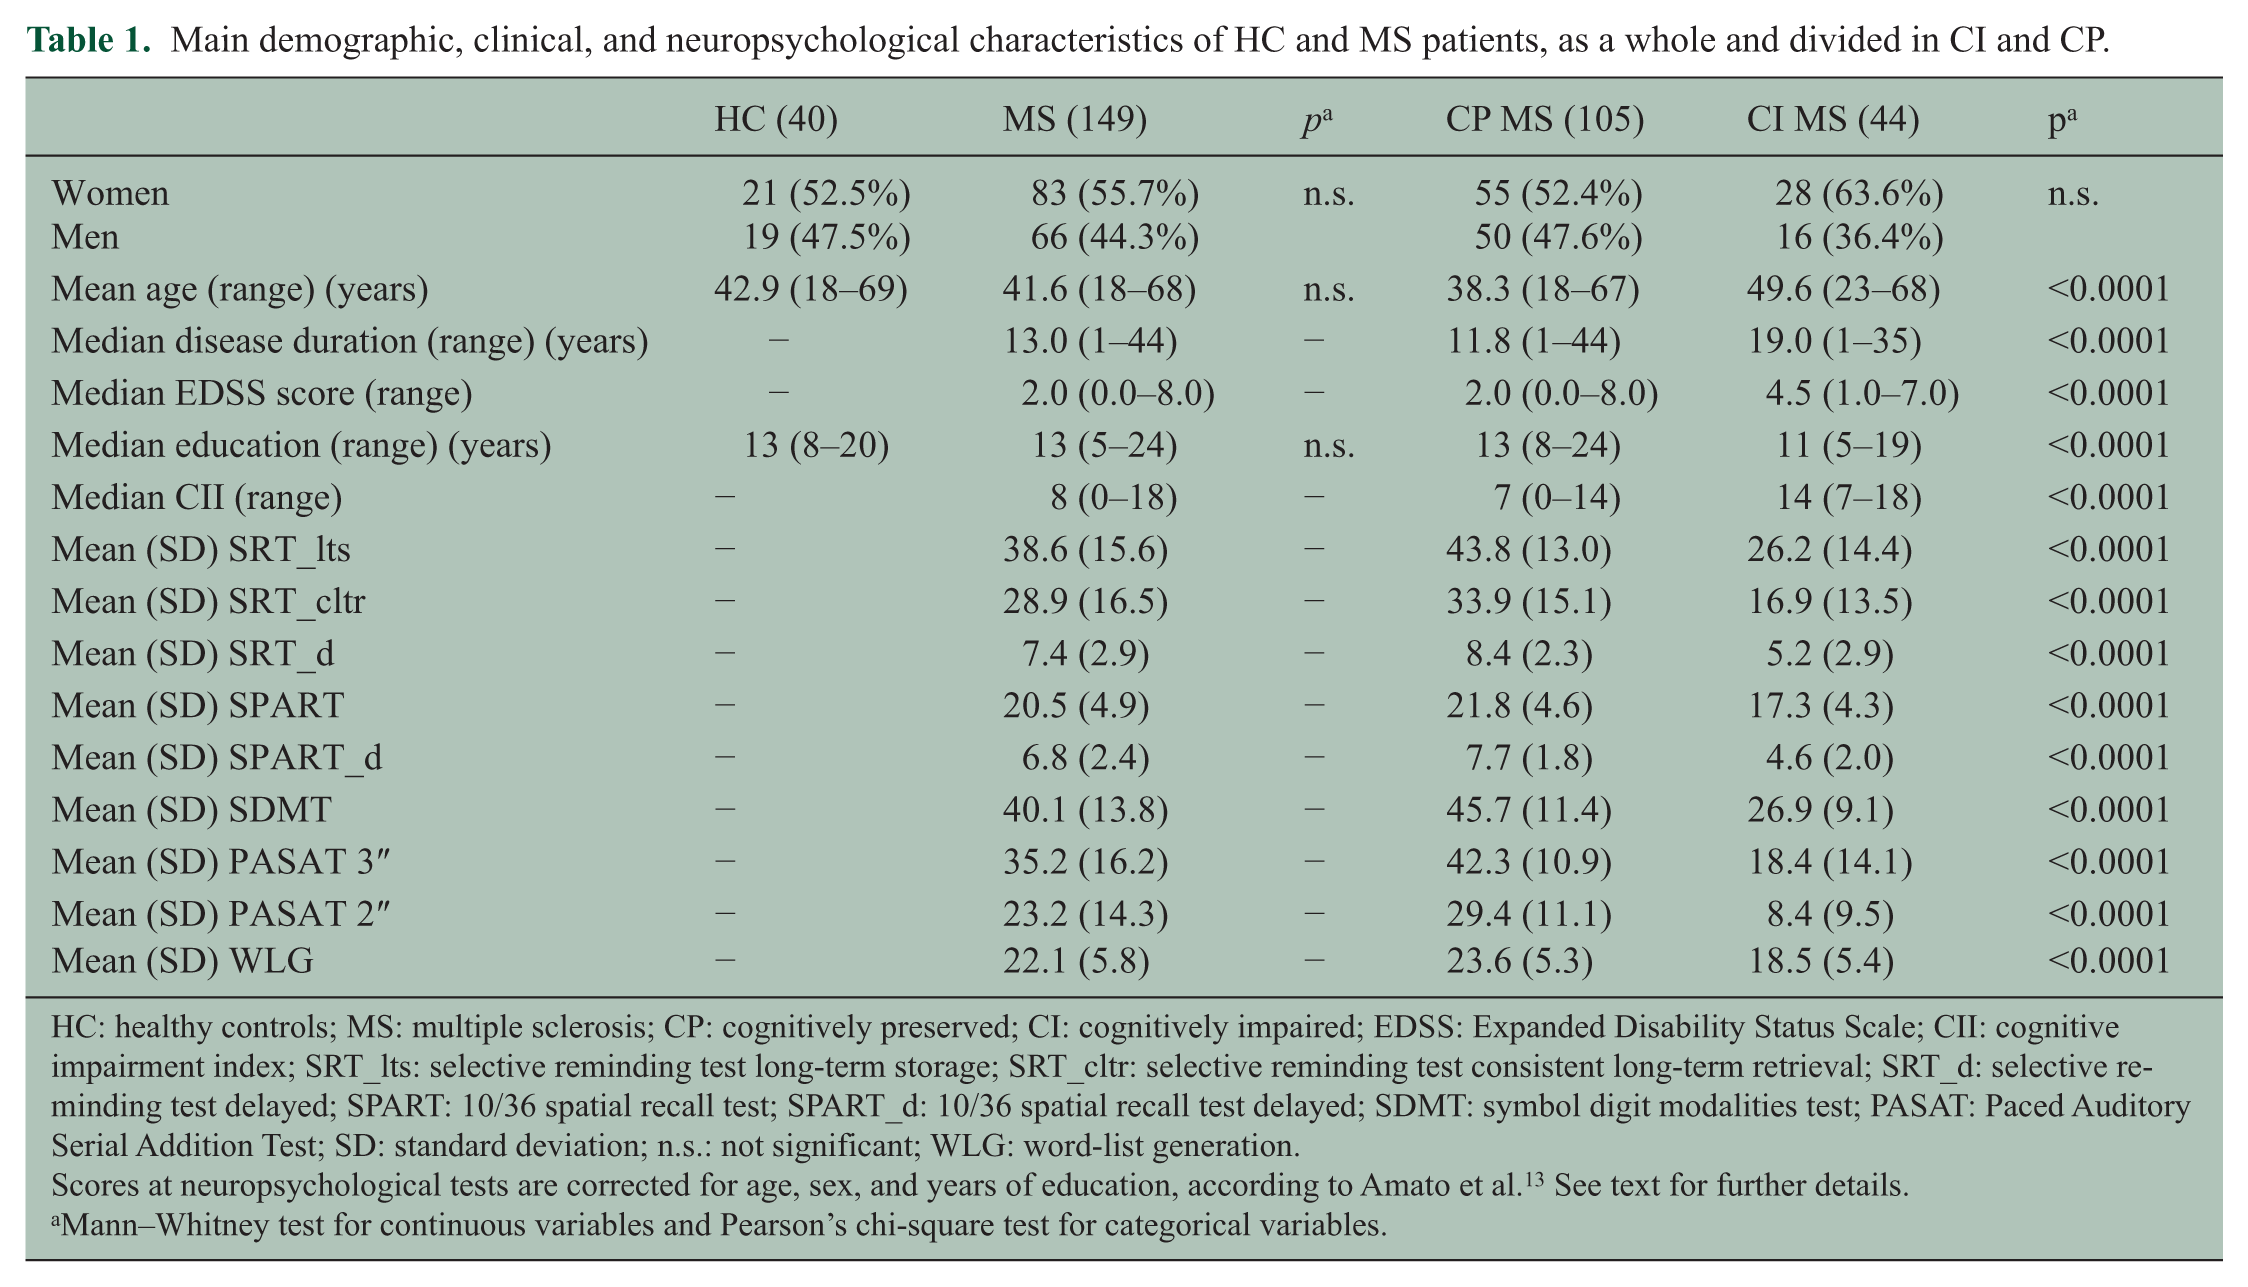
Table 1 summarizes the main demographic, clinical, and neuropsychological findings from healthy controls (HC; N = 40) and MS patients (N = 149). No difference was found between HC and MS patients for age (p = 0.52), gender (p = 0.72), and education (p = 0.11).
Main demographic, clinical, and neuropsychological characteristics of HC and MS patients, as a whole and divided in CI and CP.
HC: healthy controls; MS: multiple sclerosis; CP: cognitively preserved; CI: cognitively impaired; EDSS: Expanded Disability Status Scale; CII: cognitive impairment index; SRT_lts: selective reminding test long-term storage; SRT_cltr: selective reminding test consistent long-term retrieval; SRT_d: selective reminding test delayed; SPART: 10/36 spatial recall test; SPART_d: 10/36 spatial recall test delayed; SDMT: symbol digit modalities test; PASAT: Paced Auditory Serial Addition Test; SD: standard deviation; n.s.: not significant; WLG: word-list generation.
Scores at neuropsychological tests are corrected for age, sex, and years of education, according to Amato et al. 13 See text for further details.
Mann–Whitney test for continuous variables and Pearson’s chi-square test for categorical variables.
In total, 83 patients had relapsing–remitting (RR) MS, 41 secondary-progressive (SP) MS, and 25 benign (B) MS (EDSS score ⩽3.0 and disease duration (DD) ⩾ 15 years). Supplementary Table 1 shows patients’ characteristics according to disease clinical phenotype.
In total, 44 (29.5%) MS patients were classified as CI. Compared to CP, CI MS patients were older, had a lower education, longer DD, higher EDSS score, higher CII, and a worse performance at all neuropsychological tests (p < 0.0001 for all the comparisons).
Lesional, DT, and volumetric MRI findings in the WM and GM
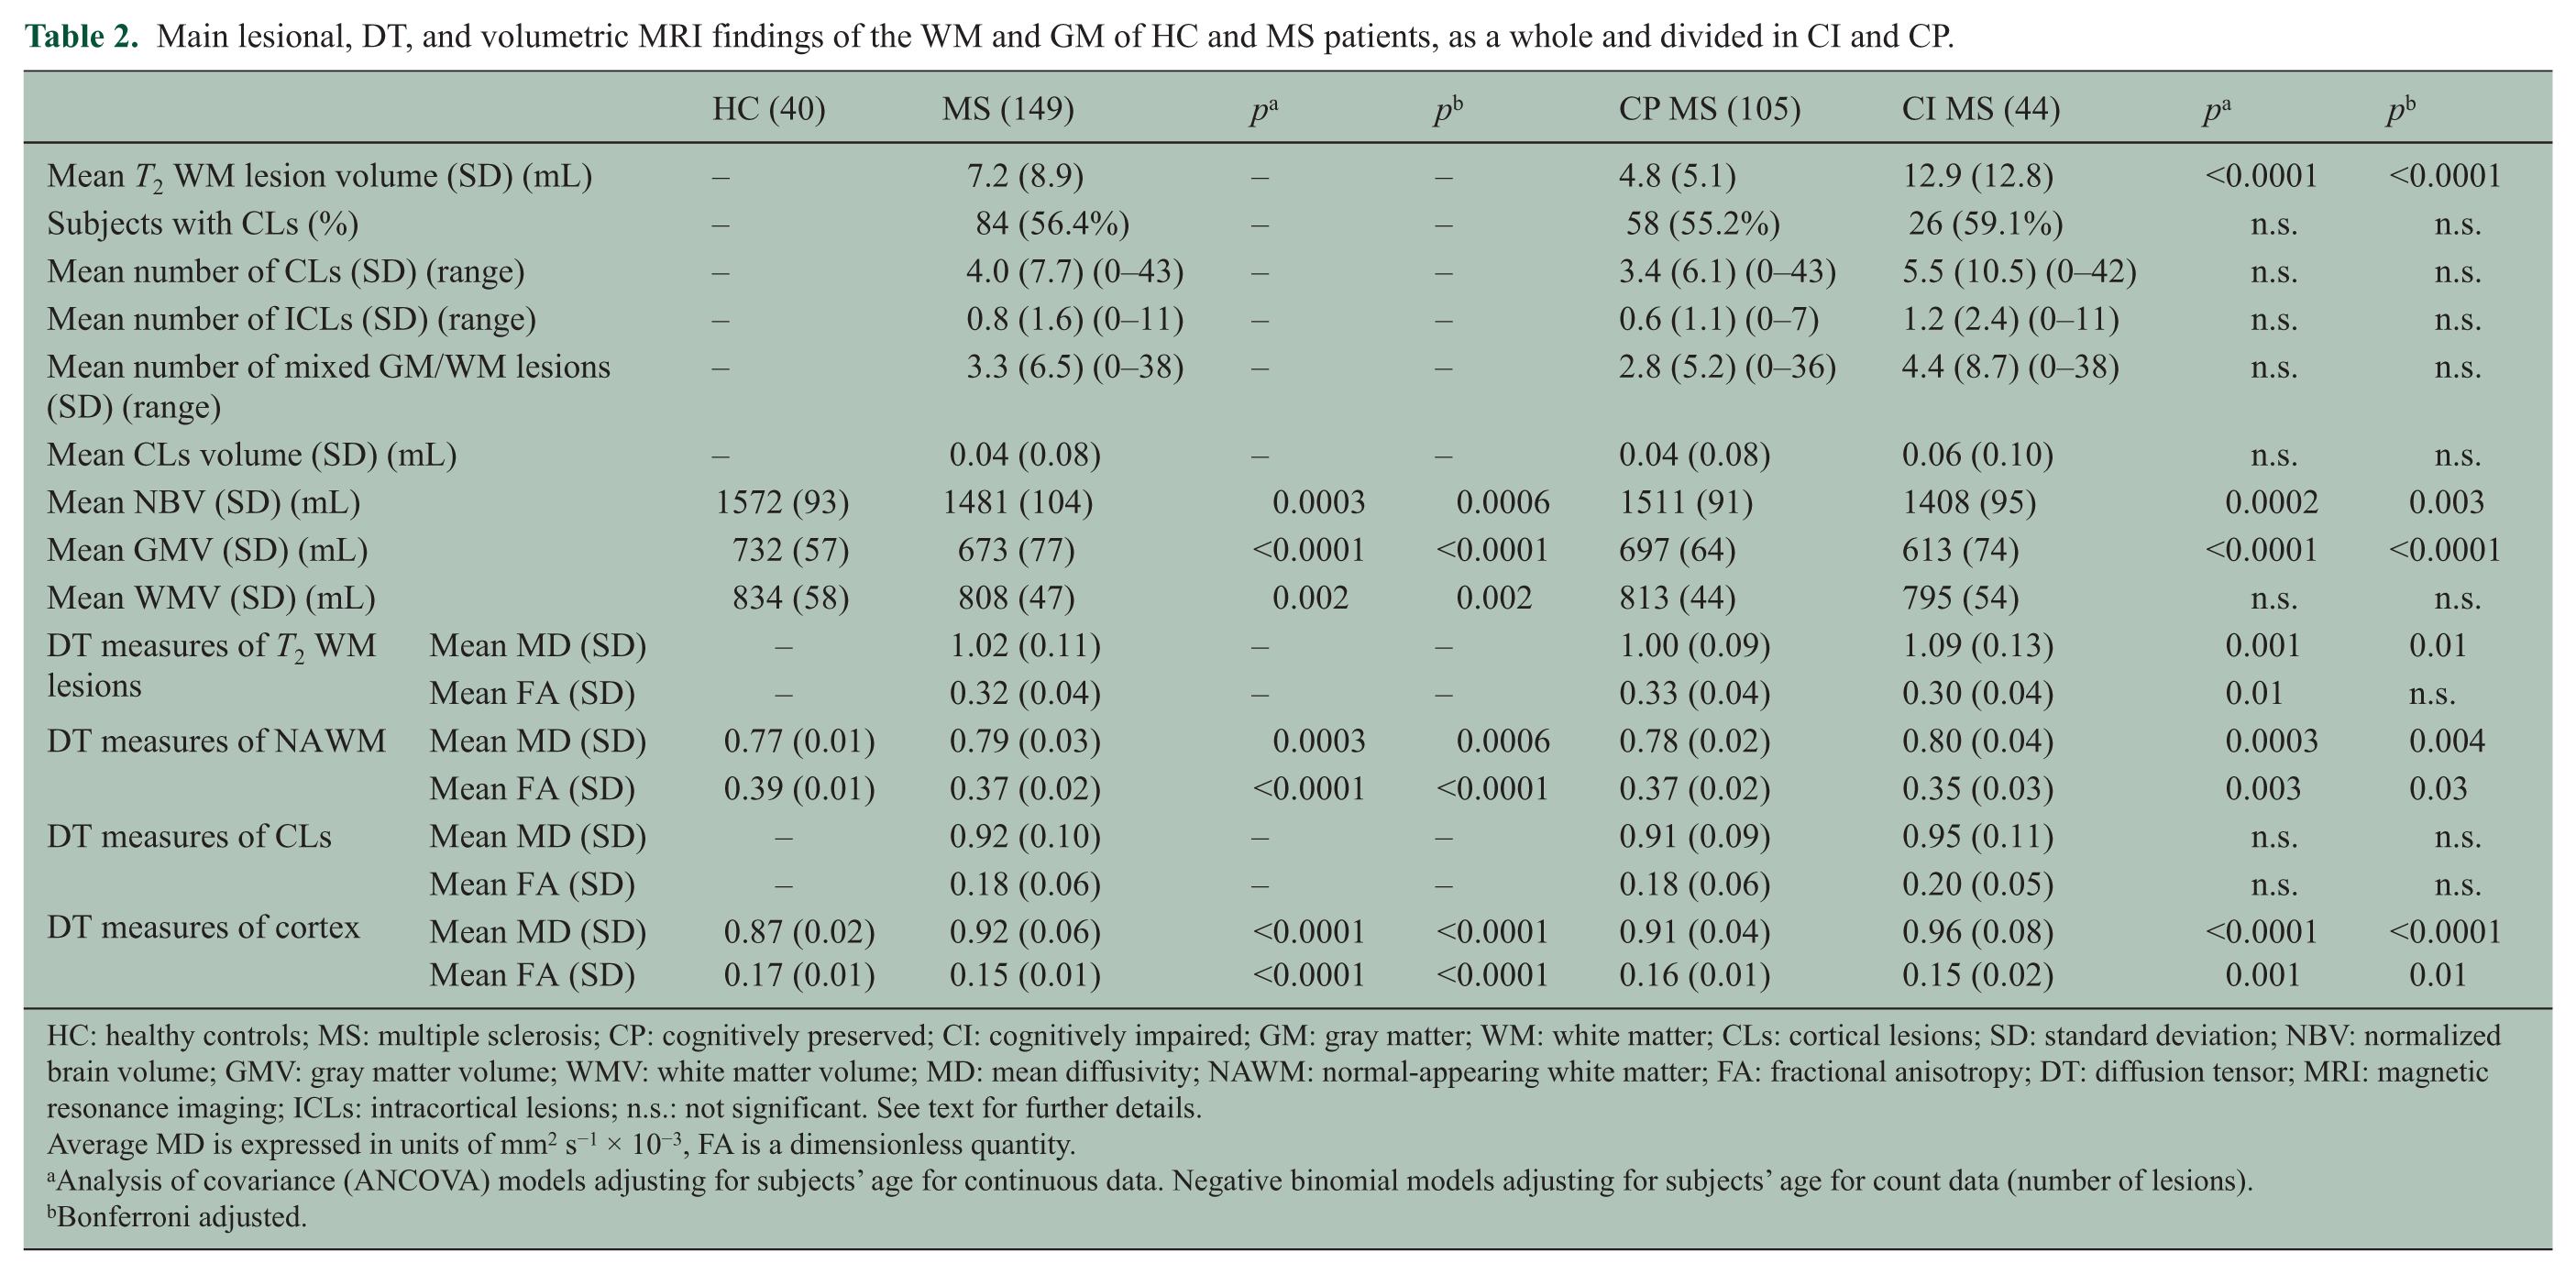
All HC had a normal MRI scan, without visible abnormalities. Table 2 summarizes lesional, DT, and volumetric MRI findings in the WM and GM of HC, whole group of MS patients, as well as CI and CP MS patients. Compared to HC, MS patients had lower NBV, gray matter volume (GMV), white matter volume (WMV), NAWM FA and skeletonized cortex FA, and higher NAWM MD and skeletonized cortex MD (p values ranging from <0.0001 to 0.0006).
Main lesional, DT, and volumetric MRI findings of the WM and GM of HC and MS patients, as a whole and divided in CI and CP.
HC: healthy controls; MS: multiple sclerosis; CP: cognitively preserved; CI: cognitively impaired; GM: gray matter; WM: white matter; CLs: cortical lesions; SD: standard deviation; NBV: normalized brain volume; GMV: gray matter volume; WMV: white matter volume; MD: mean diffusivity; NAWM: normal-appearing white matter; FA: fractional anisotropy; DT: diffusion tensor; MRI: magnetic resonance imaging; ICLs: intracortical lesions; n.s.: not significant. See text for further details.
Average MD is expressed in units of mm2 s−1 × 10⁻³, FA is a dimensionless quantity.
Analysis of covariance (ANCOVA) models adjusting for subjects’ age for continuous data. Negative binomial models adjusting for subjects’ age for count data (number of lesions).
Bonferroni adjusted.
Compared to CP, CI MS patients had a higher T2 WM lesion volume (LV), lower NBV and GMV, and more severe DT MRI abnormalities in the skeletonized cortex, NAWM, and T2 WM lesions (p values ranging from <0.0001 to 0.03). No difference was found for CL features (prevalence, number, volume, and DT MRI measures) between CI and CP MS patients. Similar findings were found adjusting for disease clinical phenotype, but not adjusting for age (data not shown).
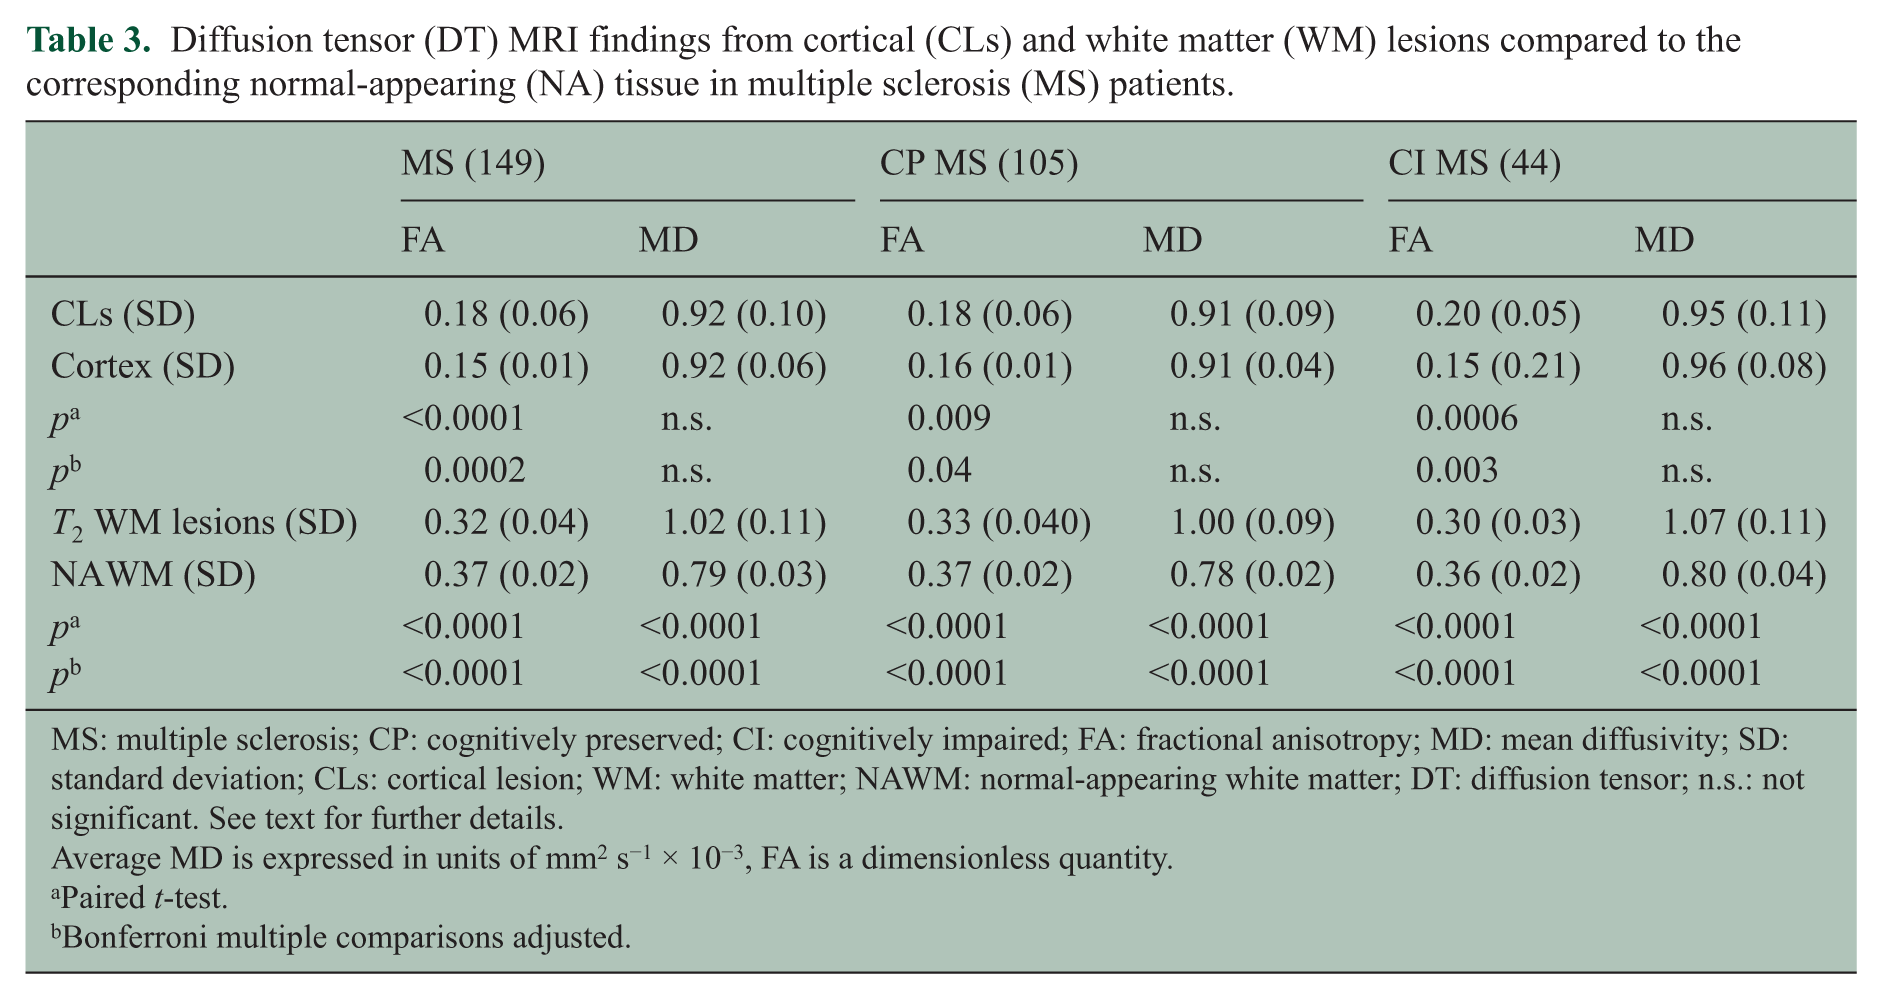
CL DT MRI metrics in comparison with cortex in MS patients with CLs are shown in Table 3. CLs had higher FA (p = 0.0002) versus patients’ skeletonized cortex, while no MD difference was found. T2 WM lesions had higher MD (p < 0.0001) and lower FA (p < 0.0001) compared to the NAWM. Similar results were obtained when analyzing CP and CI MS patients, separately (p values ranging from <0.0001 to 0.04).
Diffusion tensor (DT) MRI findings from cortical (CLs) and white matter (WM) lesions compared to the corresponding normal-appearing (NA) tissue in multiple sclerosis (MS) patients.
MS: multiple sclerosis; CP: cognitively preserved; CI: cognitively impaired; FA: fractional anisotropy; MD: mean diffusivity; SD: standard deviation; CLs: cortical lesion; WM: white matter; NAWM: normal-appearing white matter; DT: diffusion tensor; n.s.: not significant. See text for further details.
Average MD is expressed in units of mm2 s−1 × 10⁻³, FA is a dimensionless quantity.
Paired t-test.
Bonferroni multiple comparisons adjusted.
Table 4 shows correlations between lesional, DT, and volumetric MRI findings in MS patients. Significant correlations were found between NAWM diffusivity abnormalities and T2 WM LV, T2 WM lesion MD and FA, skeletonized cortex MD, NBV, GMV, and WMV (r values ranging from −0.64 to 0.65). Significant correlations were also found between skeletonized cortex diffusivity abnormalities and T2 WM LV, DT measures of T2 WM lesions, NAWM and CL, NBV, GMV, and WMV (r values ranging from −0.64 to 0.55).
Significant correlations between lesional, diffusion tensor (DT), and volumetric MRI findings of the white matter (WM) and gray matter (GM) in multiple sclerosis (MS) patients.
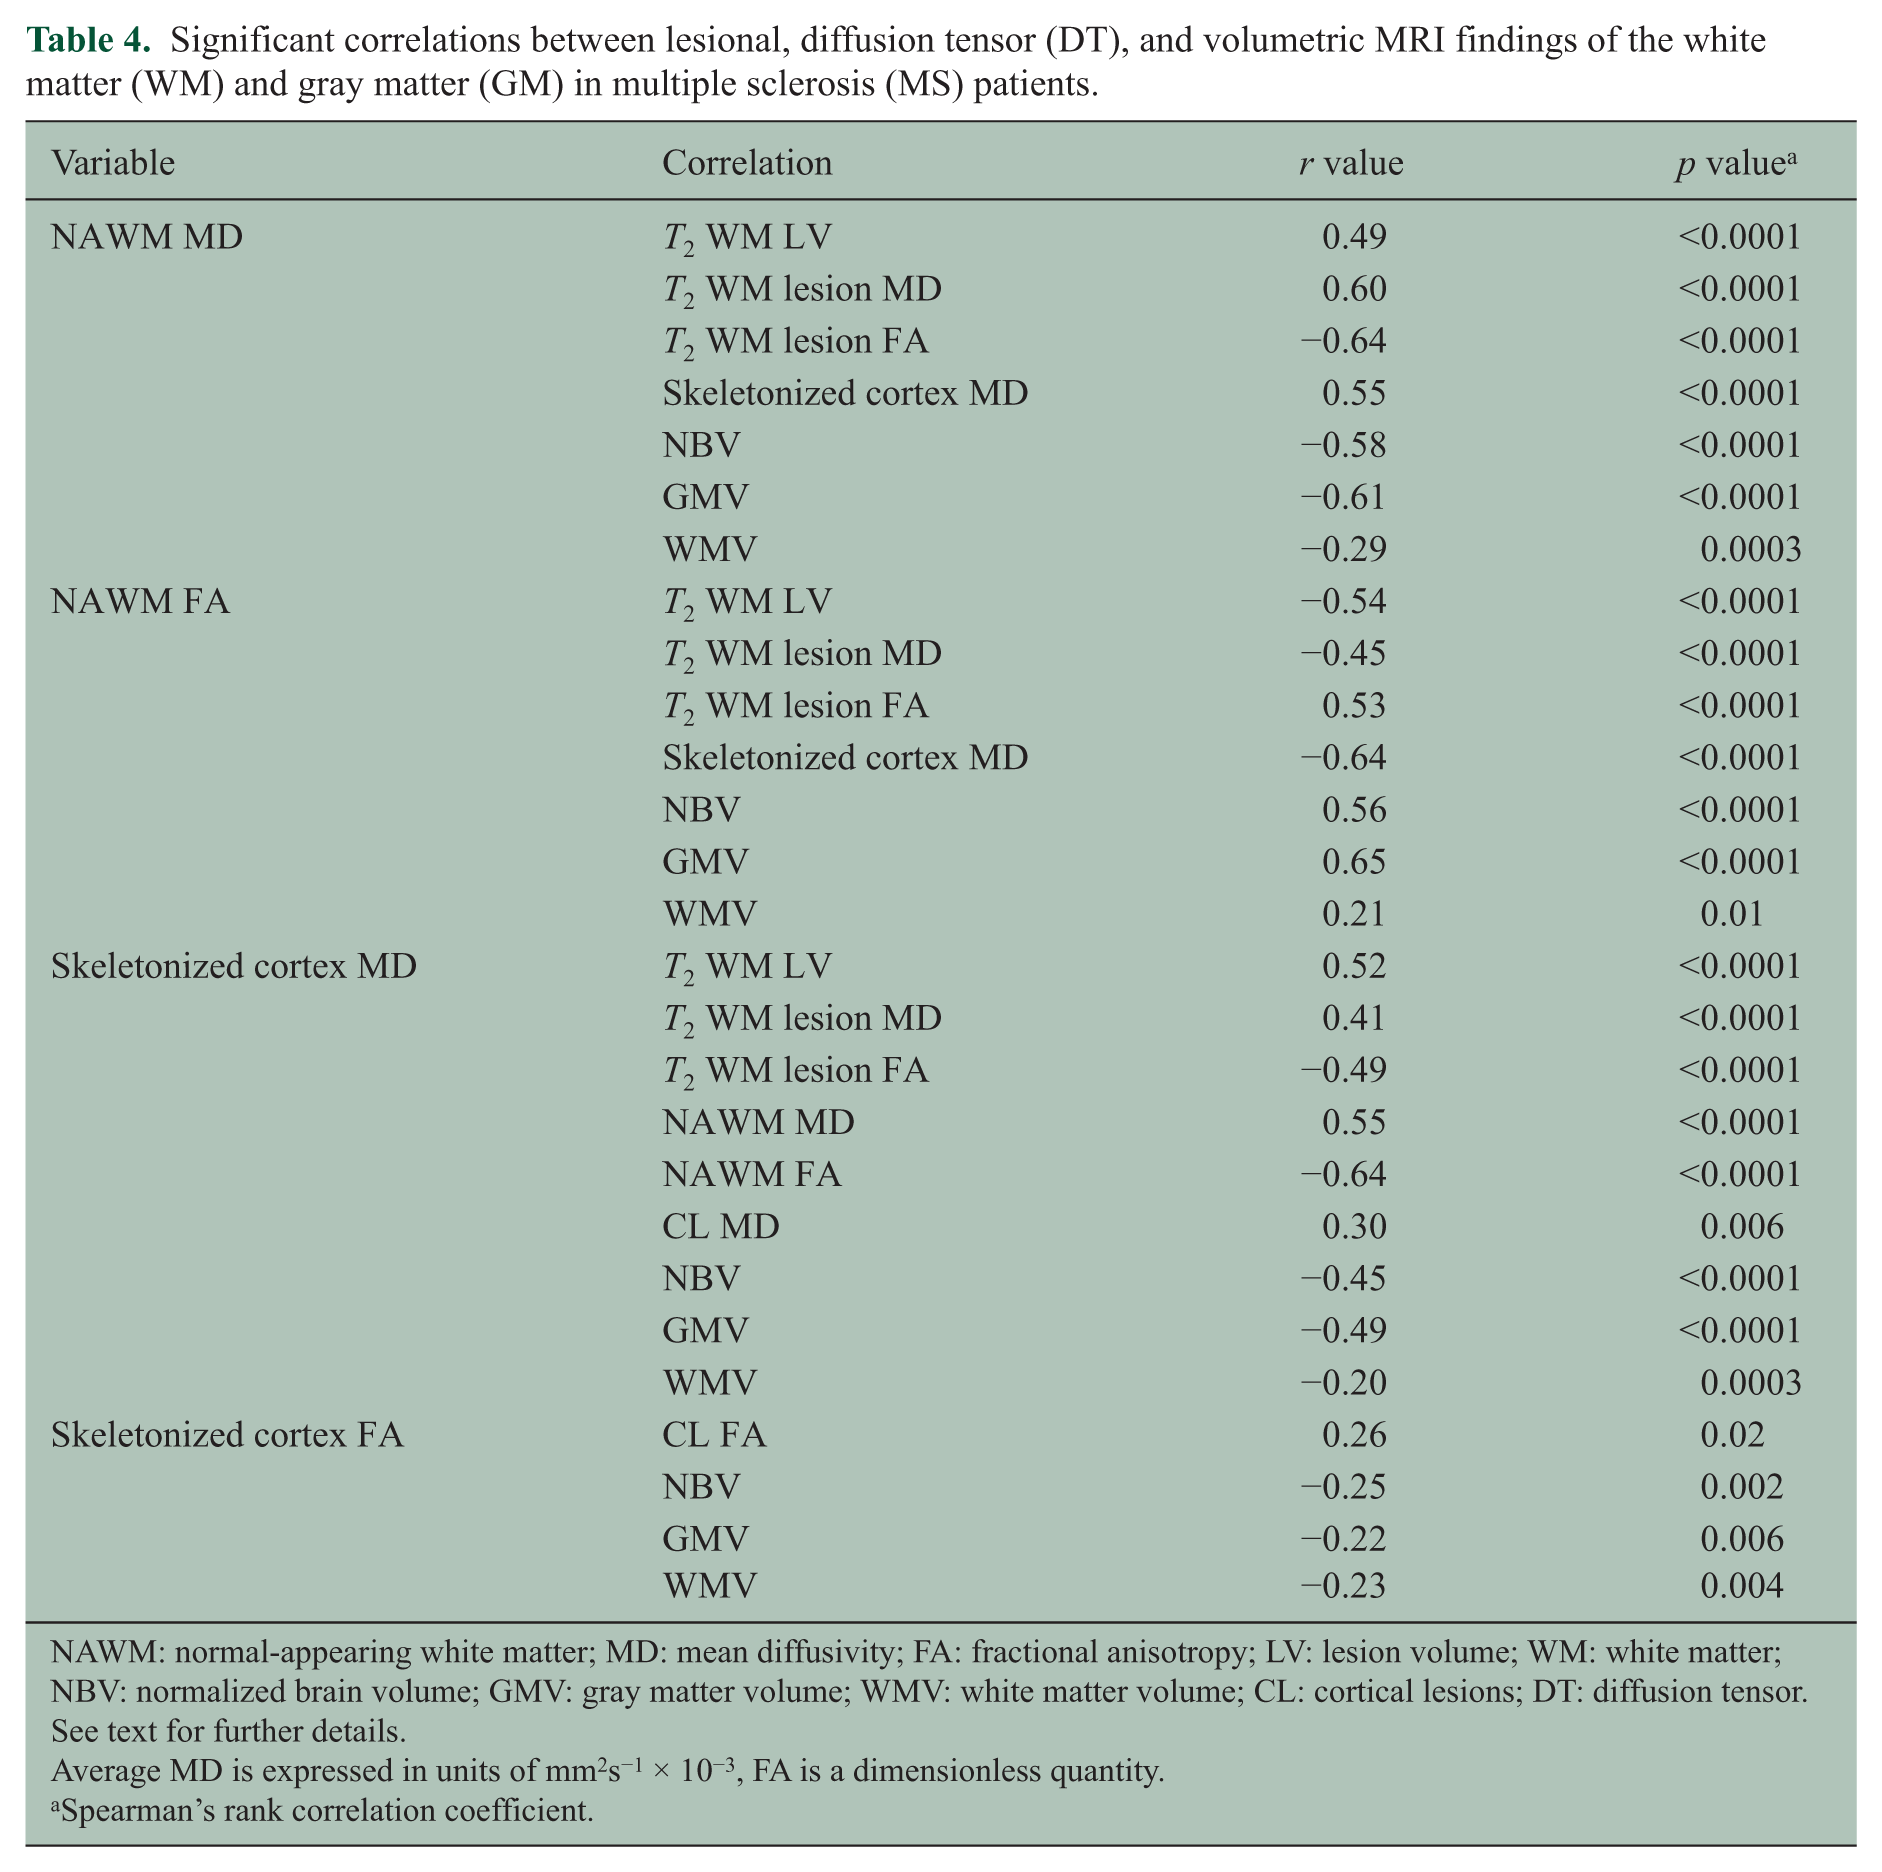
NAWM: normal-appearing white matter; MD: mean diffusivity; FA: fractional anisotropy; LV: lesion volume; WM: white matter; NBV: normalized brain volume; GMV: gray matter volume; WMV: white matter volume; CL: cortical lesions; DT: diffusion tensor. See text for further details.
Average MD is expressed in units of mm2s−1 × 10⁻³, FA is a dimensionless quantity.
Spearman’s rank correlation coefficient.
In MS patients, CII correlated with EDSS (r = 0.46; p < 0.0001), T2 WM LV (r = 0.39; p < 0.0001), T2 WM lesion MD (r = 0.36; p < 0.0001), T2 WM lesion FA (r = −0.26; p = 0.002), NAWM MD and FA (r = 0.36 and r = −0.43; p < 0.0001), skeletonized cortex MD (r = 0.32; p = 0.0001), NBV (r = −0.45; p < 0.0001), GMV (r = −0.53; p < 0.0001), and WMV (r = −0.18; p = 0.03).
RF analysis
Figure 2 summarizes the results of RF analysis performed to identify demographic, clinical, and MRI variables significantly associated with the presence of cognitive impairment. The 10 best MRI predictors of cognitive impairment were skeletonized cortex FA, age, DD, T2 WM LV, GMV, skeletonized cortex MD, EDSS, years of education, NAWM FA, and NBV (in this order of ranking).
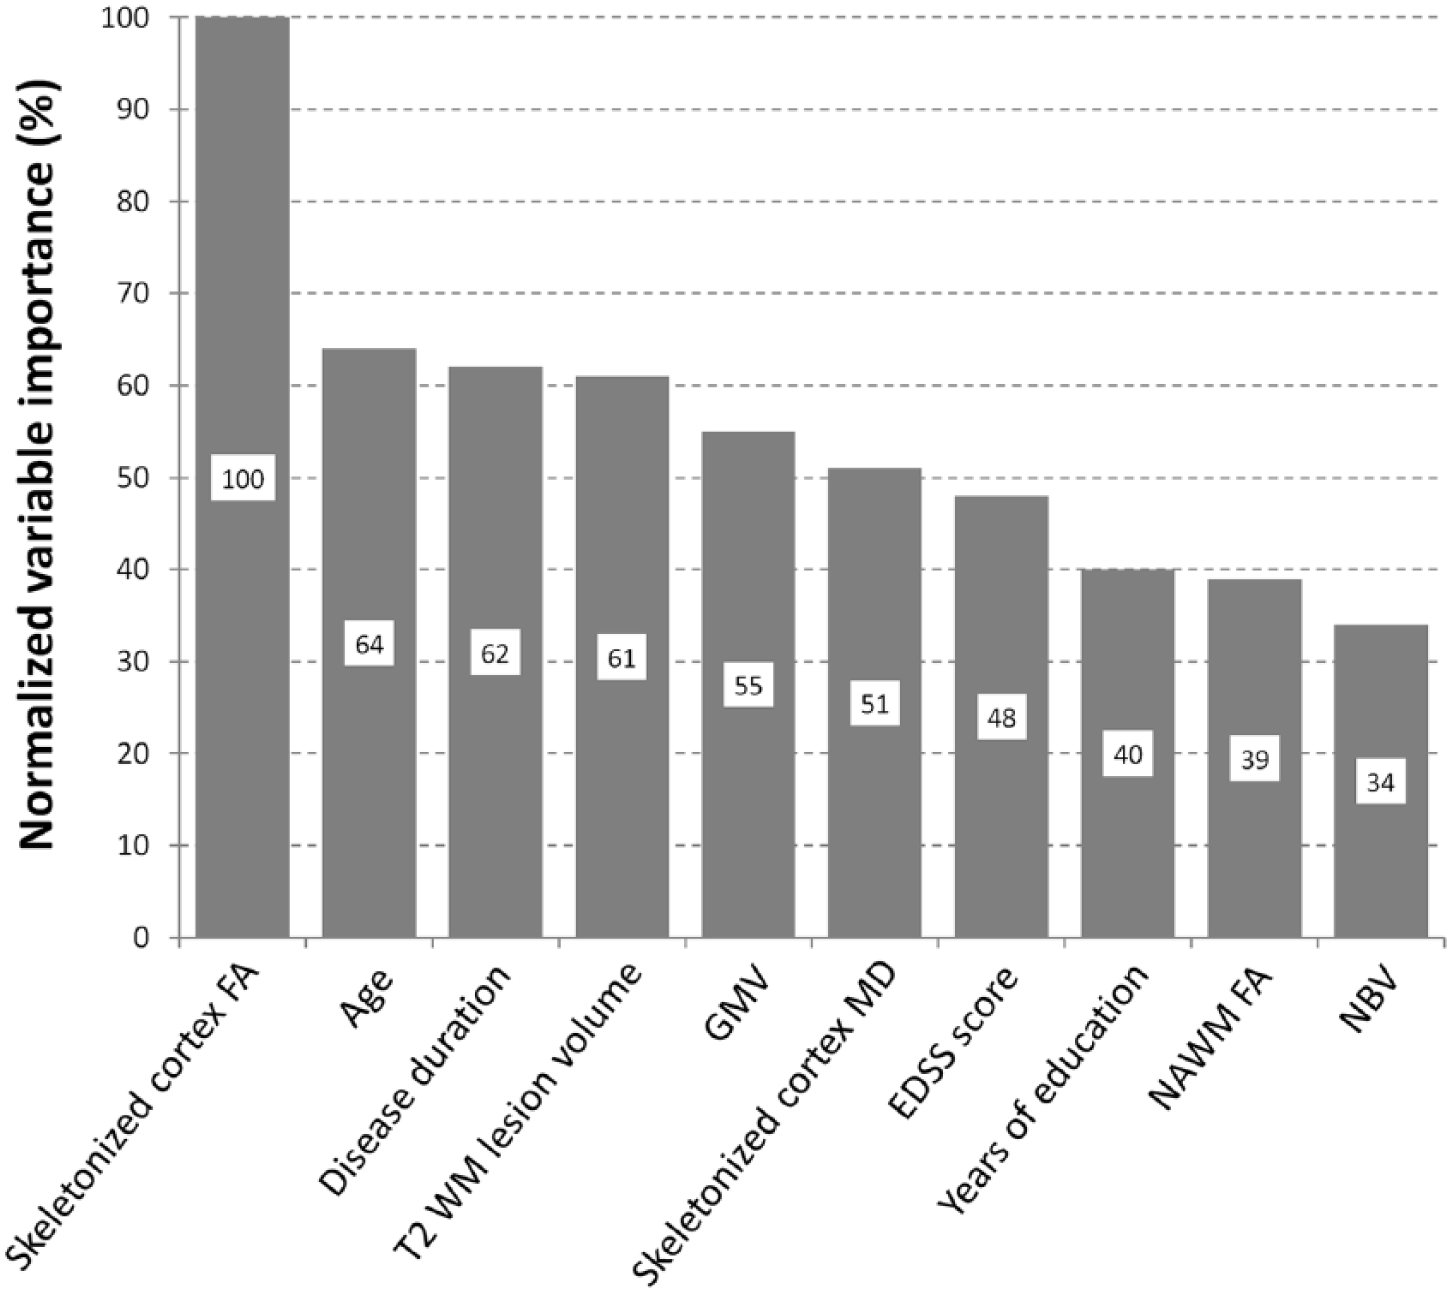
Results of the random forest analysis. Normalized variable importance of the 10 most important clinical, demographic, and MRI variables in predicting the presence of cognitive impairment. FA: fractional anisotropy; WM: white matter; EDSS: Expanded Disability Status Scale; MD: mean diffusivity; NBV: normalized brain volume; GMV: gray matter volume; NAWM: normal-appearing white matter.
These results were confirmed by a multivariate logistic regression analysis with a stepwise variable selection. Among the demographic, clinical, and MRI variables evaluated, only age (β = 0.06, p = 0.01), years of education (β = −0.21, p = 0.005), skeletonized cortex FA (β = −0.02, p = 0.02), and GMV (β = −0.05, p = 0.0001) were retained in the final model which provided a high classification ability (C-statistic = 0.88). When measures of cortical damage were removed from the model, a C-statistic = 0.82 was obtained.
Discussion
Reduced cortex FA and lower GMV combined with T2 WM LV and other MRI measures of skeletonized cortex and NAWM damage explained the presence of cognitive impairment in MS patients, while CL measures (number, volume, microstructural abnormalities) had no role.
The prominent contribution of CL for cognitive dysfunction in MS is currently a matter of debate. Indeed, while seminal studies showed a relationship between the number and volume of CLs detected with DIR sequences and the presence of cognitive deficits in MS,25,26 more recent investigation could not confirm these findings. 27 Several factors can contribute to explain these discrepancies, including differences in scanner field strengths (1.5 versus 3.0 T), geometry of DIR sequences (3D versus 2D), criteria for CL identification, characteristics of patients enrolled, and neuropsychological tests administered. Most importantly, none of the previous MS studies on cognition combined DT MRI and DIR data.
In line with previous studies,7–10 we found that compared to apparently normal cortex, MS CLs had increased FA, which could be explained by different factors, including (1) damage to and loss of pyramidal cells in CLs, consistent with the pathological demonstration of neurites’ transection, loss of cortical neuron, dendritic arborization, synapses, neurons, and glia occurring in CLs;28,29 (2) microglia activation, suggested by increased size of microglial perikarya, which have thicker processes and an orientation more perpendicular to the pial surface compared to normal brain; 29 and (3) increased cellular density, as suggested by a recent 7-T post-mortem MRI and histopathology study showing increased FA and higher cell density in CLs (identified by immunohistochemistry), with a few activated microglia. 30 Clearly, the previous conditions might occur at different phases of the disease, with microglia activation in relapsing patients with a more inflammatory profile and a few activated microglia in those with chronic and progressive MS. 30
Increased FA could also be due to the use of a model, appropriate for a single fiber population, to detect the deviation toward an emergent anisotropy in a complex architecture, as it is the case of cortical GM, even though a careful interpretation of diffusivity changes in a complex region as the cortex is necessary.
Consistently with previous literature, 11 except for CL measures, all MRI variables evaluated were significantly different between CI and CP MS patients and correlated with CII, a measure of global cognitive impairment. Most importantly, statistical models including measures of GM/WM damage, together with demographic and clinical measures, were able to explain the presence of cognitive impairment.
The relevance of diffuse GM damage, both in terms of microstructural abnormalities and atrophy, for MS-related cognitive dysfunction is supported by several studies which have assessed the severity of this tissue compartment involvement using different imaging techniques (atrophy, DT MRI, and magnetization transfer (MT) MRI). 11 These studies found a correlation with scores of global and specific cognitive impairment. In a 13-year longitudinal study, which combined several measures of lesion and diffuse structural damage to the NAWM and GM, baseline diffuse GM damage was the only MRI measure associated with long-term cognitive worsening. 9 Similar to our findings, a recent study that used MT and phase-sensitive inversion recovery sequences found that quantitative abnormalities in extra-lesional compared to lesional cortical GM were more consistently associated with disability. 10
Not only GM damage but also WM lesions and NAWM damage contributed to cognitive dysfunction in our MS cohort. The role of focal WM lesions for cognitive impairment in MS is supported by several correlative studies. Investigations which have integrated DT MRI with focal lesion detection have elucidated the importance of a disconnection mechanism, due to lesions located in “strategic” WM tracts, to the pathogenesis of MS cognitive manifestations.24,31,32 Even if a causal relation cannot be defined, the correlation we found between T2 lesion and NAWM measures supports such a disconnection hypothesis, underlying the relevance of network analysis to evaluate MS-related cognitive impairment.
Our correlation analysis between measures of WM and GM damage showed that decreased skeletonized cortex FA was not linked to any WM damage measure, but to CL FA and atrophy measures, suggesting that primary diffuse involvement of the cortex itself might have a prominent role in the pathogenesis of cognitive deficits.
Currently, only a few studies have integrated measures of T2 lesions, NAWM, and GM damage to rank the contribution of each of these factors to cognitive deficits in MS.27,33,34 Studies which have used atrophy as a measure of GM damage27,33 suggested that atrophy could be less relevant for cognition than “strategic” damage to WM tracts, quantified using DT MRI. However, atrophy and microstructural DT MRI abnormalities reflect different phenomena not only pathologically but also temporarily because atrophy is usually considered as an end-stage process in disease pathophysiology. The only study that assessed DT MRI measures of GM and WM damage 34 did not separate the contribution of CLs to GM abnormalities and performed an analysis of correlation without differentiating CP and CI patients.
Our work is not without limitations. First, the scans were acquired with pixel sizes optimized for each sequence; therefore, the images were resampled to diffusion image resolution. Thus, some small lesions might have been lost after such a resampling procedure, and the shape of others is likely to be at least slightly modified. Second, although DIR sequences have significantly improved CL detection, they allow detecting only a small portion of the CL amount, typically those of types I and II, located in the deeper cortical layers, close to WM, and not type III/IV lesions. 35 Finally, a longitudinal study combining these techniques would allow defining the trajectories of evolution of WM and GM damage and their reciprocal interactions.
Footnotes
Declaration of Conflicting Interests
The author(s) declared the following potential conflicts of interest with respect to the research, authorship, and/or publication of this article: Dr Preziosa received speakers honoraria from Biogen Idec, Novartis, and ExceMED.
Drs Pagani, Morelli, Copetti, Pirro, and Prof. Falini declare that there is no conflict of interest. Dr Martinelli has received personal compensation for activities with Biogen Dompe, Merck Serono, Bayer Schering, Teva, and Sanofi Aventis as a speaker. Prof. Comi has received consulting fees for participating on advisory boards from Novartis, Teva Pharmaceutical Ind. Ltd, Sanofi, Genzyme, Merck Serono, Bayer, Actelion and honorarium for speaking activities for Novartis, Teva Pharmaceutical Ind. Ltd, Sanofi, Genzyme, Merck Serono, Bayer, Biogen, Excemed. Prof. Filippi is Editor-in-Chief of the Journal of Neurology; serves on scientific advisory boards for Teva Pharmaceutical Industries; has received compensation for consulting services and/or speaking activities from Biogen Idec, Excemed, Novartis, and Teva Pharmaceutical Industries; and receives research support from Biogen Idec, Teva Pharmaceutical Industries, Novartis, Italian Ministry of Health, Fondazione Italiana Sclerosi Multipla, Cure PSP, Alzheimer’s Drug Discovery Foundation (ADDF), the Jacques and Gloria Gossweiler Foundation (Switzerland), and ARiSLA (Fondazione Italiana di Ricerca per la SLA). Dr Rocca received speakers honoraria from Biogen Idec, Novartis, and ExceMed and receives research support from the Italian Ministry of Health and Fondazione Italiana Sclerosi Multipla.
Funding
The author(s) disclosed receipt of the following financial support for the research, authorship, and/or publication of this article: The study was partially supported by a grant from Fondazione Italiana Sclerosi Multipla (grant no FISM2008/R/13).
References
Supplementary Material
Please find the following supplemental material available below.
For Open Access articles published under a Creative Commons License, all supplemental material carries the same license as the article it is associated with.
For non-Open Access articles published, all supplemental material carries a non-exclusive license, and permission requests for re-use of supplemental material or any part of supplemental material shall be sent directly to the copyright owner as specified in the copyright notice associated with the article.