
Abstract
Background:
In relapse-onset multiple sclerosis (MS), tissue abnormality – as assessed with magnetisation transfer ratio (MTR) imaging – is greater in the outer cortical and inner periventricular layers. The cause of this remains unknown but meningeal inflammation has been implicated, particularly lymphoid follicles, which are seen in secondary progressive (SP) but not primary progressive (PP) MS. Cortical and periventricular MTR gradients might, therefore, differ in PPMS and SPMS if these follicles are responsible.
Objective:
We assessed cortical and periventricular MTR gradients in PPMS, and compared gradients between people with PPMS and SPMS.
Methods:
Using an optimised processing pipeline, periventricular normal-appearing white matter and cortical grey-matter MTR gradients were compared between 51 healthy controls and 63 people with progressive MS (28 PPMS, 35 SPMS).
Results:
The periventricular gradient was significantly shallower in healthy controls (0.122 percentage units (pu)/band) compared to PPMS (0.952 pu/band, p < 0.0001) and SPMS (1.360 pu/band, p < 0.0001). The cortical gradient was also significantly shallower in healthy controls (−2.860 pu/band) compared to PPMS (−3.214 pu/band, p = 0.038) and SPMS (−3.328 pu/band, p = 0.016).
Conclusion:
Abnormal periventricular and cortical MTR gradients occur in both PPMS and SPMS, suggesting comparable underlying pathological processes.
Keywords
Introduction
There is ongoing debate as to whether or not primary progressive (PP) and secondary progressive (SP) multiple sclerosis (MS) are essentially the same disease, barring the preceding relapsing-remitting (RR) phase: the age at onset and rate of progression are similar 1 and lesion morphology in relapse-onset and PPMS is identical, 2 but differences have been observed in both magnetic resonance imaging (MRI) and histopathological studies.3,4 Post-mortem studies have recently revealed meningeal inflammation in all types of MS,5–7 although the most structured form – lymphoid follicle-like aggregates – have only been observed in SPMS, not in PPMS. 6 The presence of these follicles – noted in about 40% of people with SPMS – is associated with more rapid clinical progression, and histopathologically with subpial demyelination and a gradient of cortical axonal loss. 8 This raises seemingly conflicting possibilities that either lymphoid follicles are themselves not relevant to progression, or that the mechanisms leading to progression differ significantly between PPMS and SPMS.
Consistent with these histopathological findings, tissue abnormality, as assessed by magnetisation transfer ratio (MTR) in vivo, increases towards the cortical surfaces in all clinical stages of relapse-onset MS. 9 We have recently shown similar gradients in MTR abnormality around the ventricles in relapse-onset MS. 10 Both cortical and periventricular gradients are evident soon after a clinically isolated syndrome11,12 and are more marked in SPMS compared to RRMS.9,10 The processes underlying abnormal cortical and periventricular MTR gradients remain unknown, but one possibility is that they are both linked with meningeal inflammation, perhaps through a cerebrospinal fluid (CSF)-mediated factor. 8 We previously reported the absence of a statistically significant cortical MTR gradient in PPMS 9 but did not investigate periventricular gradients. If a common factor links cortical and periventricular MTR gradients, we would expect the latter to also be absent in PPMS.
Using our recently optimised pipeline for MTR gradient analysis 13 we aimed to (1) confirm the absence of a gradient of cortical MTR abnormality in PPMS; (2) determine if an abnormal periventricular MTR gradient is seen in PPMS; (3) compare gradients and their evolution between people with PPMS and SPMS and (4) explore correlations with disability. As the processing pipeline has been optimised since previous publications,9,10 we also reprocessed data from people with RRMS and present them as an online supplement (Supplementary Tables 1 and 2).
Materials and methods
Subjects
From an observational cohort 9 we analysed data from healthy controls and people with PPMS, SPMS or RRMS (as defined by the Lublin–Reingold criteria 14 ) that had undergone MRI scanning with a protocol including the acquisition of volumetric T1-weighted images and MTR data. Some had repeat imaging performed 1–4 years later. All people in the MS groups additionally required an Expanded Disability Status Scale (EDSS 15 ) score at baseline. The study was approved by our local institutional ethics committee and written informed consent was provided by each participant.
MRI
Imaging was performed on a 3-T Philips Achieva system (Philips Healthcare, Best, The Netherlands), and included (1) dual-echo proton density/T2-weighted scans (1 × 1 × 3 mm3, TR = 3500 ms, TE = 19/85 ms) for lesion identification; (2) T1-weighted scans (3D inversion-prepared (T1 = 824 ms) fast field echo sequence) (TR/TE = 6.9/3.1 ms, flip angle = 8°) for volumetric measures and segmentation; and (3) MTR data using a 3D-slab-selective fast field echo sequence with two echoes (TR = 6.4 ms, TE1/TE2 = 2.7/4.3 ms, flip angle = 9° with and without sinc-Gaussian-shaped MT pulses of nominal flip angle 360°, offset frequency 1 kHz, duration 16 ms). All images were acquired sagittally with a field of view of 256 × 256 × 180 mm3 across the whole brain.
Image analysis
White matter (WM) lesions were outlined on PD/T2-weighted images using the semi-automated tool 3D-slicer 16 and checked by another author. The resultant lesion masks were affine co-registered to the T1-weighted images via pseudo-T1 images (as previously described 17 ) and transformed to T1-space using nearest-neighbour interpolation to enable lesion-filling of the T1-weighted images. 18 The MTon and MToff images were then registered to the T1-weighted volume using NiftyReg, 19 and MTR maps (in percentage units (pu)) were calculated as follows: (((MToff − MTon)/MToff) × 100). T1-weighted volumes were segmented into WM, grey matter (GM) and CSF using the geodesic information flows 20 algorithm. Lesions (plus a 2-mm perilesional rim 21 ) were subtracted from each participant’s WM mask, generating a normal-appearing (NA) WM mask. The NAWM and cortical GM (CGM) volumes were used as covariates in the periventricular and cortical models, respectively. Brain parenchymal fraction (BPF) was used as an alternative covariate in both periventricular and cortical gradient models in a sensitivity analysis to mirror a previous paper. 13 It was calculated as follows: (GM volume + WM volume)/(GM volume + WM volume + CSF volume).
The NAWM mask was intersected with the MTR map, and segmented into 10 concentric bands using the normalised distance map derived from the normal to the Laplace equation isolines. 13 This approach generates bands of varying thickness, but accounts for the differences in brain thickness within different brain regions plus the effects of atrophy: the relative position of a given band to the surface of the brain should, therefore, be maintained. Consistent with previous work using 3D MTR data, the innermost (periventricular) and outermost (pericortical) bands were excluded to mitigate partial volume effects. 10 From the remaining eight bands the periventricular NAWM gradient was calculated as follows: ((mean NAWM MTR band 3 – mean NAWM MTR band 1)/2). Consistent with previous work, the CGM was also segmented into two bands using the Laplace method 9 but rather than using the absolute outer-band MTR value 9 (which will be subject to inter-individual variations in whole brain MTR 22 ), the cortical gradient was instead calculated as ((mean CGM MTR band 2 (outer) – mean CGM MTR band 1 (inner))/2). An alternative method for calculating the cortical gradient – applying the CGM mask to a 12-band segmentation, removing the outermost band, then calculating the cortical gradient over the three outermost bands – requires a lower probabilistic segmentation threshold 13 to achieve similarly sized bands thus increasing the chances of partial volume with adjacent WM and CSF, affecting results, and it also does not account for cortical folding as well as the present method. The mean NAWM and CGM MTR were also calculated in each participant for use as covariates in sensitivity analyses. Finally, to explore whether differences between current and previous 9 results reflected the greater number of people studied, we restricted the groups to the 19 people with PPMS and 35 healthy controls previously examined 9 and repeated the analyses.
Statistics
MTR gradient values are presented as mean ± standard error, and all longitudinal differences were annualised to circumvent variable interscan intervals. We used general linear models to compare baseline gradients between groups and mixed-effects linear models to compare the rate of gradient change between disease subtypes. Consistent with previous work these models were adjusted for age and sex. In addition, these models were also adjusted for either NAWM volume (periventricular gradient models) or cortical volume (cortical gradient models), and then repeated adjusting for BPF for comparison to previous work. 13 To examine whether differences in gradients might be driven by more diffuse MTR changes we performed sensitivity analyses, additionally adjusting all periventricular gradient models for mean NAWM MTR, and all cortical gradient models for mean CGM MTR.
Finally, we ran univariate general linear models comparing (1) baseline periventricular gradients with baseline cortical gradients; and (2) baseline gradients with baseline disease duration, EDSS score and time from the last relapse. All analyses were performed in R (v3.3.1). Results were considered statistically significant at the p < 0.05 level.
Results
Imaging was performed in 51 healthy controls (12 with follow-up imaging after median 2.1 (range 1.5–2.7) years), 28 people with PPMS (14 with follow-up imaging after median 2.3 (range 1.2–3.5) years) and 35 people with SPMS (15 with follow-up imaging after median 1.6 (range 1.1–2.4) years). The control group were younger than either progressive group (Table 1), and the SPMS group had a greater proportion of females than the PPMS and control groups (all models were adjusted for age, gender and either NAWM volume or CGM volume).
Participant baseline demographics.
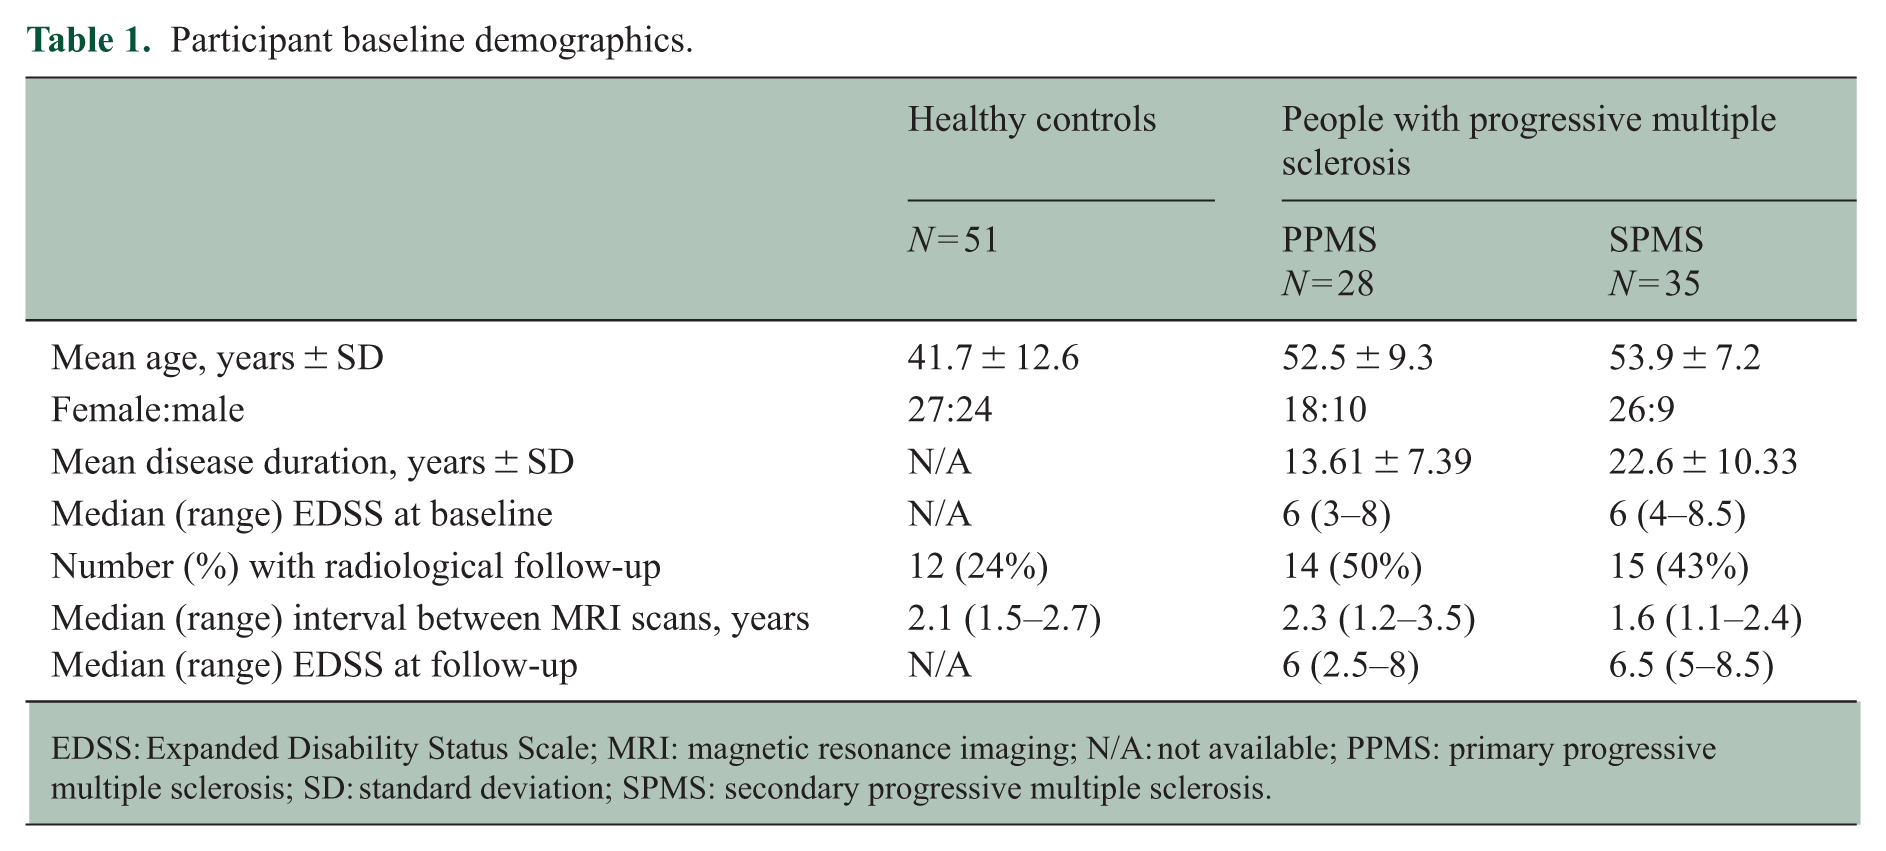
EDSS: Expanded Disability Status Scale; MRI: magnetic resonance imaging; N/A: not available; PPMS: primary progressive multiple sclerosis; SD: standard deviation; SPMS: secondary progressive multiple sclerosis.
The MTR in each band was greater (less abnormal) in healthy controls compared to those with PPMS and SPMS (Figure 1). The NAWM periventricular gradient was significantly shallower (less abnormal) in healthy controls (0.122 ± 0.038 pu/band) compared to those with both PPMS (0.952 ± 0.185 pu/band, p < 0.0001) and SPMS (1.360 ± 0.143 pu/band, p < 0.0001; Table 2, Figure 2a). These differences persisted when the models were additionally adjusted for mean NAWM MTR (p = 0.015 and p < 0.0001, respectively) and when the models were adjusted for BPF instead of NAWM volume (p < 0.001 and p = 0.003, respectively). No significant differences in periventricular gradient were found between people with PPMS and SPMS (p = 0.444), including after adjustment for mean NAWM MTR (p = 0.191) or when covarying for BPF instead of NAWM volume (p = 0.604). The cortical gradient was significantly shallower (less abnormal) in healthy controls (−2.860 ± 0.051 pu/band) compared with both PPMS (−3.214 ± 0.103 pu/band, p = 0.038) and SPMS (−3.328 ± 0.101 pu/band, p = 0.016; Figure 2b). These differences lost significance when the models were additionally adjusted for mean CGM MTR (p = 0.570 and p = 0.589, respectively), and when the models covaried for BPF instead of cortical volume (p = 0.575 and p = 0.530, respectively). When the MS and healthy control groups were limited to those analysed previously 9 the results were consistent with those previously seen: a significant difference was seen between healthy controls and SPMS (p = 0.030) but not PPMS (p = 0.150). No significant differences in cortical gradient were found between people with PPMS and SPMS (p = 0.372), including after adjustment for mean cortical MTR (p = 0.915).
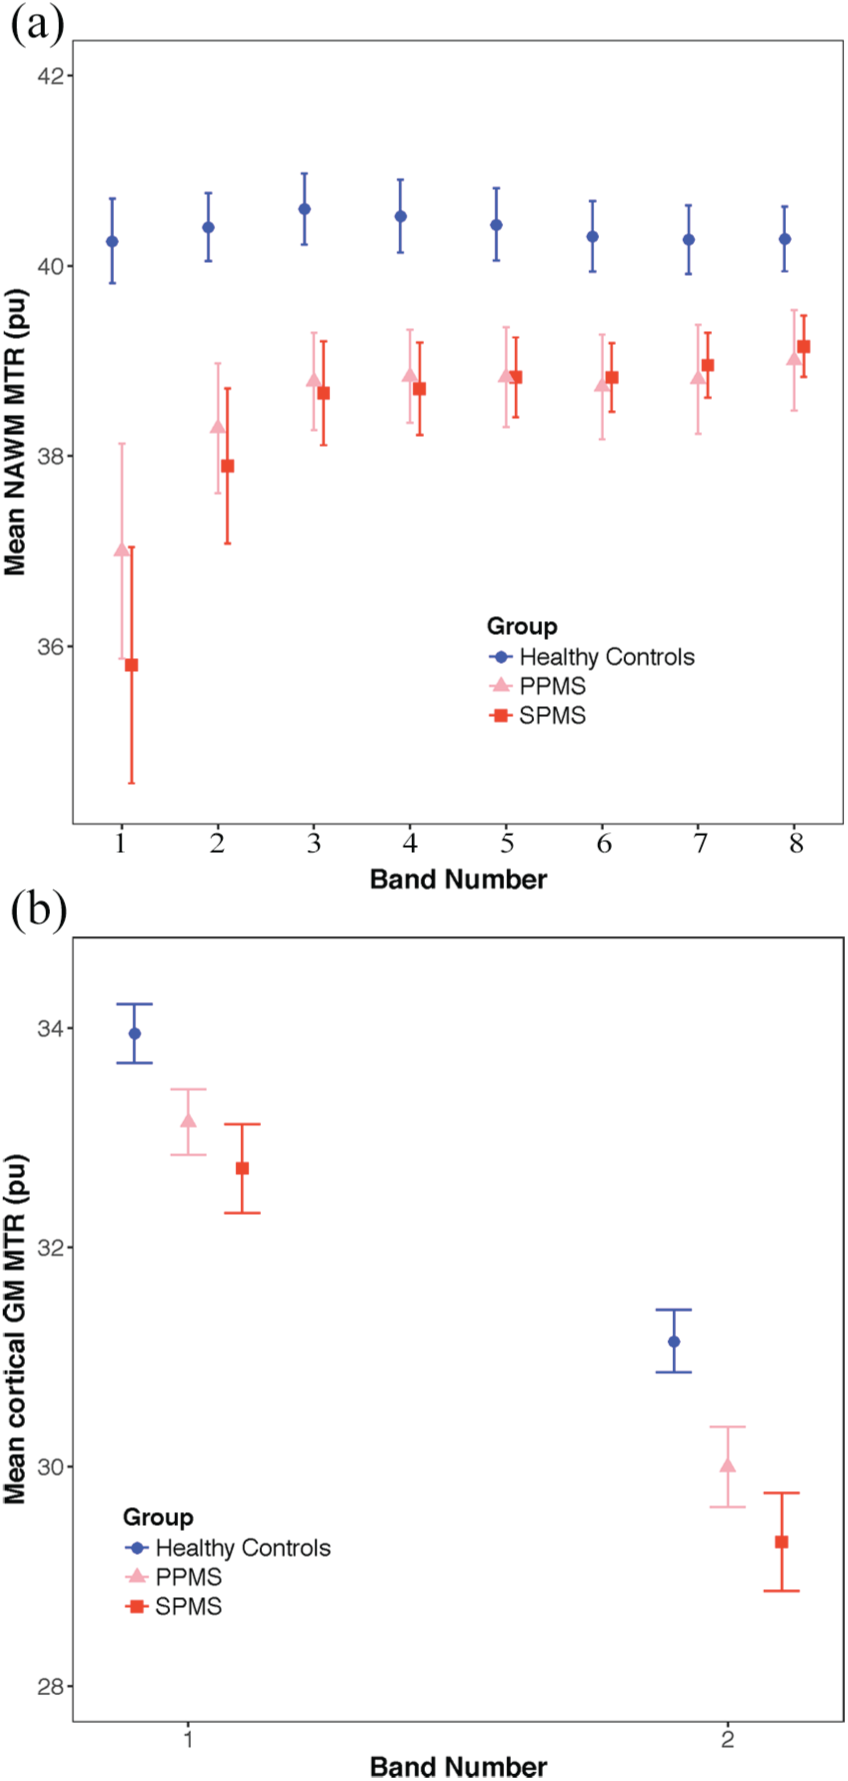
Mean MTR per band for healthy controls (circles), people with primary progressive multiple sclerosis (PPMS (triangles) and people with secondary progressive multiple sclerosis (SPMS) (squares) in (a) normal-appearing white matter (NAWM) and (b) cortical grey matter (GM). Error bars = 2 standard errors. MTR expressed in percentage units (pu). In NAWM, band 1 is closest to the ventricular surface. In cortical GM, band 2 is closest to the subpial surface. Periventricular gradients measured in NAWM over bands 1–3, and cortical gradients measured in cortical GM over bands 1–2.
Imaging outcomes at baseline and annualised change during follow-up.
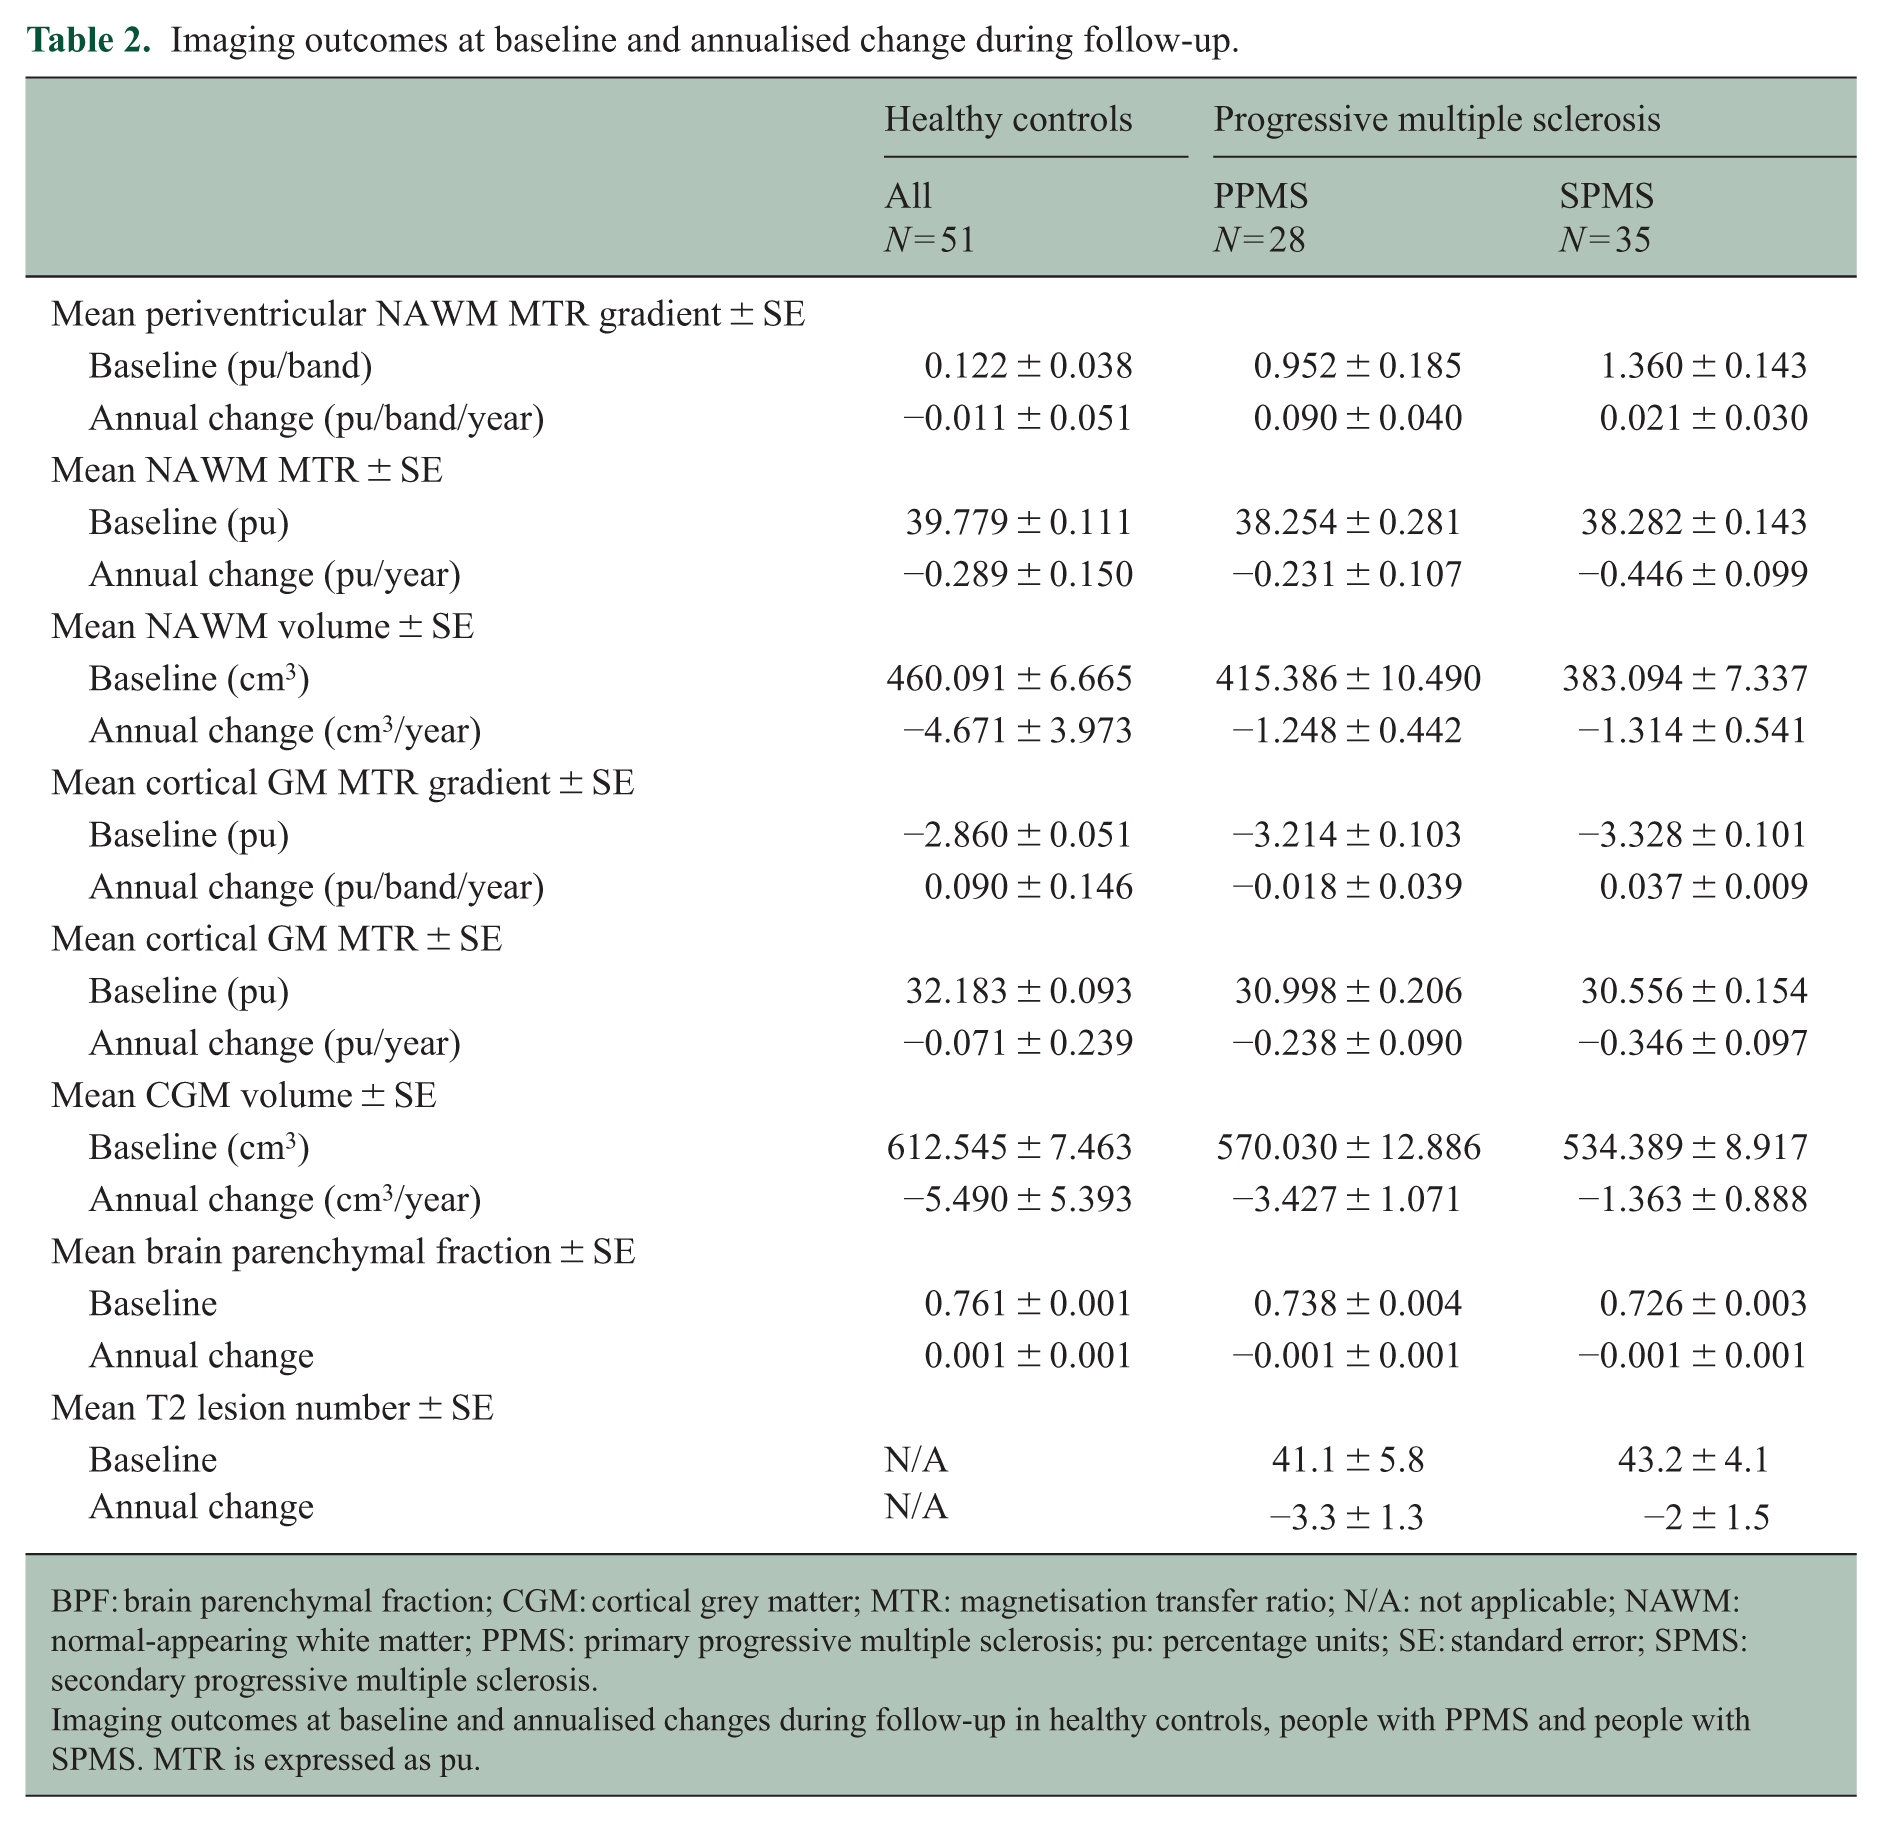
BPF: brain parenchymal fraction; CGM: cortical grey matter; MTR: magnetisation transfer ratio; N/A: not applicable; NAWM: normal-appearing white matter; PPMS: primary progressive multiple sclerosis; pu: percentage units; SE: standard error; SPMS: secondary progressive multiple sclerosis.
Imaging outcomes at baseline and annualised changes during follow-up in healthy controls, people with PPMS and people with SPMS. MTR is expressed as pu.
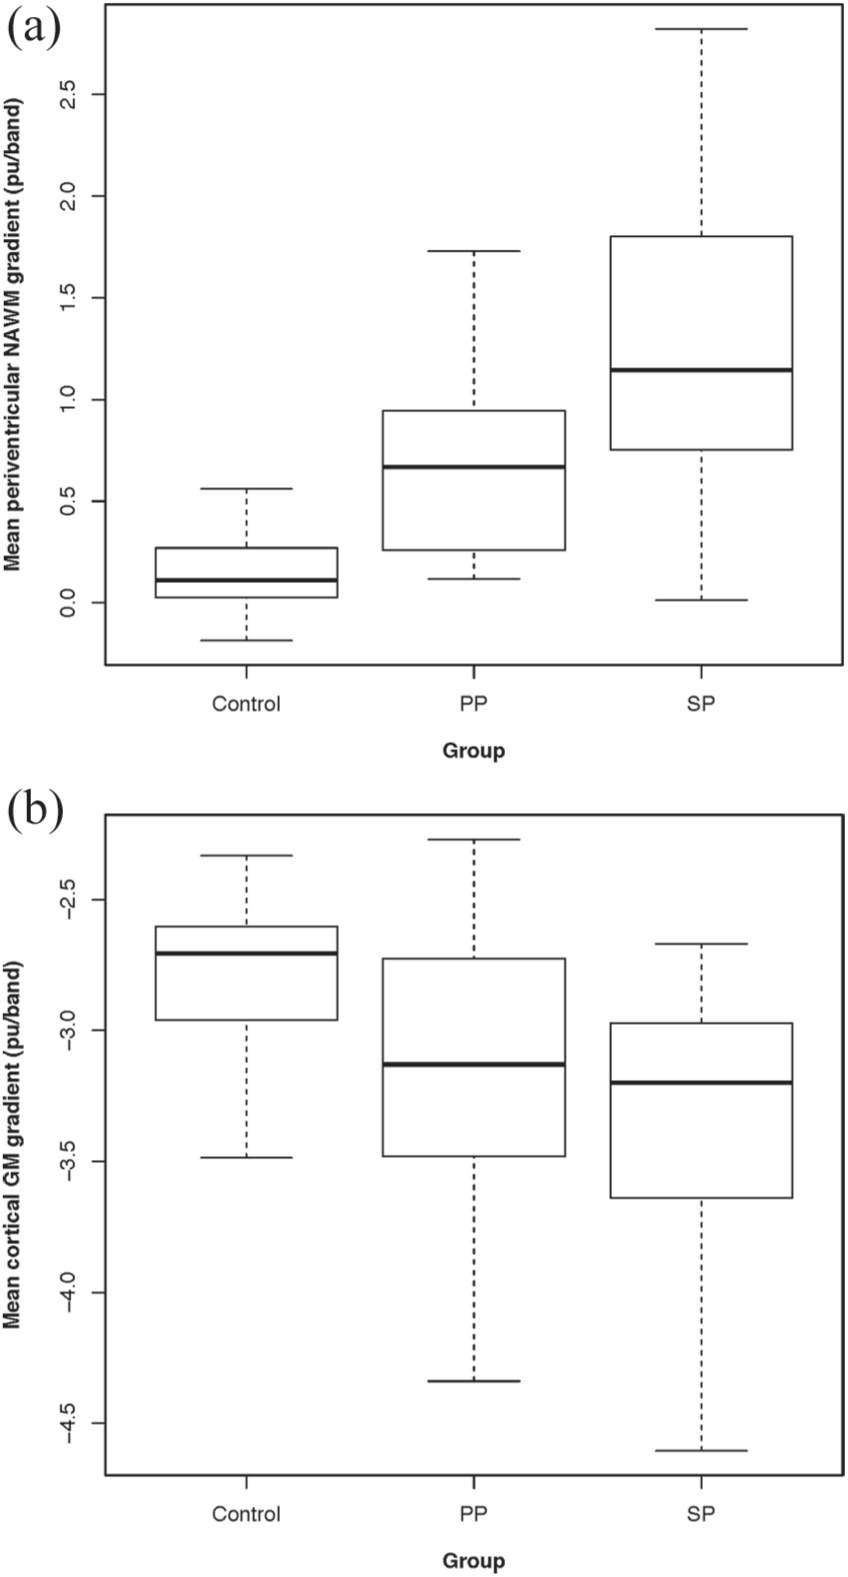
Mean periventricular gradient in normal-appearing white matter (NAWM) (a), and cortical gradient in cortical grey matter (GM) (b) in healthy controls, people with primary progressive multiple sclerosis (PPMS) and secondary progressive multiple sclerosis (SPMS). Error bars = 2 standard errors. MTR gradients expressed in percentage units per band (pu/band).
The baseline demographics and imaging outcomes (including model results) for people with RRMS are presented in Supplementary Tables 1 and 2, respectively.
When all people with MS were grouped (RRMS, SPMS, PPMS), the baseline periventricular gradient was associated with baseline EDSS score (β = 0.100, p = 0.011) and disease duration (β = 0.023, p = 0.005) but not time from last relapse (β = 0.021, p = 0.357). These associations did not materially change when additionally adjusted for clinical classification (Table 3). The baseline cortical gradient was associated with baseline EDSS score (β = –0.082, p = 0.001) and disease duration (β = –0.015, p = 0.004) but not time from last relapse (β = –0.011, p = 0.554). These associations did not materially change when additionally adjusted for clinical classification. Results for each disease subgroup are shown in Table 3. A significant association was found between the periventricular gradient and cortical gradient (β = –0.609, p < 0.0001), which remained unchanged after additionally adjusting for disease group (Table 3).
Model results comparing gradients with (1) other gradients and (2) clinical associations.
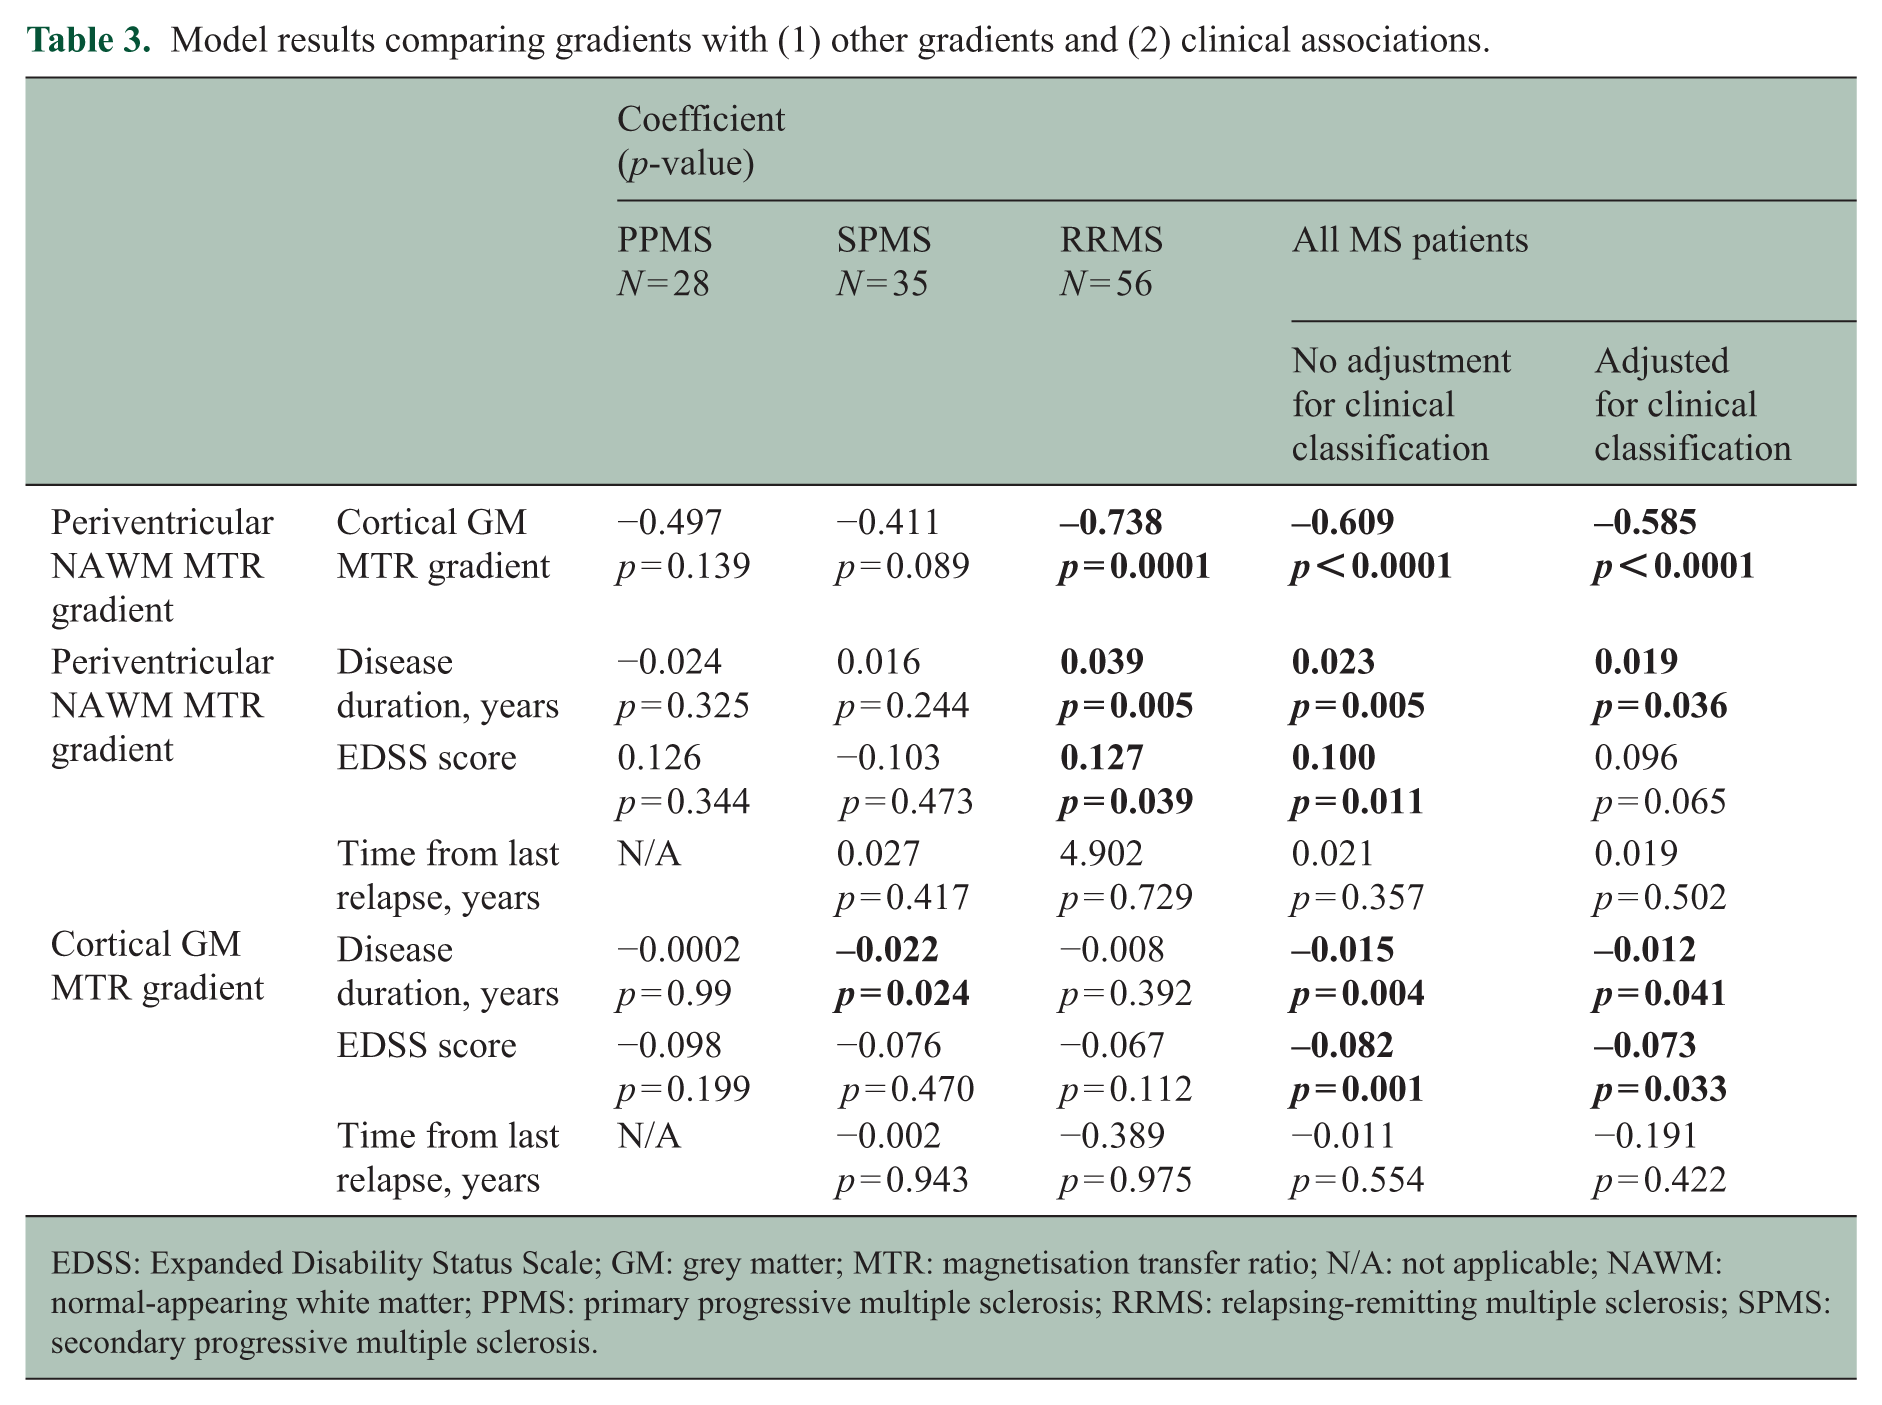
EDSS: Expanded Disability Status Scale; GM: grey matter; MTR: magnetisation transfer ratio; N/A: not applicable; NAWM: normal-appearing white matter; PPMS: primary progressive multiple sclerosis; RRMS: relapsing-remitting multiple sclerosis; SPMS: secondary progressive multiple sclerosis.
In those with radiological follow-up (Tables 1 and 2), the annualised change in periventricular gradient was not significantly different between healthy controls (–0.011 ± 0.051 pu/band/year) and people with either PPMS (0.090 ± 0.040 pu/band/year, p = 0.951) or SPMS (0.021 ± 0.030 pu/band/year, p = 0.473). Including change in mean NAWM MTR in the model did not materially alter the results (p = 0.882 and p = 0.343, respectively). Similarly, no change in the annualised rate of change in cortical gradient was seen between healthy controls (0.090 ± 0.146 pu/band/year) and people with either PPMS (–0.018 ± 0.039 pu/band/year, p = 0.553) or SPMS (0.037 ± 0.009 pu/band/year, p = 0.913). Including change in mean cortical GM MTR in the model did not materially alter the results (p = 0.964 and p = 0.350, respectively).
Discussion
We identified both periventricular and cortical MTR gradients in PPMS and replicated our previous findings of cortical and periventricular gradients in SPMS.9,10 The cortical and periventricular gradients did not differ significantly between the PPMS and SPMS groups. In the few subjects with longitudinal imaging, when compared with healthy controls, no significant changes in these gradients were observed over a median period of 2 years. When all people with MS were combined, significant associations were seen between periventricular and cortical gradient severity, and both gradients increased with increasing disability and disease duration.
The present results suggest that the processes underlying cortical and periventricular MTR gradients may be similar in PPMS and SPMS. The finding of a cortical gradient in PPMS in the present study but not our previous work 9 appears to reflect the larger cohort (28 vs 19 with PPMS; 51 vs 35 healthy controls). However, while the optimised processing pipeline better accounts for cortical folding, its ability to distinguish cortical gradients from whole cortical MTR effects is severely limited because cortical gradients are calculated from the only two cortical bands of MTR, which may explain why all cortical models lost significance when additionally covaried for mean CGM MTR.
The pathological substrate and pathogenic processes underlying these MTR gradients remain unknown, but MTR reductions are correlated with demyelination in the cortex and WM23–25 and additionally axonal loss in WM. 25 In the cortex, demyelination and neuronal loss appear more extensive in the outer (subpial) layers, so both might, therefore, contribute to a gradient in cortical MTR abnormality.5,6,8,26 Both have also been linked with meningeal inflammation, particularly follicle-like lymphoid aggregates. The present findings suggest these follicles – reported in about 40% of people with SPMS but not in PPMS 6 – are not necessary for a gradient in cortical MTR abnormality to occur. However, the absence of follicles in PPMS at post-mortem may reflect the relatively small number examined 6 (n = 7) and larger histopathological studies are warranted to confirm this. To the best of our knowledge no histopathological study has examined periventricular gradients, so it remains to be determined if the underlying substrates are similar to those in the cortex. However, the present results would be consistent with a common pathological process underlying them both.27,28
The presence of a significant association between cortical and periventricular gradients in the RRMS group (n = 56) but not the PPMS (n = 28) or SPMS (n = 35) groups may also reflect the smaller sample sizes, particularly given the significant association seen at the whole-group level when additionally covarying for clinical classification. The apparent absence of a change in gradients over time should also be interpreted with caution, given that only a small subset of the cohorts had serial MTR studies (12/51 healthy controls, 14/28 with PPMS and 15/35 with SPMS), and follow-up was limited to 1.6–2.3 years (Table 1). This and previous cross-sectional works have shown a steeper periventricular gradient in SPMS compared with RRMS, 10 and we found significant associations between disease duration and gradient severity (Table 3), collectively suggesting that gradients do worsen over time. Associations of cortical and periventricular MTR gradients with disability, as measured by EDSS scores, were also modest. Only in SPMS did cortical MTR gradients correlate with EDSS scores, though the significant correlations at the whole-group level – even when covarying for clinical classification – may suggest that the lack of association in the RRMS and PPMS groups reflects the smaller numbers. Furthermore, spinal cord pathology was not assessed, which may be of greater clinical relevance in PP than SPMS, 29 and EDSS scores exceeding 3.5 essentially reflect impaired mobility and do not capture cognitive or memory impairments, 30 both of which may be associated with cortical pathology. 31 Further work using larger cohorts and spinal cord examination is needed to explore these issues.
Conclusion
As with SPMS, periventricular and cortical gradients are present in PPMS, and do not appear to differ substantially between these subtypes of progressive MS. Histopathological examination of the substrates underlying these gradients may provide useful insights into the processes leading to them.
Supplemental Material
MSJ841810_supplemental_table_1 – Supplemental material for Magnetisation transfer ratio abnormalities in primary and secondary progressive multiple sclerosis
Supplemental material, MSJ841810_supplemental_table_1 for Magnetisation transfer ratio abnormalities in primary and secondary progressive multiple sclerosis by James William L Brown, Azmain Chowdhury, Baris Kanber, Ferran Prados Carrasco, Arman Eshaghi, Carole H Sudre, Matteo Pardini, Rebecca S Samson, Steven HP van de Pavert, Claudia Gandini Wheeler-Kingshott and Declan T Chard in Multiple Sclerosis Journal
Supplemental Material
MSJ841810_supplemental_table_2 – Supplemental material for Magnetisation transfer ratio abnormalities in primary and secondary progressive multiple sclerosis
Supplemental material, MSJ841810_supplemental_table_2 for Magnetisation transfer ratio abnormalities in primary and secondary progressive multiple sclerosis by James William L Brown, Azmain Chowdhury, Baris Kanber, Ferran Prados Carrasco, Arman Eshaghi, Carole H Sudre, Matteo Pardini, Rebecca S Samson, Steven HP van de Pavert, Claudia Gandini Wheeler-Kingshott and Declan T Chard in Multiple Sclerosis Journal
Footnotes
Acknowledgements
The authors thank the people who took part in the study, the MS Society of Great Britain and Northern Ireland and the National Institute for Health Research University College London Hospitals Biomedical Research Centre for financial support.
Declaration of Conflicting Interests
The author(s) declared the following potential conflicts of interest with respect to the research, authorship and/or publication of this article: J.W.L.B. reports travel expenses, speaker honoraria and consulting fees from Novartis, Biogen and Sanofi Genzyme. A.C., B.K., F.P.C., A.E., C.H.S., R.S.S., S.H.P.v.d.P. and C.G.W.-K. have nothing to report. M.P. reports research support from Novartis, speaker honoraria from Merk and Novartis and travel expenses for attending meetings from Merk, Novartis, Roche and Teva. D.T.C., in the last 3 years, received honoraria (paid to his employer) from Excemed for faculty-led education work; had meeting expenses funded by Merck, MS Trust, National MS Society, Novartis, Société des Neurosciences, Swiss MS Society, ECTRIMS and EAN; and has previously held stock in GlaxoSmithKline. He has received research funding from the International Progressive MS Alliance, the MS Society of Great Britain and Northern Ireland and the National Institute for Health Research (NIHR) University College London Hospitals (UCLH) Biomedical Research Centre.
Funding
The author(s) disclosed receipt of the following financial support for the research, authorship and/or publication of this article: The NMR Research Unit at the Queen Square Multiple Sclerosis Centre is supported by the MS Society of Great Britain and Northern Ireland and the UCLH–UCL Biomedical Research Centre. J.W.L.B. is funded through a Next Generation Fellowship funded by the Grant Charity of the Freemason’s. F.P.C. is a non-clinical Guarantors of Brain fellow. C.H.S. is supported by the Alzheimer’s Society. RSS is funded by the MS society of the UK and INSPIRED (a spinal cord imaging study funded jointly by Spinal Research, Wings for Life and the Craig H Nielsen foundation). C.G.W.-K. also receives funding from the Horizon2020 EU programme (H2020–EU.3.1 (634541)) and the UK MS Society.
Supplemental Material
Supplemental material for this article is available online.
References
Supplementary Material
Please find the following supplemental material available below.
For Open Access articles published under a Creative Commons License, all supplemental material carries the same license as the article it is associated with.
For non-Open Access articles published, all supplemental material carries a non-exclusive license, and permission requests for re-use of supplemental material or any part of supplemental material shall be sent directly to the copyright owner as specified in the copyright notice associated with the article.