
Abstract
Background:
The potential of multi-shell diffusion imaging to produce accurate brain connectivity metrics able to unravel key pathophysiological processes in multiple sclerosis (MS) has scarcely been investigated.
Objective:
To test, in patients with a clinically isolated syndrome (CIS), whether multi-shell imaging-derived connectivity metrics can differentiate patients from controls, correlate with clinical measures, and perform better than metrics obtained with conventional single-shell protocols.
Methods:
Nineteen patients within 3 months from the CIS and 12 healthy controls underwent anatomical and 53-direction multi-shell diffusion-weighted 3T images. Patients were cognitively assessed. Voxel-wise fibre orientation distribution functions were estimated and used to obtain network metrics. These were also calculated using a conventional single-shell diffusion protocol. Through linear regression, we obtained effect sizes and standardised regression coefficients.
Results:
Patients had lower mean nodal strength (p = 0.003) and greater network modularity than controls (p = 0.045). Greater modularity was associated with worse cognitive performance in patients, even after accounting for lesion load (p = 0.002). Multi-shell-derived metrics outperformed single-shell-derived ones.
Conclusion:
Connectivity-based nodal strength and network modularity are abnormal in the CIS. Furthermore, the increased network modularity observed in patients, indicating microstructural damage, is clinically relevant. Connectivity analyses based on multi-shell imaging can detect potentially relevant network changes in early MS.
Keywords
Introduction
Performing high-quality tractography is crucial for understanding key pathophysiological aspects of neurological conditions. Early fibre tracking methods were based on the diffusion tensor (DT) model of the diffusion-weighted (DW) signal. 1 Such approaches have well-described limitations especially in regions containing multiple fibre populations, such as the corona radiata, where a single tensor cannot adequately describe complex fibre orientation distribution functions (fODFs). In these areas, drops in tissue DT-derived fractional anisotropy (FA) 2 may be erroneously interpreted as termination of the underlying white matter (WM) tract. Several strategies have been proposed to overcome the limitations of the single tensor model and recover more complex fibre configurations that could be used to inform probabilistic tractography. One of these is to perform tractography based on fODFs obtained using constrained spherical deconvolution (CSD).3,4 CSD recovers the fODF by performing a single-kernel deconvolution of the measured DW signals with non-negativity constraints.
The CSD algorithm was originally designed for single-shell DW imaging acquisitions.5,6 However, as multi-shell acquisitions are becoming more common, 7 a refined approach known as multi-shell multi-tissue (MSMT)–CSD has been proposed to optimally deal with multi-shell data sets.8–10 This method accounts for partial volume effects, thus enabling the estimation of fODF in multiple tissues within the same voxel. 11 This leads to a better estimation of the fODFs and tract reconstruction, especially in voxels containing a mixture of different tissue types, such as WM, grey matter (GM) and/or cerebrospinal fluid (CSF). 8
In neurological diseases, WM pathology may contribute to adverse partial volume effects, which can further confound the tissue segmentation within voxels. In multiple sclerosis (MS), for example, WM voxels may include demyelinating lesions, the diffusion properties of which differ from those of the WM outside the lesions.12,13 Tractography has been extensively applied to MS to understand the pathogenic mechanisms of the disease. 14 However, the application of multi-shell acquisition schemes for brain tractography aiming at the study brain connectivity in patients with MS has been scarcely explored. 15 In addition, no studies have used multi-shell diffusion data for brain tractography in patients with a first demyelinating attack, for whom the discovery of novel disease biomarkers is of the utmost importance.
In this study, we used a multi-shell acquisition and, in particular, the MSMT-CSD algorithm to study brain connectivity in patients with a first demyelinating attack suggestive of MS or clinically isolated syndrome (CIS). We aimed to (1) investigate the ability of connectivity metrics obtained with a MSMT approach to differentiate between patients and controls; (2) assess, in patients, which MSMT connectivity metric best correlated with clinical measures. To complete the analysis, we (3) indirectly compared the multi-shell findings to the results obtained with a single-shell data set, that is, a simpler acquisition scheme that has been extensively used in the past by several groups. 16
Materials and methods
Subjects
We included patients consecutively attending an MS clinic within 3 months of their CIS (i.e. within 3 months of symptom onset). We also included a group of age-matched healthy controls (HCs). All participants underwent a magnetic resonance imaging (MRI) scan at study baseline. Patients were assessed on two cognitive measures, the Paced Auditory Serial Addition Test (PASAT) and the Symbol Digit Modalities test (SDMT). Of note, all our participants had been recruited for a different project, 17 and this is a retrospective analysis of prospectively acquired data. The study was approved by the local Ethics Committee. All participants provided informed written consent.
MRI acquisition and pre-processing
The scans used in this study were part of a previous multi-parameter clinical study. 17 All scans were performed using a 3T Achieva system (Philips Medical Systems, Best, the Netherlands) with a 32-channel head coil, with a maximum gradient strength of 65 mT m−1.
The following MRIs were acquired for all subjects:
Anatomical inversion-prepared three-dimensional (3D) T1-weighted turbo field echo (resolution = 1 × 1 × 1 mm3, TE/TR: 3.2/7.0 ms, TI: 836.46 ms);
Axial proton density (PD)–/T2-weighted turbo spin echo (resolution = 1 × 1 × 3 mm3; TE1/TE2/TR = 15/85/3500 ms);
Clinically feasible multi-shell DW (resolution = 2.5 × 2.5 × 2.5 mm3; TE/TR = 82 ms/12 s; 53 directions: b = 300 s/mm2 (eight directions), b = 711 s/mm2 (15 directions), b = 2000 s/mm2 (30 directions); seven b = 0 s/mm2 images; number of slices = 60; SENSE factor = 2; duration = 25 minutes).
In patients, an experienced rater (S.C.) used the PD-/T2-weighted images to manually outline T2-hyperintense WM lesions using a semi-automated edge-dissection tool (JIM v6.0, Xinapse systems, Aldwincle, UK, http://www.xinapse.com). A pseudo-T1-weighted image was computed from the subtraction of the PD and T2 images. Then, the pseudo-T1-weighted images were used to compute the transformation with the 3D T1-weighted images implementing a symmetric registration approach using NiftyReg software package (http://niftyreg.sf.net). Therefore, the obtained transformations were applied to the T2-weighted lesion masks to move them from native space to 3D T1-weighted space. The 3D T1-weighted images were filled using a non-local patch-match lesion-filling algorithm 18 and parcellated using the Geodesic Information Flows (GIF) method v2.0, 19 freely available at NiftyWeb platform (http://cmictig.cs.ucl.ac.uk/niftyweb/). 20
For co-registering 3D T1-weighted and DW images, we first performed eddy current correction using FSL 21 to the DW images. Subsequently, a geometric distortion correction of the DW images was carried out, using BrainSuite v.15b. For this step, the original (non-lesion-filled) 3D T1-weighted images were initially co-registered to the mean b = 0 images using a constrained non-rigid registration algorithm based on mutual-information; afterwards, the actual correction took place. All undistorted DW data and their final alignment with anatomical 3D T1-weighted data were visually inspected for quality control checking.
Finally, the lesions identified in the PD/T2-weighted space were warped to each subject’s DWI space, as this allowed the individual characterisation of microstructural properties at the level of normal-appearing white matter (NAWM) and lesional WM by appropriately defined masks.
Voxel-wise fODFs and signal fractions
Using the original multi-shell data set, a MSMT CSD was used to recover the fODF within each voxel. 8 In addition, in order to assess the benefits of multi-shell approaches as compared to more conventional, single-shell, acquisition schemes, the DW images obtained with the highest b value (i.e. b = 2000 s/mm2, 30 directions) were extracted. With this single-shell data set, we also obtained the fODFs, but here, we used a CSD algorithm able to solve the problem of crossing fibres but unable to identify multiple tissues within the voxel (i.e. ‘single-shell single-tissue’ algorithm).5,6
For the multi-shell data set only, we calculated the within-voxel ‘signal fractions’ of the three tissues identified by the multi-tissue CSD algorithm, that is, anisotropic tissue, isotropic tissue 1 and isotropic tissue 2. More specifically, we followed these steps:
We estimated, within the same voxel, as many fODFs as tissues were identified (three);
Then, since the volume under the function fODF is known to be proportional to the actual volume of the tissue to which the fODF belongs, we estimated the signal fractions for each one of the tissues within the same voxel, for each subject, as a proxy for volume fractions.
Finally, in order to have, for each voxel, a sum of fractions that added to 1, the signal fractions estimated in the previous step were normalised.
After the initial quality control checking (through visual inspection) of all the original DW data and their alignment with the anatomical 3D T1 data, all the data were considered to be of good quality. Also by visual inspection, the MSMT algorithm showed a reduced number of fODF spurious peaks compared to the single-tissue algorithm in WM areas that are characterised by a bundle of fibres with a similar orientation (e.g. corpus callosum) (Figure 1). In addition, the signal fraction maps showed that the MSMT algorithm successfully differentiated the different types of brain tissue (Figure 2(a)), including within-lesion tissue heterogeneity (Figure 2(b)).
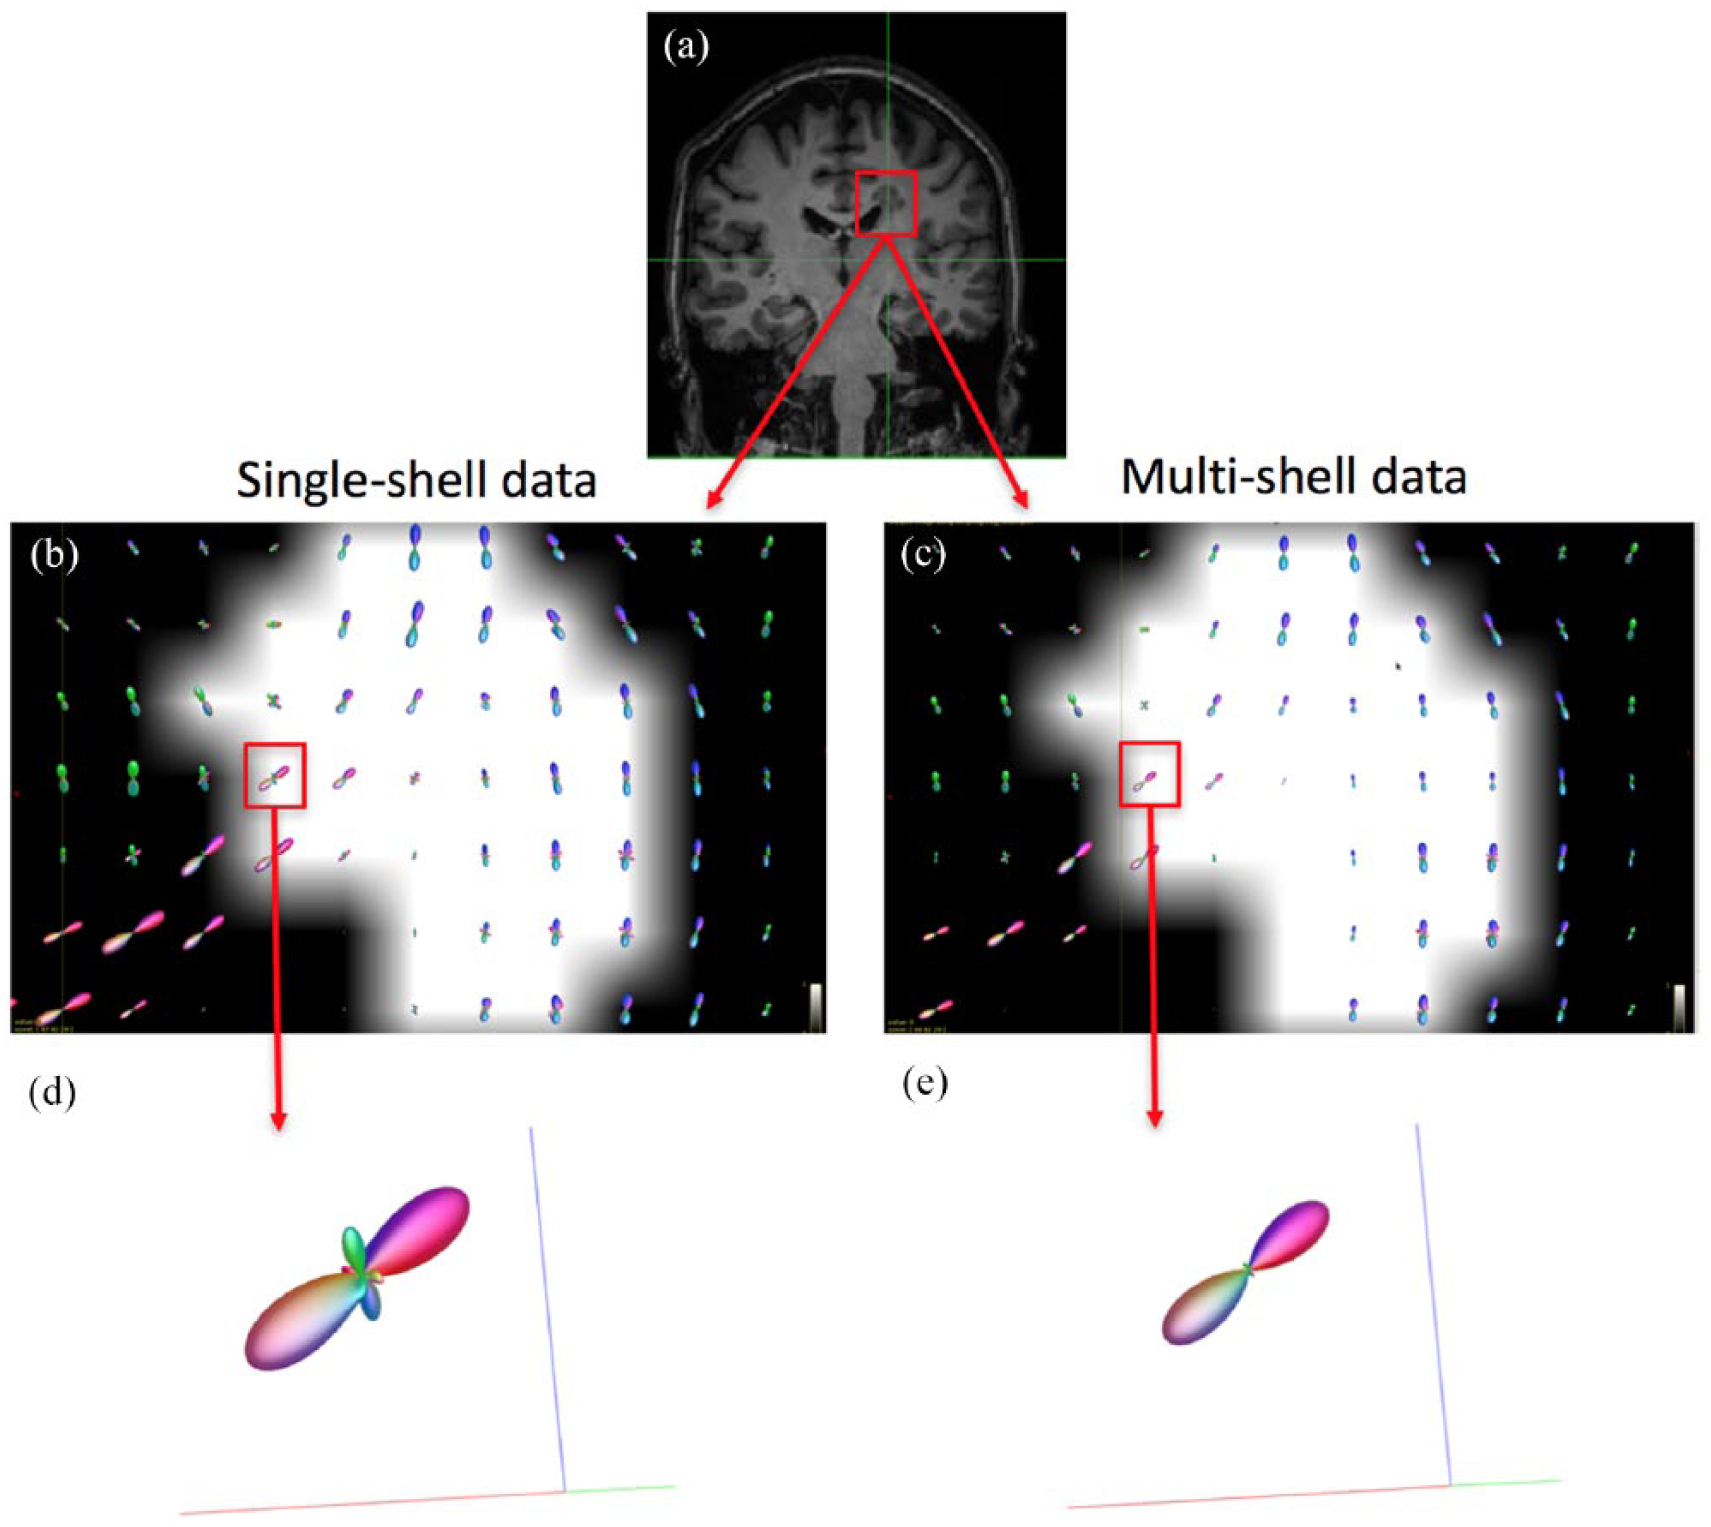
Estimated fODF in the corpus callosum in a patient. As part of the initial qualitative assessment, we looked at the number of peaks at a WM lesion at the boundaries of the corpus callosum, where it is known there are fibres with a similar orientation. Panel (a) shows a coronal view of a T1-weighted image of a patient with a (T1-hypointense) lesion in the confluence of the corpus callosum and the corticospinal tract; (b) and (c): voxel-wise fODF mapping inside the lesion (lesion mask overlaid), obtained with the single-shell single-tissue (b) and multi-shell multi-tissue (c) algorithms; (d) and (e): fODF within a lesional voxel belonging to WM tissue known to have only one fibre population, for each algorithm; whereas (e) (multi-shell multi-tissue algorithm) shows no spurious peaks, these are observed in (d) (single-shell single-tissue). The reduced size of the fODF in (e) reflects the partial volume effects within the lesion.
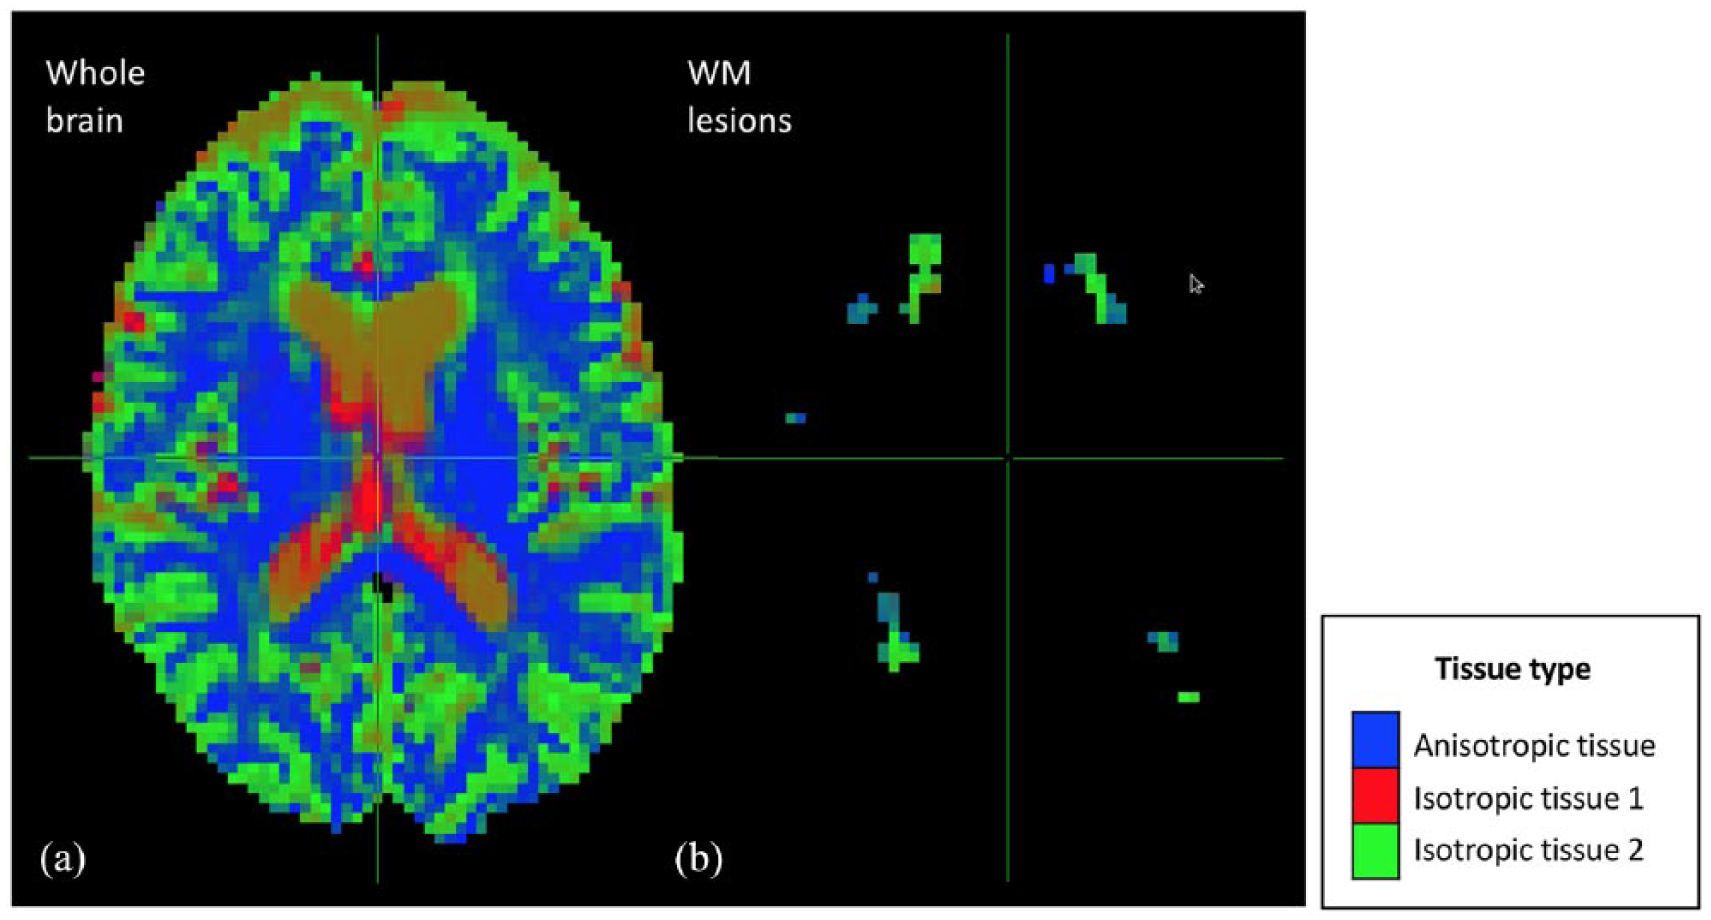
Maps of the voxel-wise diffusion-defined volume fractions obtained with the multi-shell multi-tissue algorithm. This figure shows the maps of voxel-wise volume fractions of the tissues defined based on their diffusion properties. As can be seen in panel (a), the multi-shell multi-tissue algorithm successfully differentiated the different types of brain tissue: normal-appearing WM (i.e. anisotropic tissue), CSF (i.e. isotropic tissue 1) and GM (isotropic tissue 2). WM lesions (panel (b)) were mainly captured by the isotropic tissue 2 and partly by the anisotropic tissue.
Whole-brain connectomes
All steps (CSD; tractography; voxel-wise metrics calculation) were performed using MRtrix3 (v.10/2016). 22 Using the previously computed fODFs, we performed a whole-brain streamlines tractography with an anatomically constrained probabilistic algorithm (iFOD2). 23 We propagated 108 streamlines (default option), using as seeds the GM areas parcellated with the GIF pipeline, 19 which were then considered as the network nodes, and using known criteria for streamline termination (default option). 24 Afterwards, for each pair of nodes, the number of streamlines successfully connecting them was re-computed with the SIFT2 algorithm. 25 This is a dynamic seeding mechanism that ensures that the final number of streamlines connecting each pair of nodes is re-weighted according to the cross-sectional area of the WM tract, estimated from the fODF obtained in the previous steps. Afterwards, we built structural connectomes considering, as network nodes, the GM parcels defined according to the GIF segmentation. 19 The re-weighted numbers of streamlines were considered as the network edges.
Network metrics
We used the Matlab Brain Connectivity Toolbox (https://sites.google.com/site/bctnet/) to estimate the following network metrics for weighted graphs 26 for each subject, which were then standardised:
Nodal connectivity metrics
They reflect the strength with which the network nodes, which here represent the cortical GM areas, are connected. They include the mean nodal strength, which is the average, across all nodes, of the sum of the strength of each node (i.e. the total number of streamlines emerging from that node) of a network, and the mean clustering coefficient, which reflects the connectivity among the neighbours of a given node. In MS, a decrease in nodal connectivity metrics may be seen in the context of WM tract damage due to inflammatory demyelinating lesions.
Metrics of nodal distance
The metrics of nodal distance reflect how well any two nodes in the network are connected. They include mean shortest path, which reflects the number of intermediate connections between any two pairs of nodes of the network, and global and local efficiency, which are mathematically related to the mean shortest path. Smaller values of mean shortest path imply more efficient information transfer between nodes, while global and local efficiency reflect the ability of the network to integrate information globally and locally, respectively. In the MS brain, longer mean shortest paths and, therefore, worse global and/or local efficiencies may be seen when there is damage in WM tracts that are crucial to keep the number of intermediate connections between any two GM areas to the minimum.
Metric of network structure
This includes the modularity coefficient, which describes how well a network can be subdivided into ‘modules’ or groups of nodes highly correlated among each other. In MS, abnormally high modularity coefficients may indicate the presence of lesions or WM atrophy that causes an artificial partition of the network into a number of relatively isolated communities containing highly inter-connected GM regions.
Statistical analysis
Linear regression models were built to assess the differences between groups in network metrics. In these models, the network metric was considered as the dependent variable and the binary variable ‘group’ (patient or control) was considered as the main independent variable. In order to (indirectly) compare the ability of the multi-shell metrics to differentiate between patients and controls with that of the single-shell metrics (reference), we obtained the effect size for each network metric from these regression models. The greater the effect size in absolute value, the higher the ability of the metric to differentiate between groups. A positive effect size for a given metric indicated higher values of that metric in patients than in controls, whereas a negative effect size indicated the opposite. All models were adjusted for age, gender and lesion load. Controls were assigned a lesion load equal to zero, as previously done. 27 Statistical significance was considered when p < 0.05.
To assess the relationship between the multi-shell network metrics that were abnormal in MS patients and clinical measures, we built linear regression models where the clinical measure (one at a time) was the dependent variable and the network metric (one at a time) was the main explanatory variable. For all these analyses, we used the number of correct answers in the relevant cognitive test as the clinical variable. Similar models were built with network metrics obtained with single-shell data. All models were adjusted for age, gender and lesion load. In order to (indirectly) compare regression coefficients from models with multi-shell versus single-shell data, standardised regression coefficients were computed. Therefore, a greater (in absolute value) standardised regression coefficient indicates a stronger association between the network metric and the clinical metric.
All the analyses were performed with Stata 14.2 (Copyright 1985-2015 StataCorp LLC).
Data availability
The data sets and models generated during the current study are available from the corresponding author on reasonable request.
Results
Descriptive statistics
Nineteen patients and 12 HCs were included. Table 1 shows full details on demographical, clinical and MRI data. All patients were assessed within 3 months of their first demyelinating attack, which consisted of optic neuritis in 17 of them and of acute myelitis in the remaining two. The MRI scan showed WM lesions in 13 of the 19 patients and did not show any pathological lesions in any of the HCs. In patients, the mean lesion load among those who had lesions was 4.13 mL (range: 0.026–14.69 mL).
Clinical, demographical and MRI data.
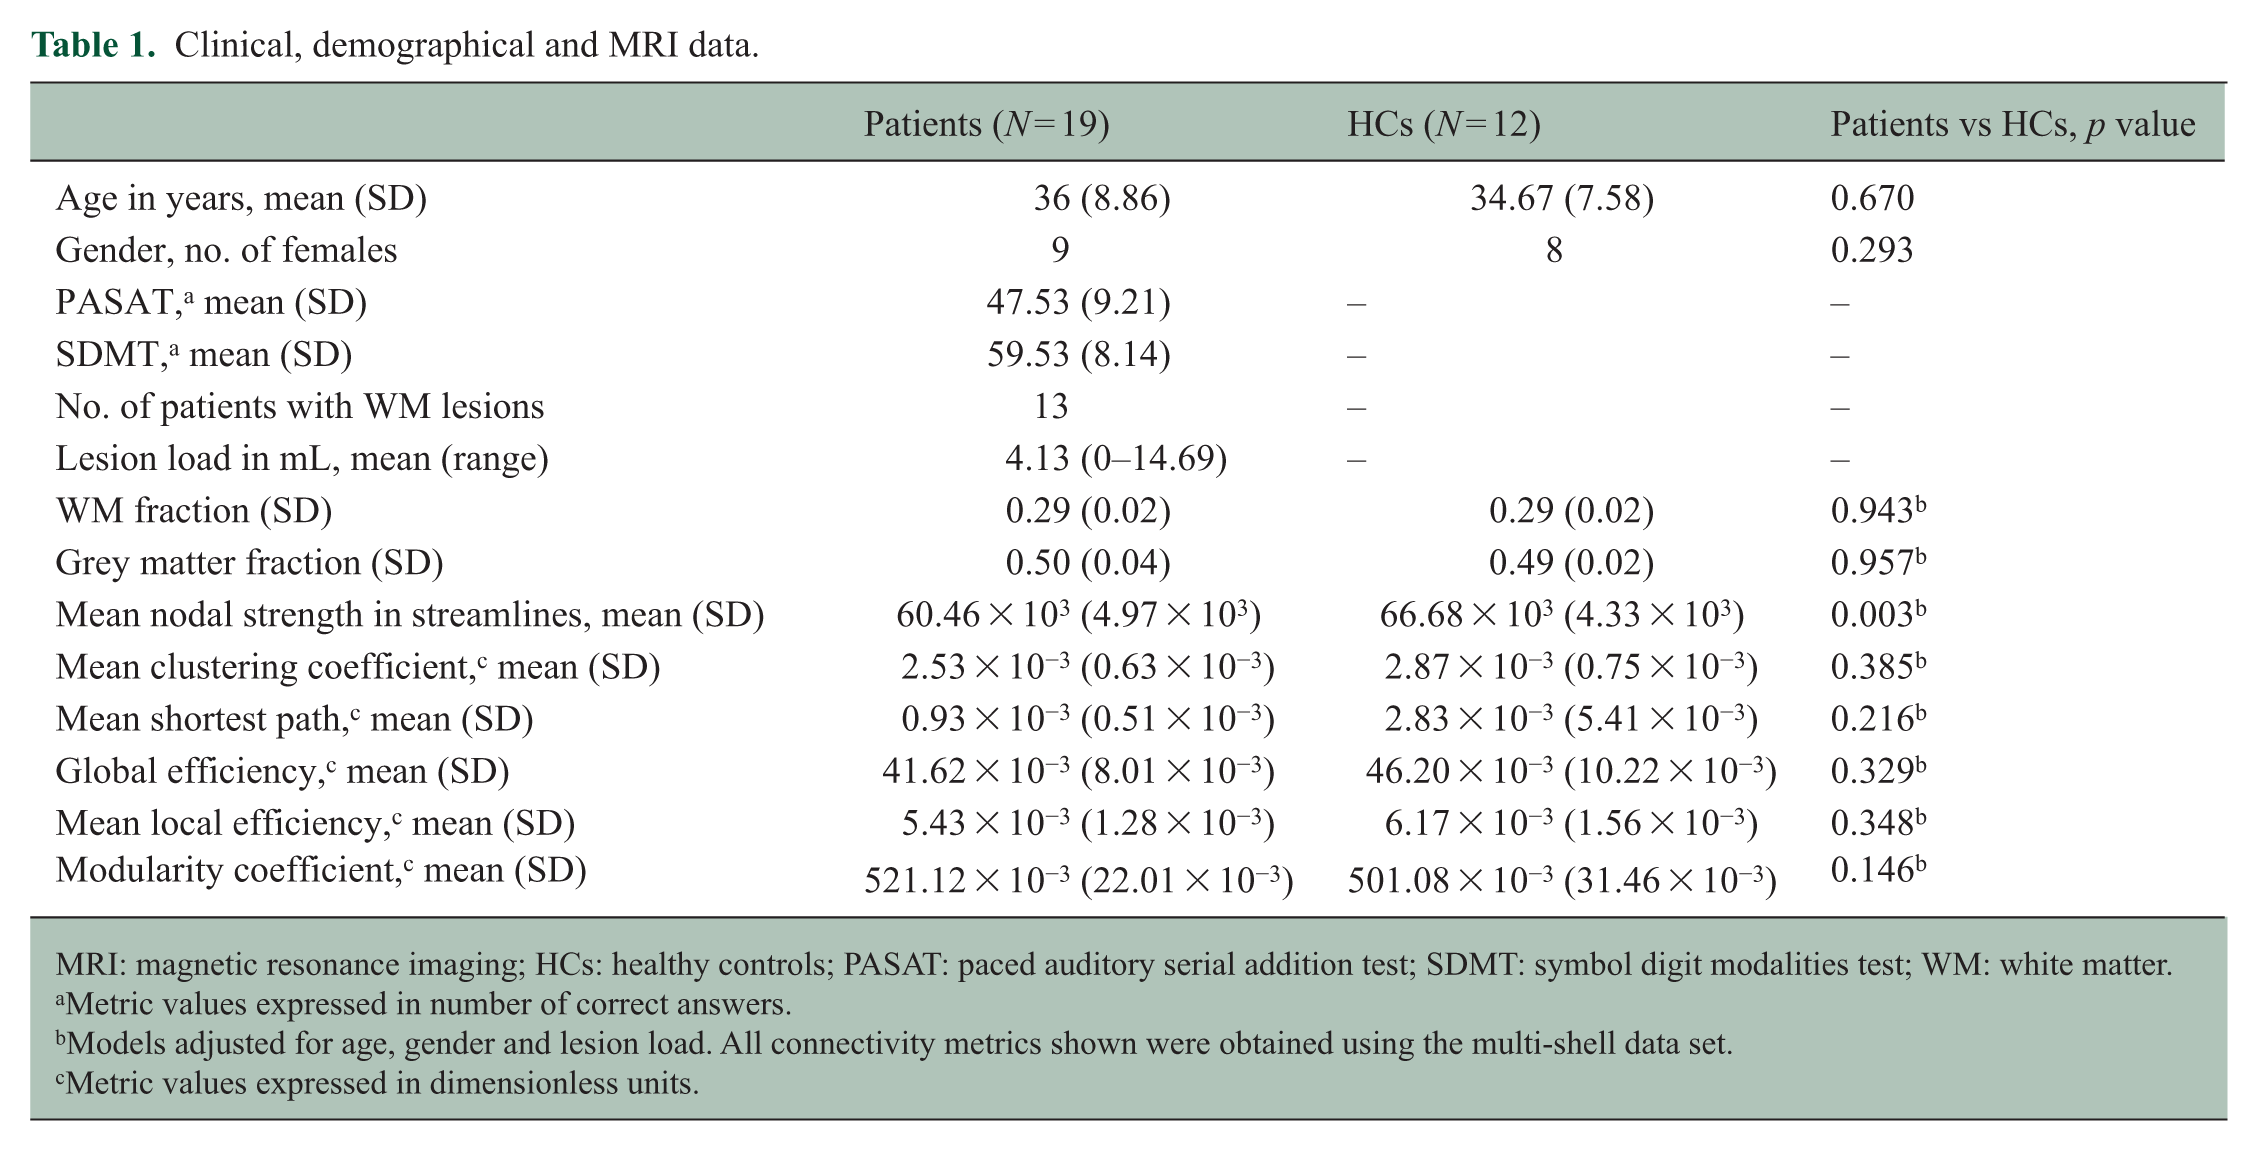
MRI: magnetic resonance imaging; HCs: healthy controls; PASAT: paced auditory serial addition test; SDMT: symbol digit modalities test; WM: white matter.
Metric values expressed in number of correct answers.
Models adjusted for age, gender and lesion load. All connectivity metrics shown were obtained using the multi-shell data set.
Metric values expressed in dimensionless units.
Differences between patients and controls in network metrics
Patients had significantly lower mean nodal strength than HCs, even after adjusting for age, gender and lesion load (60.46 × 10³ (SD: 4.97 × 10³) streamlines vs 66.68 × 10³ (SD: 4.33 × 10³) streamlines, p = 0.003). Modularity coefficient was higher in patients than controls (p = 0.045), but statistical significance was lost after adjusting for lesion load. For the only metric that showed differences between patients and controls after adjusting for confounders, that is, the mean nodal strength, the effect size was greater (in absolute value) when computed with the multi-shell approach than when computed with the single-shell approach (Table 2).
Effect sizes (95% CI) for all network metrics, adjusted for age, gender and T2 lesion load.
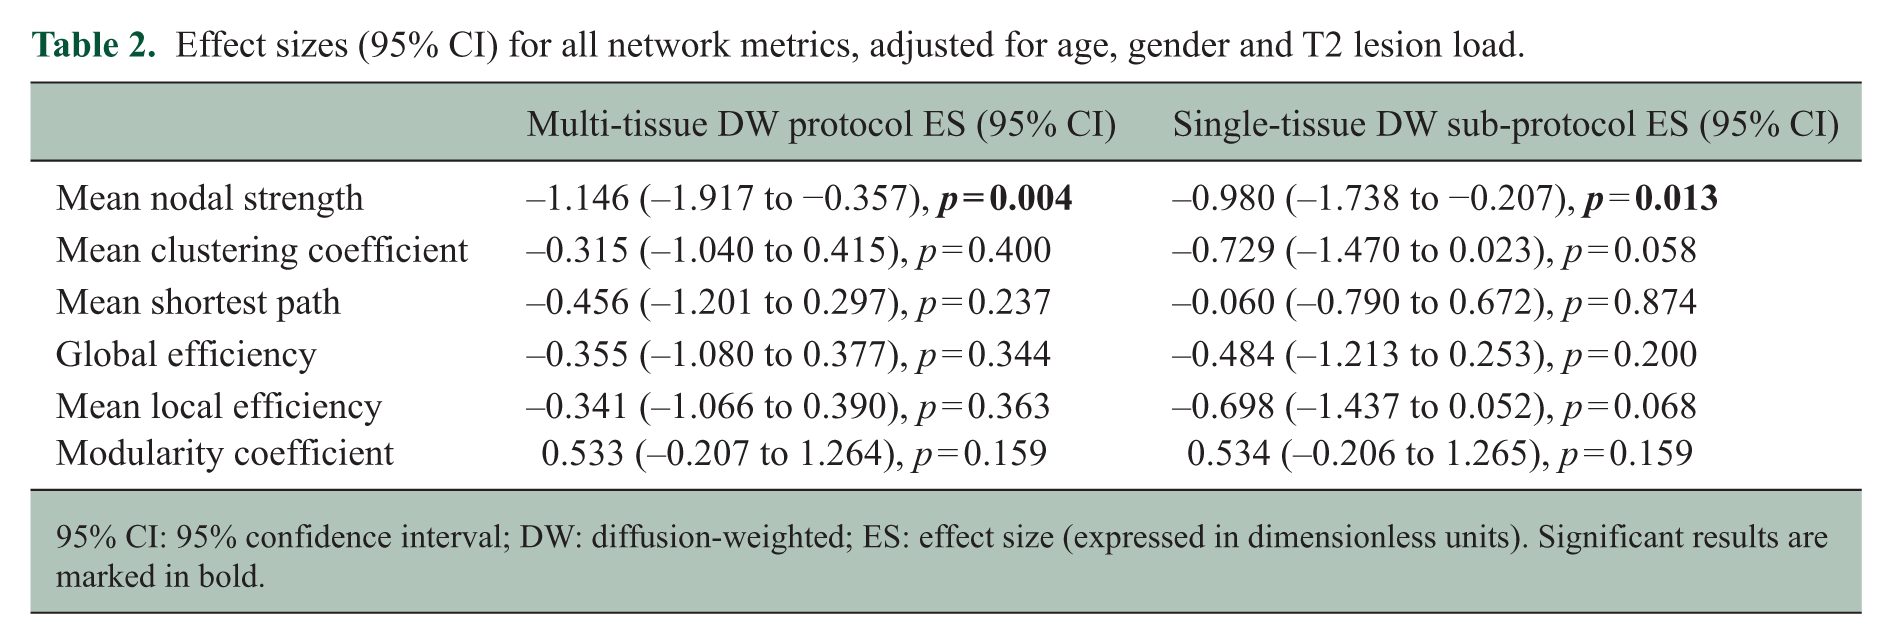
95% CI: 95% confidence interval; DW: diffusion-weighted; ES: effect size (expressed in dimensionless units). Significant results are marked in bold.
Association between network metrics and cognitive measures
Among the network metrics that showed significant differences between patients and controls, the modularity coefficient was significantly associated with cognitive performance and, in particular, with the SDMT: greater modularity coefficient values were associated with worse SDMT performance (p = 0.002), even after adjusting for age, gender and lesion load. Of note, the association between modularity coefficient and the SDMT score was observed for both multi-shell and single-shell connectivity metrics, although the standardised regression coefficient was greater (in absolute value) for the multi-shell metric (Table 3).
Association between connectivity metrics and cognitive measures, adjusted for age, gender and T2 lesion load.
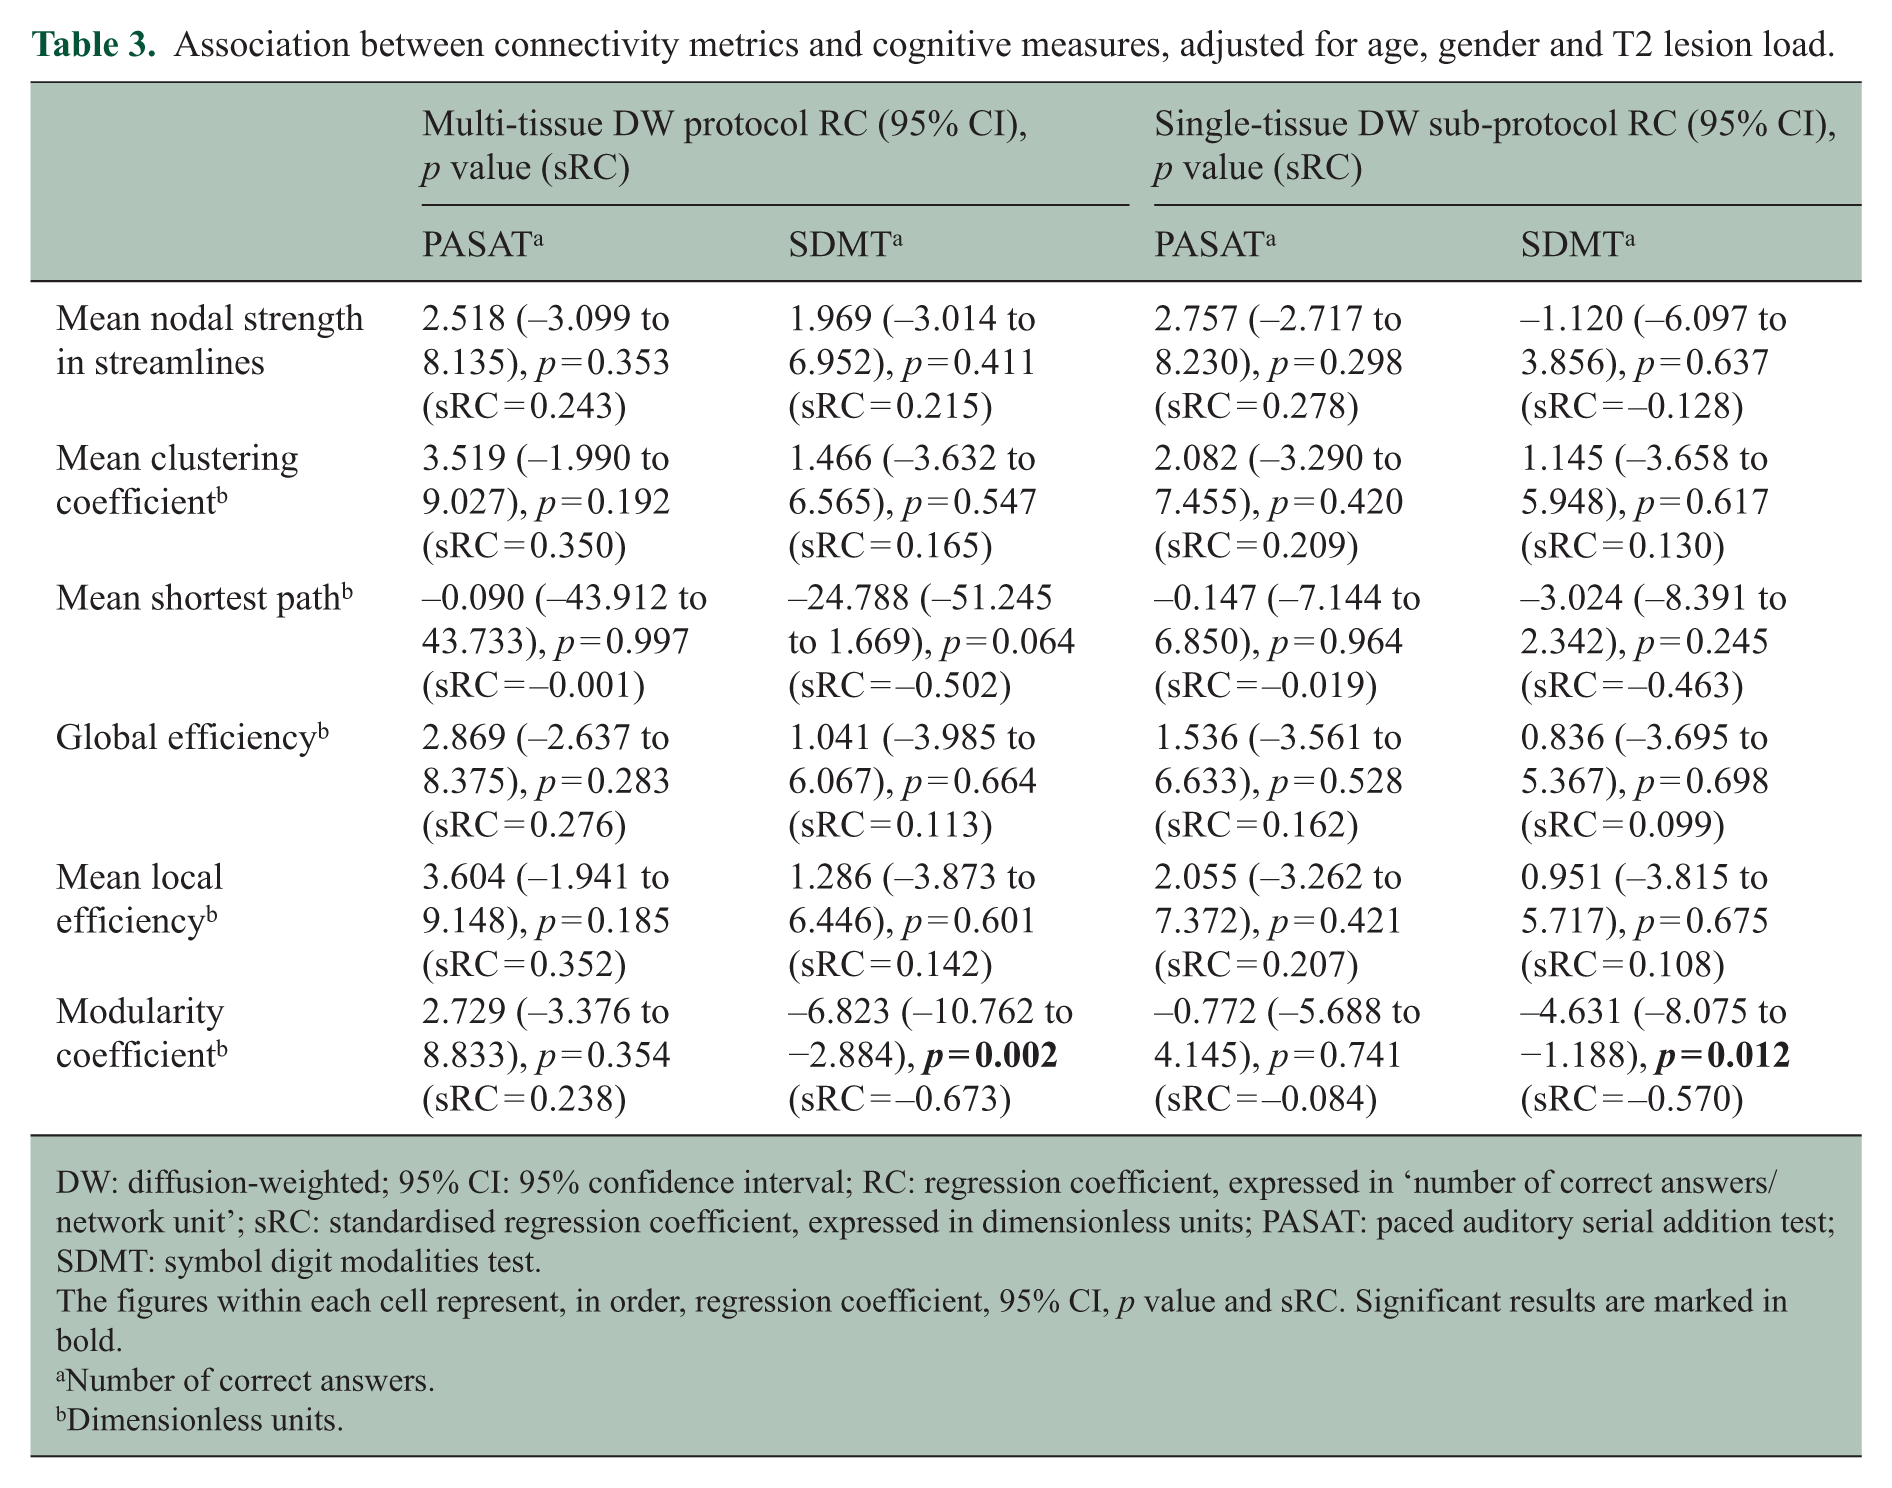
DW: diffusion-weighted; 95% CI: 95% confidence interval; RC: regression coefficient, expressed in ‘number of correct answers/network unit’; sRC: standardised regression coefficient, expressed in dimensionless units; PASAT: paced auditory serial addition test; SDMT: symbol digit modalities test.
The figures within each cell represent, in order, regression coefficient, 95% CI, p value and sRC. Significant results are marked in bold.
Number of correct answers.
Dimensionless units.
Discussion
In this study, we explored for the first time the potential of a clinically feasible multi-shell acquisition to study brain connectivity in patients with CIS, which is the first demyelinating attack suggestive of MS. After adjusting for age, gender and lesion load, patients with CIS had significantly lower mean nodal strength than controls at the time of the CIS. This suggests an overall reduction of WM connections between GM regions at a global level, that is, a decreased number of WM tracts in the context of neurodegeneration. Whereas lower mean nodal strength in patients with MS and after a CIS than in controls has already been reported in the literature, 28 our study is the first one that uses a multi-shell acquisition scheme, which has the potential to provide invaluable information on tissue microstructure. The fact that these results are obtained after adjusting for lesion load implies that the information that connectivity metrics provide is largely independent of the extent of the most visible form of brain damage. We observed that the ability of the mean nodal strength to differentiate patients from controls was superior to WM or GM fractions. Therefore, connectivity metrics would seem more sensitive to tissue damage than more conventional imaging measures. Previous studies focusing on the role of connectivity metrics in patients with relapsing-remitting MS and secondary progressive MS have also reported lower nodal connectivity in these MS phenotypes than controls.29–31 Importantly, these studies have also reported other network abnormalities, such as decreased global efficiency, reflecting the greater WM damage in more advanced stages of the disease.29–31
We also found that greater values of modularity coefficient were associated with worse cognitive function. Notably, such association could be observed even after adjusting for lesion load, although patients had only shown greater modularity coefficient values in unadjusted models, which did not take into account lesion volume. We speculate that the presence of macroscopic and microscopic areas of inflammation and demyelination may cause a partition of the brain into different sets of nodes highly connected among themselves but isolated from the other nodes of the network, supporting the idea that the long-distance connections are those that are lost first. 32 Then, differences in modularity coefficient would be mainly explained by differences in visible, macroscopic lesions, whereas the WM damage secondary to lesions, possibly exceeding the original lesional area through trans-synaptic degeneration,27,33 would be responsible for clinical dysfunction. This would explain the relative independence of modularity coefficient from lesion volume when predicting cognitive performance.
In our study, a number of metrics were not affected by the disease. Network metrics are mathematically related and, in MS, their abnormalities appear as a consequence of pathologic processes that are also highly related, for example, inflammation and demyelination, and WM atrophy. Therefore, it may be surprising that we only observed abnormalities in some metrics but not all of them. On the contrary, each network metric reflects a different aspect of the network organisation and their sensitivity to brain structural changes is not the same for all of them. Whereas we found in patients a significant decrease in nodal strength and a (weak) increase in modularity coefficient, no differences were observed in distance metrics, indicating a quite preserved network efficiency despite the presence of lesions. This would be in line with a recent study carried in patients with established MS, which has shown evidence of the robustness of the brain network against the WM damage derived from visible inflammation. 30 In addition, the small spatial extent of lesion load of our CIS patients may have played a role in the preservation of network efficiency, as hinted in our synthetic example (Figure 3).
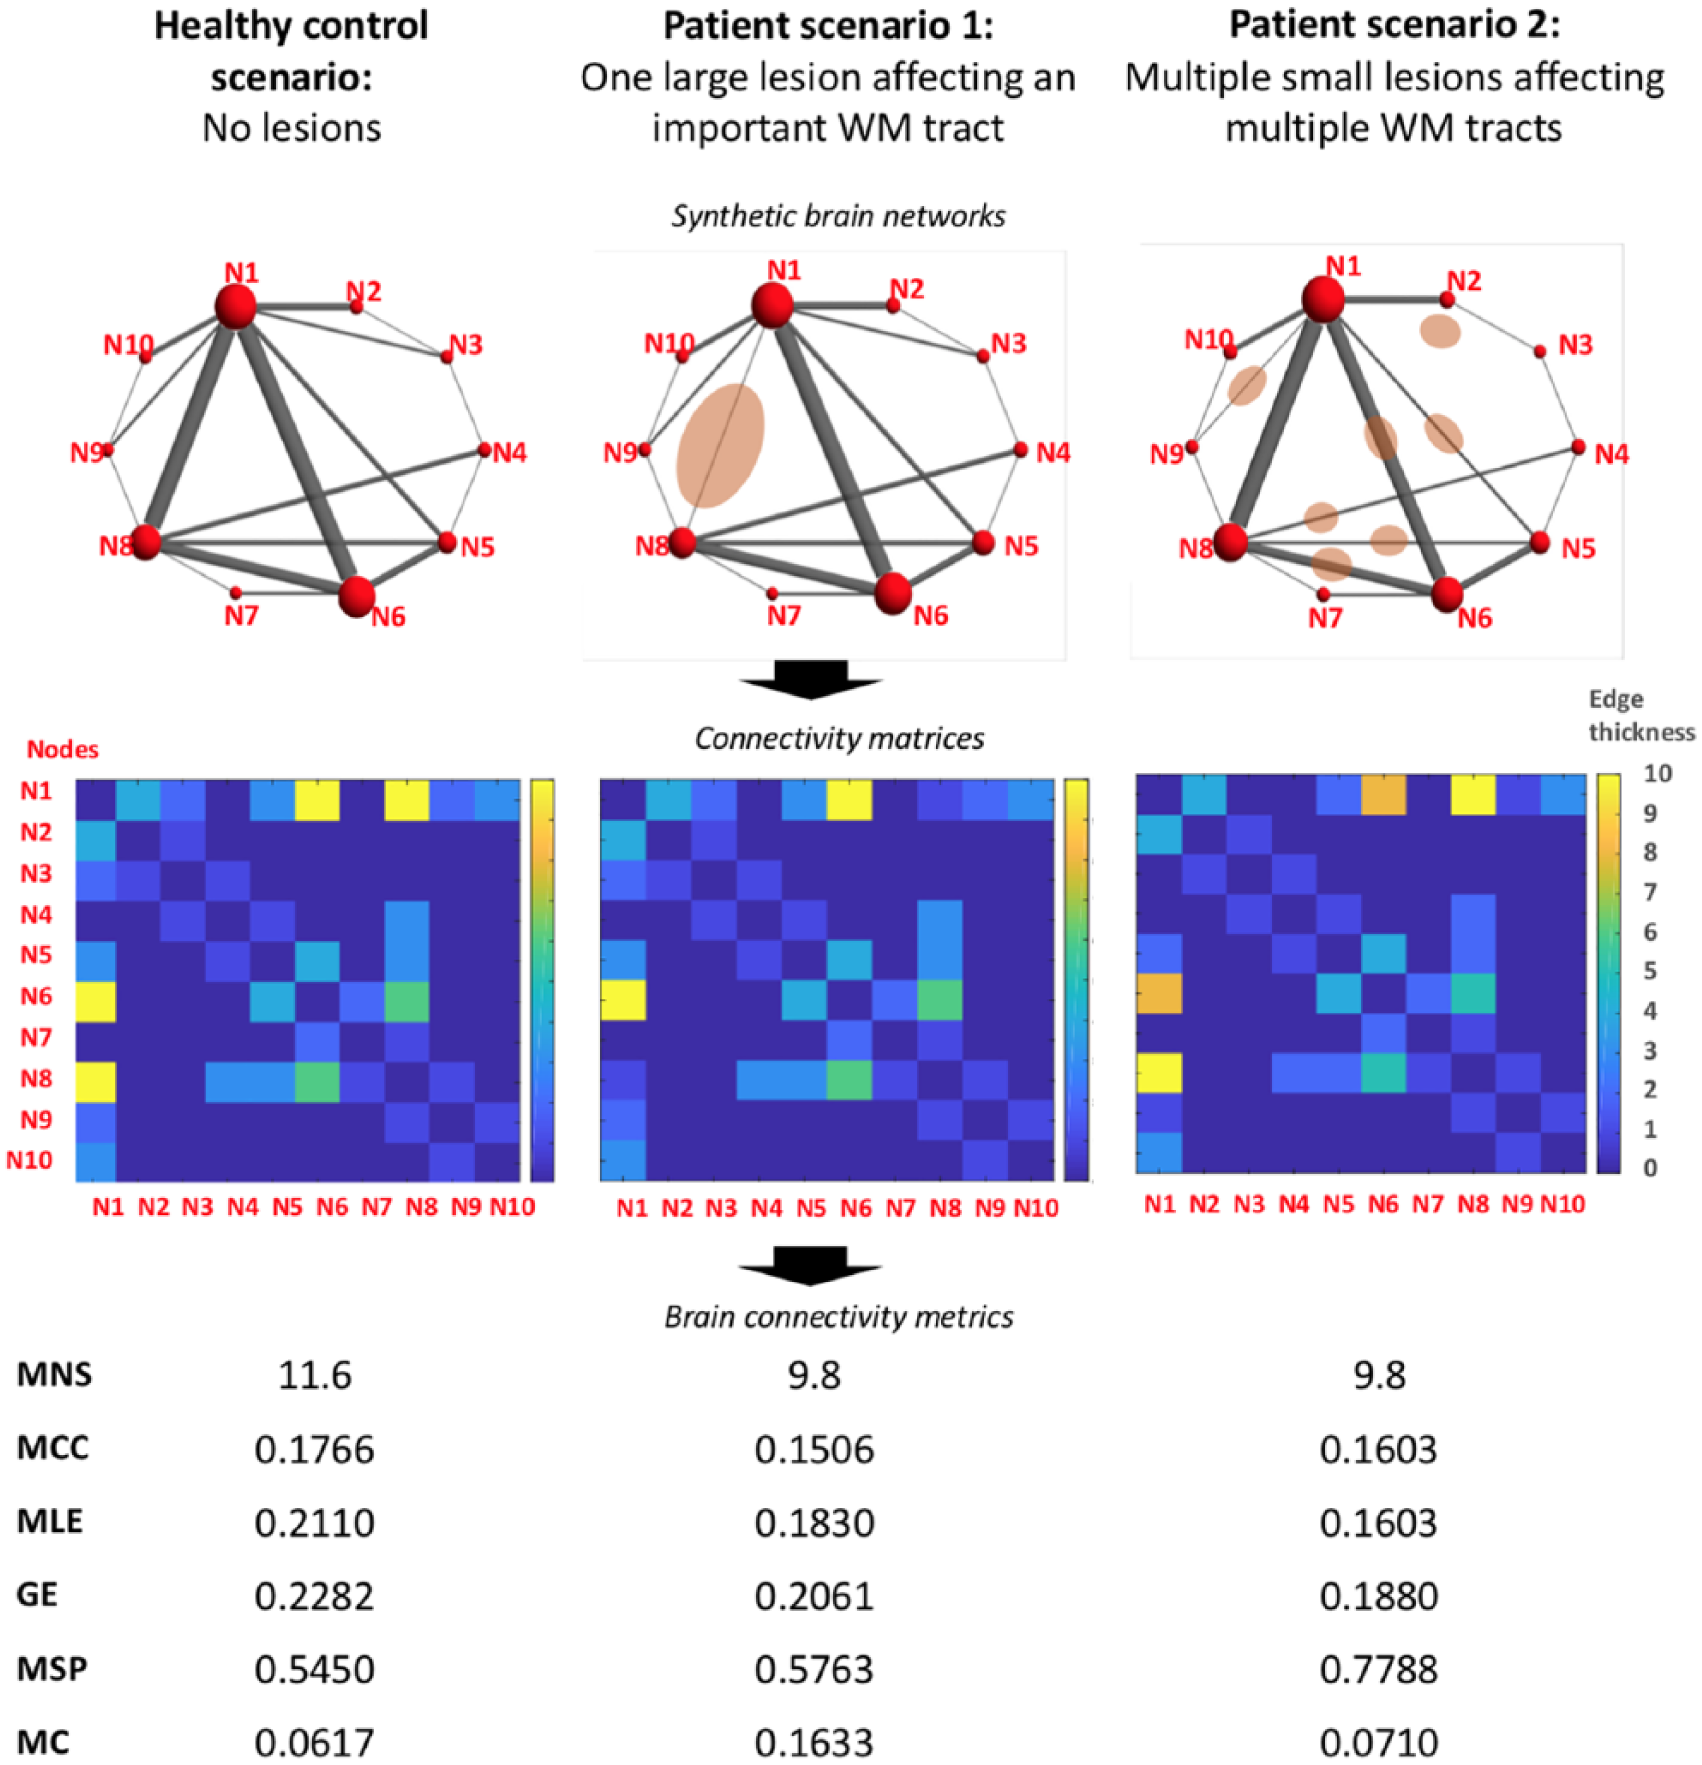
Illustration of possible hypothetical scenarios of network disruption due to MS lesions. This figure illustrates, with synthetic examples, how network metrics can change in the context of inflammatory demyelinating lesions, represented as pink ovoidal shapes drawn over mock brain networks. Patient examples aim to show two opposite scenarios. In the first patient example, there is a large lesion severely affecting an important WM tract, which connects two of the most relevant nodes of the network. In the second patient example, there are multiple lesions affecting several WM tracts. The lesion burden and the total damage in the WM aim to be the same in the two examples. For all three scenarios, connectivity matrices have been obtained and network metrics have been computed using the freely available Brain Connectivity Toolbox in MATLAB. Both patient examples show the same decrease in MNS. In the first patient example, network efficiency is quite preserved despite the severe damage to an important WM tract. Instead, MC is increased with respect to the healthy control example. In the second patient example, network efficiency is much lower than that in the control example but instead the MC is preserved.
Finally, the metrics obtained with a multi-shell acquisition scheme appeared superior to those obtained with a single-shell scheme in terms of sensitivity to subtle disease. The effect size of mean nodal strength obtained with a multi-shell scheme was greater (in absolute size) than that obtained with a single-shell data set. In addition, the standardised regression coefficient describing the relationship between greater modularity coefficient and worse cognitive function was greater (in absolute value) when the modularity coefficient was obtained with a multi-shell scheme. This is probably explained by the ability of the multi-shell protocol to detect the different signal/volume fractions within the voxel, as opposed to single-shell protocols. Interestingly, such fractions showed partial volume contrasts even within lesions, bringing to light the unique potential of multi-shell schemes to allow a deep phenotyping of the microstructural changes occurring in MS. However, the differences between single-shell and multi-shell results might have also been explained by the fact that the single-shell connectivity analyses were carried out with a sub-set of the original multi-shell DW data. This implies that the two schemes had not been matched for acquisition time and that the b value for the single-shell data set had not been optimised for connectivity studies. On the contrary, the single-shell scheme used only DW data with relatively high angular resolution (b = 2000 s/mm2), unlike the multi-shell scheme, which contained data with high (b = 2000 s/mm2) and low (b = 711 s/mm2 and b = 300 s/mm2) angular resolution. Therefore, while the presence of multiple b values enables the detection of partial volume effects within a voxel, the low angular resolution of b = 711 s/mm2 and b = 300 s/mm2 may have reduced the precision of the fibre orientation estimation in the MSMT approach. Ultimately, this may have led to a lower-than-expected performance of the multi-tissue algorithm. Of note, our study did not intend to perform an exhaustive comparative analysis of the metrics obtained with the two schemes, and the reported comparisons thus need to be taken with caution. Future studies with larger cohorts and focusing on the comparison between multi-shell and single-shell schemes with the same acquisition time and with optimised b values for the single-shell acquisition, generally below 2000 s/mm2, are therefore warranted.
Among the potential limitations of this study, we should mention that the acquisition protocol was originally designed to support fitting of multi-compartment models, such as neurite orientation dispersion and density imaging (NODDI).34,35 However, it is important to notice that acquisitions that support NODDI-like analyses are being increasingly adopted in clinical studies 36 and phase 2 trials, 37 and it is therefore relevant to assess the potential of similar acquisition protocols for connectivity analysis. Second, our sample size was quite small. Further investigations exploiting rich acquisition set-ups such as the ‘MASSIVE’ data set (http://www.massive-data.org) 38 are mandatory to generalise current results and confirm the benefits of multi-shell acquisitions with respect to single-shell ones in early MS. Finally, our patient population was a cohort of people who had suffered a first demyelinating attack of the central nervous system, which means the presence of WM inflammatory lesions was still relatively mild. Thus, it is possible that in patients with established MS, with higher lesion loads and therefore higher numbers of WM voxels affected by partial volume, more evident differences between multi-shell and single-shell schemes can be observed.
In conclusion, we provide definite evidence of the potential of multi-shell acquisitions to study brain connectivity in patients with a first demyelinating attack suggestive of MS. Multi-shell acquisitions can effectively produce metrics that differentiate patients at very early stages of MS from HCs and metrics that correlate with cognitive function beyond the presence of macroscopic inflammatory damage. Our results encourage the use of multi-shell DW data sets, if possible, to produce connectivity metrics in early MS, even if the original purpose of the multi-shell acquisition was not the study of brain connectivity. Connectivity metrics derived from multi-shell acquisitions appear as potential biomarkers in early MS and, because of their high sensitivity to pathology, can help understand the complex processes underlying clinical progression in this devastating condition.
Footnotes
Declaration of Conflicting Interests
The author(s) declared no potential conflicts of interest with respect to the research, authorship, and/or publication of this article.
Funding
The author(s) disclosed receipt of the following financial support for the research, authorship, and/or publication of this article: This work was supported by the Multiple Sclerosis Society of Great Britain and Northern Ireland and the NIHR (National Institute for Health Research) UCLH (University College London Hospitals) BRC (Biomedical Research Centre). C.T. has received an ECTRIMS Post-doctoral Research Fellowship in 2015. She has also received honoraria and support from travelling from Merck Serono, Sanofi, Roche, TEVA Pharmaceuticals, Novartis, Biogen, Bayer, Ismar Healthcare. F.G. is funded by the Horizon2020-EU.3.1 CDS-QUAMRI project (ref: 634541) and by the EPSRC Platform Grant for medical image computing for next-generation healthcare technology (ref: EP/M020533/1). T.C., S.C., N.C., D.R.A. and J.D.C have nothing to disclose. F.P. is supported by a Guarantors of Brain non-clinical post-doctoral fellowship. F.P. has also received honoraria from Bioclinica Inc. B.K. and S.O. are funded by NIHR BRC UCLH/UCL High Impact Initiative BW.mn.BRC10269. S.O. also receives funding from the EPSRC (EP/H046410/1, EP/J020990/1, EP/K005278), the MRC (MR/J01107X/1) and the NIHR Biomedical Research Unit (Dementia) at University College London. F.B. has received research support from the IMI (H2020) programme AMYPAD, the Dutch MS Society and the NIHR UCLH BRC. He has received consulting fees for work done in steering committees, data-safety monitoring boards and advisory boards from Bayer Schering Pharma, Sanofi-Aventis, Biogen-IDEC, Teva, Merck Serono, Novartis, Roche, Synthon BV, Jansen Research and Genzyme. A.T.T. has received speaker honoraria from Biomedia, Serono Symposia International Foundation, Bayer and meeting expenses from Biogen Idec. He is the local principal investigator (PI) for clinical trials in multiple sclerosis funded by MEDDAY Pharmaceuticals. CAM Gandini Wheeler-Kingshott receives research grants (PI and co-applicant) from Spinal Research, Craig H. Neilsen Foundation, EPSRC, Wings for Life, UK MS Society, Horizon2020, NIHR/MRC. O.C. receives research grant support from the Multiple Sclerosis Society of Great Britain and Northern Ireland, the NIHR UCLH BRC, and she is a consultant for Teva, Roche, Novartis, Merck and Biogen. She is an Associate Editor for Neurology, for which she receives an honorarium.