
Abstract
Background:
The relationship between structural and functional deficits in multiple sclerosis (MS) is unclear.
Objective:
This study explored structure-function relationships during the 5 years following a clinically isolated syndrome and their role in cognitive performance.
Methods:
Thirty-two patients were enrolled after their first neurological episode suggestive of MS and followed for 5 years, along with 10 matched healthy controls. We assessed structural (using diffusion tensor imaging) and functional (using resting-state functional magnetic resonance imaging (fMRI)) brain network metrics, clinical and cognitive scores at each follow-up visit. Structural–functional coupling, calculated as the correlation coefficient between strengths of structural and functional networks, was used to assess structure–function relationships.
Results:
Structural clustering coefficient was significantly increased after 5 years, whereas characteristic path length decreased. Structural connections decreased after 1 year and increased after 5 years. Functional connections and related path lengths were decreased after 5 years. Structural–functional coupling had increased significantly after 5 years. This structural–functional coupling was associated with cognitive and clinical evolution, with stronger coupling associated with a decline in both domains.
Conclusion:
Our findings provide novel biological evidence that MS leads to a more constrained anatomical-dependant functional connectivity. The collapse of this network seems to lead to both cognitive worsening and clinical disability.
Keywords
Introduction
Up to 70% of multiple sclerosis (MS) patients may experience some degree of cognitive impairment (CI), 1 even in an early stage of the disease. 2
Clinically isolated syndrome (CIS) is the first neurological episode of the type seen in MS representing a high risk of progression to MS. 3 Thus, following this initial stage of the disease represents the perfect window to capture the early pathophysiological changes responsible for future CI and allowing a better long-term prognosis.
There is a lack of studies exploring the topological organization of structural and functional brain networks at this early stage of the disease. In addition, structural and functional brain networks have been studied independently, making the overall picture incomplete, and attempts to integrate the findings obtained in different populations via different modalities are often conflicting. 4
Structural connections shape and constrain functional connectivity (FC), even though the relationship cannot be explained by direct anatomical connections alone. 5 Thus, the concept of structural–functional coupling has been introduced to represent the direct link between structural and functional connections, and to understand the behaviour of brain functional networks reorganization under pathological conditions.5,6 The integration of functional and structural information may allow for a more sensitive detection of subtle brain pathophysiological abnormalities than any single modality. We previously investigated structural–functional coupling in MS 1 year after a CIS and demonstrated early decoupling of specific networks, with preservation of cognitive performance, 7 suggesting a compensatory mechanism involving functional reorganization along indirect anatomical connections. However, long-term brain network reorganization in CIS remains unknown.
In MS, white matter tracts can be damaged by white matter lesions, 8 but also by a more diffuse loss of microstructural integrity, which is typically detected by diffusion tensor imaging (DTI). 9 Given the destruction of short- and long-range anatomical connections, MS has been described as a disconnection syndrome. There is evidence that the metabolic costs associated with a given brain region are proportional to the number of connections that it has, while the costs associated with a given connection are proportional to its length. 10 As a cost–efficient trade-off, brain networks can reconfigure themselves to achieve lower metabolic connection costs at the expense of a loss of integrative capacity, which results in CI.10,11
In addition to these structural effects, functional networks are also involved; functional alterations become apparent during the disease course. 4 However, characterizing functional reorganization in terms of maladaptive or compensatory responses to injury is difficult in the absence of appropriate longitudinal studies. 12 Functional networks are able to compensate for structural damage, until a certain threshold of damage is exceeded. The end result is network collapse and CI. 13
In this study, we investigated structural and functional network alterations during the first 5 years after CIS onset. In particular, we examined the progression of structural–functional coupling as an indicator of the capacity of a network for self-reconfiguration. We hypothesized that structural damage progression would constrain FC affecting cognitive performances in early MS patients.
Materials and methods
Study protocol, approvals, registration, and patient consent
The patients were recruited from the SCI-COG cohort (ClinicalTrials.gov Identifier: NCT01865357), which is a prospective non-interventional study on early brain damage in patients with CIS. This study was approved by the Ethics Committee of our institution and written consent was obtained from all participants.
Subjects
Fifty-two patients with at least two clinically silent cerebral lesions on fast fluid-attenuated inversion recovery (FLAIR) images were prospectively recruited <6 months after CIS onset. None of the patients were receiving disease-modifying therapy at inclusion. The exclusion criteria were contraindications to magnetic resonance imaging (MRI), the presence of other neurological, psychiatric or systemic diseases, steroid treatment within the past month, starting or stopping antidepressants or anxiolytic treatments within 2 months of the MRI and neuropsychological examinations, and a diagnosis of severe depression (Beck Depression Inventory (BDI) score > 27). 14 Ten healthy controls (HCs), who were free of neurological, psychiatric and systemic diseases, and of drug and alcohol abuse, were matched to the patients in terms of age, sex and educational level.
Assessments
All of the patients enrolled in the study underwent clinical (Expanded Disability Status Scale (EDSS), 15 neuropsychological) and MRI examinations at baseline; 1-year follow-up (41 patients), and 5-year follow-up (32 patients). Some patients were lost to follow-up at 1 and 5 years. However, those patients were comparable to those included in the analysis (see Supplemental material). The neuropsychological battery assessed information processing speed (IPS), episodic memory (EM), executive function (EF), and working memory (WM) (Supplemental material). During the follow-up period, MS diagnostic status was confirmed according to the 2017 McDonald criteria. 16 Only patients with data for three follow-up visits were included in the longitudinal analysis.
MRI acquisition
Participants were scanned on a 3 T MRI system. The acquisition protocol included a 3D T1-weighted sequence, a 2D FLAIR sequence, a DTI sequence and a resting-state functional magnetic resonance imaging (fMRI) sequence (Supplemental material).
HCs were scanned at baseline and 5 years thereafter to confirm that the brain alterations detected in patients were caused by the pathology.
Image analysis
Lesions were segmented on FLAIR images and further filled on the T1-weighted images.
Structural data were pre-processed using FreeSurfer, yielding a custom-made cortical parcellation.
Probabilistic tractography was performed using MRtrix3 software 17 on corrected diffusion data to generate 10 million tracts within the brain mask for each subject using a single-shell response function calculated 18 to estimate the fibre-orientation distributions based on constrained spherical-deconvolution. 19 The number of tracts was reduced to 2 million via spherical-deconvolution informed filtering of the tractograms 20 to improve biological plausibility and reduce reconstruction bias. Finally, DTI data were mapped onto the atlas, which yielded a 166 × 166 structural connectivity matrix. Each element of the matrix represented the number of tracts for each participant normalized by the total number of tracts, to correct for differences in seed region size.
After preprocessing fMRI data, the average signal time courses were extracted from each of the 166 regions defined by the final atlas. FC matrices were calculated based on the Pearson correlation coefficients between the signals from all pairs of regions. The correlation coefficients were Fisher z-transformed to improve normality. As the physiological meaning of negative correlations is controversial, all such correlations were changed to zero21,22 (see Supplemental material).
Network analysis
Network analysis based on graph theory was performed using the Brain Connectivity Toolbox. 23
Centrality (degree and betweenness centrality), segregation (clustering coefficient) and integration (shortest path length) were assessed.
The degree of structural–functional coupling was assessed as the correlation coefficient between strengths of structural and functional networks (correlation between the connectivity matrices). For each subject, this correlation was constrained by edges of non-zero structural connectivity reflecting direct anatomical pathways. Non-zero structural connectivity connections were extracted to form a vector of structural connectivity values, which was further rescaled into a Gaussian distribution. A corresponding FC vector was then extracted. Finally, structural–functional coupling was computed by the Pearson’s coefficient of correlation between the two previous vectors.
Statistical analysis
Statistical analyses were performed using MATLAB 2016a (MathWorks, Inc., Natick, MA, USA) and SPSS 23.0 software (IBM Corp., Armonk, NY, USA).
The normality of the distribution of all continuous data was tested using the Shapiro–Wilk test. Non-parametric tests were used to analyse non-normally distributed data. Categorical variables (demographic and clinical parameters) were analysed with χ2 tests, and continuous variables with paired Student’s t-tests.
The evolution of the cognitive and MRI variables over time was evaluated using repeated-measures analysis of variance for parametric data or the Friedman test for non-parametric data. Post hoc paired Student’s t-test or the Wilcoxon rank-sum test was performed afterwards for any possible time period combination with Bonferroni correction.
The associations between cognitive changes and alterations in network parameters were investigated using linear mixed-effects models, with a random intercept term calculated for each patient. Cognitive z-scores were the dependent variables, and the altered network measures were the predictor variables. The predictive power of the model was assessed using the Bayesian information criterion (BIC). Covariates as age, sex, level of education and T2 lesion volume (LV) were further entered into the model to find out whether they could improve it. If not, the model without covariates was retained. P values < .05 were considered to indicate statistical significance after correcting for multiple models’ comparisons using the false discovery rate (FDR) correction.
Results
Characteristics of patients
The characteristics of the patients are shown in Table 1. According to the 2017 McDonald criteria, 87.5% of the patients (28/32) were diagnosed with definite MS at baseline, compared to 90.6% at both 1 year and 5 years (29/32). Of these patients, 46.9% were receiving disease-modifying therapy at the 1-year visit and 75% at the 5-year visit. For the record, according to the 2010 McDonald, all patients were CIS at baseline, 68.8% of them (22/32) were diagnosed with definite MS at 1 year and 84.4% (27/32) at 5 years.
Demographic, clinical and general magnetic resonance imaging data of the multiple sclerosis patients.

SD: standard deviation; EDSS: Expanded Disability Status Scale; DMT: disease-modifying treatment.
French baccalaureate/no French baccalaureate.
Wilcoxon test.
(Structural volume/total intracranial volume) × 100.
Paired t-test.
Comparison between baseline and 1-year follow-up: *p < 0.05; **p < 0.01.
Comparison between 1- and 5-year follow-ups: †††p < 0.001.
Comparison between baseline and 5-year follow-up: #p < 0.05.
Both the median EDSS score and the median T2 LV increased significantly between baseline (1.5 (range: 0–3) and 0.85 (range: 0.02–25.97), respectively) and 5 years (1.75 (range: 0–4) and 2.40 (range: 0.17–20.97), respectively).
After 1 year, the patients had developed global brain atrophy, with decreased whole-brain and white matter volumes compared to baseline (p < 0.05 and p < 0.01, respectively). White matter atrophy was present after 5 years, with a reduced volume of white matter observed compared to baseline (p < 0.05). Global grey matter volume did not change significantly over time.
Cognitive characteristics
Cognitive scores for IPS, EM and EF, but not WM changed over time as described in Table 2.
Cognitive z-scores.
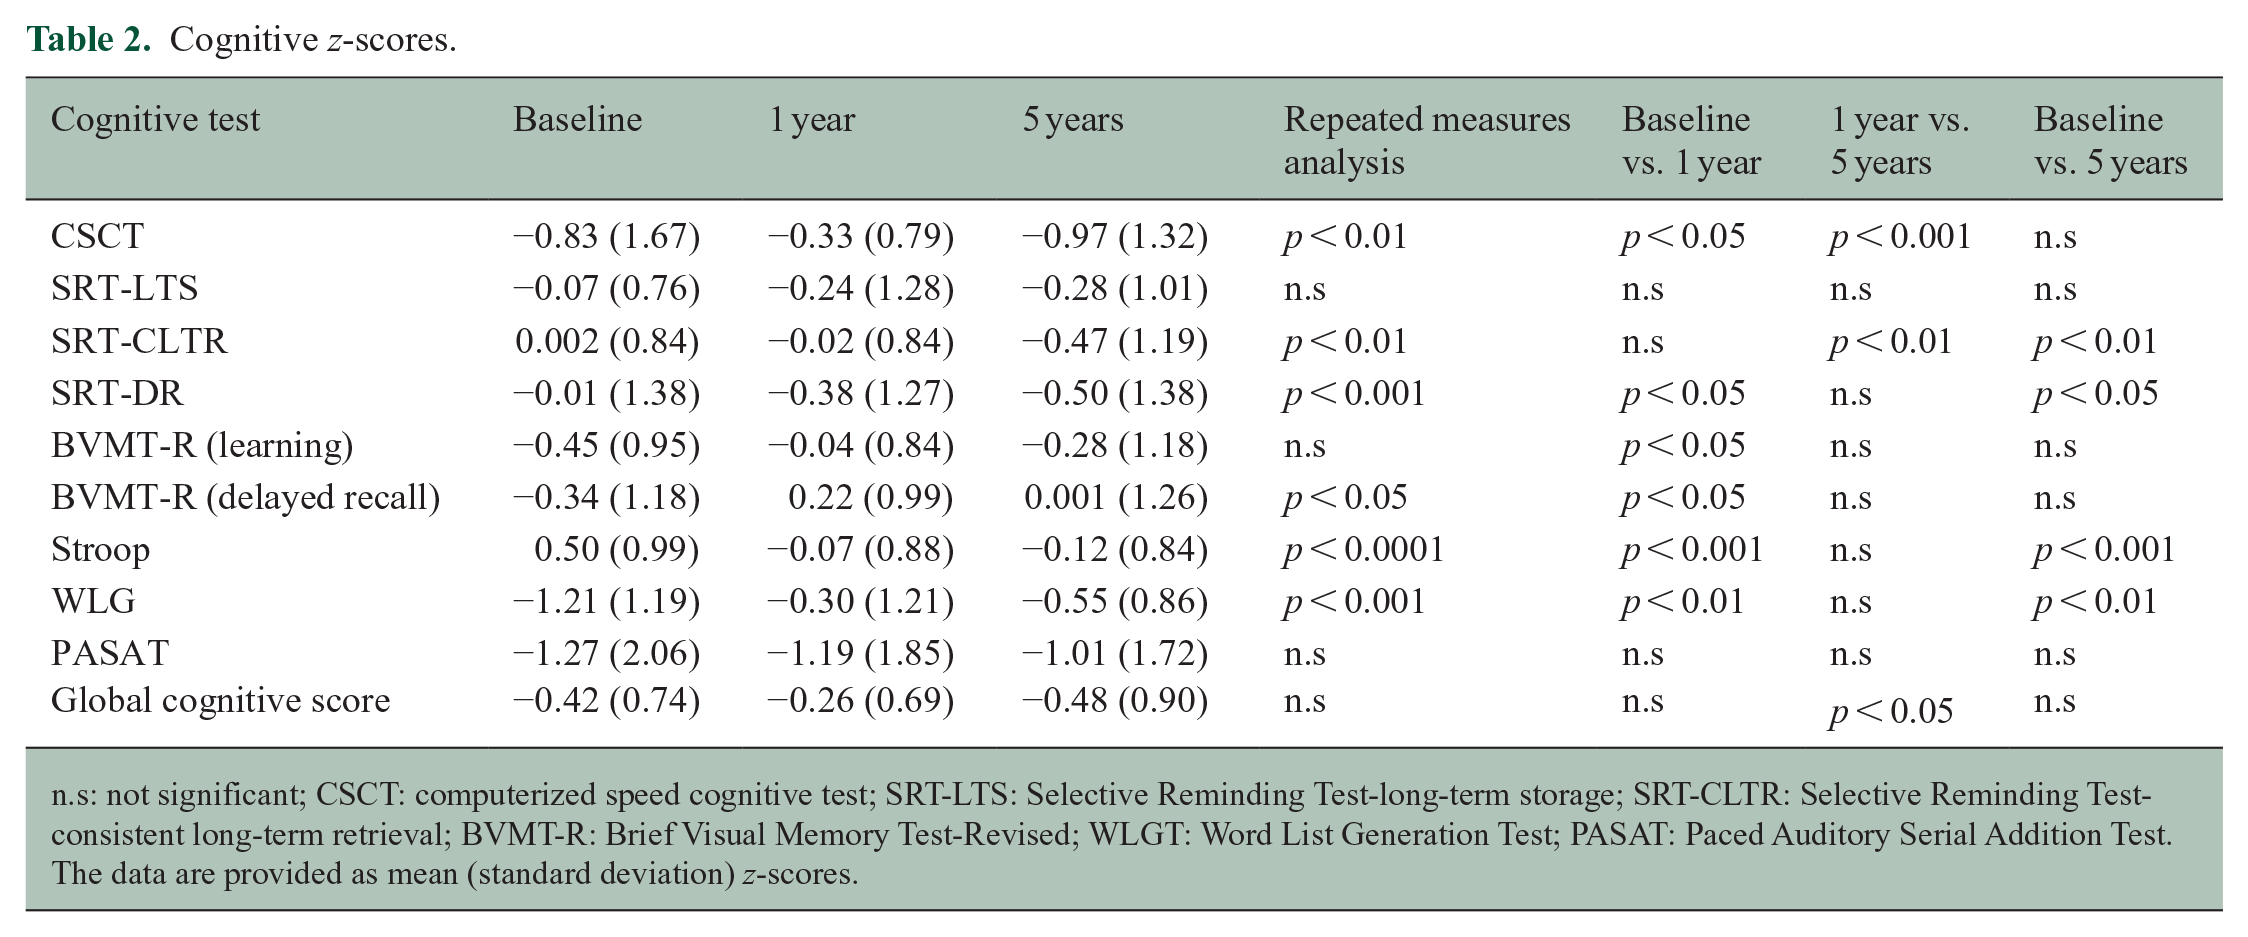
n.s: not significant; CSCT: computerized speed cognitive test; SRT-LTS: Selective Reminding Test-long-term storage; SRT-CLTR: Selective Reminding Test-consistent long-term retrieval; BVMT-R: Brief Visual Memory Test-Revised; WLGT: Word List Generation Test; PASAT: Paced Auditory Serial Addition Test.
The data are provided as mean (standard deviation) z-scores.
Structural network
There was a significant decrease in the number of connections during the first year of MS compared to baseline (p < 0.05; Figure 1(a)). After 5 years, the number of the structural connections was significantly greater compared to that at the 1-year visit, as was the clustering coefficient (p < 0.05 and p < 0.001 respectively; Figure 1(a) and (b), respectively). Characteristic path length was decreased after 5 years compared to both the 1-year and baseline visits (p < 0.001 for both; Figure 1(d)). Betweenness centrality at the 5-year follow-up visit was significantly lower than at baseline (p < 0.05; Figure 1(c)).
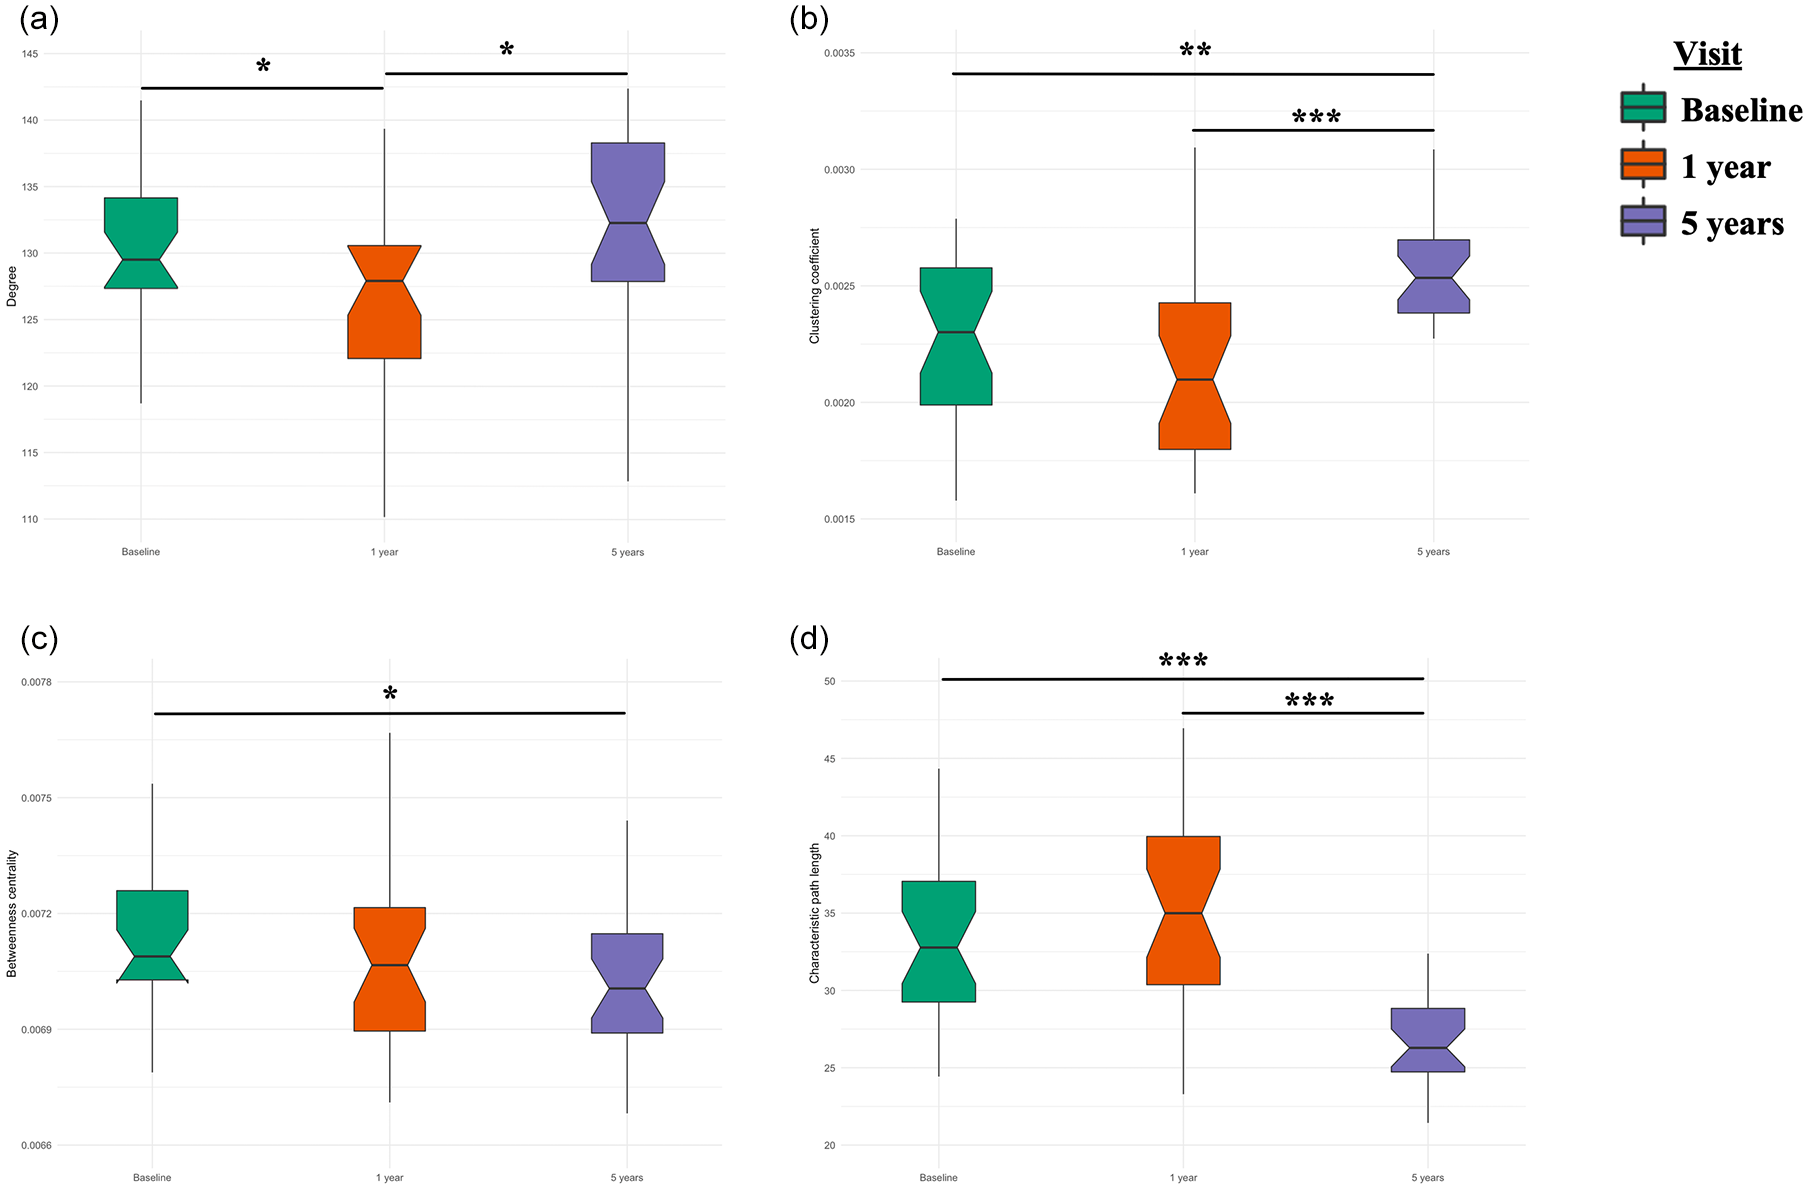
The evolution of structural brain network parameters over 5 years in multiple sclerosis (MS) patients: (a) degree centrality, (b) clustering coefficient, (c) betweenness centrality, and (d) characteristic path length.
Functional network
Global functional alterations were primarily seen after 5 years. The degree was significantly lower after 5 years than at the 1-year visit (p < 0.05; Figure 2(a)), while the characteristic path length was significantly shorter than at baseline (p < 0.05; Figure 2(d)). Neither the clustering coefficient nor betweenness centrality changed significantly over time.
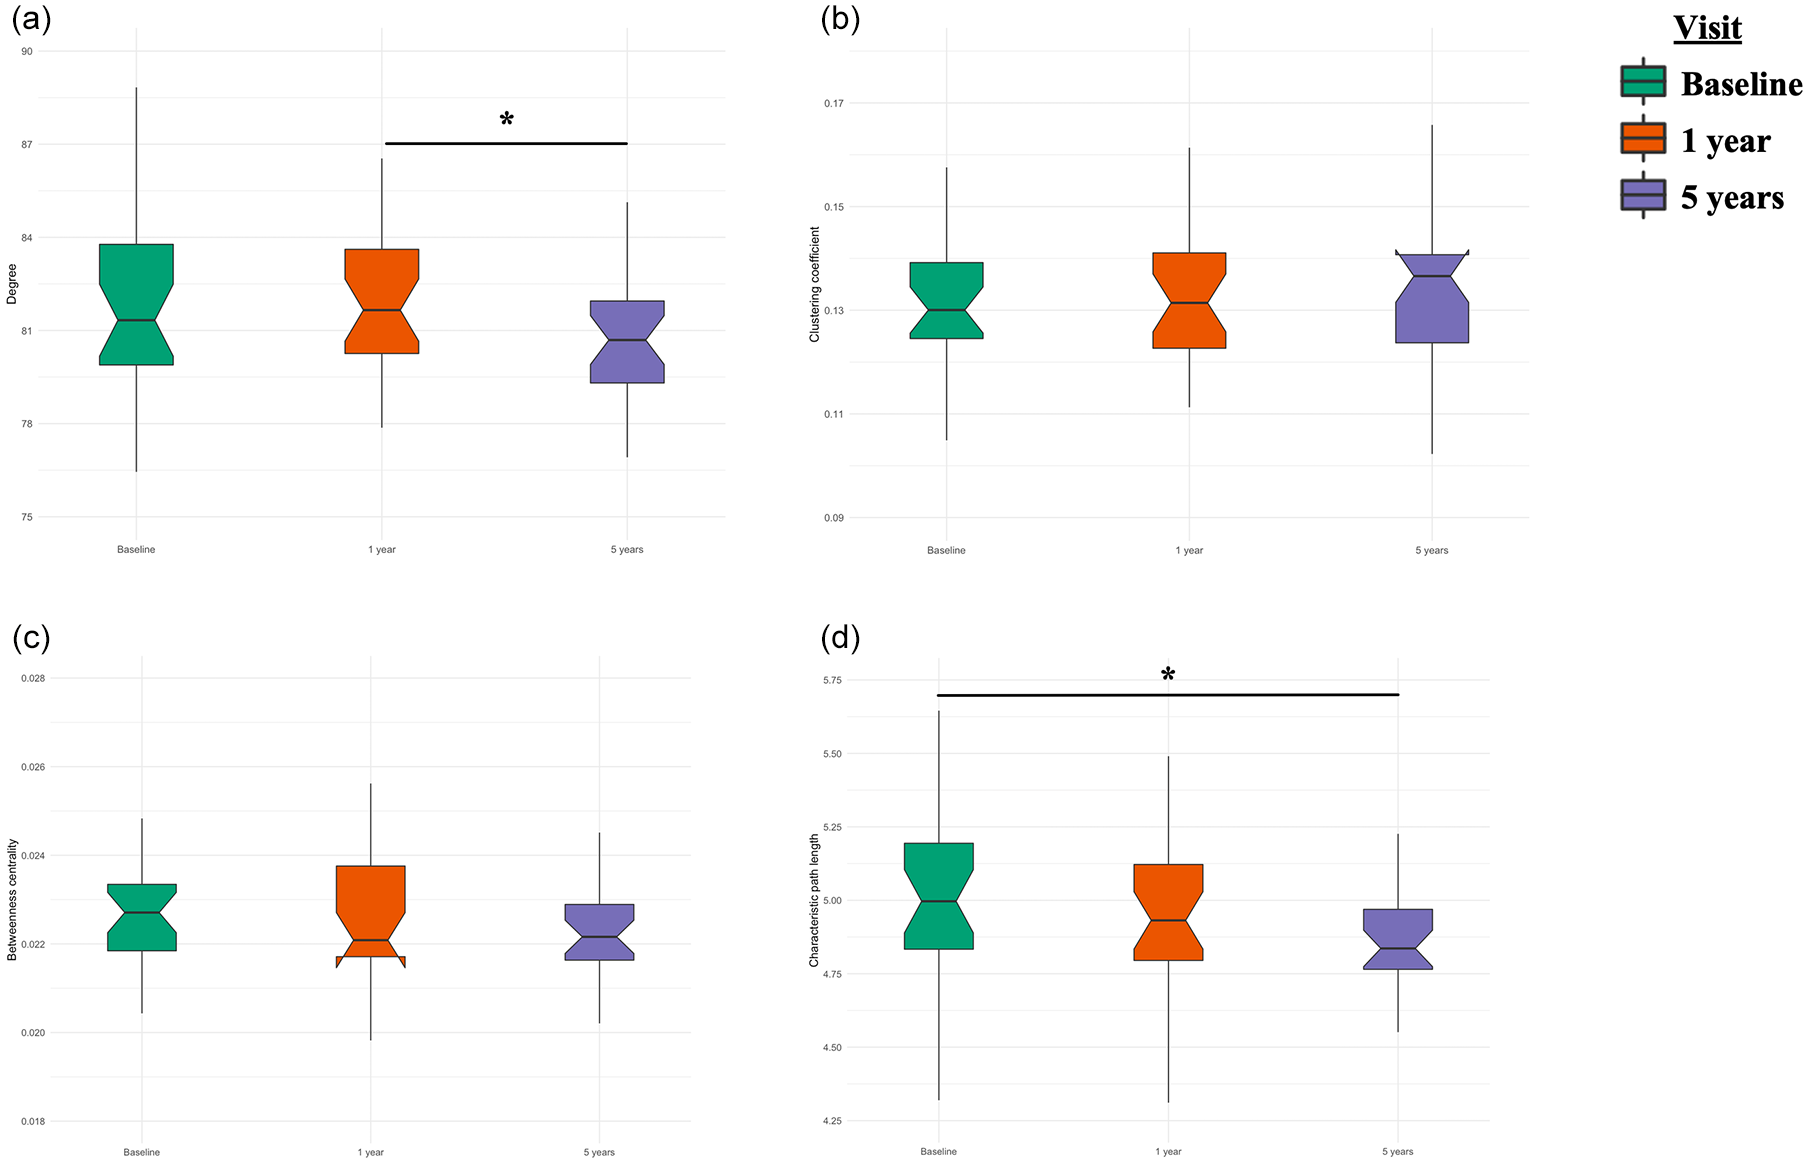
The evolution of functional brain network parameters over 5 years in MS patients: (a) degree centrality, (b) clustering coefficient, (c) betweenness centrality and (d) characteristic path length.
Structural–functional coupling
The degree of structural–functional coupling changed significantly over time (F = 3.74, p < 0.05), with a significant increase seen at the 5-year follow-up visit compared to the 1-year visit (p < 0.05; Figure 3).
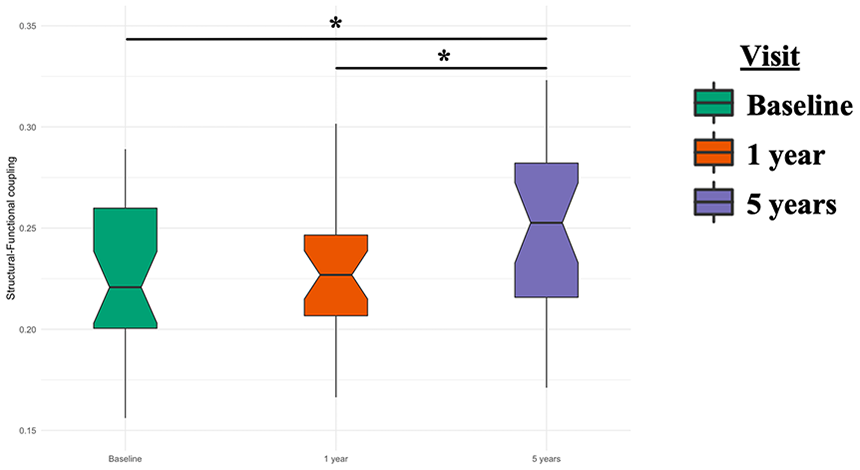
The evolution of structural–functional coupling over 5 years in MS patients.
HC group
There was no difference in structural or functional network parameters, or in the degree of structural–functional coupling, at 5 years compared to baseline.
Relationship between network changes and clinical/cognitive outcomes
The computerized speed cognitive test (CSCT) scores (denoting IPS) were well explained by the degree centrality of the structural network (estimate = −0.023, p < 0.05, BIC = 299.76). Adjustment for age, sex, level of education and T2 LV did not improve the model performance (BIC = 299.76 and 309.41 without and with covariates, respectively).
The SRT-CLTR scores (verbal EM) were significantly associated with structural–functional coupling (estimate = −4.60, p < 0.05, BIC = 235.48); a decline in performance was observed with increased coupling. Inclusion of the covariates did not improve the model (BIC = 235.48 and 244.87 without and with covariates, respectively).
Only structural–functional coupling explained the change in global cognitive score (estimate = −2.79, p < 0.05, BIC = 175.93), with stronger coupling predicting worse cognitive performance. Again, inclusion of the covariates did not improve the model (BIC = 175.93 and 186.01 without and with covariates, respectively).
Finally, clinical disability, as denoted by the EDSS score, was also associated only with structural–functional coupling (estimate = 6.29, p < 0.05, BIC = 251.93). Inclusion of the covariates did not improve the model (BIC = 251.93 and 266.39 without and with covariates, respectively).
Discussion
This study examined the structural and functional brain reorganization occurring over a 5-year period subsequent to CIS onset, and the associations thereof with cognitive performance.
We observed a significant increase in structural–functional coupling after 5 years, consistent with a reduced capacity for communication among brain regions and altered functional brain reconfiguration. This increase indicates a more constrained FC by the underlying anatomical pathways. The increase in structural–functional coupling was significantly associated with worse cognitive performance and greater disability over the course of the disease.
Coupling
While FC is not always constrained by the underlying anatomy, our study showed that the constraining effect was stronger on regions showing direct anatomical connections than on structurally unconnected regions. In a previous study investigating the same cohort, we explored structural–functional coupling during the first year following CIS onset and demonstrated that it was preserved at the whole-brain level. 7 However, structural–functional decoupling was observed within specific networks, in association with well-preserved cognitive function. Thus, a compensation phase (functional reorganization of certain indirect anatomical connections) may occur at this stage of the disease. In this study, we investigated the evolution of structural–functional coupling during the 5-year period following CIS onset and found that coupling had significantly increased by the 5-year follow-up. Such enhanced coupling has also been described in schizophrenia6,24,25 and Alzheimer’s disease, 26 and suggests greater constraint of FC by direct anatomical connections; this is consistent with a decreased capacity of the brain to reconfigure its FC networks, resulting in a more constrained brain function. Our results provide new insight into the brain mechanisms involved in early MS. Specifically, functional reorganization of indirect structural connections occurs during the first year following CIS onset, and may explain the preservation of cognitive performance during this early phase of MS. Structural damage progresses thereafter, before reaching a threshold at which functional reorganization is more constrained by the underlying anatomy (such that the brain shows less capacity for reconfiguration, ultimately disturbing cognitive performances).
Structural reorganization
Structural network alterations were apparent during the first year following CIS onset, and there were significantly fewer connections than at baseline. After 5 years, the number of connections was significantly higher than at the 1-year visit.
This finding is in line with the results of a previous study of patients with early MS, in whom the number of connections between the left and right thalami was higher than in HCs. 27 This potential structural plasticity, observed using DTI, was also reported in several of the MS rehabilitation studies recently reviewed. 28
The larger clustering coefficient and decrease in characteristic path length seen in our patients after 5 years may indicate a more clustered network with short-distance connections.
Functional reorganization
Brain functional network changes were detected at a global level after 5 years, as both the number of connections (degree) and the characteristic path length were significantly reduced. A decreased characteristic path length may represent stronger connections, mainly those that are local and of short distance. 29 We previously showed regional functional brain reorganization from the first year following a CIS, 30 probably as a compensation mechanism at that stage. As the disease progresses, the ability of the brain to reconfigure itself becomes more limited. Long-distance connections are known to be metabolically more expensive to maintain, 10 thus early MS patients’ functional network seems to favour the recruitment and strengthening of closer brain regions with disease progression.
Association to clinical disability and CI
We identified a clear association between changes in global cognitive performance and the progression of structural–functional coupling, with stronger coupling being associated with worse cognitive scores. This association was mainly seen in the context of verbal EM. Neurological disability was also associated with stronger coupling. We previously showed that preserved structural–functional coupling, along with functional reorganization, is responsible for the preservation of cognitive performance during the first year following CIS onset, suggesting a compensation mechanism. 7 However, the findings presented herein suggest that the brain’s capacity for reconfiguration of FC networks eventually diminishes sufficiently such that it cannot compensate for MS-related structural damage; this leads to worse cognitive performance and neurological disability during the early stage of the disease. The association seen between IPS (measured by the CSCT) and the number of structural connections (degree centrality), in which more connections correlated with slower IPS, also suggested that this structural plasticity could represent a maladaptive process.
Limitations
This study had several limitations. First, our DTI data were characterized by 21 non-collinear directions, representing a trade-off between resolution and scan time. In addition, our data were acquired on two different MRI scanners, although the scanning protocols were as similar as possible (same 21 non-collinear directions and resolution for the DTI data). The fMRI data were also acquired using the same acquisition parameters and number of runs. Moreover, fMRI data were recently shown to be highly comparable among different scanners. 31 Also, the HCs showed no differences in the network parameters of interest over the 5-year follow-up, supporting our conclusion that scanner type did not influence the observed structural changes. Second, only the FC over the entire scan was assessed. Future studies should seek to identify the dynamic properties of functional networks, where these likely depend on the underlying anatomy; 32 this was not within the scope of our investigation.
Our population included 10 HCs followed over 5 years. We acknowledge that this sample size is low which could limit the fact that there were no differences in this group. Importantly, this control group underwent the same procedure over time compared to patients which is scarce within the longitudinal studies in MS.
Conclusion
This study demonstrated an abnormal increase in structural–functional coupling 5 years after CIS onset, indicative of more constrained brain function (which was directly associated with the underlying anatomy). After a compensation period, increased coupling seems to lead to a network collapse, in turn resulting in worse cognitive performance and clinical disability. This study provides new insight into the mechanisms of brain network reorganization as important substrates of cognitive functioning in the early stage of MS, and the results could inform cognitive rehabilitation programmes.
Supplemental Material
sj-pdf-1-msj-10.1177_1352458520971807 – Supplemental material for Structural constraints of functional connectivity drive cognitive impairment in the early stages of multiple sclerosis
Supplemental material, sj-pdf-1-msj-10.1177_1352458520971807 for Structural constraints of functional connectivity drive cognitive impairment in the early stages of multiple sclerosis by Ismail Koubiyr, Mathilde Deloire, Bruno Brochet, Pierre Besson, Julie Charré-Morin, Aurore Saubusse, Thomas Tourdias and Aurélie Ruet in Multiple Sclerosis Journal
Footnotes
Acknowledgements
The authors thank the neurologists of the AQUISEP network for their involvement in recruiting patients. They also thank Dr JC Ouallet, Dr A Moroso and Dr P Louiset for referring patients to the study.
Competing interests
B.B. reports grants from the French Ministry of Health during the conduct of the study; personal fees and non-financial support from Biogen-idec, grants from Merck-Serono, personal fees and non-financial support from Novartis, personal fees and non-financial support from Genzyme, grants, personal fees and non-financial support from TEVA, grants and non-financial support from Bayer, outside the submitted work. A.R. reports grants from TEVA, during the conduct of the study; personal fees and non-financial support from Novartis, personal fees and non-financial support from Biogen, grants, personal fees and non-financial support from TEVA, grants and non-financial support from Roche, grants and non-financial support from Merck, grants and non-financial support from Genzyme, non-financial support from Medday, grants from Bayer, outside the submitted work.
Funding
The author(s) disclosed receipt of the following financial support for the research, authorship and/or publication of this article: This study was supported by the Translational Research and Advanced Imaging Laboratory (TRAIL), laboratory of excellence (ANR- 10-LABX-57). The SCI-COG study was also supported by a grant from TEVA and ARSEP (Fondation ARSEP pour la recherche sur la scle’rose en plaques). This work has been performed with the help of the French Observatoire of Multiple Sclerosis (OFSEP), which is supported by a grant provided by the French State and handled by the ‘Agence Nationale de la Recherche’, within the framework of the ‘Investments for the Future’ programme, under the reference no. ANR-10-COHO-002.
Supplemental material
Supplemental material for this article is available online.
References
Supplementary Material
Please find the following supplemental material available below.
For Open Access articles published under a Creative Commons License, all supplemental material carries the same license as the article it is associated with.
For non-Open Access articles published, all supplemental material carries a non-exclusive license, and permission requests for re-use of supplemental material or any part of supplemental material shall be sent directly to the copyright owner as specified in the copyright notice associated with the article.