
Abstract
Background:
Major depressive disorder (MDD) is common in multiple sclerosis (MS) and its incidence rises before MS diagnosis. However, the causality and direction of this association remain unclear.
Objective:
The objective is to investigate the bidirectional relationship between MS and MDD using Mendelian randomization (MR).
Methods:
We selected genetic instruments associated with risk of MDD (n = 660,937 cases; 1,453,489 controls) and MS (n = 47,429 cases; 68,374 controls). Using two-sample MR, we examined putative causal effects in either direction, with sensitivity analyses to assess pleiotropy. Also, we adjusted for body mass index (BMI) in multivariable MR.
Results:
We found no effect of genetic liability to MDD on the odds of MS (OR = 1.07/doubling in odds, 95% CI = 0.90–1.28). Similarly, our findings did not support a causal effect of genetic liability to MS on MDD (OR = 1.00/doubling in odds, 95% CI = 0.99–1.01). Despite heterogeneity, sensitivity analyses indicated that bias from pleiotropy was unlikely. Conversely, genetic predisposition toward higher BMI increased the odds of MS (OR = 1.34/SD increase, 95% CI = 1.09–1.65) and MDD (OR = 1.08, 95% CI = 1.01–1.15).
Conclusion:
This study does not support a causal association between MDD genetic liability and MS susceptibility, and vice versa. Genetic evidence suggesting commonality of obesity to both conditions may partly explain the increased incidence of depression pre-MS diagnosis.
Introduction
Psychiatric comorbidities, such as major depressive disorder (MDD), are common in multiple sclerosis (MS) and are associated with accelerated disability progression. 1 Individuals with comorbid MS and MDD have synergistically higher mortality rates compared to those with MDD or MS alone, 2 highlighting the importance of understanding this association. The precise reasons for the increased risk of depression in individuals with MS are unknown. The risk of psychiatric disorders, including MDD, rises as early as 5–10 years before MS diagnosis, 3 which may indicate shared genomic or environmental factors, or both, for MDD and MS. Although many previous studies were longitudinal, they could not fully elucidate whether MDD was a cause or consequence of MS (also termed “reverse causality”), or yet due to confounding. One approach to overcome these common challenges to causal inference in observational studies is Mendelian randomization (MR).
MR is a form of instrumental variable analysis that uses genetic variants to study the causal effect of an exposure on the risk of an outcome. 4 This approach limits residual confounding and reverse causation. Genetic variants are randomly allocated at conception; thus, genetic variants serve as a proxy for the exposure and minimize the effects of potential environmental confounders. 5 In addition, this design is robust to reverse causality as genotypes are not influenced by disease onset. Previous MR studies in MS have included assessments of, among others, the causal role of age at puberty 6 and body mass index (BMI). 7 These studies have provided orthogonal evidence in favor of or against causality for various factors on risk of MS, and indicate the feasibility of extending these approaches to other potential risk factors. In the reverse direction, inflammation is a known contributor to MDD (at least in a subset), 8 and a recent MR study found evidence for interleukin-6 playing a causal role on MDD risk, while bidirectional analyses suggested a limited role for a causal effect of genetic liability to MDD on interleukin-6 and other inflammatory markers (C-reactive protein, interleukin-1 receptor antagonist). 9
As MDD is a potentially modifiable risk factor, via the use of effective therapy, the identification of MDD as a causal risk factor for MS would highlight the need to actively identify and treat MDD in the general population. If MS were causally associated with MDD, this may highlight the need for therapies in MDD that target inflammation. Thus, we aimed to assess the existence and direction of a putative causal relationship between MDD and MS using MR. Second, we aimed to determine whether the bidirectional relationship between MDD and MS was independent of BMI, a known risk factor for MS and MDD.
Methods
Data sources and genetic instruments
MDD
We obtained genetic summary results for MDD using a recent genome-wide association study (GWAS) meta-analysis in 807,553 individuals (246,363 cases) from three cohorts: Psychiatric Genomics Consortium (PGC), UK Biobank, and 23andMe. 10 Additional replication was performed in an independent 23andMe cohort of 1,306,354 participants (414,574 cases). Depression was either self-declared (UK Biobank and 23andMe) or based on clinically diagnosed MDD (PGC), with a strong genetic correlation observed between data sets despite the different case definitions for depression (genetic correlation of 0.85–0.87). Overall, this case-control study identified 102 genome-wide significant single nucleotide polymorphisms (SNPs) contributing to risk of MDD.
To ensure the SNPs were independent (r2 < 0.01), we calculated the linkage disequilibrium (LD) between variants using the European subset of 1000 Genomes 11 and PLINK v1.9. Given the strength of the extended major histocompatibility complex (MHC) region with the risk of MS and its complex LD, SNPs within this region are susceptible to horizontal pleiotropy, where the genetic variants affect the outcome (MS) independent of the exposure. Therefore, we excluded MDD-associated SNPs that fell within base positions 24,000,000 to 35,000,000 on chromosome 6 (Genome Reference Consortium Human Build 37 [GRCh37]). 12 These filters led to the inclusion of 98 variants as genetic instruments to explore the effect of genetic liability to MDD on MS susceptibility (Dataset S1). Estimates for those SNPs were available for the combined meta-analysis and replication cohorts, totaling over 2 million participants (660,937 cases and 1,453,489 controls) (Table 1).
Summary of the phenotypes and genetic data used in each direction in the Mendelian randomization analysis.
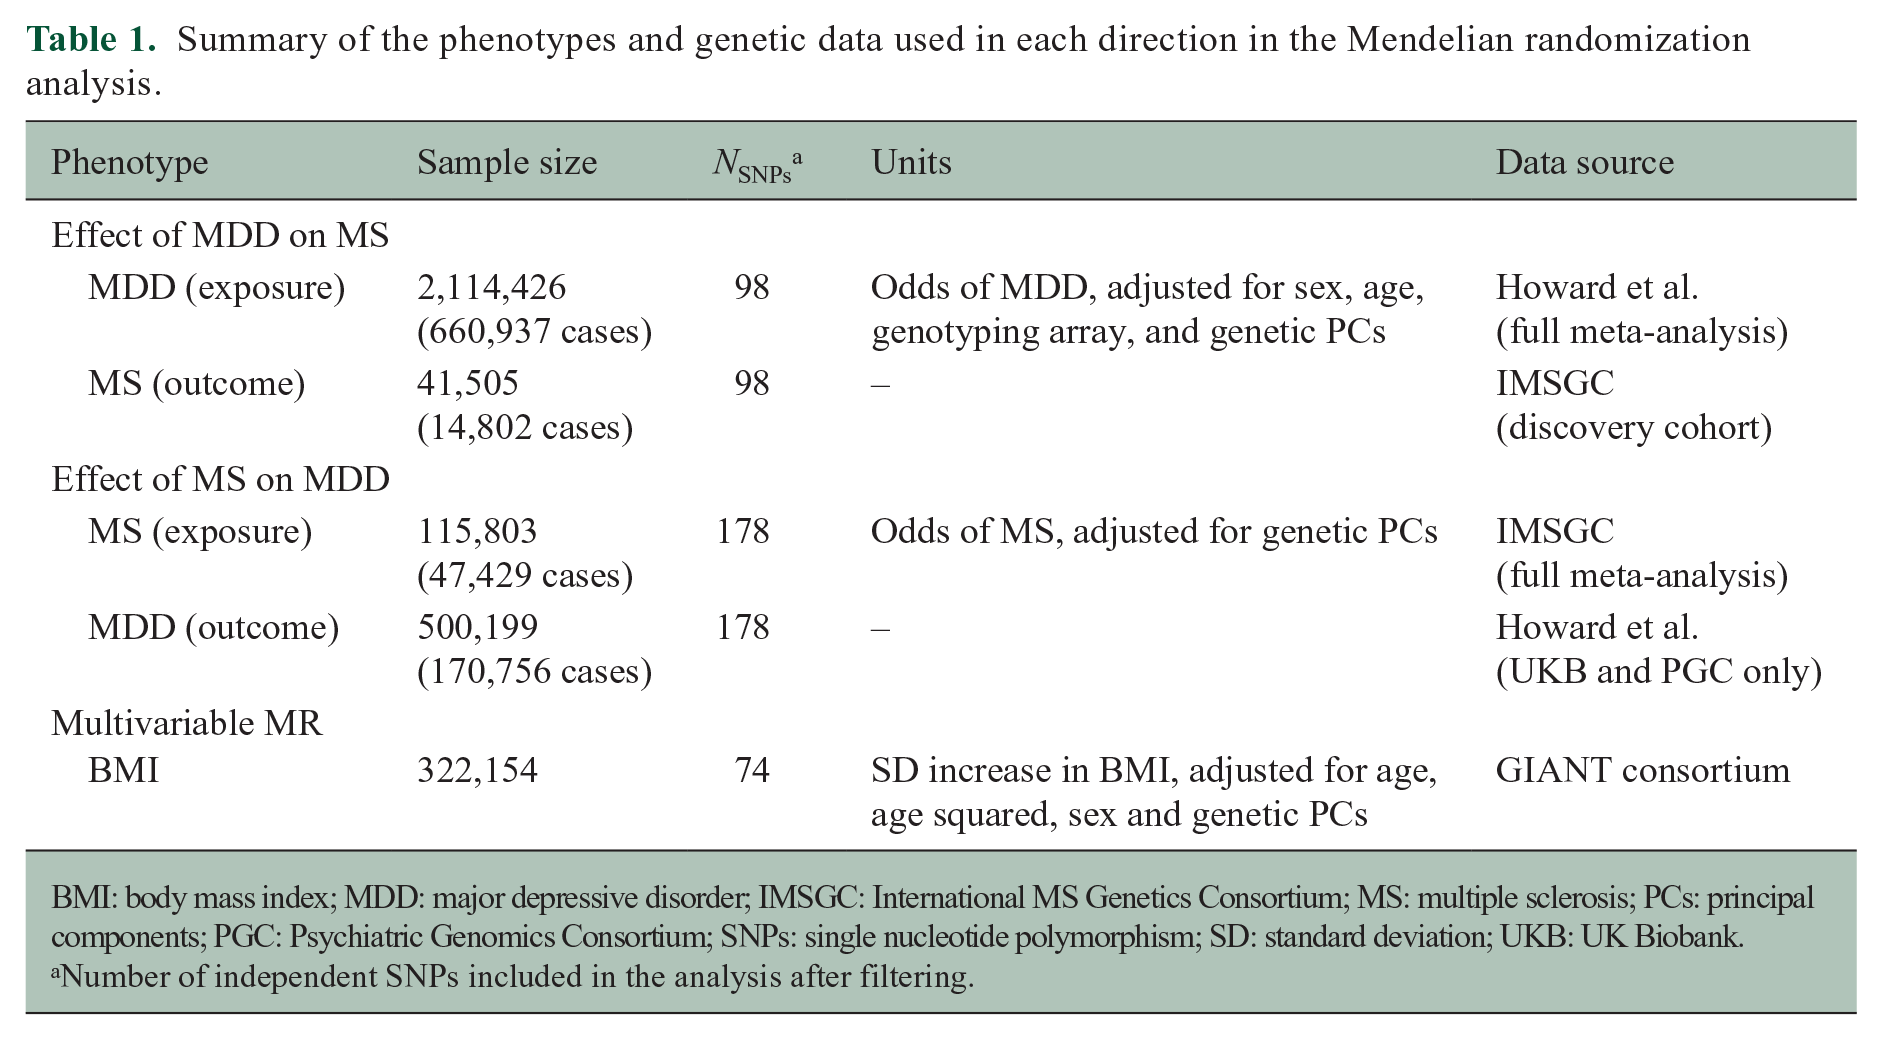
BMI: body mass index; MDD: major depressive disorder; IMSGC: International MS Genetics Consortium; MS: multiple sclerosis; PCs: principal components; PGC: Psychiatric Genomics Consortium; SNPs: single nucleotide polymorphism; SD: standard deviation; UKB: UK Biobank.
Number of independent SNPs included in the analysis after filtering.
In the other direction with MDD as the outcome, the genetic estimates were restricted to the PGC and UK Biobank cohorts owing to restricted access to genome-wide 23andMe data. Therefore, this analysis included 500,199 individuals (170,756 depression cases and 329,443 controls).
MS
Summary genetic estimates for MS were derived from the latest International MS Genetic Consortium GWAS meta-analysis, including 47,429 MS cases and 68,374 controls. 12 The participating cohorts are described in detail elsewhere. 12 A total of 233 MS-associated SNPs were identified. We selected independent variants (r2 < 0.01) as detailed above. When assessing the effect of genetic liability to MS as the exposure on MDD susceptibility, variants within the MHC were retained in the main analysis and a sensitivity analysis without those variants was performed. The SNP rs3135391 was used to tag HLA-DRB1*15:01, the strongest genetic risk allele for MS. 13 A total of 175 SNPs were included as genetic instruments for MS susceptibility (Table 1 and Dataset S2).
In the other direction with MS as the outcome, only genetic estimates from the discovery cohort were used (14,802 cases and 26,703 controls) as the replication data set did not provide genome-wide coverage.
BMI
Depression is genetically correlated with measures of obesity, 10 and higher BMI in turn is associated with increased odds of MS. 14 Therefore, we performed additional bidirectional analyses adjusting for BMI, using summary statistics from the GIANT Consortium on 322,154 individuals (Datasets S3 and S4). 15 We selected this GWAS as it did not include the UK Biobank, to limit participant overlap with the MDD data set. 16
The data sources used in this study obtained informed consent from all participants. Separate institutional review board approval was not required for this study. All participants were of European ancestry defined using genomic principal components. When a genetic variant was not present in a dataset, we identified a proxy SNP in strong LD (r2 > 0.8) using PLINK v1.9 and samples of European ancestry from 1000 Genomes phase 3. 11 All genetic variants were aligned to the forward strand. For GWAS not reported on GRCh37 (GIANT), forward strand alleles for palindromic SNPs were inferred for allele frequencies up to 0.42.
Statistical analysis
We performed bidirectional, two-sample MR using the inverse-variance weighted (IVW) approach as the main analysis to assess the association between MDD and MS. 17 For each direction of potential influence, we weighted the effect of each SNP on the outcome by its effect on the exposure via the Wald ratio method, with standard errors derived using the delta method. 18 These individual MR estimates were combined into a summary measure using random-effect inverse-variance weighted meta-analysis. 5 Effect estimates are reported in odds ratios (OR) per doubling in odds of the exposure by multiplying estimates by loge2 (~0.693), and corresponding 95% confidence intervals (CIs).
A key assumption of MR is that the genetic variants must not affect the outcome through pathways independent of the exposure, a phenomenon known as horizontal pleiotropy. To ensure that the results were not biased by horizontal pleiotropy, we performed a range of sensitivity analyses with complementary attributes. We formally examined for overall horizontal pleiotropy using the MR Pleiotropy RESidual Sum and Outlier (MR-PRESSO) Global test, and excluded outlier and thus potentially pleiotropic variants with the MR-PRESSO outlier test. 19 Second, we performed MR-Egger regression, a weighted linear regression allowing for the intercept to be estimated as a measure of average pleiotropic bias, as long as the pleiotropic effects are independent of the effect of the SNP on the exposure (InSIDE assumption). 20 Third, we performed a weighted median analysis, which provides robust estimates despite the presence of horizontal pleiotropy in a subset (<50%) of variants. 21 Consistent results across these analyses reduce the likelihood of bias.
In addition, we accounted for the effects of BMI in a multivariable MR in both directions, with the inclusion of 74 independent genome-wide significant variants associated with BMI added to the main exposure variants (MDD or MS, depending on the direction).
To ensure that MR estimates did not suffer from weak instrument bias, we generated F-statistics for each genetic instrument j using the formula

where
All statistical analyses were performed in R (version 4.0.0). We used the MendelianRandomization (version 0.4.2), MVMR (version 0.2) and TwoSampleMR (version 0.5.4) R packages. Statistical significance was set at p ⩽ 0.05.
Results
Effect of genetic liability to MDD on MS susceptibility
We found no evidence of an effect of genetic liability to MDD on the odds of MS (OR = 1.07 per doubling in odds of MDD, 95% CI = 0.90–1.28, p = 0.43). We identified significant heterogeneity across the 98 genetic variants used to instrument MDD (MR-PRESSO global test p < 1 × 10⁻⁴). However, the exclusion of two outlier variants did not influence the main result (Figure 1). Similarly, the MR-Egger intercept was centered around the null and showed no evidence of directional pleiotropy (intercept = −0.003, p = 0.78). Moreover, pleiotropy-robust methods (MR-Egger and weighted median) and multivariable MR analysis adjusting for genetic effects of BMI yielded consistent MR estimates showing no causal effect of genetic liability to MDD on odds of MS (Figures 1 and 2). Conversely, the same multivariable MR regression provided evidence that genetic predisposition toward higher BMI increased the odds of MS (OR = 1.34 per standard deviation [SD] increase in BMI, 95% CI = 1.09–1.65, p = 0.005).
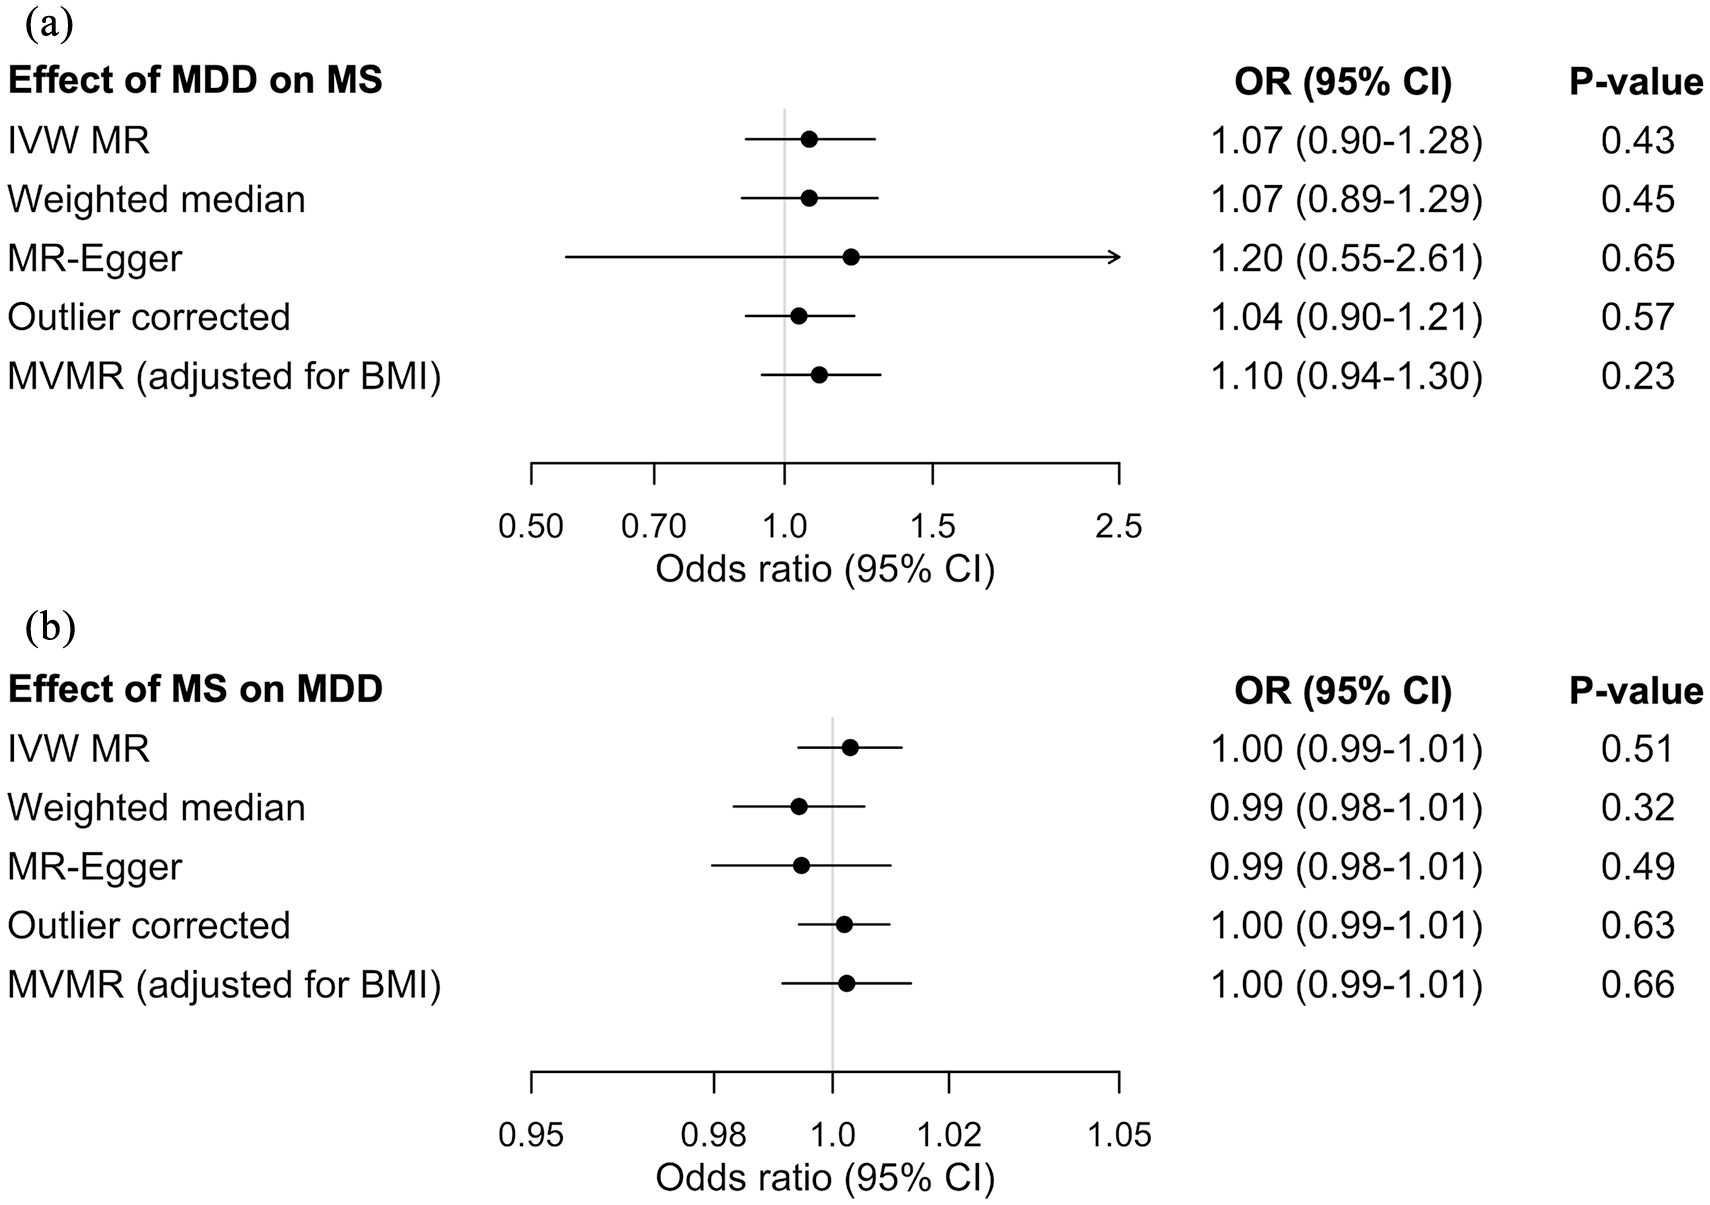
Forest plots showing the bidirectional MR estimates investigating the association between MDD and MS. (a) Effect of genetic liability to MDD on MS. (b) Effect of genetic liability to MS on MDD. Odds ratio are per doubling in odds of the exposure.
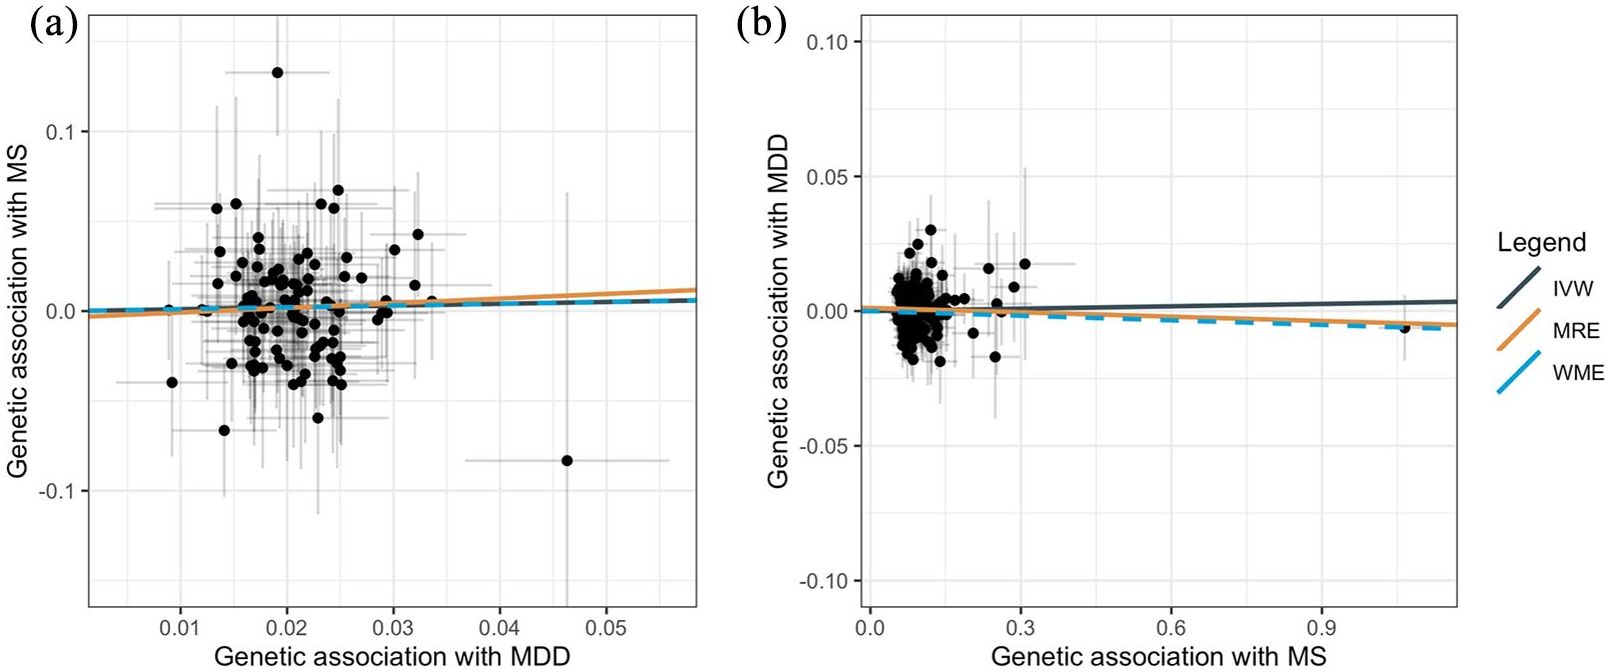
Scatterplots for bidirectional MR of MDD with MS. Scatterplots showing the genetic estimates for the outcome along the y axis against the estimates for the exposure along the x axis (log odds ratio with 95% CI). (a) Effect of genetic liability to MDD on odds of MS. (b) Effect of genetic liability to MS on odds of MDD. The slope of each line represents the MR estimate for the corresponding method.
Effect of genetic liability to MS on MDD susceptibility
In the other direction, we also found no evidence of a causal association between MS and odds of MDD (OR = 1.00 per doubling in odds of MS, 95% CI = 0.99–1.01, p = 0.51). The exclusion of MHC variants, including a tagging SNP for HLA-DRB1*1501 (rs3135391), resulted in similar findings (OR = 1.01 per doubling in odds of MS, 95% CI = 1.00–1.01, p = 0.16). While the MR-PRESSO global test again showed significant heterogeneity (p < 1 × 10⁻⁴), the exclusion of outliers did not influence the MR estimate (Figure 1). The MR-Egger intercept was consistent with a lack of directional pleiotropy (intercept = 0.001, p = 0.19). Additional MR estimates from MR-Egger and weighted median were consistent with the inverse-variance weighted method (Figures 1 and 2). Last, multivariable MR accounting for genetic effects of BMI showed that BMI, but not MS, influenced the odds of MDD (OR = 1.08 per SD increased in BMI, 95% CI = 1.01–1.15, p = 0.02).
Discussion
In employing a two-sample MR approach to assess the existence and direction of a putative causal relationship between MDD and MS, this study did not find any evidence to suggest that genetic liability to MDD is associated with MS risk, nor was genetic liability to MS associated with MDD. These findings were further evaluated using multivariable MR analyses to account for the putative confounding role of BMI, a risk factor common to MS and MDD. Again, the results did not support a causal association between MDD and MS in either direction. In contrast, the multivariable MR analyses showed a clear effect of higher BMI on increased odds of both MS and MDD, with a stronger magnitude for MS. The contribution of obesity to both conditions may partly explain the increased incidence of depression pre-MS diagnosis. This result also suggests that failure to account for obesity measures may lead to confounding in observational studies seeking to determine the etiology of MDD in MS.
The relationship between MS and MDD is complex, with evidence from observational studies supporting an increased incidence rate of MDD before and after MS onset. A Danish study including 5084 MS patients and 24,771 matched controls found an increased risk of MDD (OR = 1.4, 95% CI = 1.18–1.62) and for redeeming a tricyclic antidepressant prescription (OR = 1.90, 95% CI = 1.54–2.34) in the 2 years pre-MS diagnosis. 24 The increased incidence of psychiatric disorders is observed as early as a decade before MS diagnosis. 3 In MS, the lifetime prevalence of MDD is as high as 50%. 25 In a population-based Canadian study including 44,452 MS cases and 220,849 year of birth-, sex- and geographically matched controls, the age-standardized incidence of MDD was 71% higher among MS cases compared to matched controls. 26 The increased incidence of MDD in the pre-MS diagnosis period could represent a prodrome, whereby inflammation has occurred sufficiently for MDD to manifest but not for MS to manifest, since inflammation has been shown to increase risk for psychiatric conditions on their own. 27 Last, a common biological basis may exist for the co-occurrence of MDD and MS, such as shared genetic factors. Small family studies have shown a hereditary association between MS and MDD, 28 although one large study investigating genetic correlations between various neurological and psychiatric phenotypes did not find a correlation between MS and MDD. 29 Of note, the GWAS data used to measure these genetic correlations were older with much smaller sample sizes than this study.
Nonetheless, the current MR study did not identify any evidence for a bidirectional causal relationship between MS and MDD, suggesting that this association could be in part driven by confounders, including but not limited to obesity. In accordance with our findings, previous MR studies found evidence in support of elevated BMI as a risk factor in both MS 14 and MDD. 30 Alternatively, the existence of an inflammatory MDD subtype in MS or an MDD subtype specific to people with MS, which would not be fully captured by the genetic variants for depression in the general population used herein, remains possible following our findings. In addition, genetic determinants of MS susceptibility are likely distinct from mechanisms underlying MS disease activity and severity. 31 Therefore, our findings are most relevant up to the time point of MS disease onset, and do not exclude a putative causal role of subsequent inflammatory activity or structural brain changes on risk of MDD in prevalent MS cases. Indeed, inflammation in general is a known contributor to depression, 8 and a recent study found evidence for interleukin-6 playing a causal role on MDD risk. 9 Interleukin-6 is an inflammatory marker whose levels are also elevated in MS. 32
A strength of this study is the use of genetic data from exceptionally large GWAS, which when considering our investigation of the effects of MDD on MS, included >2,100,000 individuals, of whom 14,802 had MS and >600,000 had MDD. Another strength is the use of MR analysis, a method able to overcome common sources of bias in observational studies (residual confounding and reverse causality) as well as the application of extensive sensitivity analyses intended to assess the validity of included analytic assumptions. We also acknowledge several limitations. First, there was significant heterogeneity between the different genetic instruments in both directions, which suggests that at least some of the variants have pleiotropic effects. However, the MR-Egger intercept showed no evidence of directional pleiotropy and the MR estimates from additional sensitivity analyses were consistent with the null finding, meaning that substantial bias due to pleiotropy is unlikely. Second, although men with MS have disproportionally higher incidence of MDD as compared to men without MS than women with MS as compared to women without MS, 33 the current summary-level data available are not amenable to performing sex-specific analyses. A sex-stratified GWAS of MDD found only one significant genetic variant associated with MDD in males, 34 while there has not been a large-scale sex-stratified GWAS of MS performed yet. Third, the magnitude of the MR estimates derived using binary exposures should be interpreted as reflecting the effects of the genetic liability to the exposure rather than its presence or absence. 35 However, this still allows for reliable testing of the causal null hypothesis. 35
Our study did not provide support for a causal association between increased genetic liability to MDD and the odds of developing MS, and vice versa, thus suggesting that MDD is not an ideal modifiable risk factor for MS. While this study focused on MS susceptibility rather than disease course, the need to actively identify and treat MDD in MS remains an important clinical objective, as those with MS and comorbid MDD have worse outcomes than those with MS and without MDD. Moreover, we provide additional genetic support for a causal role of obesity on the risk of both MDD and MS, suggesting that targeting obesity may be an effective prevention strategy for both conditions.
Supplemental Material
sj-docx-1-msj-10.1177_1352458521993075 – Supplemental material for Mendelian randomization provides no evidence for a causal role in the bidirectional relationship between depression and multiple sclerosis
Supplemental material, sj-docx-1-msj-10.1177_1352458521993075 for Mendelian randomization provides no evidence for a causal role in the bidirectional relationship between depression and multiple sclerosis by Adil Harroud, Ruth Ann Marrie, Kathryn C Fitzgerald, Amber Salter, Yi Lu, Mitulkumar Patel and Kaarina Kowalec in Multiple Sclerosis Journal
Supplemental Material
sj-xlsx-2-msj-10.1177_1352458521993075 – Supplemental material for Mendelian randomization provides no evidence for a causal role in the bidirectional relationship between depression and multiple sclerosis
Supplemental material, sj-xlsx-2-msj-10.1177_1352458521993075 for Mendelian randomization provides no evidence for a causal role in the bidirectional relationship between depression and multiple sclerosis by Adil Harroud, Ruth Ann Marrie, Kathryn C Fitzgerald, Amber Salter, Yi Lu, Mitulkumar Patel and Kaarina Kowalec in Multiple Sclerosis Journal
Supplemental Material
sj-xlsx-3-msj-10.1177_1352458521993075 – Supplemental material for Mendelian randomization provides no evidence for a causal role in the bidirectional relationship between depression and multiple sclerosis
Supplemental material, sj-xlsx-3-msj-10.1177_1352458521993075 for Mendelian randomization provides no evidence for a causal role in the bidirectional relationship between depression and multiple sclerosis by Adil Harroud, Ruth Ann Marrie, Kathryn C Fitzgerald, Amber Salter, Yi Lu, Mitulkumar Patel and Kaarina Kowalec in Multiple Sclerosis Journal
Supplemental Material
sj-xlsx-4-msj-10.1177_1352458521993075 – Supplemental material for Mendelian randomization provides no evidence for a causal role in the bidirectional relationship between depression and multiple sclerosis
Supplemental material, sj-xlsx-4-msj-10.1177_1352458521993075 for Mendelian randomization provides no evidence for a causal role in the bidirectional relationship between depression and multiple sclerosis by Adil Harroud, Ruth Ann Marrie, Kathryn C Fitzgerald, Amber Salter, Yi Lu, Mitulkumar Patel and Kaarina Kowalec in Multiple Sclerosis Journal
Supplemental Material
sj-xlsx-5-msj-10.1177_1352458521993075 – Supplemental material for Mendelian randomization provides no evidence for a causal role in the bidirectional relationship between depression and multiple sclerosis
Supplemental material, sj-xlsx-5-msj-10.1177_1352458521993075 for Mendelian randomization provides no evidence for a causal role in the bidirectional relationship between depression and multiple sclerosis by Adil Harroud, Ruth Ann Marrie, Kathryn C Fitzgerald, Amber Salter, Yi Lu, Mitulkumar Patel and Kaarina Kowalec in Multiple Sclerosis Journal
Footnotes
Acknowledgements
The authors thank the IMSGC and the PGC for access to their summary statistics data.
Declaration of Conflicting Interests
The author(s) declared no potential conflicts of interest with respect to the research, authorship, and/or publication of this article.
Funding
The author(s) disclosed receipt of the following financial support for the research, authorship, and/or publication of this article: A.H. was supported by the NMSS-ABF Clinician Scientist Development Award from the National Multiple Sclerosis Society and the Multiple Sclerosis Society of Canada (FAN-1808-32256). R.A.M. was supported by the Waugh Family Chair in Multiple Sclerosis and a Manitoba Research Chair. K.C.F. was supported by the NMSS Career Transition Fellowship (TA-1805-31136) and NIH/NIMH K01 (1K01MH121582-01). K.K. received funding from the University of Manitoba.
Supplemental material
Supplemental material for this article is available online.
References
Supplementary Material
Please find the following supplemental material available below.
For Open Access articles published under a Creative Commons License, all supplemental material carries the same license as the article it is associated with.
For non-Open Access articles published, all supplemental material carries a non-exclusive license, and permission requests for re-use of supplemental material or any part of supplemental material shall be sent directly to the copyright owner as specified in the copyright notice associated with the article.