
Abstract
Background:
Gait in people with multiple sclerosis (PwMS) is affected even when no changes can be observed on clinical examination. A sensitive measure of gait deterioration is stability; however, its correlation with motor tract damage has not yet been established.
Objective:
To compare stability between PwMS and healthy controls (HCs) and determine associations between stability and diffusion magnetic resonance image (MRI) measures of axonal damage in selected sensorimotor tracts.
Methods:
Twenty-five PwMS (Expanded Disability Status Scale (EDSS) < 2.5) and 15 HCs walked on a treadmill. Stability from sacrum (LDESAC), shoulder (LDESHO) and cervical (LDECER) was calculated using the local divergence exponent (LDE). Participants underwent a 7T-MRI brain scan to obtain fibre-specific measures of axonal loss within the corticospinal tract (CST), interhemispheric sensorimotor tract (IHST) and cerebellothalamic tract (CTT). Correlation analyses between LDE and fibre density (FD) within tracts, fibre cross-section (FC) and FD modulated by FC (FDC) were conducted. Between-groups LDE differences were analysed using analysis of variance (ANOVA).
Results:
Correlations between all stability measures with CSTFD, between CSTFDC with LDESAC and LDECER, and LDECER with IHSTFD and IHSTFDC were significant yet moderate (R < −0.4). Stability was significantly different between groups.
Conclusions:
Poorer gait stability is associated with corticospinal tract (CST) axonal loss in PwMS with no-to-low disability and is a sensitive indicator of neurodegeneration.
Introduction
Alteration of gait patterns is a common sign of sensorimotor deterioration in people with multiple sclerosis (PwMS) even at early stages of the disease when changes in walking performance are not clinically evident.1–3 To date, some of these changes have only been observed using sophisticated motion capture or electromyography systems, measures and methods.1,4 Apart from kinematic changes identified in the early stages of MS using motion capture, other variables, such as gait stability, can be measured using acceleration of retro-reflective markers or inertial sensors. Nevertheless, the most appropriate gait metrics that reflect the underlying neurodegeneration are still to be determined and validated using accepted gold standard methods (motion capture). 5
To date, several publications investigating gait impairments and deterioration in PwMS have employed non-linear measures of walking.6–13 Different to linear metrics (e.g. step length), non-linear measures are used to understand dynamic features of walking, such as variability, complexity and stability. Such measures are more likely to better reflect the adaptability of the neuromuscular system than more commonly used measures, for example, speed during a timed 25-foot walking test (T25FWT). 14 Along this line, a recent study found that, gait metrics, such as stability and regularity, are more relevant than speed and endurance to explain self-reported walking ability in PwMS. 10
Recent studies suggest that the local dynamic stability (LDE; Lyapunov exponent; or local divergence exponent, LDE) can detect subtle changes in walking stability in people with low Expanded Disability Status Scale (EDSS) scores.6–9,15 The LDE measures the exponential divergence rate of a signal, for example, acceleration from a marker or inertial sensor, and reflects the ability of the balance control system to deal with step-to-step perturbations. 16 In brief, the larger the LDE value, the more unstable the gait pattern is. The LDE has been found to be associated to history of falls, able to predict the risk of falling13,17 and is also responsive to physiotherapy interventions in PwMS. 11
The clinical progression of motor deterioration in PwMS has been associated with axonal loss, particularly in the corticospinal tract (CST). 18 An association between falls and magnetic resonance image (MRI) measures has also been observed, linking brain structural damage (left hippocampal and putamen volumes) with increased gait variability. 19 A more recent diffusion-weighted MRI study by Strik et al. 20 found an association between poorer performance in a lower limb tracking task and spatiotemporal gait measures (e.g. stride length) and reduced density and cross-sectional area of corticospinal and interhemispheric sensorimotor tracts (IHSTs). However, the association between motor tract damage and more dynamic measures of gait, such as the LDE, has not yet been established.
The aim of this study was to compare stability between PwMS and healthy controls (HCs), and to determine the association between measures of gait stability and motor tract damage in PwMS with no evident gait changes on standard clinical examination and at early stages of the disease. A secondary aim was to determine the association between gait stability and more standard volumetric measures of the brain. Associations between stability and sensorimotor tracts damage will provide evidence of the potential mechanisms underlying gait deterioration and may assist in the development of more targeted interventions to maintain, restore or improve gait function.
Methods
Subjects
Twenty-five people (n = 25) with relapsing–remitting MS (PwMS) were recruited if they met the following inclusion criteria: (a) < 15 years since clinically diagnosed disease onset using McDonald’s criteria; 21 (b) aged > 18 years; and (c) EDSS < 4.0. The criteria for exclusion were (a) neurological conditions other than MS; (b) cardiovascular disease; and (c) orthopaedic conditions. Fourteen HCs were recruited for the stability measures comparisons if they had no neurological or orthopaedic conditions and were > 18 years. Relevant demographic and clinical data are presented in Table 1. This study was approved by the Melbourne Health Human Research Ethics Committee (2015.144). All participants provided signed informed consent prior to participation.
Demographics and clinical characteristics of the participants.
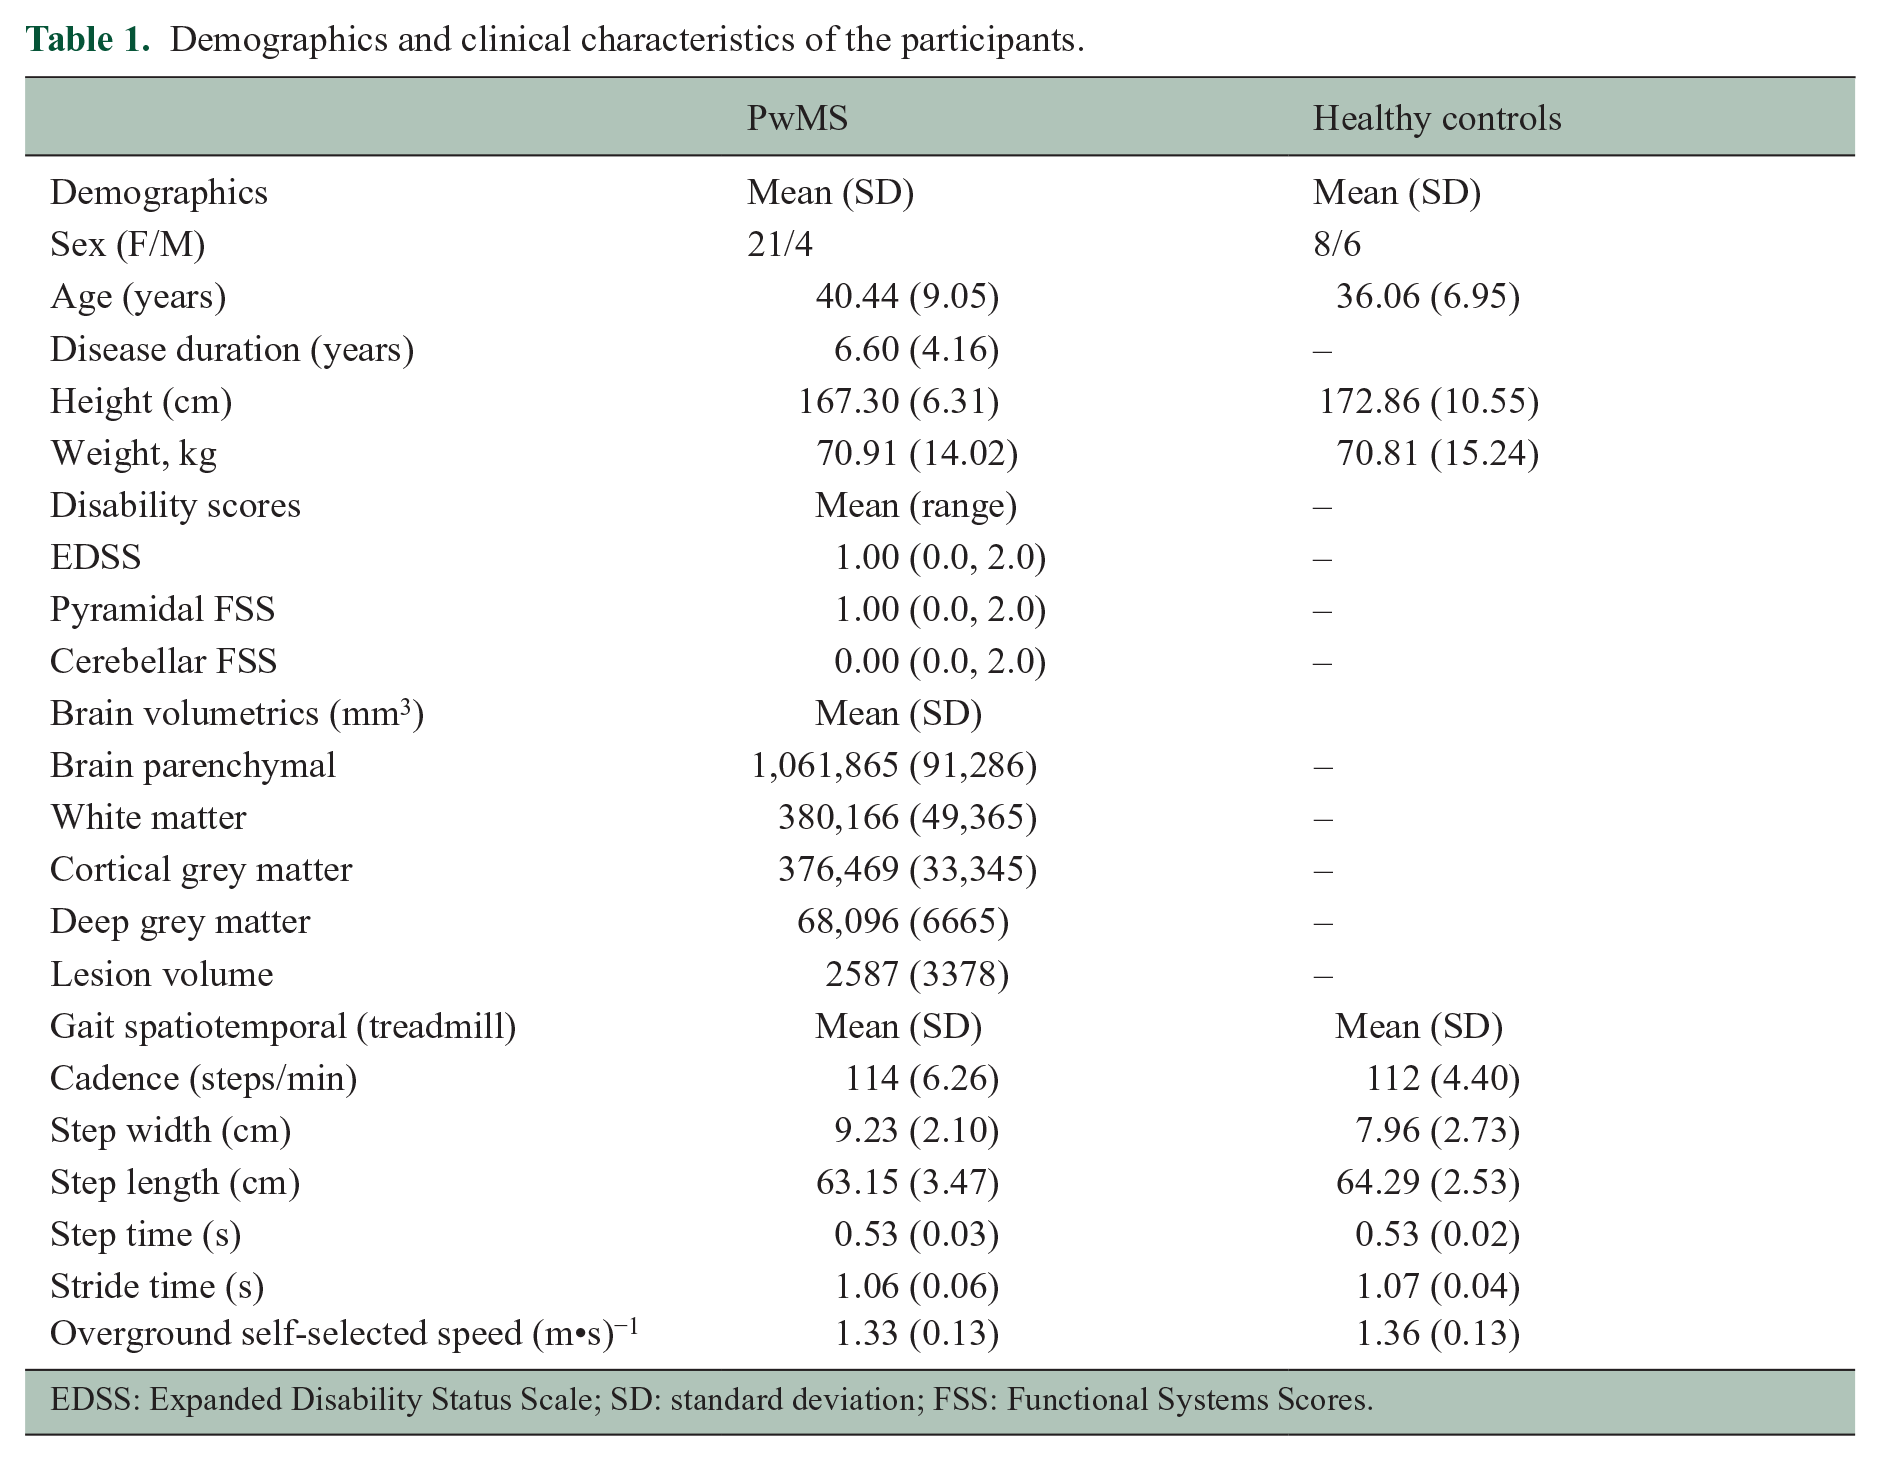
EDSS: Expanded Disability Status Scale; SD: standard deviation; FSS: Functional Systems Scores.
Gait measures
An eight-camera three-dimensional (3D) infrared motion capture system (Vicon MX, Oxford, UK) was used to record participants walking at 200 Hz. Reflective spherical markers were placed on specific body landmarks using the Plug-in-Gait model (Vicon, Oxford, UK). Participants were requested to walk on a Biodex RTM600 treadmill (Shirley, NY, USA) for 5 minutes. The length of the trial was selected to obtain a minimum of 150 consecutive strides at a fixed 1.2 ms−1 speed, which is considered a minimum ‘normal’ walking speed regardless of anthropometrics, age and gender. 22 Marker kinematics were recorded on Vicon Nexus 2 and data exported as text files for further processing. We also recorded three overground walking trials to determine self-selected speed using sacrum markers. Speed was calculated over the central 3 m of a 12 m walkway.
Acceleration in each plane was calculated for the mid-shoulder (average between left and right shoulder marker positions; SHO) and sacrum (average between left and right posterior-superior iliac spine marker positions; SAC) and a marker at the seventh cervical vertebra (CER). Data from feet marker kinematics were used to calculate gait cycle events (heel contact and toe-off) for the whole trial. To normalize data across subjects, acceleration data for a total of 150 gait cycles (strides) were selected for each participant. To assess gait stability, we used the short-term LDE, with 3D acceleration for trunk and sacrum normalized to n strides × 100 data points, separately for each marker, as inputs. 8 To calculate the LDE, we reconstructed the state-space utilizing nine dimensions (ω = 9) composed of the original copy plus two copies each delayed by (τ) 10 samples from the previous, and used the Rosenstein’s algorithm within the 0–1 stride range (LDE short term). 8 These steps were repeated for each of the marker accelerations of interest (LDESHO, LDESAC and LDECER). Standard spatiotemporal measures such as step time, step width, stride time and cadence were also calculated. All gait data analyses were performed in Matlab R2020b (MathWorks, Natick, MA, USA).
MRI acquisition
PwMS were scanned using a whole-body Siemens MAGNETOM ultra-high field (7Tesla) MRI system (Siemens Healthcare, Erlangen, Germany) with a combined single-channel transmit and 32-channel receive head coil (Nova Medical, Wilmington, MA, USA). Diffusion-weighted imaging (DWI) was acquired at a high resolution (1.24 mm isotropic) using a simultaneous multi-slice two-dimensional spin-echo echo-planar imaging sequence, based on a published sequence with the following parameters: repetition time (TR) = 7000 ms, echo time (TE) =72.4 ms, flip angle (FA) = 90°/180°, GRAPPA-phase acceleration factor = 3, multiband factor = 2, phase encoding direction anterior-to-posterior (AP), 128 slices, resolution = 1.24 mm isotropic, 103 directions and whole-brain coverage. 23 Imaging was acquired using multiple b-shells including 5 b = 0 s/mm2, 17 b = 1000 s/mm2, 31 b = 2000 s/mm2 and 50 b = 3000 s/mm2 images. To correct for susceptibility-induced off-resonance field distortion, six non-DWIs with opposite phase encoding (posterior-to-anterior) were acquired.
To calculate brain volumetrics and identify white matter (WM) lesions a 3D T1-weighted structural scan (MP2RAGE; TR = 4900 ms, TE = 2.89 ms, inversion time (TI) = 700/2700 ms, FA = 5/6 degrees, 192 slices, AF = 4, phase encoding direction AP, voxel size = 0.9 mm isotropic, image matrix = 256 × 256) and a two-dimensional fluid-attenuated inversion recovery scan (FLAIR; TR = 10,000 ms, TE = 96 ms, TI = 2600 ms, FA = 145°, 45 axial slices, GRAPPA = 3, PE = AP, voxel size = 1.2 × 1.2 × 3.0 mm) were acquired.
DWI processing: fibre orientation distribution and tractography of sensorimotor tracts
Detailed description of the (pre-)processing steps is published in a previous paper. 20 In short, the processing steps involved pre-processing to correct for noise, motion and inhomogeneities, followed by estimation of the fibre orientation distribution in the WM using tissue-specific response functions and spherical deconvolution. Next, a study-specific group template was created and used in all subsequent processing steps including fibre-specific measures, fibre tracking and group comparisons. For each specific fibre bundle within each voxel in the WM, named a fixel, three measures were calculated, including fibre density (FD), fibre cross-section (FC) and a combined measure that takes into account the effects of both FD and FC (FD × FC = FD modulated by FC (FDC)). Whole brain probabilistic fibre tractography was performed and tracts of interests were selected using several inclusion regions, such as the primary sensorimotor cortices and regions, were manually drawn to exclude tracts from entering regions outside to tracts of interest. The sensorimotor tracts included the CST, IHST and cerebellothalamic tracts (CTTs) (see Strik et al. 20 and Figure 1 for visualization of tracts and group comparisons).
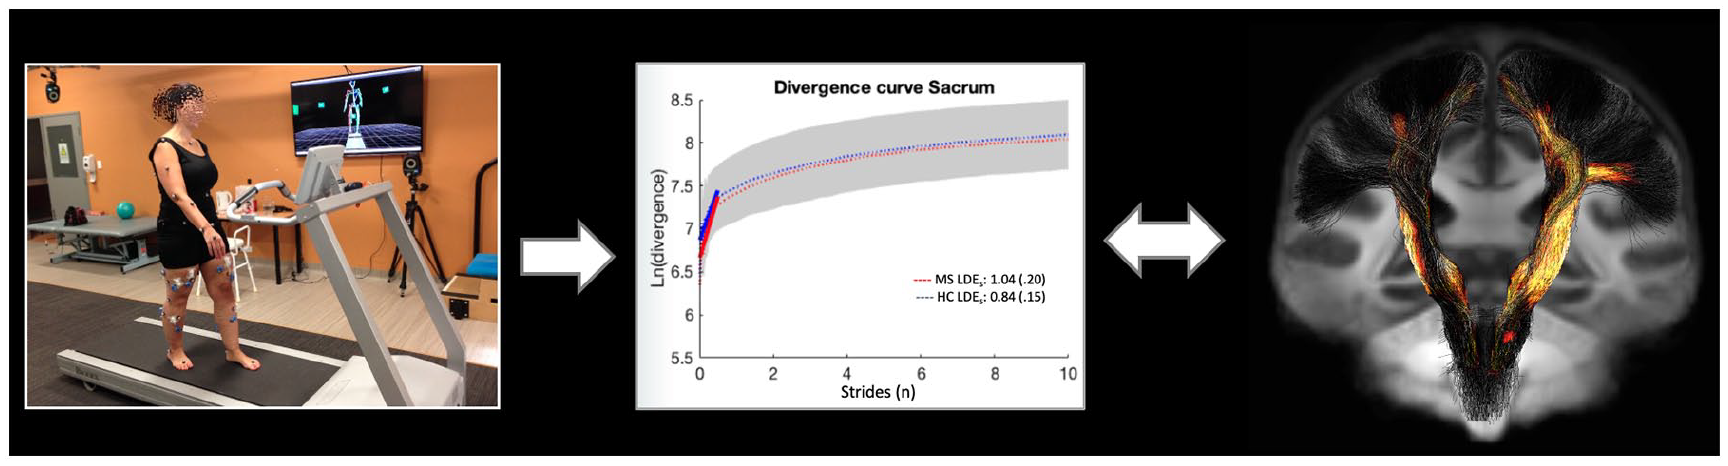
From left to right, setup utilized to record treadmill walking data, plot presenting averaged plot for the divergence curve in PwMS and HC from which LDESAC is calculated, and example of fibre-specific areas of significant axonal damage correlated to gait dynamic stability measures (LDEs).
Brain volumetric measures
Lesions were segmented on the MP2RAGE scan using MRIcron (https://www.nitrc.org/projects/mricron) and the FLAIR image was used as visual reference. Lesion filled MP2RAGE images were subsequently used for segmentation analyses using FreeSurfer version 6.0-patch (https://surfer.nmr.mgh.harvard.edu/).
Statistical analysis
Fibre-specific axonal markers for each tract were compared between patients and controls (data reported in previous publication by Strik et al. 2021). Mean FD, FC and FDC were extracted from areas of significant damage and correlation analyses were performed between mean FD, FC and FDC from each tract of interest with each of the gait dynamic stability measures, LDESHO, LDESAC and LDECER, using Pearson’s and Spearman’s correlations. Separate linear regression analyses (stepwise method) were performed to predict LDE measures, each separately based on tract measures. An analysis of variance (ANOVA) was conducted to determine between-group stability differences (LDESHO, LDESAC and LDECER) and overground self-selected gait speed. For all analyses, significance was set at p < 0.05. All statistical analyses were performed in IBM SPSS v27.
For our secondary aim, we used Pearson’s correlation to determine the association between gait stability measures (LDESHO, LDESAC and LDECER) and six normalized volumetric brain measures: brain volume (BV), grey matter (GM), deep grey matter (DGM) and cortical grey matter (CGM), WM, and lesion volume (LV).
Results
Although our inclusion criteria considered EDSS < 4, this score ranged between 0 and 2 for all PwMS (Table 1). All participants were able to complete the 5-minute treadmill walking trials without stopping. Furthermore, rating of perceived exertion (RPE) was measured at the end of the trial using a printed 20-point Borg scale to which all patients reported RPE < 13 (‘somewhat hard’). 24 Demographics and clinical measures for all PwMS and HC are presented in Table 1. Normality of data was inspected using Shapiro–Wilk’s test, which approximated normal distribution. Compared to HC, PwMS exhibited significantly greater values for LDESAC (F = 10.403 p = 0.003), LDESHO (F = 5.937, p = 0.020) and LDECER (F = 7.999, p = 0.008) (Figure 2). Overground self-selected speed did not significantly differ between groups (F = 0.356, p = 0.554) with PwMS walking at an average speed of 1.33 ± 0.13 ms−1 (95% confidence interval (CI): 1.29–1.38 ms)−1 and HC at 1.36 ± 0.13 ms−1 (95% CI: 1.27–1.45 ms)−1. Except for CSTFD, CTTFD and CTTFC, for which we used Spearman’s test, correlations were conducted using Pearson’s test. Table 2 presents descriptive statistics for all measures, and Table 3 presents the correlations between LDE and tracts measures. Overall, a significant moderate negative correlation was found between LDESAC, LDESHO and LDECER, and CSTFD (r = −0.4, p = 0.05, r = −0.46, p = 0.02 and r = −0.4, p = 0.05, respectively). CSTFDC was moderately correlated with LDESAC (r = −0.48, p = 0.02) and LDECER (r = −0.43, p = 0.03) (Figure 3). LDECER was also moderately correlated with IHSTFD (r = −0.42, p = 0.04) and IHSTFDC (r = −0.42, p = 0.04) (Figure 3). To note, negative correlation indicates lower gait stability associated with greater tract damage. The results for the stepwise linear regression analysis show that CSTFDC is the main predictor of LDESAC (r = 0.48, p = 0.15, β = −1.16) and LDECER (r = 0.43, p = 0.34, β = −0.56), yet no tract measures were entered into the regression analysis to predict LDESHO. For our secondary analysis correlating gait stability with brain volumetric measures, we only found a significant moderate correlation between LDESHO and normalized cortical grey matter (NCGM) (r = −0.417, p = 0.04). To note, no significant correlations were found between non-normalized volumes and gait stability.
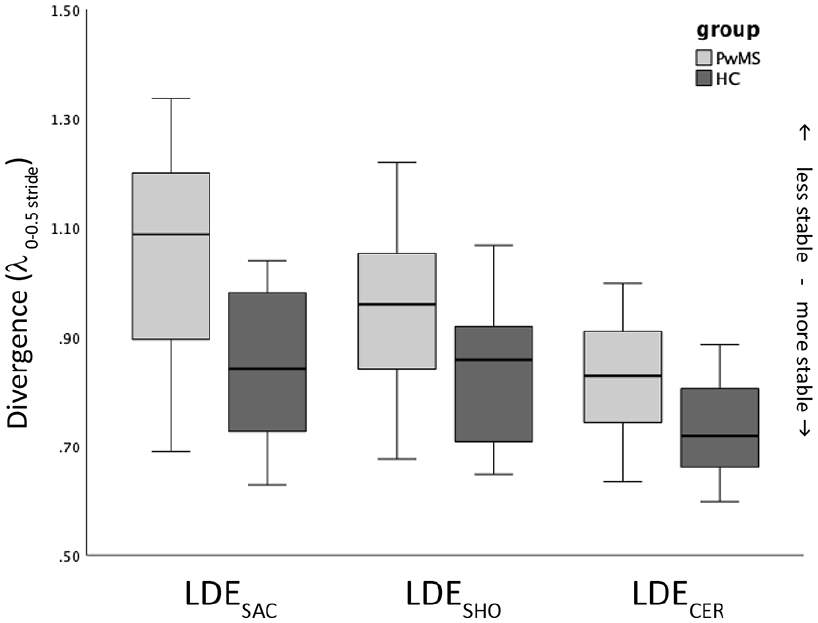
Boxplot for the median LDE values for from each of the sensors: LDESAC, LDESHO and LDECER for both groups, people with multiple sclerosis (PwMS) and health controls (HCs).
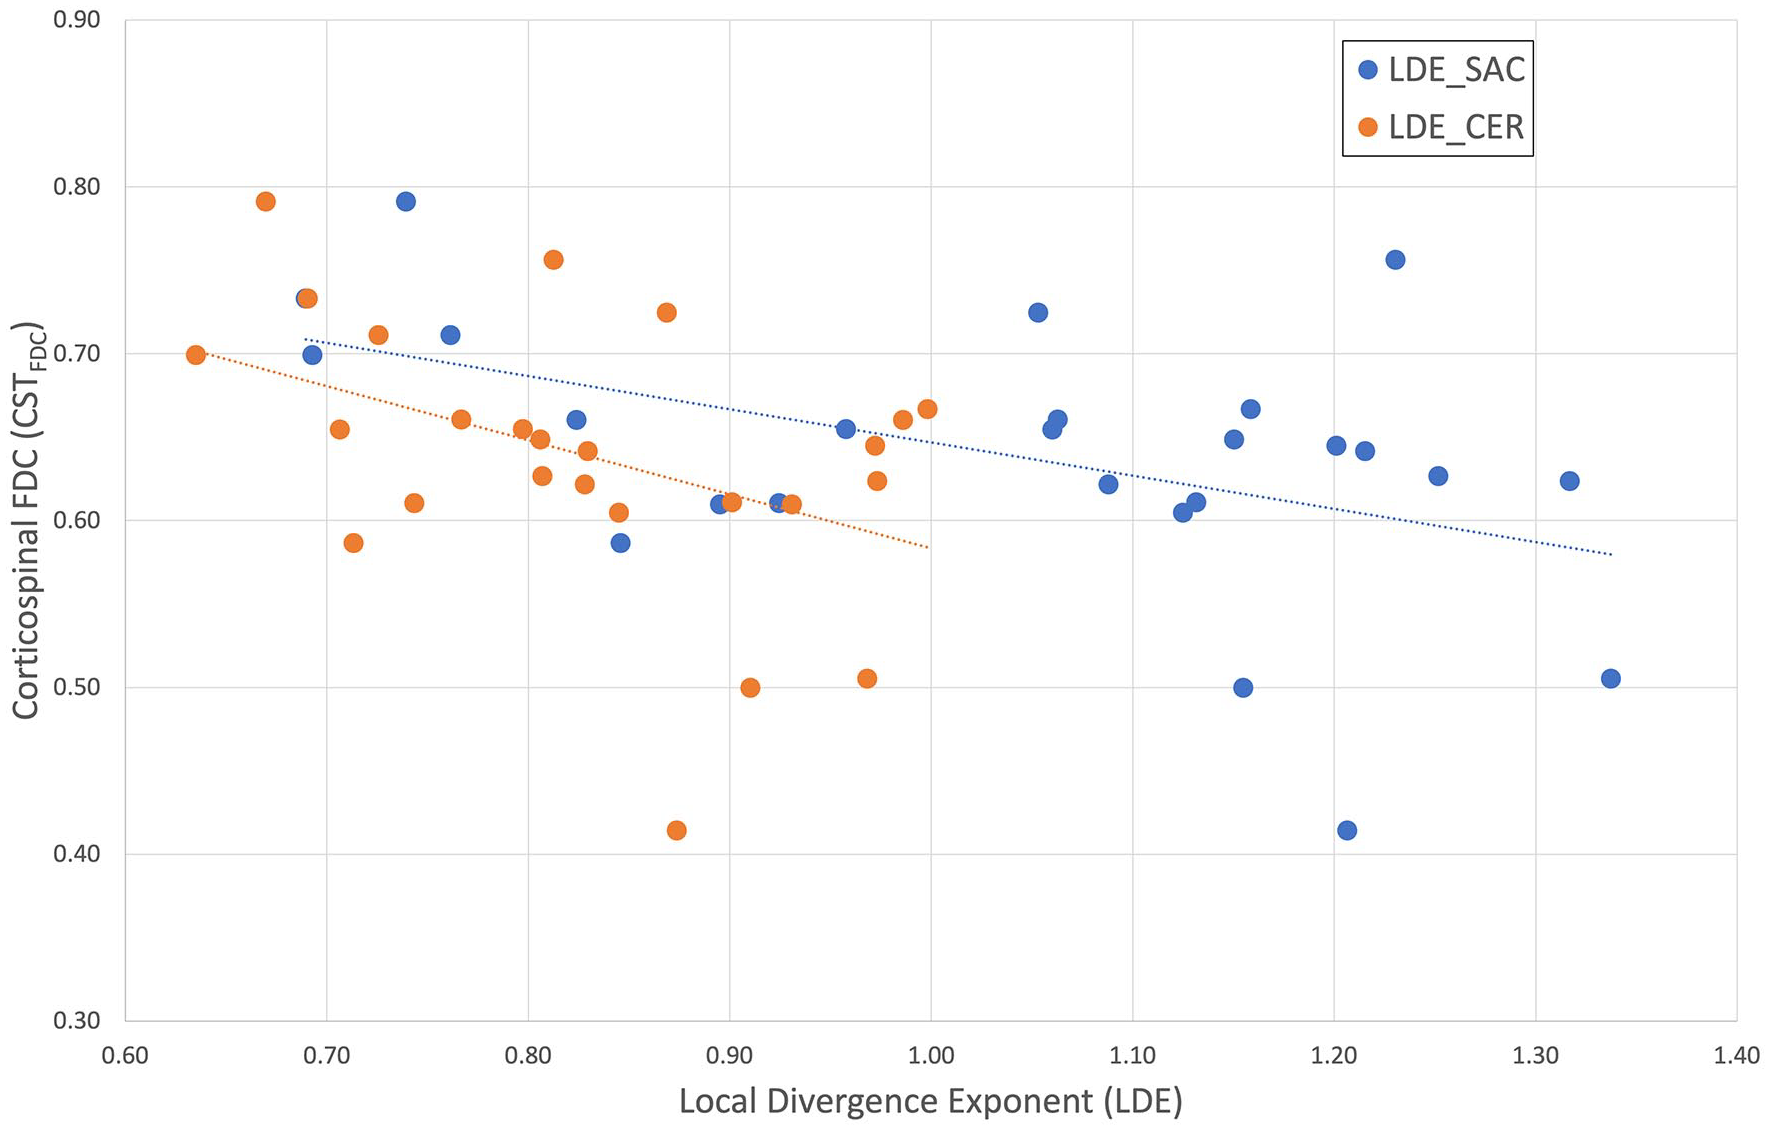
Scatterplot presents the significant correlations found between LDESAC and CSTFDC (blue), and between LDECER and CSTFDC (orange).
Descriptive statistics for all LDE and tract measures.
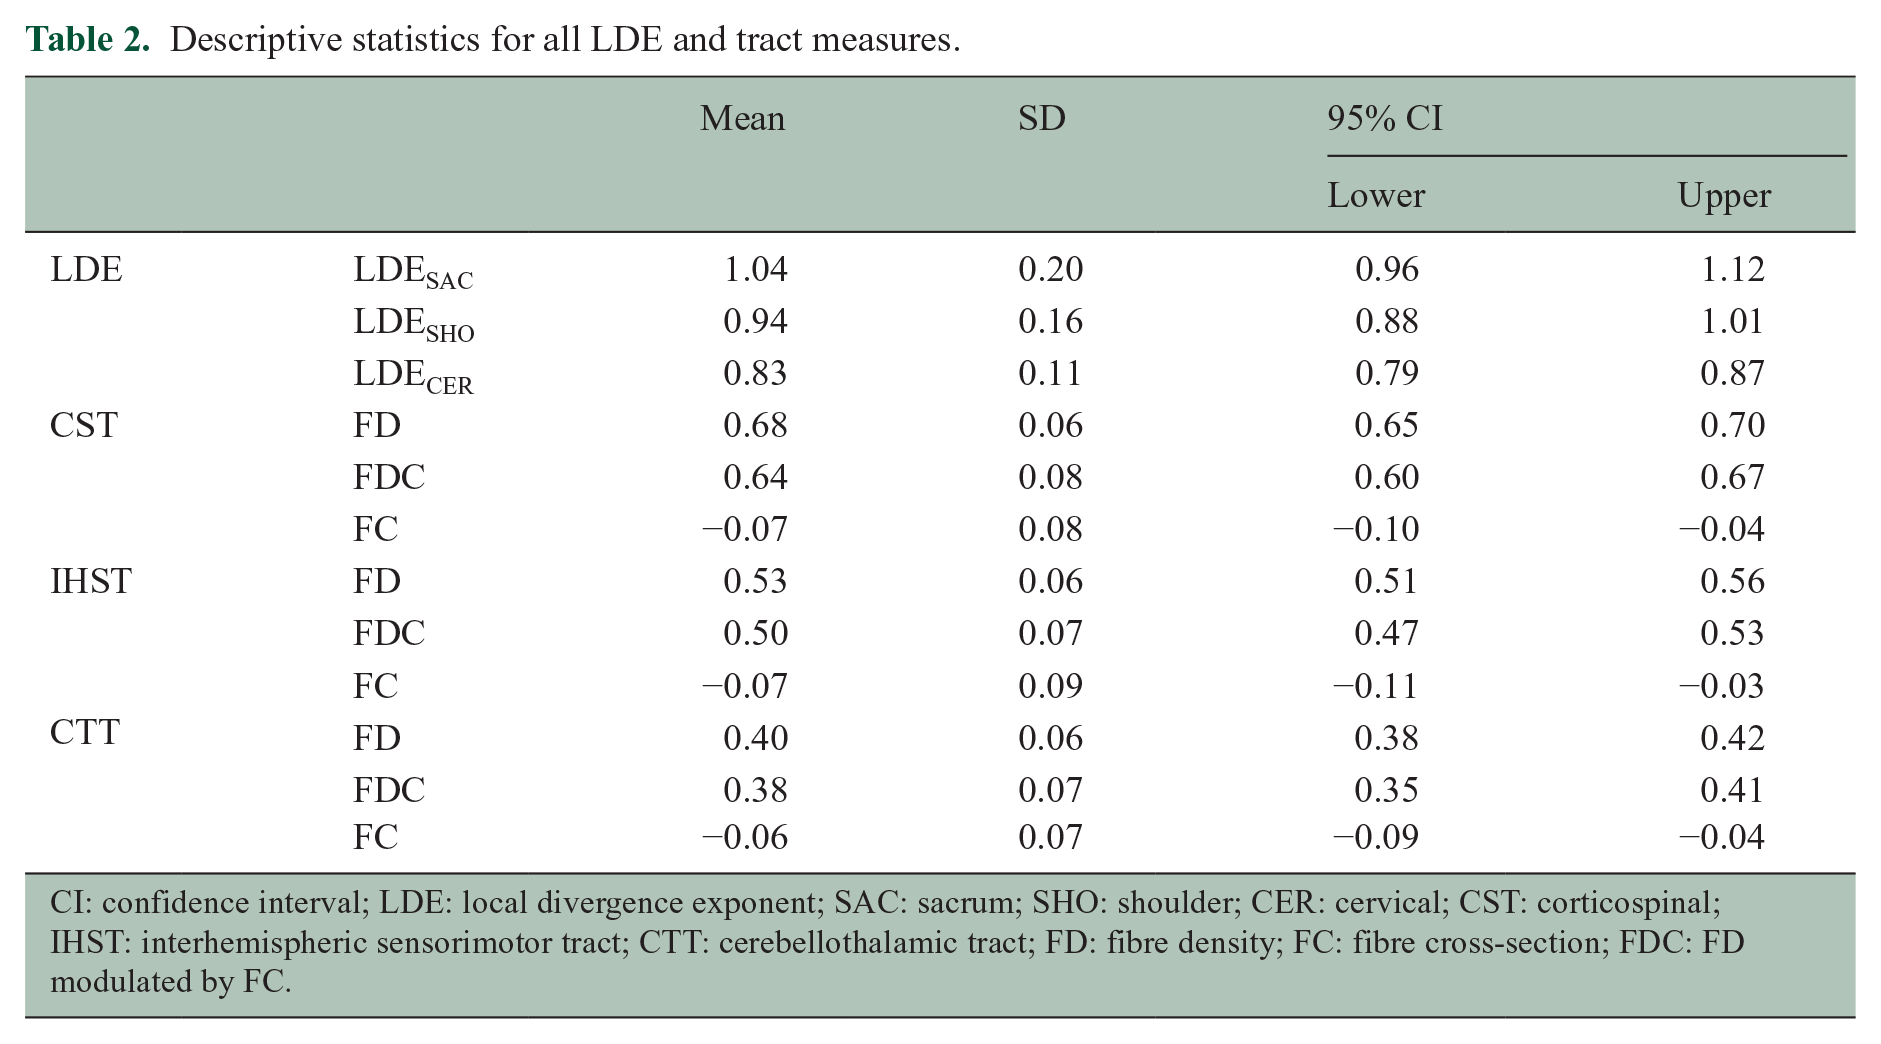
CI: confidence interval; LDE: local divergence exponent; SAC: sacrum; SHO: shoulder; CER: cervical; CST: corticospinal; IHST: interhemispheric sensorimotor tract; CTT: cerebellothalamic tract; FD: fibre density; FC: fibre cross-section; FDC: FD modulated by FC.
Correlations between LDE and tract measures (right).
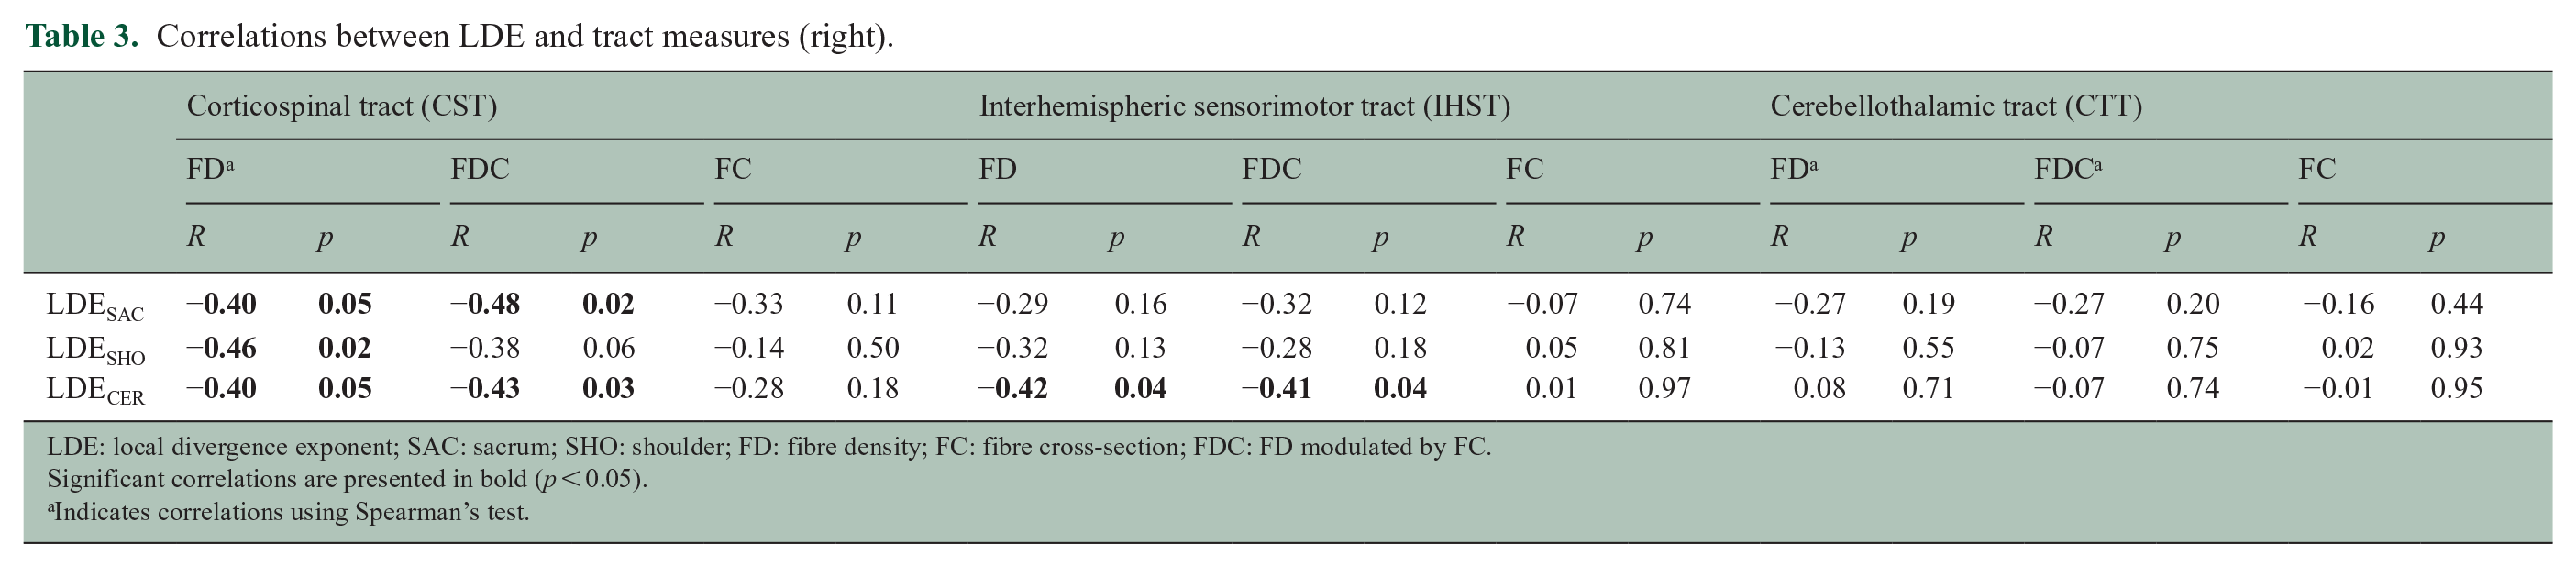
LDE: local divergence exponent; SAC: sacrum; SHO: shoulder; FD: fibre density; FC: fibre cross-section; FDC: FD modulated by FC.
Significant correlations are presented in bold (p < 0.05).
Indicates correlations using Spearman’s test.
Discussion
The aim of this study was to compare stability between PwMS and HCs, and the association between gait stability (LDE) and motor tract damage in PwMS with subtle clinical disabilities at early stages of the disease when no evident changes can be clinically observed. Similar to our previous study, we found a significant lower stability in PwMS compared to HC. 8 Nevertheless, most importantly, we found associations between sensorimotor tract damage and gait stability. For our secondary aim, except for normalized CGM, we found no volume measures (including LV) were associated with gait stability.
Previous studies have consistently found that PwMS exhibit a lower gait stability when compared to healthy controls, even when measured under different contexts (i.e. overground or treadmill) and using different data sources (e.g. pelvis or trunk).6–9,15 Although, the results from previous studies indicate that the LDE is a robust measure of stability in PwMS, the values for this measure vary broadly across studies. The latter impedes fully comparing results and determines ranges and thresholds for poor/normal stability, hence, its immediate use for disability classification or disease progression.
We found that of all tract measures, CSTFDC was the main predictor (significant) of gait stability when measured at both sacral and cervical levels. In a previous study by our group, we also found a significant correlation between CST damage and spatiotemporal measures of gait (e.g. stance time). 20 Furthermore, axonal loss in the CST has been associated with the clinical progression of motor deterioration in PwMS. 18 These findings highlight the importance of the CST integrity to maintain the functionality of gait, particularly stability. The associations between CSTFDC and LDE values suggest that axonal loss in the CST contributes to decreased gait stability. Greater FDC values are indicative of less axonal loss and potentially, maintenance of the neural networks associated with mobility. 25
We also found associations between IHSTFD and IHSTFDC and gait stability measured at the cervical level (LDECER). Damage to the IHST has been shown to correlate with decreased functionality of the transcallosal inhibitory sensorimotor network, which may affect bilateral synchronization of motor outputs during walking. 26 Since control of walking requires active neuromuscular control to maintain stability in the mediolateral direction, 27 it is possible that IHST damage may be partly responsible for poorer stability of gait in PwMS.
A recent review shows that motor rehabilitation, including gait training, may lead to beneficial changes in the brain structure and synaptic connectivity within the brain. 28 However, the task-specific training involved in gait training may also lead to task-dependent plasticity and improved coordination of the spinal and supraspinal circuitry involved in this task. 29 Since stability is the outcome of a functional balance control system, which relies on the integration of several sensory inputs (e.g. proprioception), training walking stability may help preventing not only further CST and IHST deterioration but also spinal circuitry deterioration. This can occur even in patients with greater disability than PwMS in the present study, as shown in a recent study that found that walking aid training elicited neuroplastic changes that improved connectivity in sensorimotor brain areas. 25
For our secondary analysis, we only found a significant correlation between LDESHO and cortical GM. Previous studies have found significant correlations between GM and DGM, and gait performance (expanded timed get-up and go) 30 and also between CST damage (diffusion tensor imaging (DTI) measures) and poorer performance in the 6MWT and T25FWT. 31 It is noteworthy, however, that these studies analysed PwMS with greater disability than in the present study, which may make brain damage and gait performance associations more evident. Since Strik et al. (2021) found minimal lesion activity despite evident axonal damage in the CST, the lack of significant associations between gait stability and LV found in the present study may indicate that axonal damage in the CST has a greater impact on gait than CST lesions. 20 The lack of association between LV and LDE may also reflect the capacity to maintain gait functionality through neuroplastic adaptations or compensatory actions when sensorimotor tracts are damaged. Such neuroplastic changes have been observed even in PwMS with greater disability when receiving walking aid training. 25
The findings of this study are important because they inform our understanding of the underlying mechanisms associated with lower stability of walking, even at early stages of the disease. The PwMS who participated in this study did not have clinically evident signs of gait abnormalities with similar spatiotemporal and self-selected walking speeds, and it is possible that sensorimotor reorganization processes (neuroplasticity) occurred to cope with the effects of the CST damage. The latter may also explain the only moderate correlations observed between CST and IHST measures with LDE measures, yet highlights sensitivity to the neural changes affecting walking in PwMS. Identifying mobility measures that are sensitive to disease progression in MS is also paramount to implement more routine methods of monitoring of disability that are not invasive and which are of low cost. Since the LDE has been proposed as a potentially more sensitive measure of gait deterioration than common clinically used measures (e.g. gait speed), our findings are relevant for better understanding the underlying structural damage that may explain deterioration in gait stability in PwMS.
Some studies have already shown the sensitivity of LDE to physiotherapy interventions 17 and sensory manipulations in PwMS. 32 It is possible that LDE, or perhaps other non-linear measures of gait, may also be sensitive to the effects of newly developed disease-modifying drugs. The use of wearable inertial sensors could facilitate the implementation of LDE for such a purpose and could be added as an additional tool during clinical examination of gait, for example, during a 6-minute walking test.6,5,9,15 Instrumenting an existing clinical test may facilitate the implementation of the LDE in clinical settings with no access to a treadmill, however, sensitivity to MS and disability levels of different sensor locations (e.g. sacrum or upper trunk) is yet to be determined.
This study has some limitations. For example, to calculate the LDE, we used a very controlled walking task (treadmill at a fixed speed), which may not fully reflect a person’s walking abilities in daily life. 33 However, reductions in day-to-day physical activity observed in PwMS, particularly light intensity, may also be an early indicator of gait impairments in PwMS. 34 The calculation of the LDE is subject to the adequate selection of the delay and number of acceleration copies for which there is no consensus as yet. 35 In this study, we utilized previously used values for these parameters, however, earlier studies using the LDE have found that PwMS exhibit lower stability even when using different data sources and parameters.6,7,9,11–13,15,32 As for the fibre-specific metrics, while we interpreted loss of FD and cross section as markers of axonal loss, nonetheless, histopathological studies are needed to validate this assumption. Furthermore, a cross-sectional design was used in this study, whereas a longitudinal design in PwMS with different disability levels is required to elucidate the relationship between disability progression and axonal loss and whether fixel-metrics and LDE could provide sensitive and useful markers to predict gait function loss in PwMS.
Conclusion
Gait stability measures using the local dynamic stability (LDE) correlate with the degree of axonal loss the CST in PwMS with no clinically evident gait impairments. These results provide a new insight into the association between subtle gait impairment and brain damage. Ongoing longitudinal studies will provide evidence for the potential use of the LDE as a more sensitive measure of walking deterioration in MS. Furthermore, implementation of the LDE in clinical settings using wearable technology may help to routinely monitor progress and effects of pharmacological and non-pharmacological interventions at early stages of the disease for more timely clinical decision-making.
Footnotes
Acknowledgements
The authors acknowledge the Traditional Owners of the land on which this study was carried out, and pay respect to elders past and present. They would like to thank all participants for their time. They also acknowledge the facilities, scientific and technical assistance from the National Imaging Facility, a National Collaborative Research Infrastructure Strategy (NCRIS) capability, at the Melbourne Brain Centre Imaging Unit, the University of Melbourne. They would also like to specifically thank Rebecca Glarin and Dr Camille Shanahan for their assistance in setting up the MRI protocol and recruiting and testing participants, and Dr Andisheh Bastani for her assistance with gait assessments. Imaging analysis was supported by the MASSIVE HPC facility (![]() ). Kilpatrick T.J. is an NHMRC Leadership Fellow.
). Kilpatrick T.J. is an NHMRC Leadership Fellow.
Declaration of Conflicting Interests
The author(s) declared the following potential conflicts of interest with respect to the research, authorship, and/or publication of this article: L. Eduardo Cofré Lizama, Myrte Strik and Mary P. Galea have received no financial support for the research, authorship and/or publication of this article. Anneke van der Walt served on advisory boards for Novartis, Biogen, Merck and Roche and NervGen. She received unrestricted research grants from Novartis, Biogen, Merck and Roche. She is a co-principal investigator on a co-sponsored observational study with Roche, evaluating a Roche-developed smartphone app, Floodlight-MS. She has received speaker’s honoraria and travel support from Novartis, Roche, Biogen and Merck. She serves as the Chief operating Officer of the MSBase Foundation (not for profit). Her primary research support is from the National Health and Medical Research Council of Australia and MS Research Australia. Scott Kolbe has received grant funding from Biogen, Ipsen and the Trish Foundation. Trevor Kilpatrick receives support from Novartis in the form of consultancy fees, honoraria for giving lectures and funding for a pre-clinical Investigator-Initiated Study (IIS).
Funding
The author(s) disclosed receipt of the following financial support for the research, authorship, and/or publication of this article: The imaging data collection for this work was supported by grant funding from the University of Melbourne.