
Abstract
Background:
Paramagnetic rim lesions (PRLs) are chronic active lesions associated with a more severe disease course in multiple sclerosis (MS). Retinal layer thinning measured by optical coherence tomography (OCT) is a biomarker of neuroaxonal damage associated with disability progression in MS.
Objective:
We aimed to determine a potential association between OCT parameters (peripapillary retinal nerve fiber layer (pRNFL) ganglion cell-inner plexiform layer (GCIPL), inner nuclear layer (INL) thickness), and PRLs in patients with MS (pwMS).
Methods:
In this cross-sectional retrospective study, we included pwMS with both 3T brain MRI and an OCT scan. Regression models were calculated with OCT parameters (pRNFL, GCIPL, INL) as dependent variables, and the number of PRLs as an independent variable adjusted for covariates.
Results:
We analyzed data from 107 pwMS (mean age 34.7 years (SD 10.9), 64.5% female, median disease duration 6 years (IQR 1–13), median EDSS 1.5 (range 0–6.5)). Higher number of PRLs was associated with lower pRNFL (β = −0.18; 95% CI −0.98, −0.03; p = 0.038) and GCIPL thickness (β = −0.21; 95% CI −0.58, −0.02; p = 0.039).
Conclusion:
The association between higher number of PRLs and lower pRNFL and GCIPL thicknesses provides additional evidence that pwMS with PRLs are affected by a more pronounced neurodegenerative process.
Keywords
Introduction
In multiple sclerosis (MS), acute demyelinating activity is reflected by breakdown of the blood–brain barrier (BBB) and subsequent gadolinium enhancement, whereas chronic activity of lesions can be depicted by iron accumulation in microglia/macrophages at the lesion edges with proinflammatory activation status.1,2 These so-called paramagnetic rim lesions (PRLs), frequently also termed iron rim lesions (IRL), occur in approximately 50%–70% of people with MS (pwMS) irrespective of MS course, 3 peaking in the late relapsing–remitting and early secondary progressive MS stage. 4 They have been shown to be larger and to expand over time in comparison with non-iron lesions, 5 indicating persistent chronic inflammation, demyelination, and profound axonal transection, which is reflected by more prominent hypointense T1 lesions, 6 prolonged lesional T1 relaxation times,6 and lower axonal and myelin integrity. 7 Altogether, PRLs are considered to be a potential biomarker to determine disease progression or even earlier conversion to secondary progressive MS (SPMS). 6
Thinning of the inner retinal layers measured by optical coherence tomography (OCT) is another emerging biomarker of neuroaxonal damage in MS. OCT is a noninvasive and accessible technique that uses near-infrared light to create high-resolution cross-sectional images of the retina with the ability to identify distinct tissue layers. 8 The thickness of the peripapillary retinal nerve fiber layer (pRNFL) and the ganglion cell-inner plexiform layer (GCIPL) are both robust indicators of neuroaxonal degeneration in MS, 9 and their thinning is associated with an increased risk of disability progression.10–12 On the contrary, thickening of the retinal inner nuclear layer (INL) is associated with inflammatory activity,13,14 with its reduction being reported in patients responding to disease-modifying therapy (DMT). 15
Here, we investigated the potential association between OCT parameters and PRLs in order to further elucidate pathophysiological mechanisms behind retinal layer thinning and the role of PRLs in this process. We hypothesized that PRLs as chronic active lesions are associated with both OCT biomarkers of neuroaxonal degeneration (pRNFL and GCIPL thickness) and inflammatory status (INL thickness).
Method
Patients and definitions
For this cross-sectional retrospective study, patients from the Vienna MS database (VMSD) were included based on following inclusion criteria: relapsing onset MS diagnosis according to the 2017 version of the McDonald criteria; 16 ≥ 18 years; availability of T1, FLAIR, and SWI-based MRI scan at 3T; and an OCT scan ± 6 months from MRI. 17 The selection process based on the inclusion and exclusion criteria is shown in Figure 1. Data on Expanded Disability Status Scale (EDSS) were obtained at the time of MRI, 18 and clinical activity (relapses) was analyzed in the year before MRI. A relapse was defined as patient-reported symptoms and objectively confirmed neurological signs typical of an acute CNS inflammatory demyelinating event with duration of at least 24 hours in the absence of fever or infection and separated from the last relapse by at least 30 days. 19 The patients’ DMT status was classified as follows: (1) “no DMT” defined as patients receiving no DMT; (2) “moderately effective DMT (M-DMT)” defined as patients receiving either interferon-beta preparations, glatiramer acetate, dimethyl fumarate, or teriflunomide; or (3) “highly effective DMT (H-DMT)” defined as patients receiving either natalizumab, fingolimod, alemtuzumab, cladribine, ocrelizumab, or rituximab.
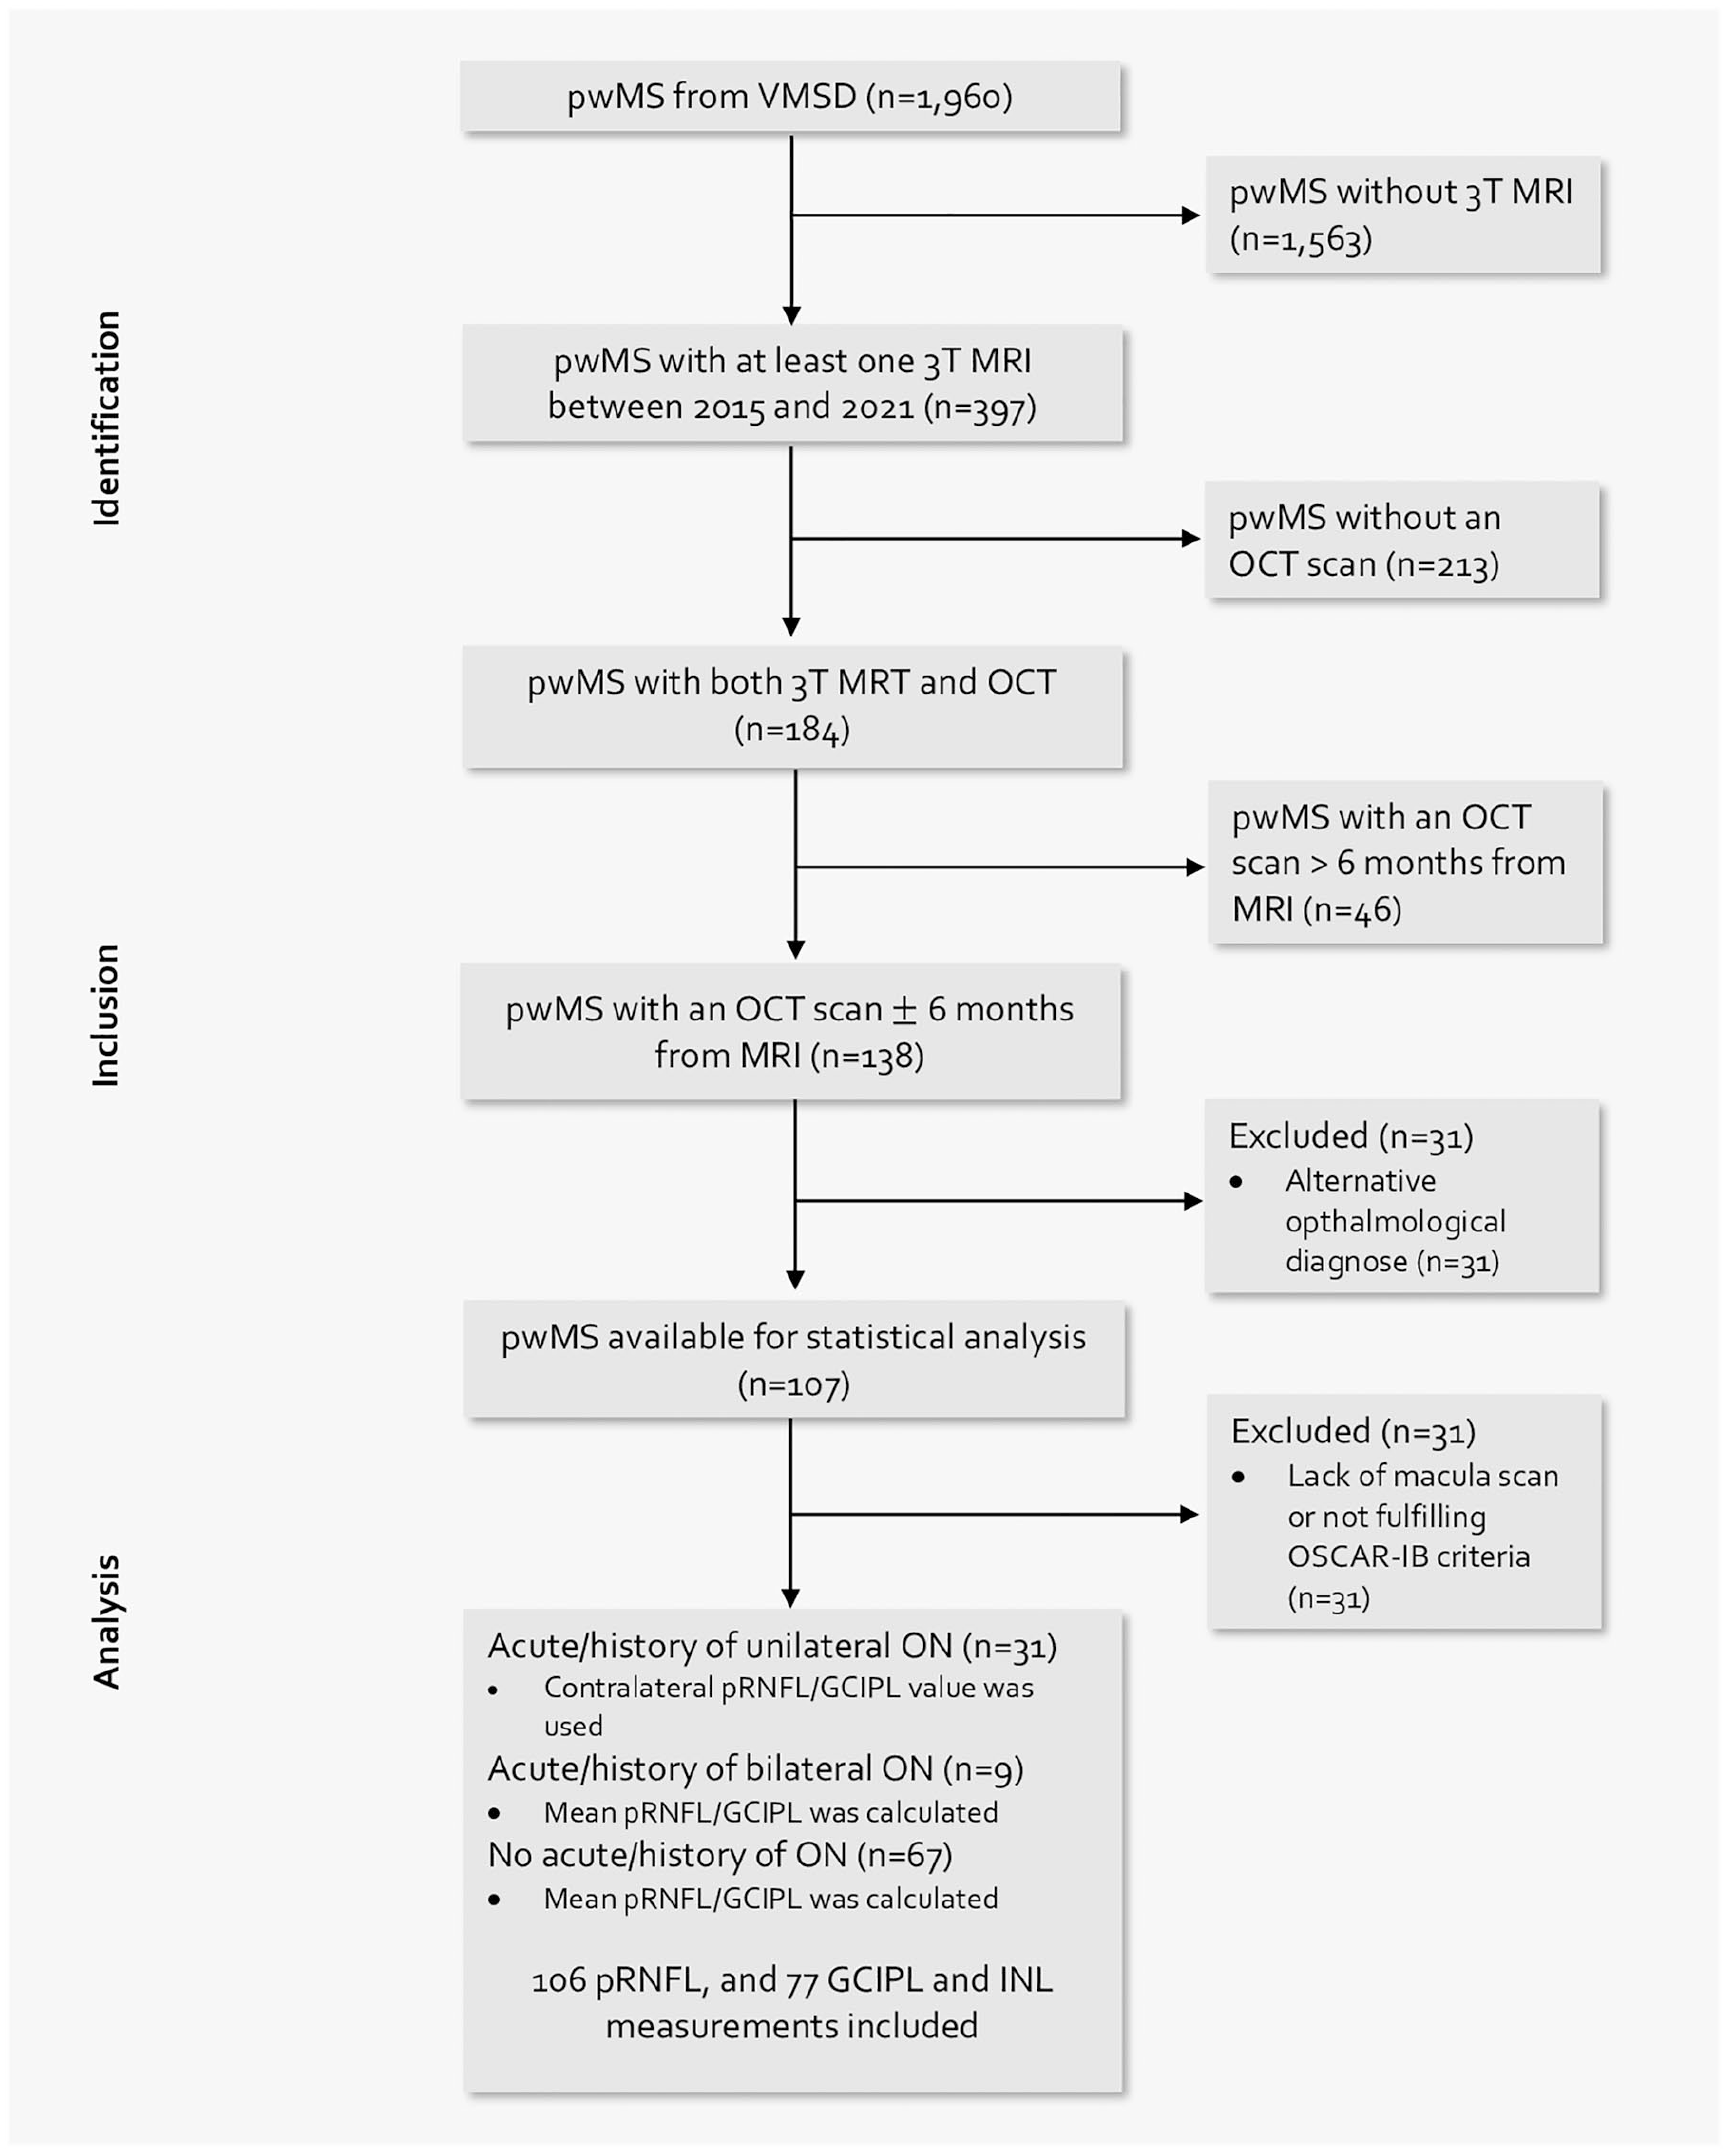
Flow chart of patients’ selection based on the inclusion and exclusion criteria.
Optical coherence tomography
OCT imaging was performed by experienced neuro-ophthalmologists at the Department of Ophthalmology and Optometry of the same institution using the same spectral-domain OCT (Spectralis OCT, Heidelberg Engineering, Heidelberg, Germany; software Heidelberg eye explorer software version 5.4.8.0) without pupil dilatation in a dark room on both eyes of each patient. For pRNFL measurement, a custom 12° (3.4 mm) ring scan centered on the optic nerve head was used (1536 A-scans, automatic real-time tracking (ART): 100 averaged frames). 20 For GCIPL measurement, a 20°×20° macular volume scan (512 A-scans, 25 B-scans, vertical alignment, ART: 16 averaged frames) centered on the macula was performed. GCIPL thickness was defined as the mean layer thickness of the four inner and outer quadrants of the circular grid centered around the foveola corresponding to the 3 mm and 6 mm rings as defined by the Early Treatment Diabetic Retinopathy Study. 21 Image processing was conducted semi-automatically using the built-in proprietary software with manual correction of obvious errors. All examinations were checked for sufficient quality using OSCAR-IB criteria. 22 OCT scans that lacked macula scan or did not fulfill OSCAR-IB criteria were excluded from the final analysis. For patients without a history of optic neuritis (ON), pRNFL, GCIPL, and INL thickness were calculated as the mean of the values for both eyes. For patients with a history of unilateral ON, only the values of eyes without ON were used in the analyses. To identify subclinical ON at baseline, we used interocular asymmetry with cut-off values of ⩾5 µm for pRNFL, and ⩾4 µm for GCIPL.23,24 In these cases, we used only the eye with the higher value. Patients with diagnoses of ophthalmological, neurological, or drug-related causes of vision loss or retinal damage not attributable to MS were excluded. 25 All patients were screened for the presence of macular edema and excluded if macular edema occurred. The investigators performing the OCT were blinded to clinical parameters and vice versa. The quantitative OCT study results were reported using the revised Advised Protocol for OCT Study Terminology and Elements (APOSTEL 2.0) recommendations. 26
Imaging acquisition
All 3T MRI brain scans were performed on a Siemens Magnetom 3T MRI system, using a 64-channel radio frequency (RF) coil between 1 January 2015, and 31 December 2021. Isovoxel (1 mm3) 3DFLAIR (TR = 6000 ms, TE = 288 ms, TI = 2100 ms), T1 weighted images (TE = 2,16 ms, TR = 1670 ms and flip angle = 15) with a gadolinium-based contrast administration and an SWI sequence (TE = 40 ms, TR = 49 ms, image matrix = 224 × 256, slices = 80, slice thickness = 2 mm) were acquired consecutively.
Evaluation of lesions
All supratentorial lesions of the periventricular, juxtacortical, and deep white matter in the frontal, temporal, parietal, and occipital lobes, 27 as well as infratentorial lesions of the cerebellum and brainstem were analyzed by two independent raters (A.D.B., N.K.) experienced in MS imaging. PRLs were defined as FLAIR-hyperintense lesions that were partially or completely surrounded by a pronounced and distinct SWI-hypointense rim. The presence of a central plaque vein did not affect the iron rim evaluation. After both raters had made their decision, the unclear lesions were discussed together on the monitor and an agreement was reached. The inter-rater agreement before matching was 97.2%. Patients were grouped for the presence of PRLs (0 PRLs, 1–3 PRLs, and ≥4 PRLs). 28
Ethics
The study was approved by the ethics committee of the Medical University of Vienna, Austria (EK1257/2022). Since this is a retrospective study, the requirement for written informed consent from study participants was waived by the ethics committee.
Statistics
Statistical analysis was performed using SPSS 26.0 (SPSS Inc., Chicago, IL, USA). Categorical variables were expressed in frequencies and percentages, continuous variables as mean and standard deviation (SD) or median and interquartile range (IQR) as appropriate. Continuous variables were tested for normal distribution by the Kolmogorov–Smirnov test with Lilliefors correction. Univariate comparisons were done by one-way ANOVA test.
First, we performed univariate correlation analysis of the number of PRLs with OCT parameters (pRNFL, GCIPL, INL) using Pearson or Spearman test as appropriate and compared OCT parameters in predefined PRL groups (0 PRLs vs 1–3 PRLs vs ≥ 4 PRLs)
Linear stepwise regression models were first univariately fitted with OCT parameters (pRNFL, GCIPL, INL) as dependent variables and the number of PRLs as an independent variable, and were further adjusted for age, disease duration, EDSS, and clinical and/or radiological activity on their own and as interaction terms to determine the interaction effect between the variables.
A value of p < 0.05 was considered as statistically significant. All multiple analyses were corrected using the Bonferroni method.
Results
In our study, we included 107 patients with MS. Demographics and characteristics of the study cohort are given in Table 1. pRNFL measurements were available in 106 (99.1%) pwMS, whereas GCIPL and INL measurements were available in 77 (72.0%) pwMS. In total, 351 PRLs were identified in 107 brain MRI scans, 10 (2.8%) of which also demonstrated gadolinium enhancement on T1 weighted images.
Characteristics of the study cohort.
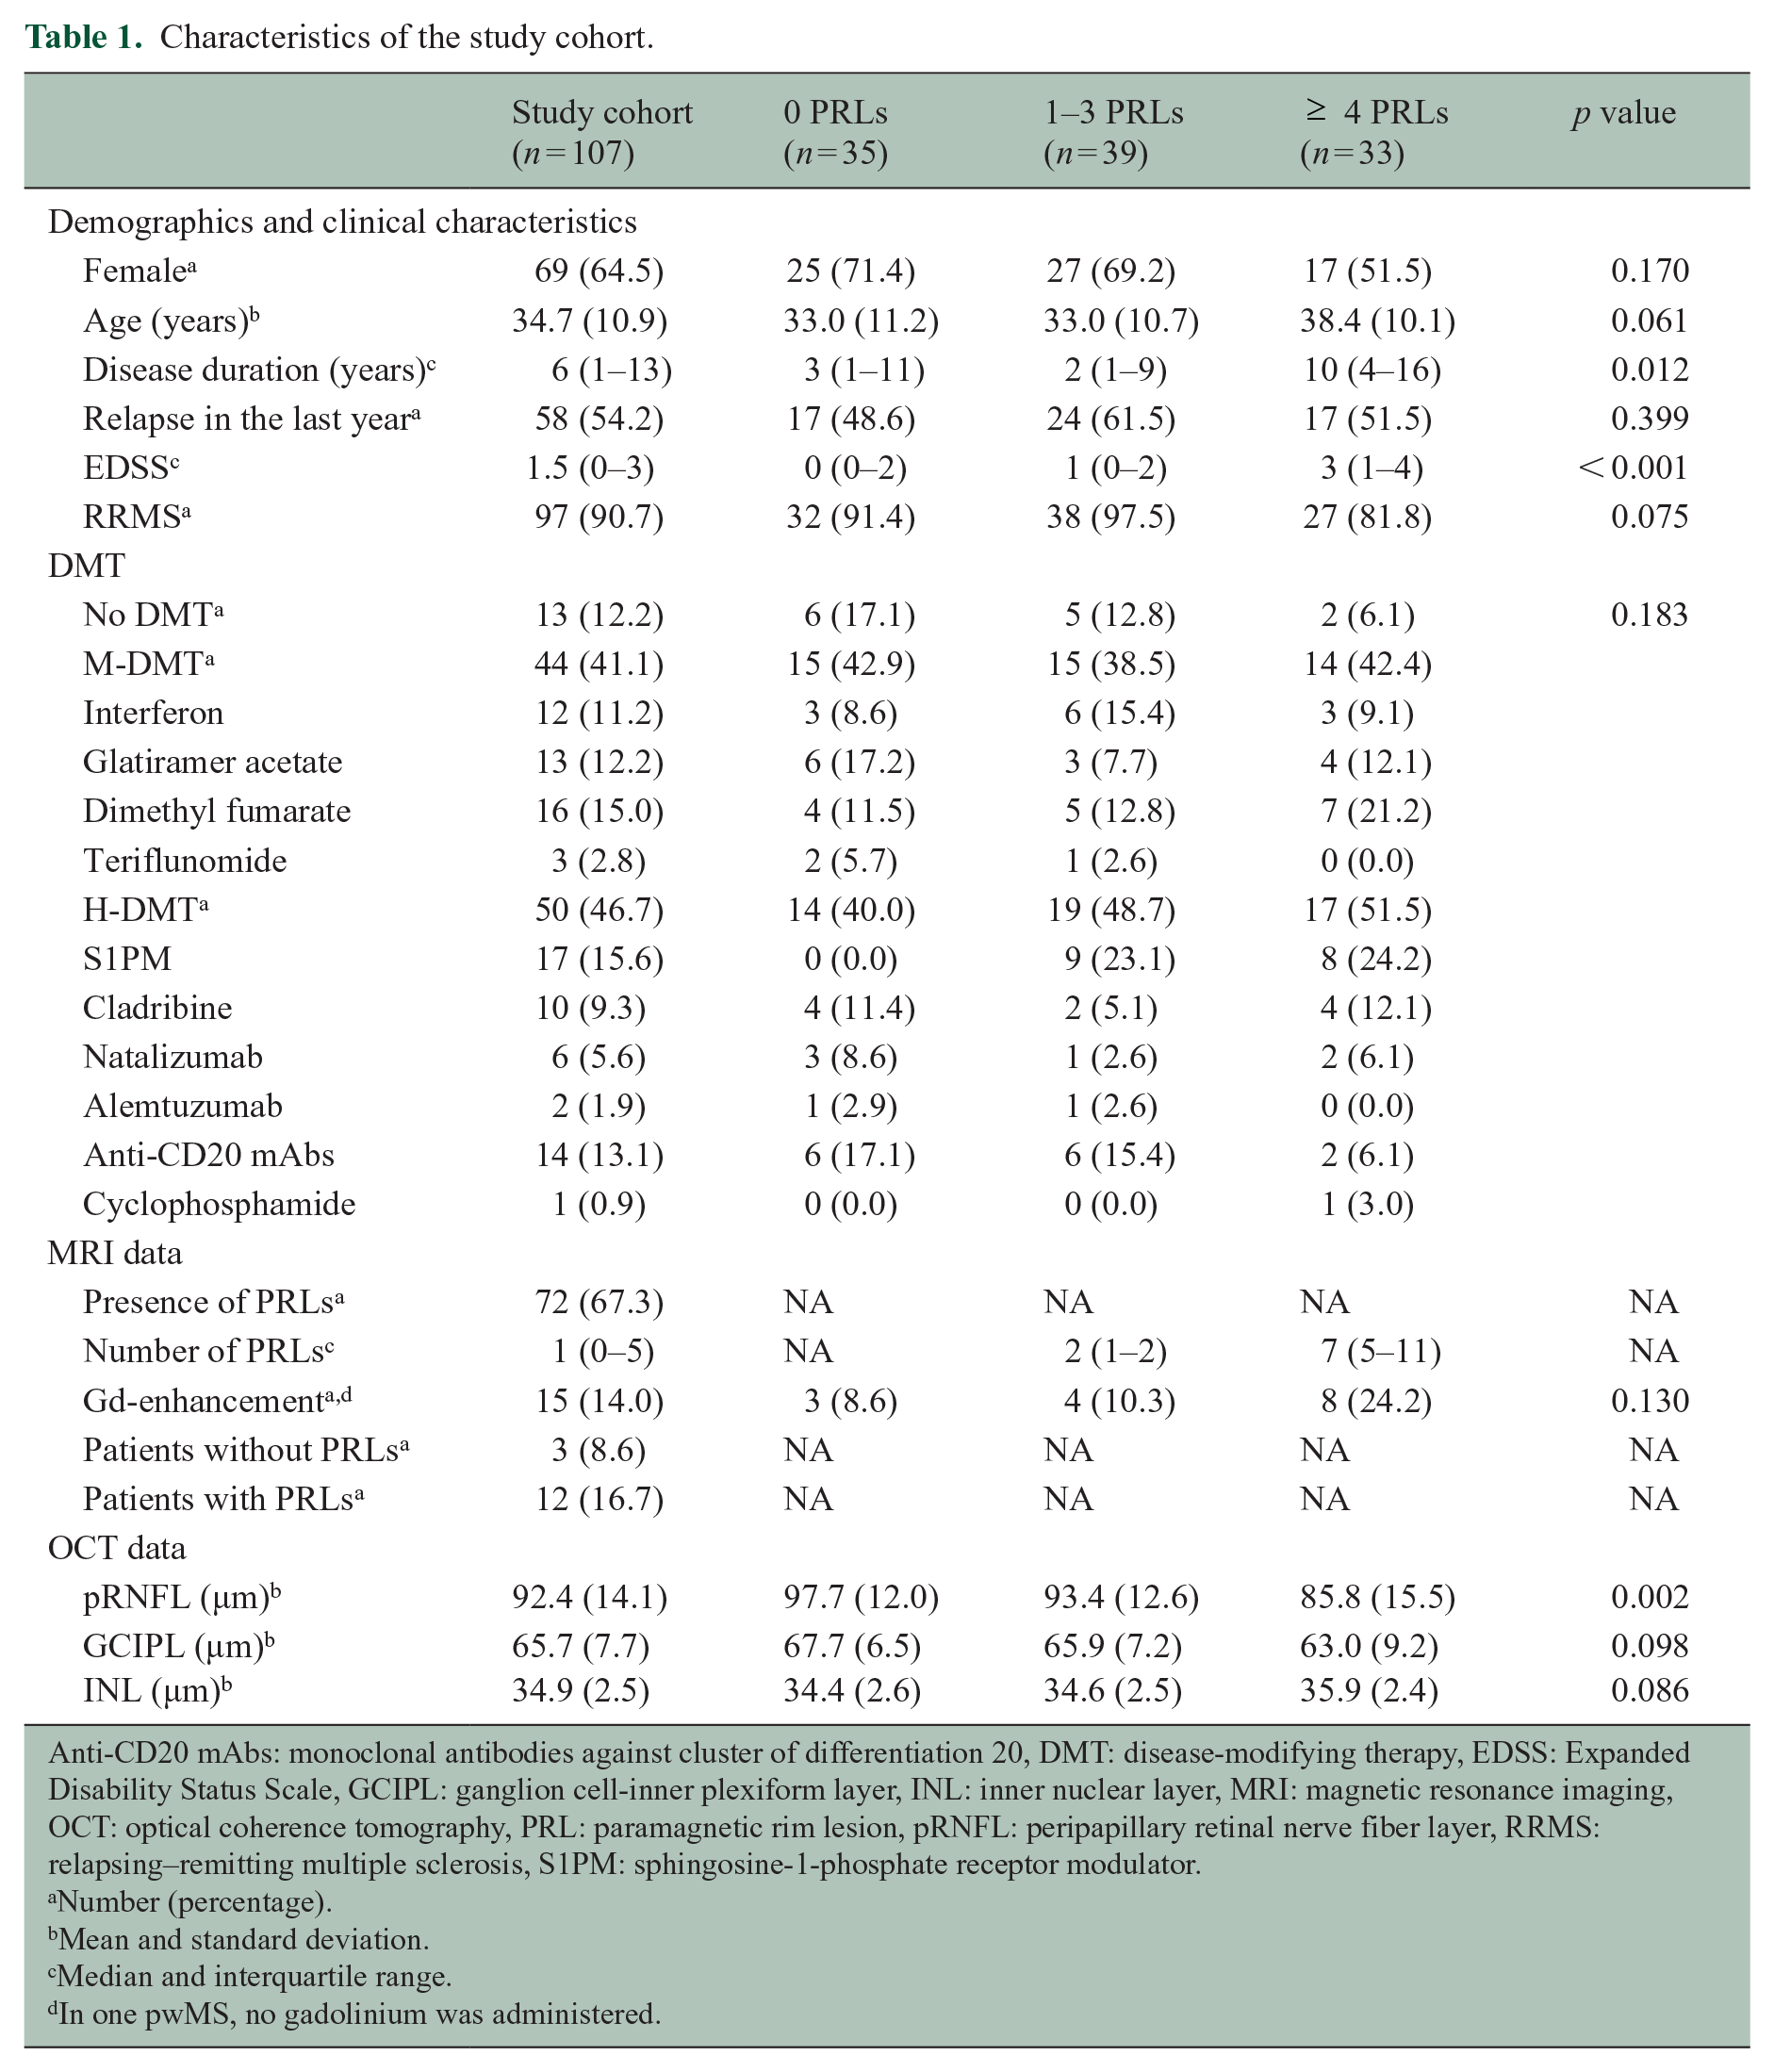
Anti-CD20 mAbs: monoclonal antibodies against cluster of differentiation 20, DMT: disease-modifying therapy, EDSS: Expanded Disability Status Scale, GCIPL: ganglion cell-inner plexiform layer, INL: inner nuclear layer, MRI: magnetic resonance imaging, OCT: optical coherence tomography, PRL: paramagnetic rim lesion, pRNFL: peripapillary retinal nerve fiber layer, RRMS: relapsing–remitting multiple sclerosis, S1PM: sphingosine-1-phosphate receptor modulator.
Number (percentage).
Mean and standard deviation.
Median and interquartile range.
In one pwMS, no gadolinium was administered.
Patients with ≥ 4 PRLs (n = 33) had significantly lower pRNFL (85.8 (15.5) vs 97.7 (12.0) p < 0.001) and GCIPL thickness (63.2 (9.1) vs 67.7 (6.5) p = 0.039), and higher INL thickness (35.9 (2.3) vs 34.3 (2.6) p = 0.027) than patients without PRLs (n = 35) (Figure 2). Uni-variately, the number of PRLs correlated negatively with pRNFL (rs = −0.29, p = 0.003) and GCIPL thicknesses (rs = −0.26, p = 0.021), but positively with INL (rs = 0.26, p = 0.021). The number of PRLs also correlated positively with age (rs = 0.20, p = 0.036), disease duration (rs = 0.42, p < 0.001), and EDSS (rs = 0.55, p < 0.001).
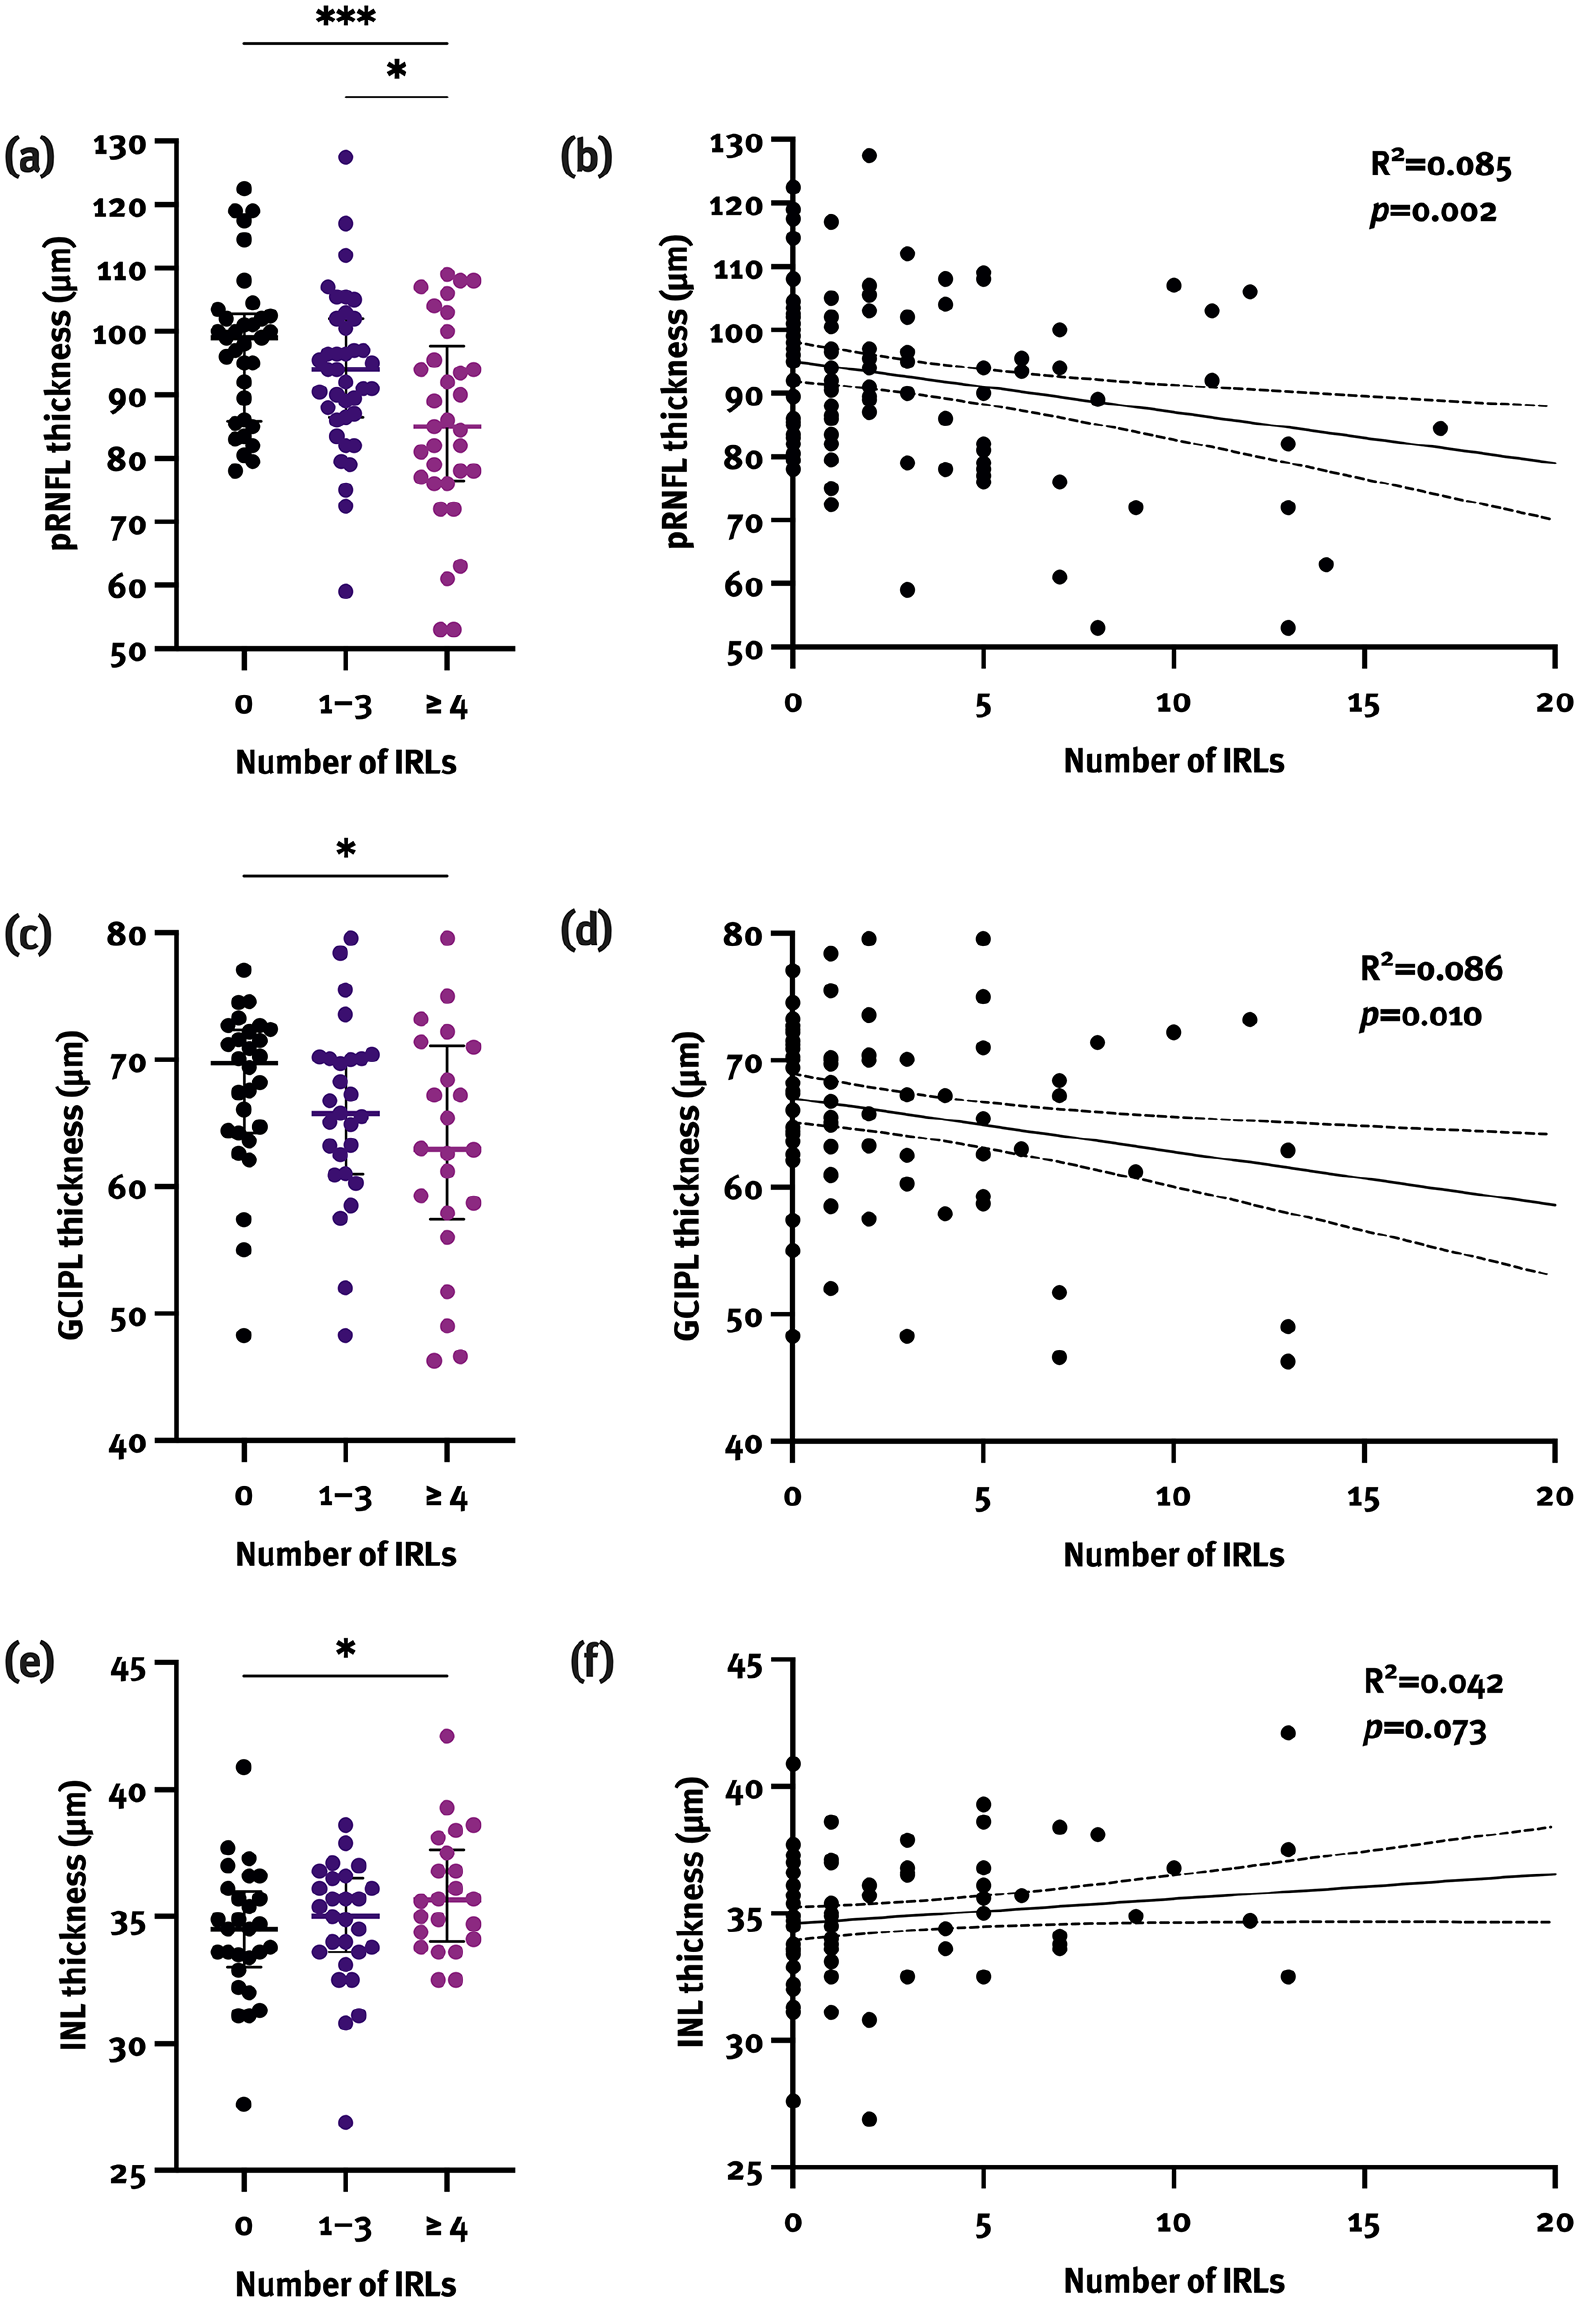
Patients with ≥ 4 PRLs had significantly lower pRNFL (a) and GCIPL (c), and higher INL thickness (e) compared with patients without PRLs. In a univariate linear regression model, pRNFL (b) and GCIPL (d) thickness were associated with the number of PRLs, whereas INL thickness (f) showed a trend, but did not reach statistical significance.
Besides, both pRNFL and GCIPL thicknesses correlated negatively with age (pRNFL: r = −0.26, p = 0.006; GCIPL: r = −0.24, p = 0.034), disease duration (pRNFL: rs = −0.50; GCIPL: rs = −0.51; both p < 0.001), and EDSS (pRNFL: rs = −0.47; GCIPL: rs = −0.45; both p < 0.001).
In univariate linear regression models, higher number of PRLs was associated with lower pRNFL (β = −0.29; 95% CI −1.31, −0.29; p = 0.002) and GCIPL thicknesses (β = −0.29; 95% CI −0.74, −0.11; p = 0.010), whereas higher INL thickness did not reach statistical significance (β = 0.21; 95% CI −0.01, 0.20; p = 0.073). The association between the number of PRLs and pRNFL and GCIPL thicknesses remained statistically significant when adjusted for covariates (Table 2). Longer disease duration was independently associated with lower pRNFL (β = −0.43; 95% CI −1.20, –0.51; p < 0.001) and GCIPL thicknesses (β = −0.49; 95% CI −0.73, –0.31; p < 0.001) with a trend toward higher EDSS being associated with lower pRNFL and GCIPL thickness as well (pRNFL: β = −0.20; p = 0.059; GCIPL: β = −0.21; p = 0.066).
Linear regression analyses for association between the number of PRLs and retinal layer thicknesses.
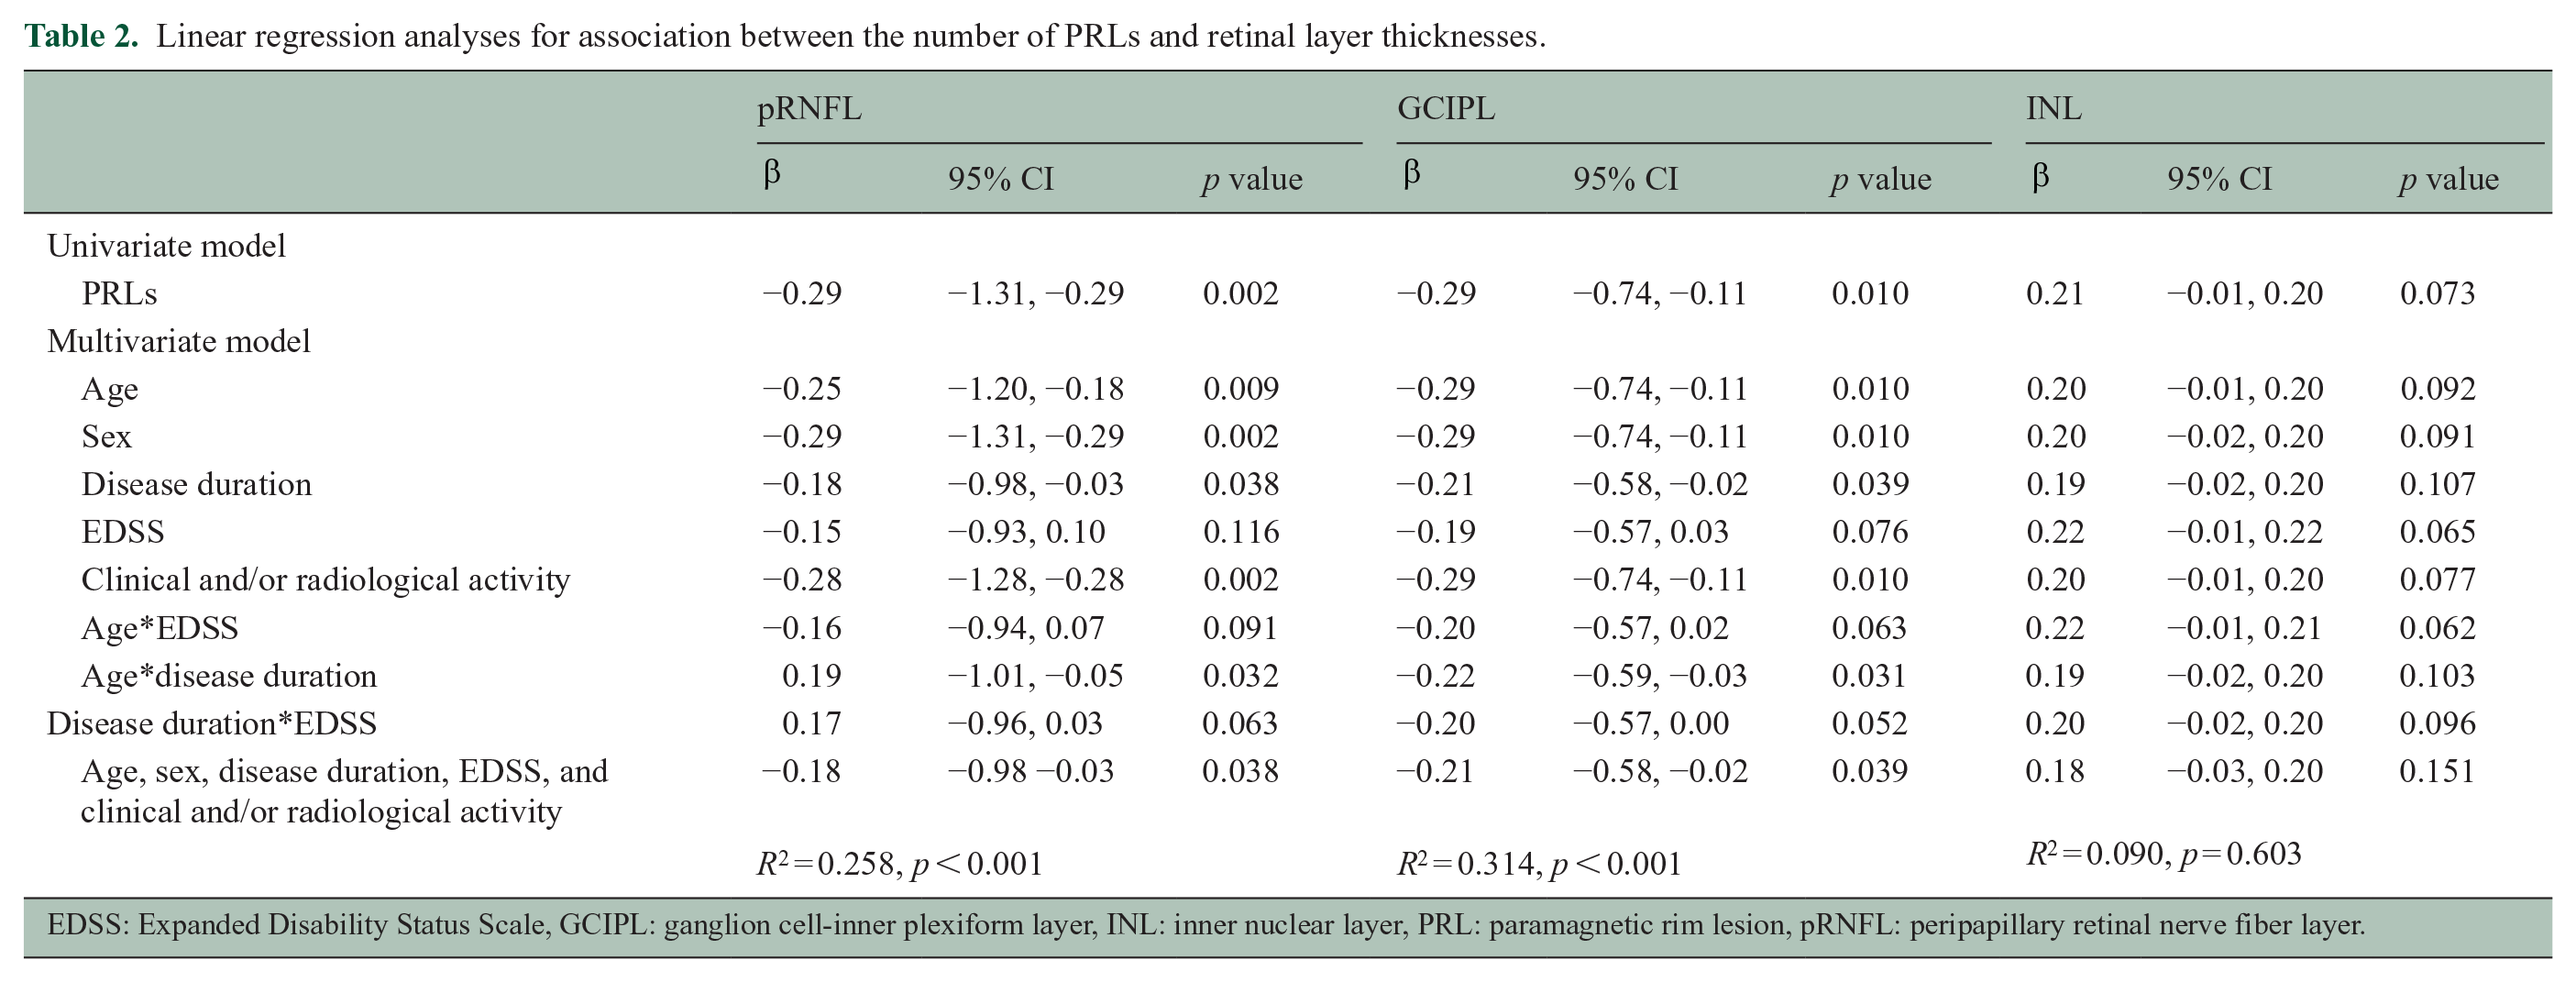
EDSS: Expanded Disability Status Scale, GCIPL: ganglion cell-inner plexiform layer, INL: inner nuclear layer, PRL: paramagnetic rim lesion, pRNFL: peripapillary retinal nerve fiber layer.
We also performed a subgroup analysis on patients with no history of ON in order to validate our results. The association between the number of PRLs and pRNFL (β = −0.29; 95% CI −1.90, −0.32; p = 0.007) yet not GCIPL thickness remained significant when adjusted for covariates. The association between the number of PRLs and INL thickness also remained significant (β = 0.29; 95% CI 0.01, 0.42; p = 0.037).
Discussion
In this retrospective, cross-sectional study, we assessed the association between the number of PRLs and inner retinal layer thickness in pwMS. Three key findings emerge from our study: (1) patients with a higher number of PRLs display lower pRNFL and GCIPL thicknesses; (2) the association between PRLs and pRNFL/GCIPL thickness is independent of age, sex, disease duration, EDSS, and clinical and/or radiological activity; and (3) a higher number of PRLs might be associated with increased INL thickness.
PRLs have gained particular interest in the past decade as a new imaging biomarker of disease progression due to their neurodestructive potential that occurs as a result of chronic inflammation and subsequent remyelination failure, leading to pronounced myelin loss and axonal degeneration within and around PRLs.29,30 Their presence has been associated with more severe disease course,1,28 elevated serum neurofilament levels,31,32 and higher brain atrophy rates.28,31,33 PRLs accumulate over years of disease duration independently of patients’ age, reaching their peak in the late relapsing–remitting multiple sclerosis (RRMS) and early SPMS phase, and are, therefore, also discussed as a potential biomarker of earlier conversion to SPMS. 5
To the best of our knowledge, we show for the first time that the number of PRLs is associated with inner retinal layer thickness independent of age, sex, disease duration, EDSS, and clinical and/or radiological activity, explaining approximately 9% of its variance. Although PRLs accumulate and expand with longer disease duration and are associated with higher disability, inclusion of covariates in our regression models showed that the presence and the number of PRLs correlate with inner retinal layer thinning independently of the above-mentioned influencing factors, again pointing at a more pronounced neuroaxonal damage associated with PRLs. However, regression coefficients in our model were relatively small, indicating other factors with a greater effect on retinal thinning than PRLs alone, for example, disease duration, which together with PRLs explained 26%–31% of retinal layer thickness’ variance. The validity of our results was also confirmed by the subgroup analysis in patients without a history of ON. It was previously shown that patients with ≥ 4 PRLs reach motor and cognitive disability at an earlier age, 28 albeit this group classification seems arbitrary as we found that each additional PRL per se results in lower retinal layer thicknesses.
In our cohort, approximately 3% of PRLs exhibited gadolinium enhancement indicating that iron accumulation had already started in those lesions in the acute phase. Gadolinium enhancement is, however, typically absent in PRLs,1,6 with up to 18% of gadolinium-enhancing lesions evolving into PRLs during a follow-up. 34 In this way, it was first thought that impaired BBB only plays a role in PRL formation but is irrelevant for their persistence. 35 However, most recently, elevated albumin quotient, a subtle biomarker of impaired BBB, has been detected in patients with PRLs, confirming that impaired BBB that leads to chronic inflammation is most probably insidious and omnipresent, yet invisible to the naked eye in terms of gadolinium enhancement. 36
Although the pathophysiology underlying GCIPL and pRNFL thinning is not entirely clear, the currently prevailing concept comprises retrograde degeneration secondary to axonal damage occurring at any point within the brain. 37 In previous studies, GCIPL thinning and to a lesser degree pRNFL thinning have shown marked associations with both level of disability and clinical progression of MS, as well as brain atrophy.10,38,39 Our study adds to this evidence that inner retinal layer thinning in MS correlates with chronic inflammation associated with the presence of PRL.
The INL seems to be less susceptible to retrograde degeneration, but increased INL thickness has been associated with increased inflammatory activity in MS, although this evidence is currently scarce.14,15,40 We found an association between a higher number of PRLs and higher INL thickness, potentially reflecting PRLs as a marker of active smoldering disease/chronic inflammation rather than accumulated neuroaxonal damage, opening an important question of whether PRLs might serve as a therapeutic target to prevent future neuroaxonal loss.
Some limitations of this study need to be acknowledged. The sample size is relatively small and the retrospective study design carries a variety of potential biases, although these are mitigated by the detailed and standardized characterization of patients within the VMSD. 17 We also did not have MRI-based measurement of brain volume available, which presents the most commonly used method for assessment of neurodegeneration in MS. Moreover, as only 10 patients had progressive MS, our results can only be partially applied to this group of patients, in whom PRLs seem to play a particularly important role.
As PRLs show slow expansion in time but need years to evolve, a question to be addressed next would be whether progression of inner retinal layer thinning in MS is associated with the number of PRLs—or even more informative—with their evolution over time. However, this would require longitudinal data, observing patients over years to see whether dynamics in PRLs are a risk factor for retinal layer thinning in pwMS, which is not available yet.
In conclusion, patients with PRLs have lower pRNFL and GCIPL thicknesses providing further evidence of their significance as a valuable indicator of neurodegenerative processes in MS pathophysiology. In this way, PRLs and OCT present complementary biomarkers of MS-associated neuroaxonal damage that may soon be implemented into routine disease monitoring in pwMS.
Footnotes
Author contributions
N.K. contributed to study concept and design, acquisition of data, data management, statistical analysis and interpretation of data, and drafting of manuscript. A.D.-B. contributed to acquisition of data, interpretation of data, and critical revision of manuscript for intellectual content. F.L. contributed to acquisition of data, interpretation of data, and critical revision of manuscript for intellectual content. G.K. contributed to acquisition of data, interpretation of data, and critical revision of manuscript for intellectual content. B.P. contributed to acquisition of data, interpretation of data, and critical revision of manuscript for intellectual content. B.K. contributed to acquisition of data, interpretation of data, and critical revision of manuscript for intellectual content. T.B. contributed to acquisition of data, interpretation of data, and critical revision of manuscript for intellectual content. P.S.R. contributed to acquisition of data, interpretation of data, and critical revision of manuscript for intellectual content. S.H. contributed to acquisition of data, interpretation of data, and critical revision of manuscript for intellectual content. H.L. contributed to acquisition of data, interpretation of data, and critical revision of manuscript for intellectual content. G.B. contributed to acquisition of data, interpretation of data, study supervision, and critical revision of manuscript for intellectual content.
Declaration of Conflicting Interests
The author(s) declared the following potential conflicts of interest with respect to the research, authorship, and/or publication of this article: N.K. has participated in meetings sponsored by, received speaker honoraria or travel funding from BMS/Celgene, Janssen-Cilag, Merck, Novartis, Roche, and Sanofi-Genzyme and held a grant for a Multiple Sclerosis Clinical Training Fellowship Program from the European Committee for Treatment and Research in Multiple Sclerosis (ECTRIMS). A.D.B.’s position as junior group leader for Translational Morphology in Neuroscience is supported by a research grant from Biogen. She has participated in meetings sponsored by, received speaker honoraria or travel funding from Biogen, Celgene (BMS), Merck, Novartis, Roche and Sanofi; and has received an unrestricted grant from Merck GmbH, an affiliate of Merck KGaA. F.L. has participated in meetings sponsored by or received honoraria for acting as an advisor/speaker for Bayer, Biogen, Celgene/BMS, Janssen, MedDay, Merck, Novartis, Roche, Sanofi-Genzyme, and Teva. G.K. has participated in meetings sponsored by, received speaker honoraria or travel funding from Biogen, and received honoraria for consulting from Biogen. B.P. has received honoraria for consulting from Novartis and speaker honoraria from Chiesi and Santen outside of the submitted work. B.K. has received honoraria for speaking and for consulting from Biogen, BMS-Celgene, Johnson&Johnson, Merck, Novartis, Roche, Teva, and Sanofi-Genzyme outside of the submitted work. No conflict of interest with respect to the present study. T.B. has participated in meetings sponsored by and received honoraria (lectures, advisory boards, consultations) from pharmaceutical companies marketing treatments for MS: Allergan, Bayer, Biogen, Bionorica, BMS/Celgene, GSK, GW/Jazz Pharma, Horizon, Janssen-Cilag, MedDay, Merck, Novartis, Octapharma, Roche, Sandoz, Sanofi-Genzyme, Teva, and UCB. His institution has received financial support in the past 12 months by unrestricted research grants (Biogen, Bayer, BMS/Celgene, Merck, Novartis, Roche, Sanofi-Genzyme, Teva, and for participation in clinical trials in multiple sclerosis sponsored by Alexion, Bayer, Biogen, Merck, Novartis, Octapharma, Roche, Sanofi-Genzyme, Teva). P.S.R. has received honoraria for consultancy/speaking from AbbVie, Allmiral, Alexion, Biogen, Merck, Novartis, Roche, Sandoz, Sanofi Genzyme, and Teva and has received research grants from Amicus, Biogen, Merck, and Roche. S.H. has participated in meetings sponsored by or received speaker honoraria or travel funding from Biogen and Sanofi-Aventis. H.L. has received honoraria for lectures from Novartis, Biogen, ROCHE, Merck, and Sanofi Aventis. G.B. has participated in meetings sponsored by, received speaker honoraria or travel funding from Biogen, Celgene/BMS, Lilly, Merck, Novartis, Roche, Sanofi-Genzyme, and Teva, and received honoraria for consulting Biogen, Celgene/BMS, Novartis, Roche, Sanofi-Genzyme, and Teva. He has received unrestricted research grants from Celgene/BMS and Novartis.
Funding
The author(s) received no financial support for the research, authorship, and/or publication of this article.