
Abstract
Background:
Paramagnetic rim lesions (PRLs) have been linked to higher clinical disease severity and relapse frequency. However, it remains unclear whether PRLs predict future, long-term disease progression.
Objectives:
The study aimed to assess whether baseline PRLs were associated with subsequent long-term (10 years) Expanded Disability Status Scale (EDSS) increase and relapse frequency and, if so, whether PRL-associated EDSS increase was mediated by relapse.
Methods:
This retrospective analysis included 172 people with multiple sclerosis (pwMS) with 1868 yearly clinical visits over a mean follow-up time of 10.2 years. 3T magnetic resonance imaging (MRI) was acquired at baseline and PRLs were assessed on quantitative susceptibility mapping (QSM) images. The associations between PRLs, relapse, and rate of EDSS change were assessed using linear models.
Results:
PRL+ pwMS had greater overall annual relapse rate (β = 0.068; p = 0.010), three times greater overall odds of relapse (exp(β) = 3.472; p = 0.009), and greater rate of yearly EDSS change (β = 0.045; p = 0.010) than PRL− pwMS. Greater PRL number was associated with greater odds of at least one progression independent of relapse activity (PIRA) episode over follow-up (exp(β) = 1.171, p = 0.009). Mediation analysis showed that the association between PRL presence (yes/no) and EDSS increase was 96.7% independent of relapse number.
Conclusion:
PRLs are a marker of aggressive ongoing disease inflammatory activity, including more frequent future clinical relapses and greater long-term, relapse-independent disability progression.
Keywords
Introduction
Chronic active lesions (CALs) are a promising marker of chronic multiple sclerosis (MS) disease. 1 CALs are the localized areas of inflammation in the central nervous system that persists even with an intact blood–brain barrier. 2 Pathologically, these lesions can present as a demyelinated core surrounded by a rim of iron-rich microglia. 3 This rim of iron can be visualized in vivo using iron-sensitive magnetic resonance imaging (MRI) sequences, including quantitative susceptibility mapping (QSM), and are called paramagnetic rim lesions (PRLs) when visualized on iron-sensitive MRI. 4
PRLs are specific to MS and have been linked to greater clinical disease severity, brain atrophy, and relapse rate.5–7
Several studies have evaluated the predictive value of PRLs on disease progression and reported encouraging results, but their findings have been limited by short follow-up periods (median of less than 5 years), small sample sizes (as low as eight people with MS (pwMS)), or have found weak predictive value of PRLs on disability progression.8–13 Therefore, it remains unclear whether PRLs are a biomarker for a more aggressive disease course over timeframes relevant to long-term disease progression (e.g. 10 years).
In this study, we aimed to investigate the relationship between baseline PRLs and long-term clinical disability worsening and clinical relapse. Our objectives were to determine whether PRLs are specifically linked to more aggressive long-term disease course, including greater Expanded Disability Status Scale (EDSS) worsening and more frequent clinical relapses, and if so, whether PRL-associated EDSS worsening was mediated by relapse activity.
Methods
Study design
This retrospective study included 172 pwMS who were enrolled from 2009 to 2012 and received a baseline MRI scan. These individuals were originally part of a larger study, the cardiovascular, environmental, and genetic study in MS (CEG-MS). 14 The inclusion criteria for the CEG-MS study were (1) age 18–75 years and (2) meet the revision of the McDonald criteria of 2010 for MS or clinically isolated syndrome (CIS) diagnosis. Exclusion criteria were (1) contraindications for MRI examination, (2) pregnancy or nursing, and (3) clinical relapse or use of intravenous corticosteroid therapy within 30 days of the MRI examination. Full details of the inclusion and exclusion criteria are available elsewhere. 14 The larger CEG-MS study was approved by the Institutional Review Board of the University at Buffalo and all participants provided written informed consent in accordance with the Declaration of Helsinki. Additional inclusion criteria for this study included (1) baseline MRI scan within 30 days of a baseline clinical visit, including a three-dimensional (3D) T2*-weighted gradient echo (for QSM processing), (2) at least two follow-up clinical assessments, each at least 1 year apart, and (3) total time between the first and last clinical visits greater than 5 years. Participants were excluded from the current study if artifacts on their baseline scans prevented analysis.
Imaging methods
Imaging was conducted on a 3T scanner (Signa Excite HD 12.0; General Electric, Milwaukee, WI, USA) using an eight-channel head-and-neck coil. The same 3D gradient echo sequence with first-order flow compensation in read and slice directions was used for all participants (matrix, 512 × 192 × 64; 0.5 × 1 × 2 mm3; 12° flip; echo time (TE) = 22 ms; repetition time (TR) = 40 ms; bandwidth = 13.89 kHz). In addition to this, the following sequences were also acquired for all subjects during the same imaging session: spin-echo T1-weighted (T1w) imaging (matrix, 256 × 192 mm2; FOV, 256 × 192 mm2; TE = 16 ms; TR = 600 ms), FLAIR (matrix, 256 × 192 mm2; FOV, 256 × 192 mm2; TE = 120 ms; inversion time (TI) = 2100 ms; TR = 8500 ms; flip angle = 90°; echo train length = 24), dual fast spin-echo proton density-weighted and T2-weighted imaging (matrix, 256 × 192 mm2; field of view, 256 × 192 mm2; TE1 = 9 ms; TE2 = 98 ms; TR = 5300 ms; echo train length = 14), and a 3D high-resolution T1w inversion recovery fast spoiled gradient echo (IR-FSPGR; TE = 2.8 ms; TI = 900 ms; TR = 5.9 ms; flip angle = 10°; isotropic 1 mm resolution).
Image analysis
T2-FLAIR lesions, T1 lesions, and gadolinium-enhanced lesions were quantified using a semi-automated contouring technique, as previously described. 15 QSM reconstruction was previously described in detail elsewhere. 16 PRL regions of interest were identified and semi-automatically drawn on QSM by a researcher with 2 years’ lesion classification experience. QSM images were subsequently analyzed by senior researchers with more than 10 years of lesion classification experience, and PRL classifications were discussed in review meetings until a group consensus was reached. The raters were blind to clinical and demographic information. Details on rater training and reliability analyses are reported elsewhere. 17 PRL criteria were based on the 2022 NAIMS Consensus Statement on Imaging Chronic Active Lesions and included (1) presence of a paramagnetic rim that is continuous with at least two-thirds of the outer lesion edge, (2) a diamagnetic core relative to surrounding extra-lesional white matter, (3) maximum diameter ⩾ 3 mm, and (4) non-enhancement on post-contrast T1 sequence.
At baseline, normalized volumes of whole brain volume (NBV), white matter volume (NWMV), whole gray matter volume (NGMV), and lateral ventricular volume (NLVV) were calculated using SIENAX. 18 Normalized volumes of total deep gray matter (DGM) and thalamus volume were assessed using FIRST. 19
Confirmed disability progression, progression independent of relapse activity, and relapse-associated worsening evaluation
Confirmed disability progression evaluation
Disability progression was assessed through EDSS scores, which were determined by a clinical examination conducted by a neurologist specialized in MS or a Neurostatus-licensed investigator. 20 Confirmed disability progression (CDP) was defined as a definite EDSS increase between a baseline and follow-up visit, at least 6 months apart, sustained for at least one additional follow-up visit at least 6 months after the initial follow-up. A definite increase was defined as an EDSS increase in at least 1.5 for a baseline EDSS of 0, at least 1.0 for a baseline EDSS between 0.5 and 5.5, and at least 0.5 for a baseline EDSS greater than 5.5.
Progression independent of relapse activity evaluation
A progression independent of relapse activity (PIRA) event was defined as CDP during a relapse-free period. A relapse-free period was defined as the time between two consecutive relapses, starting at least 3 months after the first of the two relapses and at least 1 month from a subsequent relapse. A roving reference was used with the initial EDSS score defined as the baseline score, and EDSS scores re-baselined following a relapse.
Relapse-associated worsening evaluation
A relapse-associated worsening (RAW) event was defined as CDP with an associated relapse. For RAW, the relapse had to occur between two consecutive EDSS measurements, within 3 months of the first of two EDSS measurements, or within 1 month following the second EDSS measurement.
Relapse evaluations
Relapses were identified from medical charts by a trained medical doctor with expertise in MS (D.J.). A relapse was defined as an exacerbation of central nervous symptoms according to the established guidelines. 21 To be counted as a relapse, the activity had to be separated by at least 30 days from any previous relapse episodes and to last for at least 24 hours. The use of steroids without a clear definition of relapse worsening was not used as a criterion for the definition of the relapse. Clinical visit dates were used for relapse dates in cases where the exact relapse date was unknown. Relapses were categorized based on the functional score categories and symptom presentation as one of the following: bowel and bladder, brainstem, cerebellar, cerebral, polysymptomatic, pyramidal, sensory, vision, and other.
Statistical analyses
Univariate comparisons
Independent-samples t-tests and Mann–Whitney U test were used to compare parametric and non-parametric measures between the PRL+ and PRL− groups, whereas chi-square tests were used to compare categorical variables.
Linear models of relapse rates and prevalence
Annual relapse rate (ARR) and relapse prevalence (overall and for each relapse subtype) were compared between PRL+ and PRL− groups using regression models, controlling for baseline age, sex, baseline disease duration, baseline disease-modifying treatment (DMT) efficacy (none, low/moderate, or high), baseline T2 lesion volume (T2-LV), and baseline disease course. Models using the same covariates were used to compare relapse to PRL number and PRL category (1–3 or 4+ PRLs, with PRL− pwMS as the reference group). Binary logistic link functions were used in the relapse prevalence models. These analyses were performed for the whole cohort, and separately for the people with clinically isolated syndrome (pwCIS) and people with relapsing–remitting MS (pwRRMS) (n = 80; 8 pwCIS and 72 pwRRMS) who did not convert to progressive multiple sclerosis (PMS) over the duration of the study.
Linear models of EDSS change
Associations between PRLs and rate of EDSS change were evaluated using linear mixed-effects models with EDSS as the outcome variable. Models were conducted for PRL presence (yes/no), PRL number, and PRL category (with the PRL− group as the reference group). An initial model, “Full model,” included a main factor of PRL, main factor of time from baseline clinical visit, and PRL by time interaction, and covariate main factors of baseline age, sex, baseline T2-LV, baseline disease duration, per-visit DMT use, and per-visit disease course. A second model, “Full model w/relapses,” included an additional covariate containing binary indices (no = 0, yes = 1) specifying whether a relapse was reported at the time of the clinical visit or in the time since the previous visit. Mixed-effects models included random subject-specific intercepts and random subject-specific factor of time. Change over time for each PRL category (0, 1–3, and 4+, as previously described) 5 was visualized in profile plots of yearly group-mean EDSS change, along with zero-mean linear regression lines and 95% confidence intervals. All mixed-effects models were conducted using the “lme4” package in R (version 1.1-34). 22
Linear models of PIRA occurrence
Associations between PRLs and overall odds of PIRA occurrence (yes/no) were evaluated using generalized linear models. Models were conducted for PRL presence (yes/no), PRL number, and PRL category (0, 1–3, and 4+ PRLs) with PIRA occurrence as the outcome variable and a binary logistic link function. An initial model, “Model without T2-LV,” included covariates of sex, baseline age, baseline disease duration, overall follow-up time, baseline disease course, and baseline DMT use. A second model, “Model with T2-LV,” was conducted which also included baseline T2-LV as a covariate.
Mediation analysis
Mediation analysis was conducted using linear models controlling for baseline age, sex, baseline disease duration, baseline DMT efficacy (none, low/moderate, or high), baseline T2-LV, and baseline disease course. The direct effect of PRL presence on overall (pre-to-post) EDSS change was defined as the β value for PRL presence when including relapse number as a covariate, the overall effect of PRL presence was the β value without relapse number as a covariate, and the indirect effect of PRL presence was the overall effect minus the direct effect. The percentage effect of PRL presence mediated by relapse number was the indirect effect divided by the overall effect multiplied by 100. The results of mediation analysis were visualized in a path diagram.
Model assumptions were assessed using standard diagnostic plots. For all analyses, p-values lower than 0.05 were considered statistically significant.
Results
Demographics and clinical characteristics
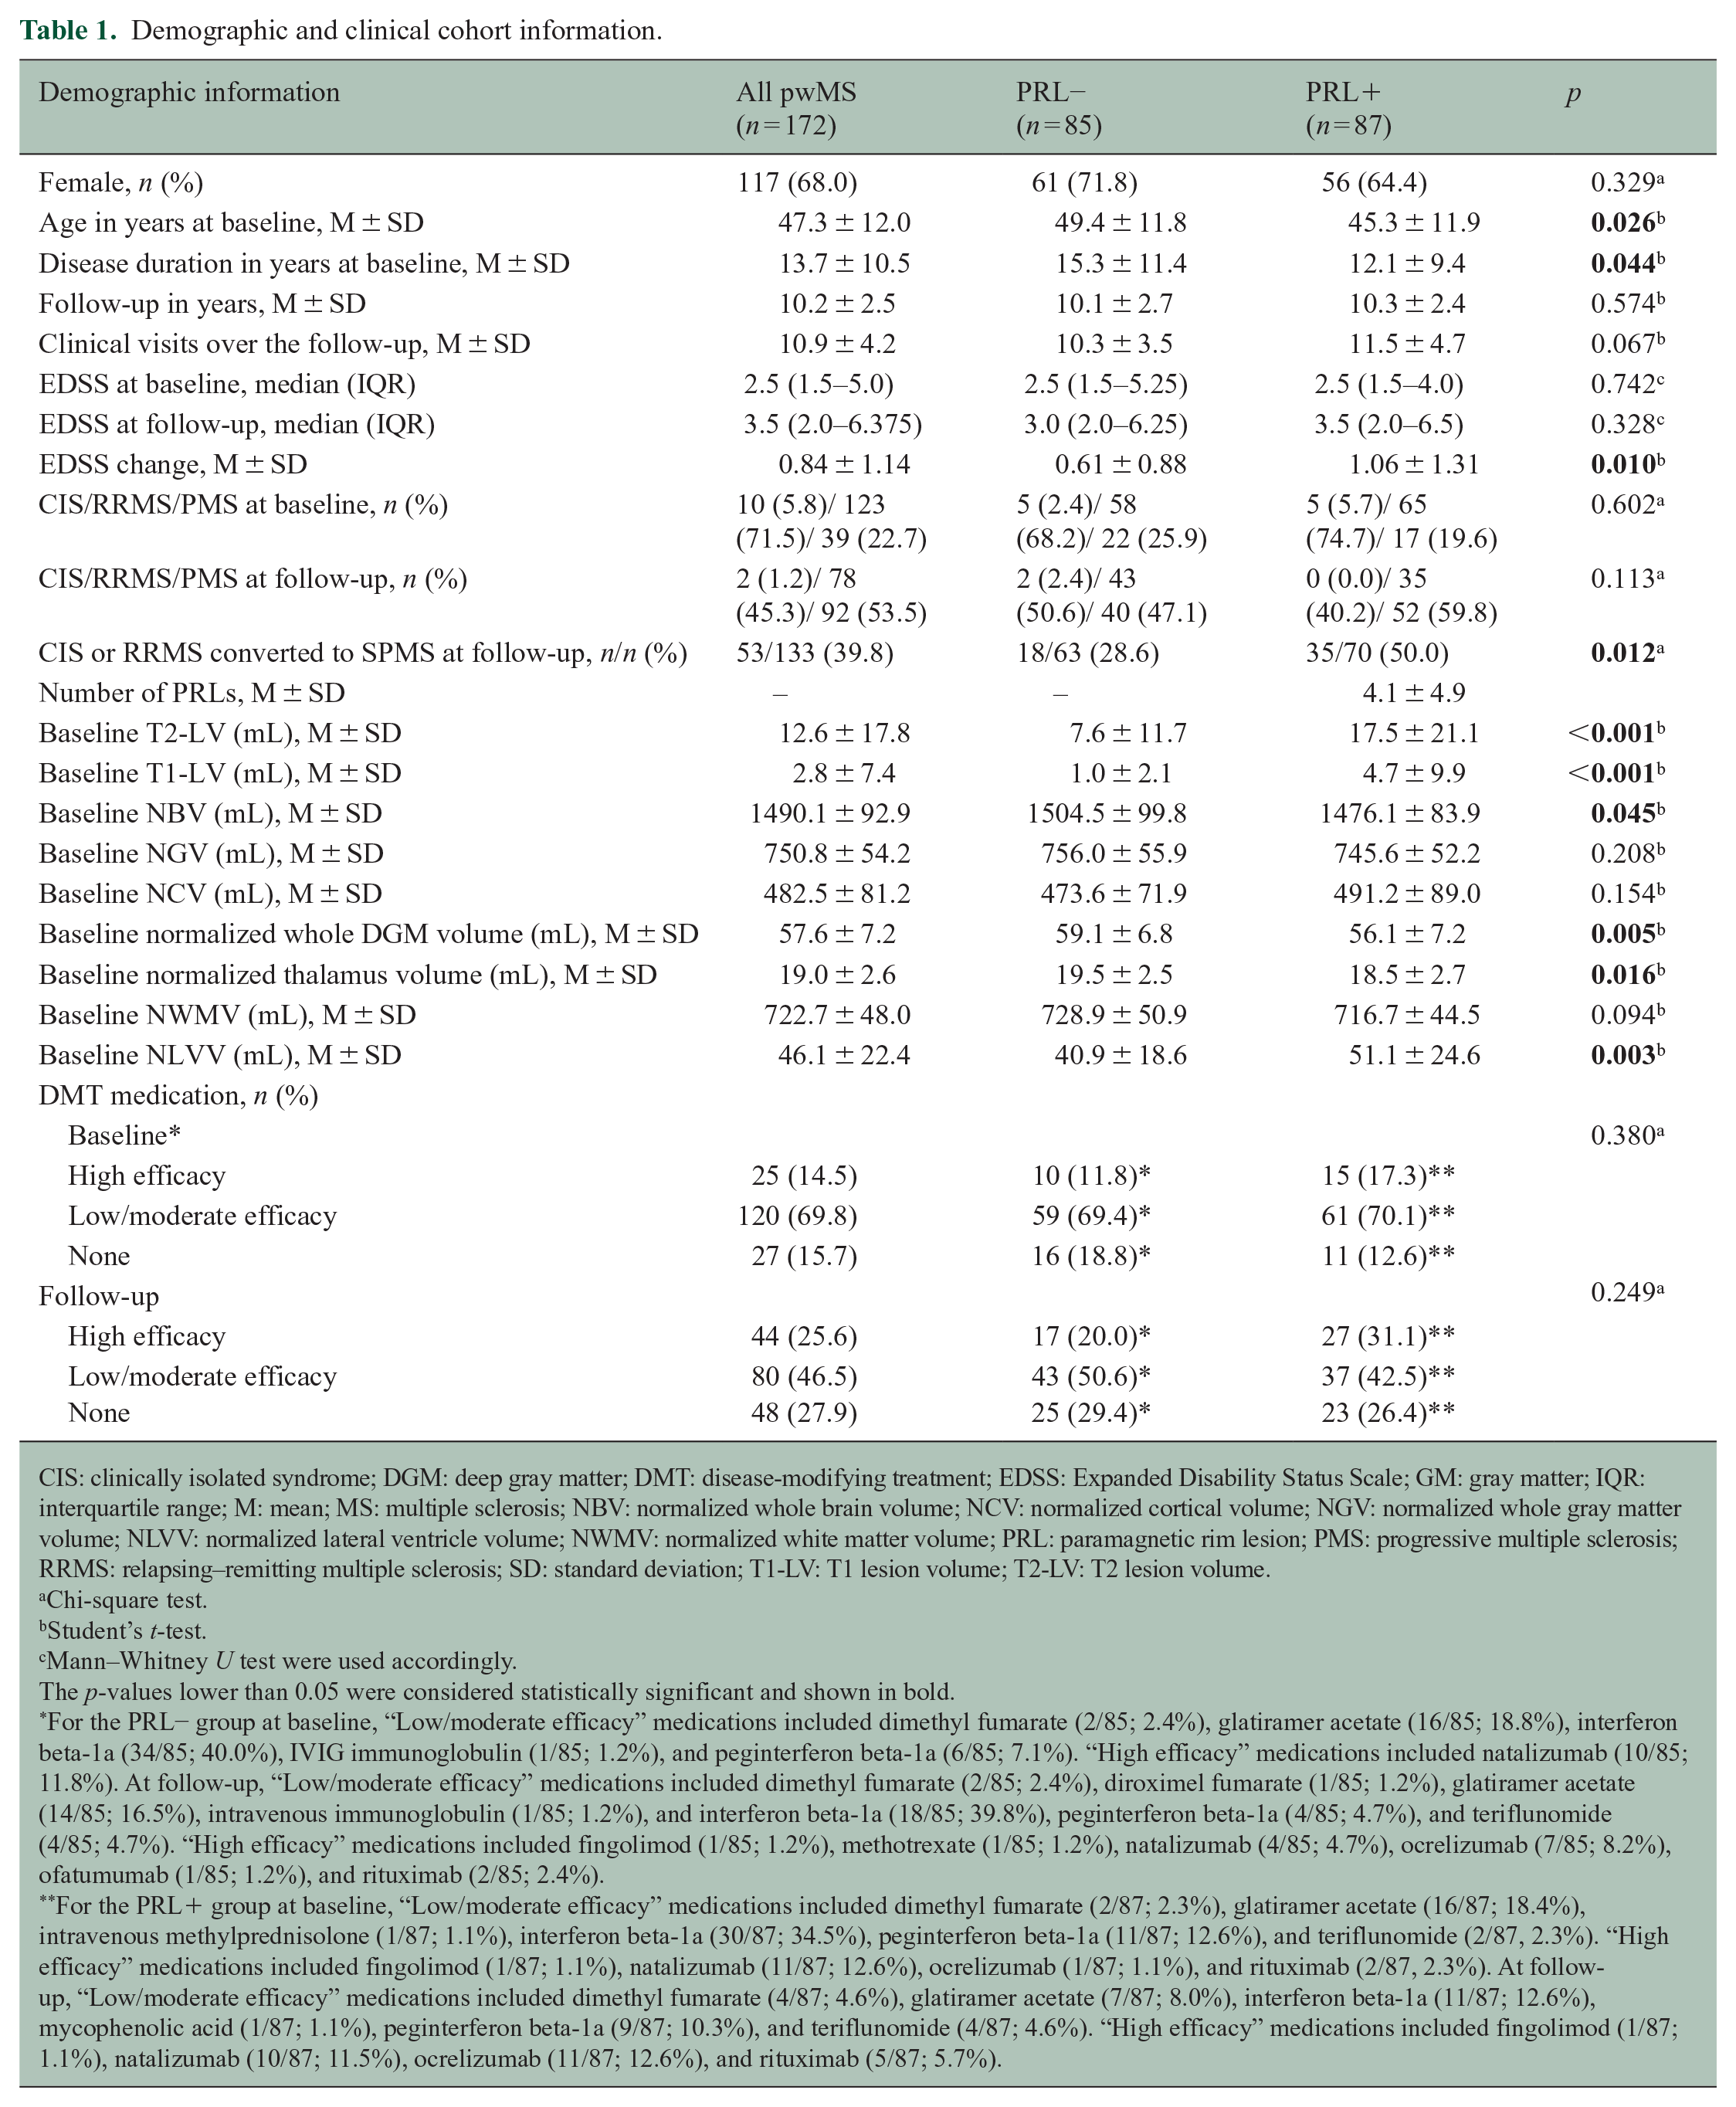
The final analyses included 1868 clinical visits from 172 pwMS (mean of 10.9 clinical visits per pwMS, mean baseline age 47.3 years, median baseline EDSS 2.5, 117 (68.0%) female) collected over an average overall follow-up time of 10.2 years. Notably, 87/172 (50.6%) of the pwMS were determined to have at least one PRL at baseline scan, with the PRL+ pwMS having a mean number of 4.1 PRLs. Full demographic and clinical information for the cohort is shown in Table 1.
Demographic and clinical cohort information.
CIS: clinically isolated syndrome; DGM: deep gray matter; DMT: disease-modifying treatment; EDSS: Expanded Disability Status Scale; GM: gray matter; IQR: interquartile range; M: mean; MS: multiple sclerosis; NBV: normalized whole brain volume; NCV: normalized cortical volume; NGV: normalized whole gray matter volume; NLVV: normalized lateral ventricle volume; NWMV: normalized white matter volume; PRL: paramagnetic rim lesion; PMS: progressive multiple sclerosis; RRMS: relapsing–remitting multiple sclerosis; SD: standard deviation; T1-LV: T1 lesion volume; T2-LV: T2 lesion volume.
Chi-square test.
Student’s t-test.
Mann–Whitney U test were used accordingly.
The p-values lower than 0.05 were considered statistically significant and shown in bold.
For the PRL− group at baseline, “Low/moderate efficacy” medications included dimethyl fumarate (2/85; 2.4%), glatiramer acetate (16/85; 18.8%), interferon beta-1a (34/85; 40.0%), IVIG immunoglobulin (1/85; 1.2%), and peginterferon beta-1a (6/85; 7.1%). “High efficacy” medications included natalizumab (10/85; 11.8%). At follow-up, “Low/moderate efficacy” medications included dimethyl fumarate (2/85; 2.4%), diroximel fumarate (1/85; 1.2%), glatiramer acetate (14/85; 16.5%), intravenous immunoglobulin (1/85; 1.2%), and interferon beta-1a (18/85; 39.8%), peginterferon beta-1a (4/85; 4.7%), and teriflunomide (4/85; 4.7%). “High efficacy” medications included fingolimod (1/85; 1.2%), methotrexate (1/85; 1.2%), natalizumab (4/85; 4.7%), ocrelizumab (7/85; 8.2%), ofatumumab (1/85; 1.2%), and rituximab (2/85; 2.4%).
For the PRL+ group at baseline, “Low/moderate efficacy” medications included dimethyl fumarate (2/87; 2.3%), glatiramer acetate (16/87; 18.4%), intravenous methylprednisolone (1/87; 1.1%), interferon beta-1a (30/87; 34.5%), peginterferon beta-1a (11/87; 12.6%), and teriflunomide (2/87, 2.3%). “High efficacy” medications included fingolimod (1/87; 1.1%), natalizumab (11/87; 12.6%), ocrelizumab (1/87; 1.1%), and rituximab (2/87, 2.3%). At follow-up, “Low/moderate efficacy” medications included dimethyl fumarate (4/87; 4.6%), glatiramer acetate (7/87; 8.0%), interferon beta-1a (11/87; 12.6%), mycophenolic acid (1/87; 1.1%), peginterferon beta-1a (9/87; 10.3%), and teriflunomide (4/87; 4.6%). “High efficacy” medications included fingolimod (1/87; 1.1%), natalizumab (10/87; 11.5%), ocrelizumab (11/87; 12.6%), and rituximab (5/87; 5.7%).
At baseline, the PRL+ pwMS were younger than the PRL− pwMS in age (mean 45.3 years for PRL+ and 49.4 years for PRL−; p = 0.026) and had lesser disease duration (mean 12.1 years for PRL+ and 15.3 years for PRL−; p = 0.044), but had similar EDSS (median 2.5 for PRL+ and 2.5 for PRL−; p = 0.742). The PRL+ pwMS had greater T2-LV, T1 lesion volume (T1-LV), and NLVV (p < 0.003), and smaller NBV, DGM volume, and normalized thalamus volume (p < 0.045), than the PRL− pwMS. At final follow-up, the PRL+ and PRL− pwMS had similar median EDSS (median 3.5 for PRL+ and 3.0 for PRL−; p = 0.328).
Longitudinally, the PRL+ pwMS had a greater overall increase in EDSS (mean 1.06 for PRL+ and 0.61 for PRL−; p = 0.010) than the PRL− pwMS. A greater proportion of PRL+ pwCIS or pwRRMS at baseline converted to secondary progressive multiple sclerosis (SPMS) at follow-up compared to PRL− (35/70 (50.0%) of PRL+ and 18/63 (28.6%) of PRL−; p = 0.012).
Relapse and disability progression characteristics
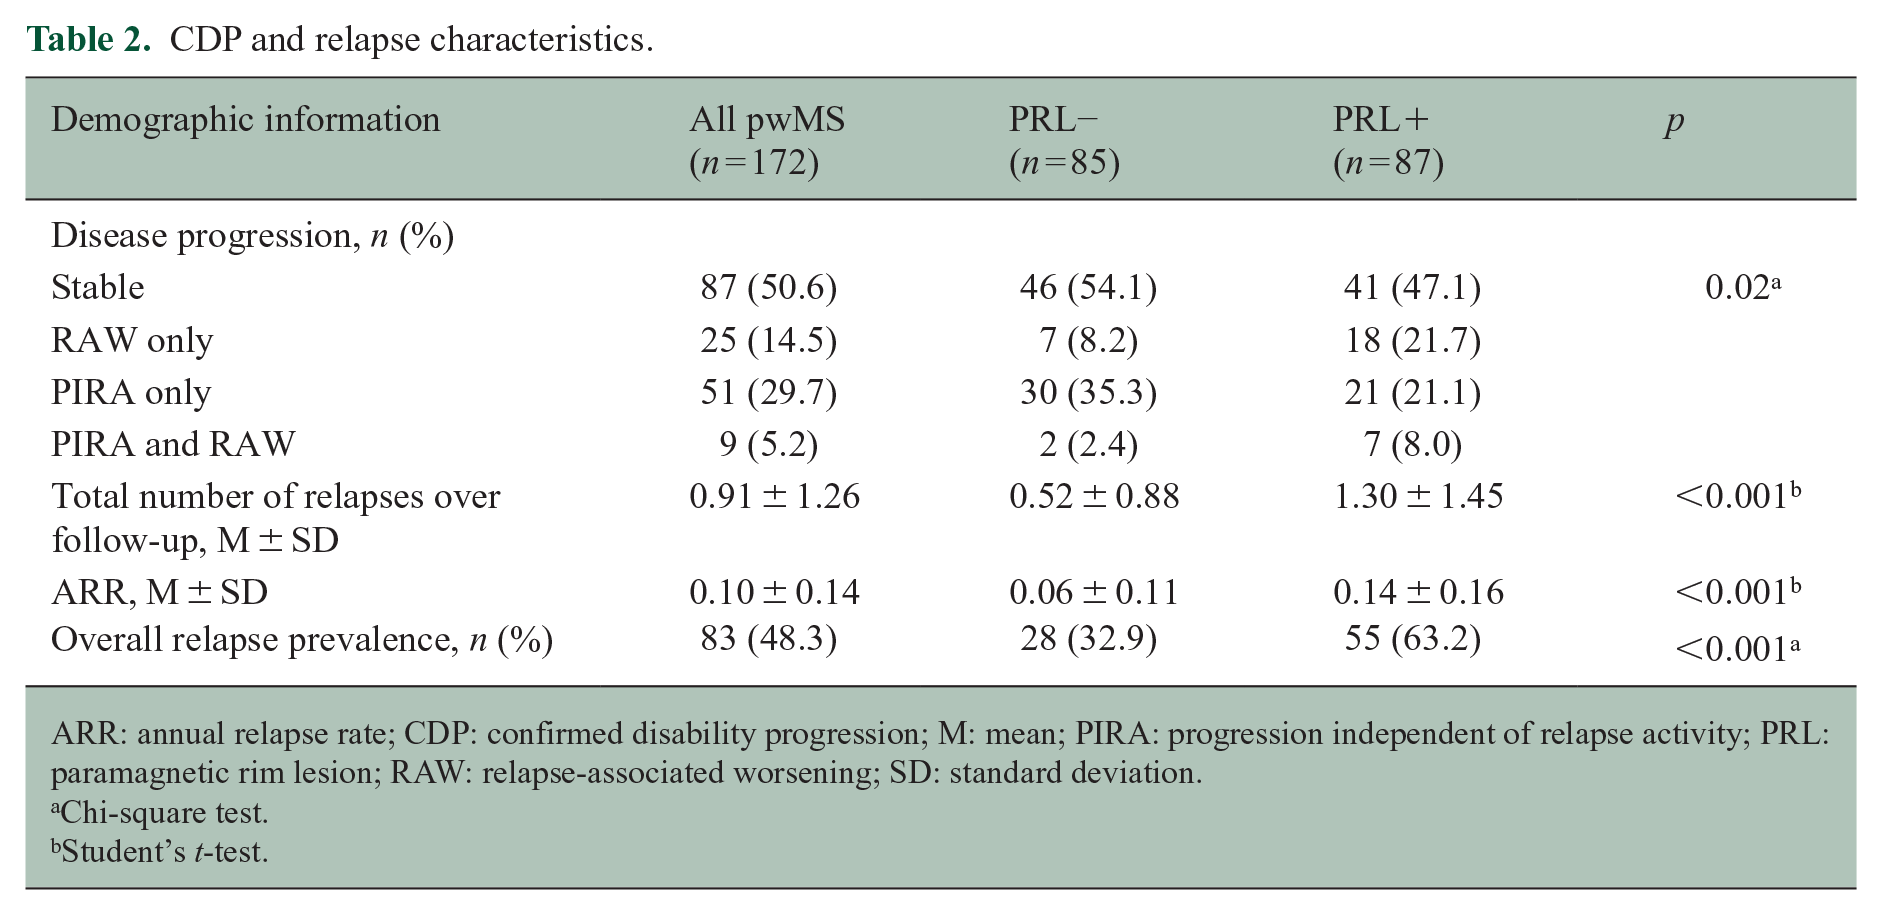
Table 2 shows the relapse and disability progression characteristics of the cohort. Longitudinally, the PRL+ pwMS had greater mean total number of relapses (mean 1.30 for PRL+ and 0.52 for PRL−; p < 0.001) and greater ARR (mean 0.14 for PRL+ and 0.06 for PRL−; p < 0.001). From the whole cohort, 50.6% were stable over follow-up, 14.5% had RAW only, 29.7% had PIRA only, and 5.2% had both RAW and PIRA. The proportions of pwMS in each of these categories significantly differed between PRL+ and PRL− groups (p = 0.02).
CDP and relapse characteristics.
ARR: annual relapse rate; CDP: confirmed disability progression; M: mean; PIRA: progression independent of relapse activity; PRL: paramagnetic rim lesion; RAW: relapse-associated worsening; SD: standard deviation.
Chi-square test.
Student’s t-test.
PRLs predict long-term relapse frequency
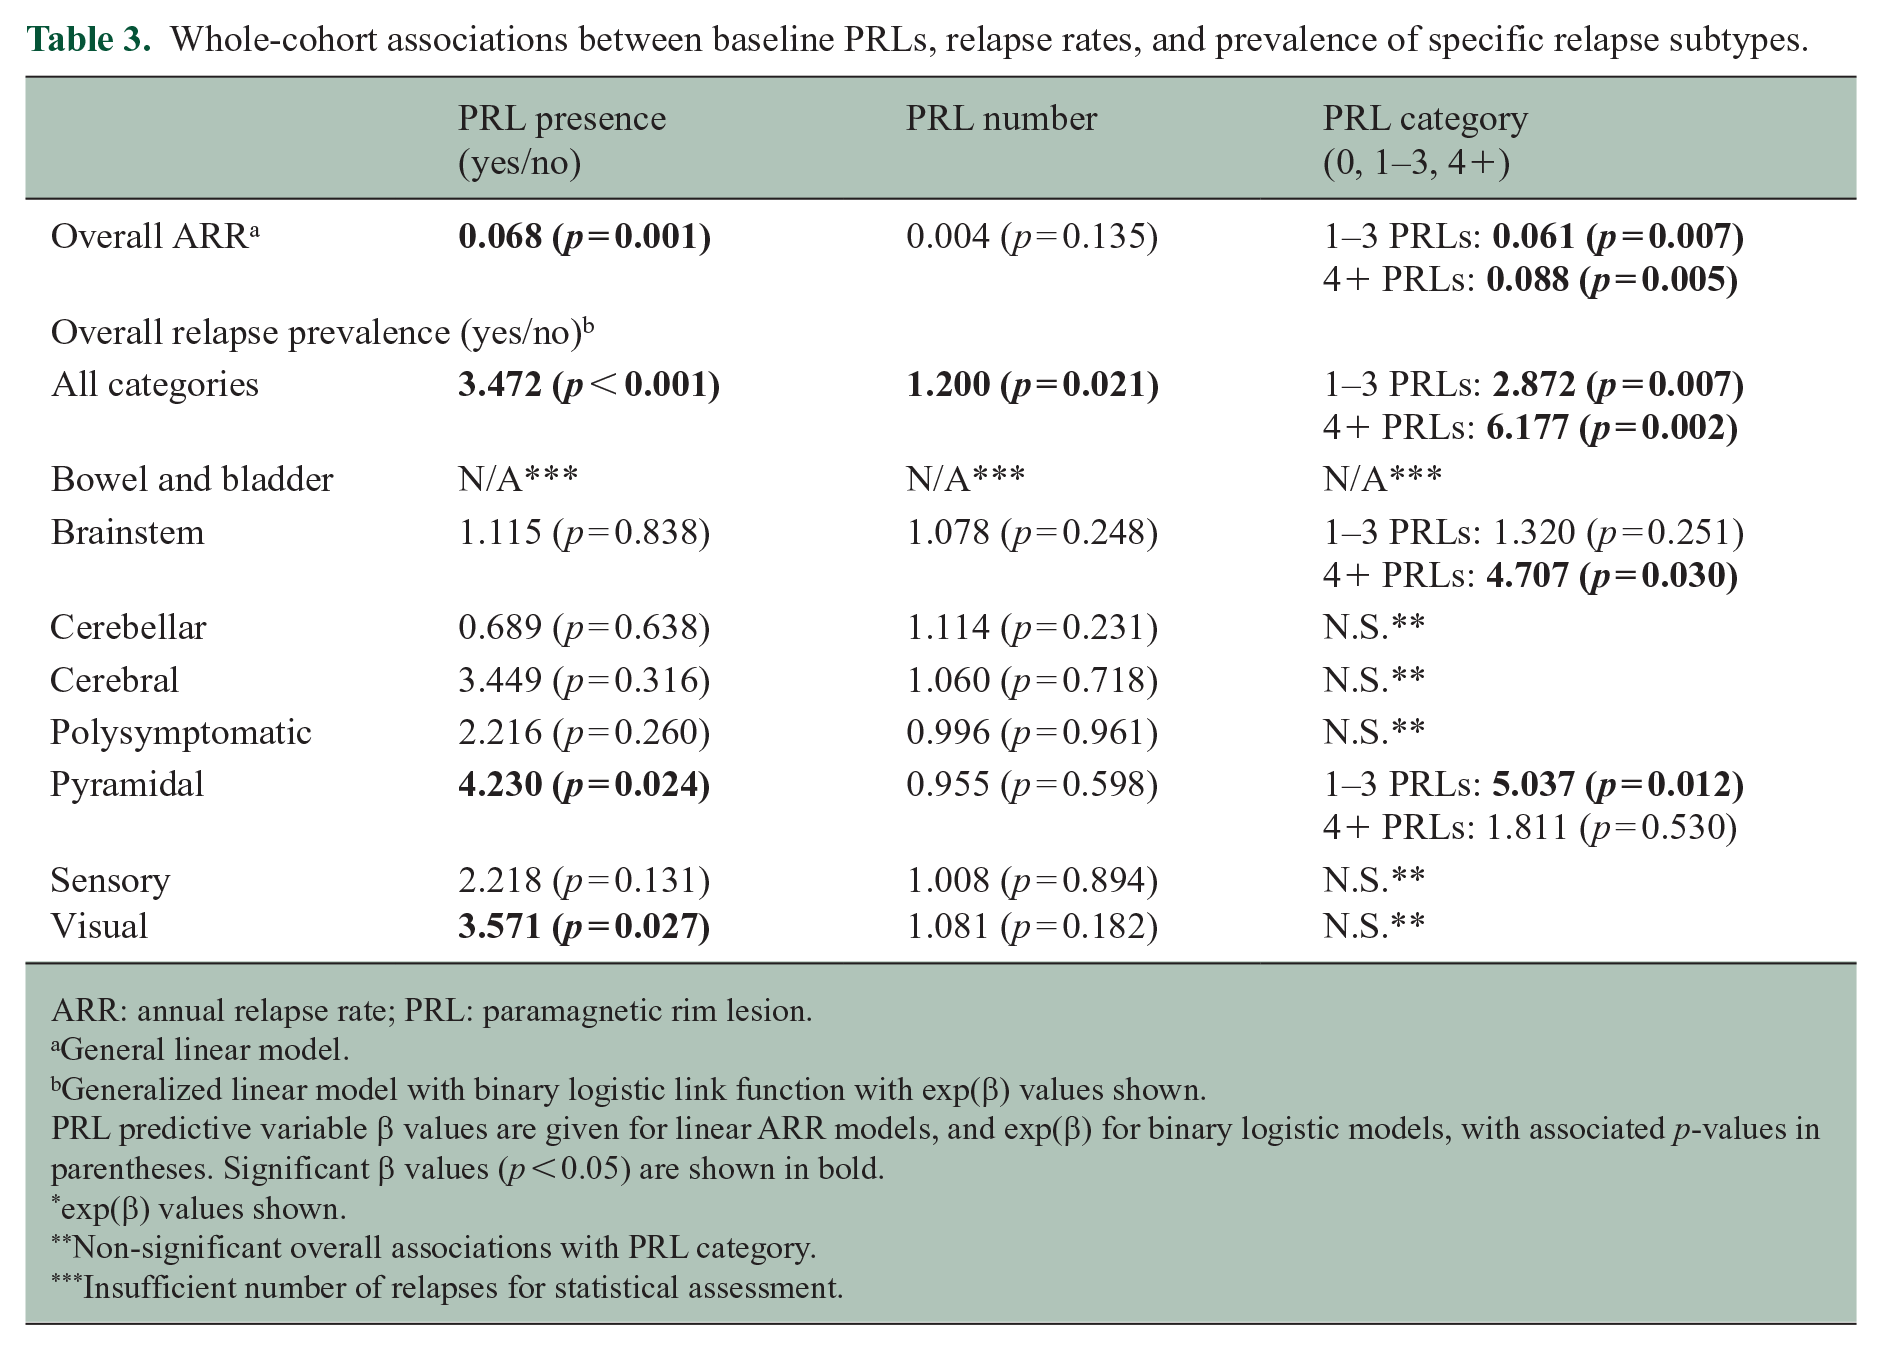
Table 3 shows the whole-cohort associations between PRL presence (yes/no), PRL number, or PRL category (0, 1–3, or 4+) and relapse. Overall ARR was greater in PRL+ pwMS compared to PRL− pwMS (β = 0.068; p = 0.001), and in pwMS with 1–3 PRLs (β = 0.061; p = 0.007) or 4+ PRLs (β = 0.088; p = 0.005) compared to pwMS with 0 PRLs. The odds of least one relapse event of any type occurring over the duration of the study was greater in PRL+ pwMS compared to PRL− pwMS (exp(β) = 3.472; p < 0.001), was greater in pwMS with 1–3 PRLs (exp(β) = 2.872; p = 0.007) or 4+ PRLs (exp(β) = 6.177; p = 0.002) compared to 0 PRLs, and increased with increasing PRL number (exp(β) = 1.200; p = 0.021). In addition, pwMS with 4+ PRLs had greater odds of a brainstem-subtype relapse (exp(β) = 4.707; p = 0.030), and pwMS with 1–3 PRLs had greater odds of a pyramidal-subtype relapse (exp(β) = 5.037; p = 0.012), compared to pwMS with 0 PRLs. Finally, PRL+ pwMS had greater odds of a pyramidal-subtype relapse (exp(β) = 4.230; p = 0.024) and visual-subtype relapse (exp(β) = 3.571; p = 0.027) compared to PRL− pwMS.
Whole-cohort associations between baseline PRLs, relapse rates, and prevalence of specific relapse subtypes.
ARR: annual relapse rate; PRL: paramagnetic rim lesion.
General linear model.
Generalized linear model with binary logistic link function with exp(β) values shown.
PRL predictive variable β values are given for linear ARR models, and exp(β) for binary logistic models, with associated p-values in parentheses. Significant β values (p < 0.05) are shown in bold.
exp(β) values shown.
Non-significant overall associations with PRL category.
Insufficient number of relapses for statistical assessment.
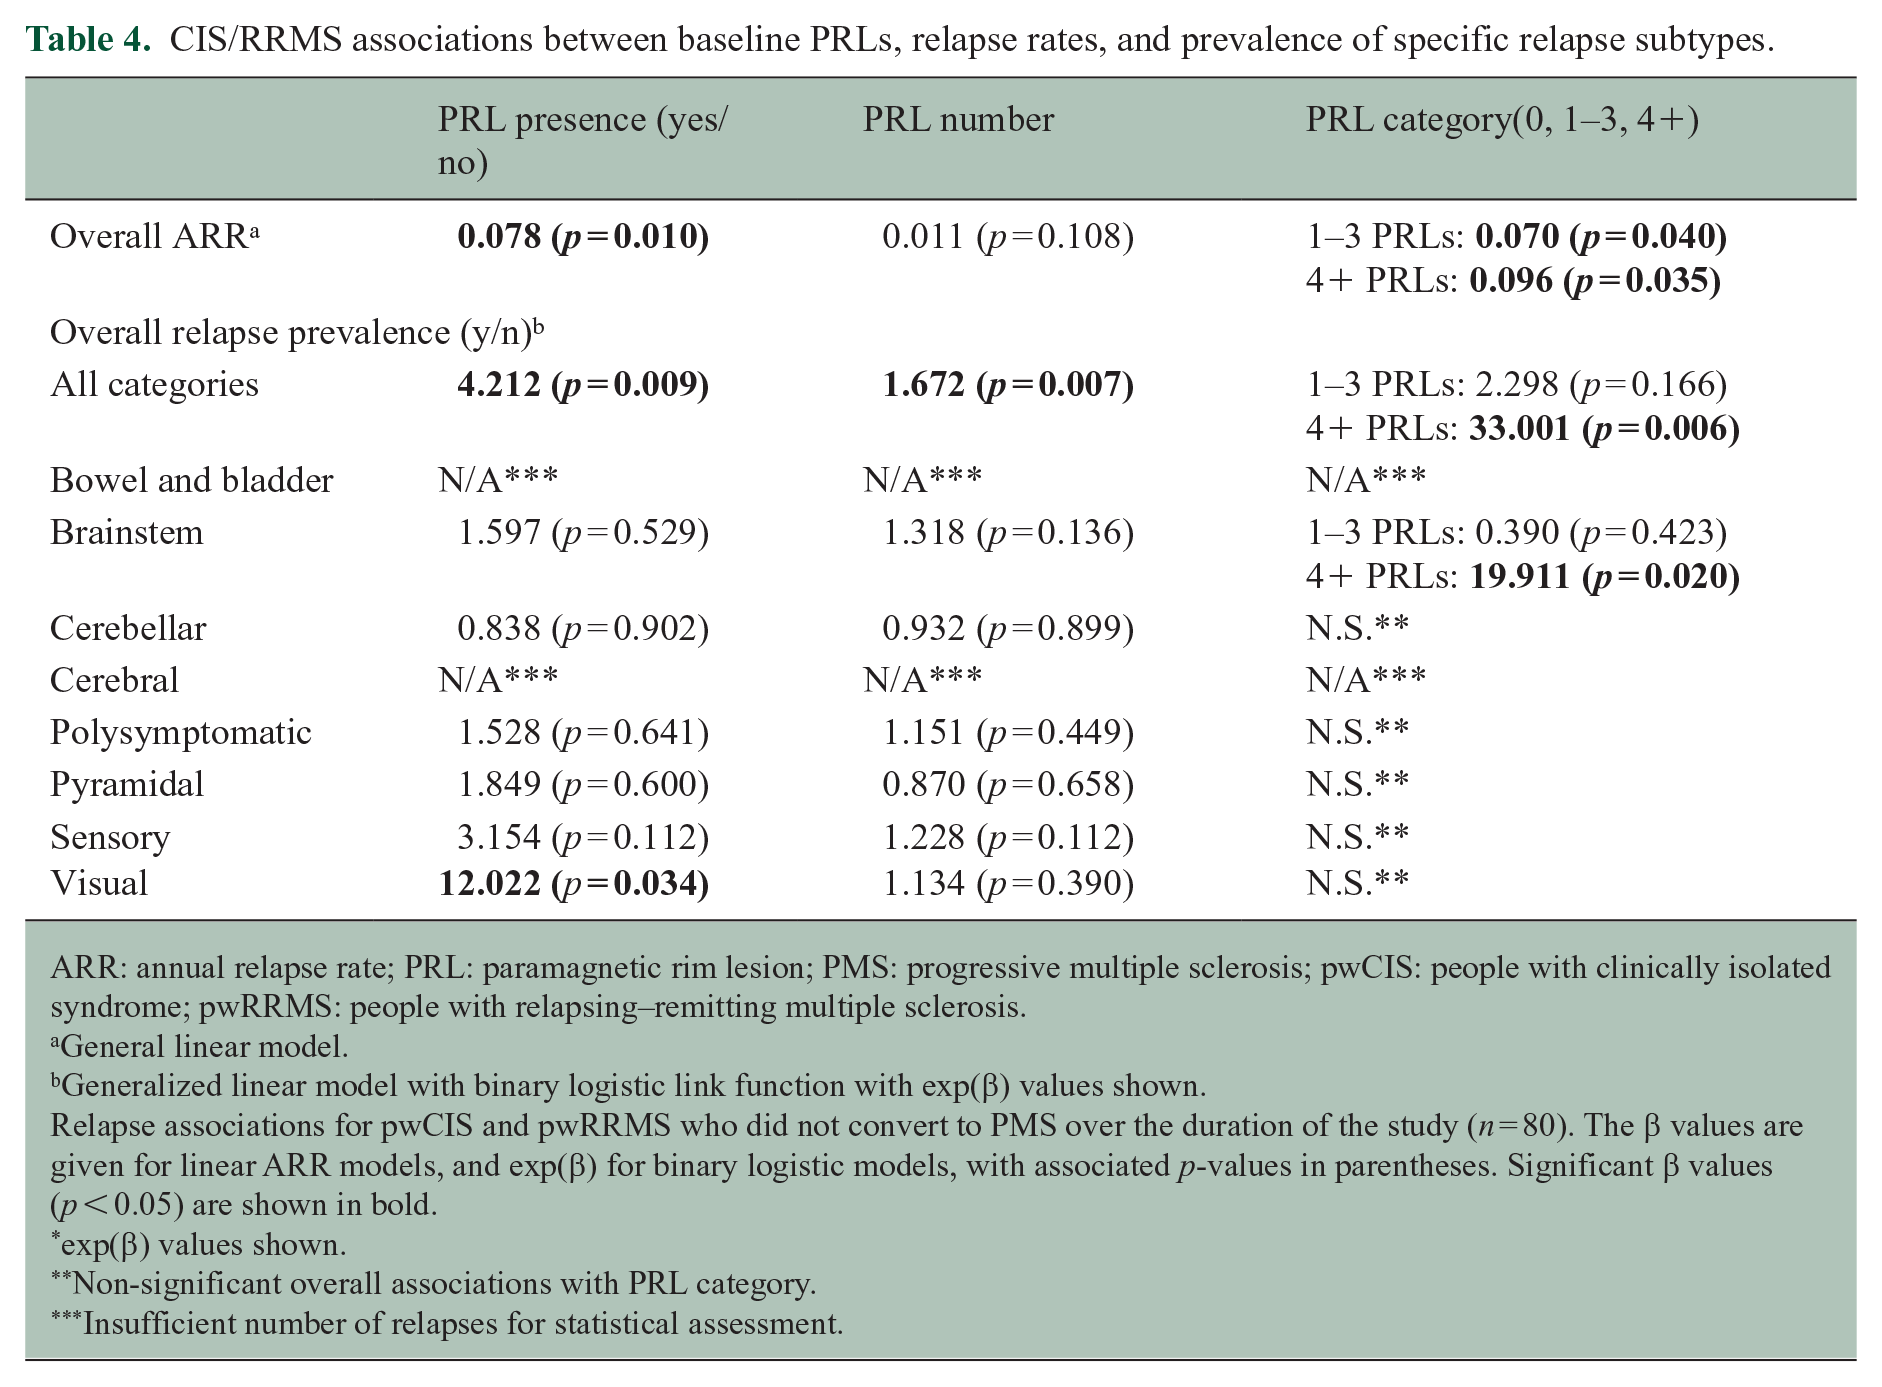
Relapse analyses on the subset of pwCIS or pwRRMS who did not convert to PMS confirmed the findings of greater overall ARR and greater relapse prevalence in PRL+ versus PRL− pwMS and pwMS with 1–3 or 4+ PRLs compared to PRL− pwMS. Similarly, the findings that PRL+ pwMS had greater odds of visual-subtype relapse, and pwMS with 4+ PRLs had greater odds of brainstem-subtype relapse, compared to PRL− pwMS, were also reproduced. Full results for these analyses are shown in Table 4.
CIS/RRMS associations between baseline PRLs, relapse rates, and prevalence of specific relapse subtypes.
ARR: annual relapse rate; PRL: paramagnetic rim lesion; PMS: progressive multiple sclerosis; pwCIS: people with clinically isolated syndrome; pwRRMS: people with relapsing–remitting multiple sclerosis.
General linear model.
Generalized linear model with binary logistic link function with exp(β) values shown.
Relapse associations for pwCIS and pwRRMS who did not convert to PMS over the duration of the study (n = 80). The β values are given for linear ARR models, and exp(β) for binary logistic models, with associated p-values in parentheses. Significant β values (p < 0.05) are shown in bold.
exp(β) values shown.
Non-significant overall associations with PRL category.
Insufficient number of relapses for statistical assessment.
PRLs predict long-term disability worsening
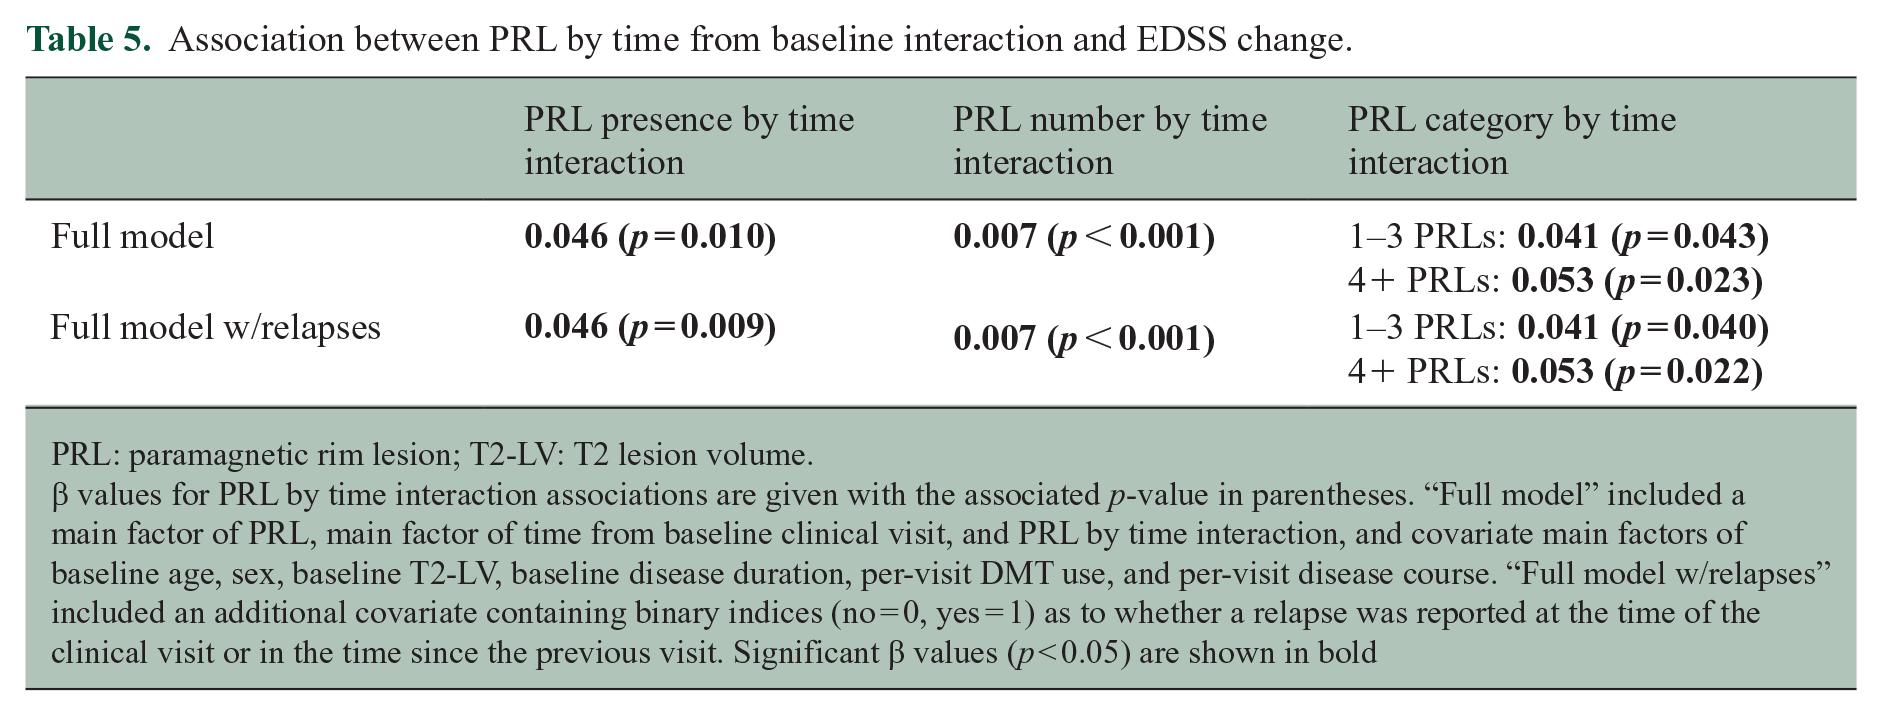
Figure 1 visualizes longitudinal EDSS change by PRL category and shows that the rate of EDSS change qualitatively increased from pwMS with 0 PRLs, to 1–3 PRLs, to 4+ PRLs. Table 5 shows mixed-effect model β values and associated p-values for the associations with PRL presence, PRL number, or PRL category, by time interaction on EDSS. In each model, PRL+ pwMS had a greater rate of EDSS change than PRL− pwMS (Full model: β = 0.046; p = 0.010), rate of EDSS change increased with number of PRLs (Full model: β = 0.007; p < 0.001), and pwMS with 1–3 PRLs (Full model: β = 0.041; p = 0.042) or 4+ PRLs (Full model: β = 0.053; p = 0.023) had a greater rate of EDSS change than pwMS with 0 PRLs. These coefficients remained significant in the “Full model w/relapse” with the additional relapse index covariate.
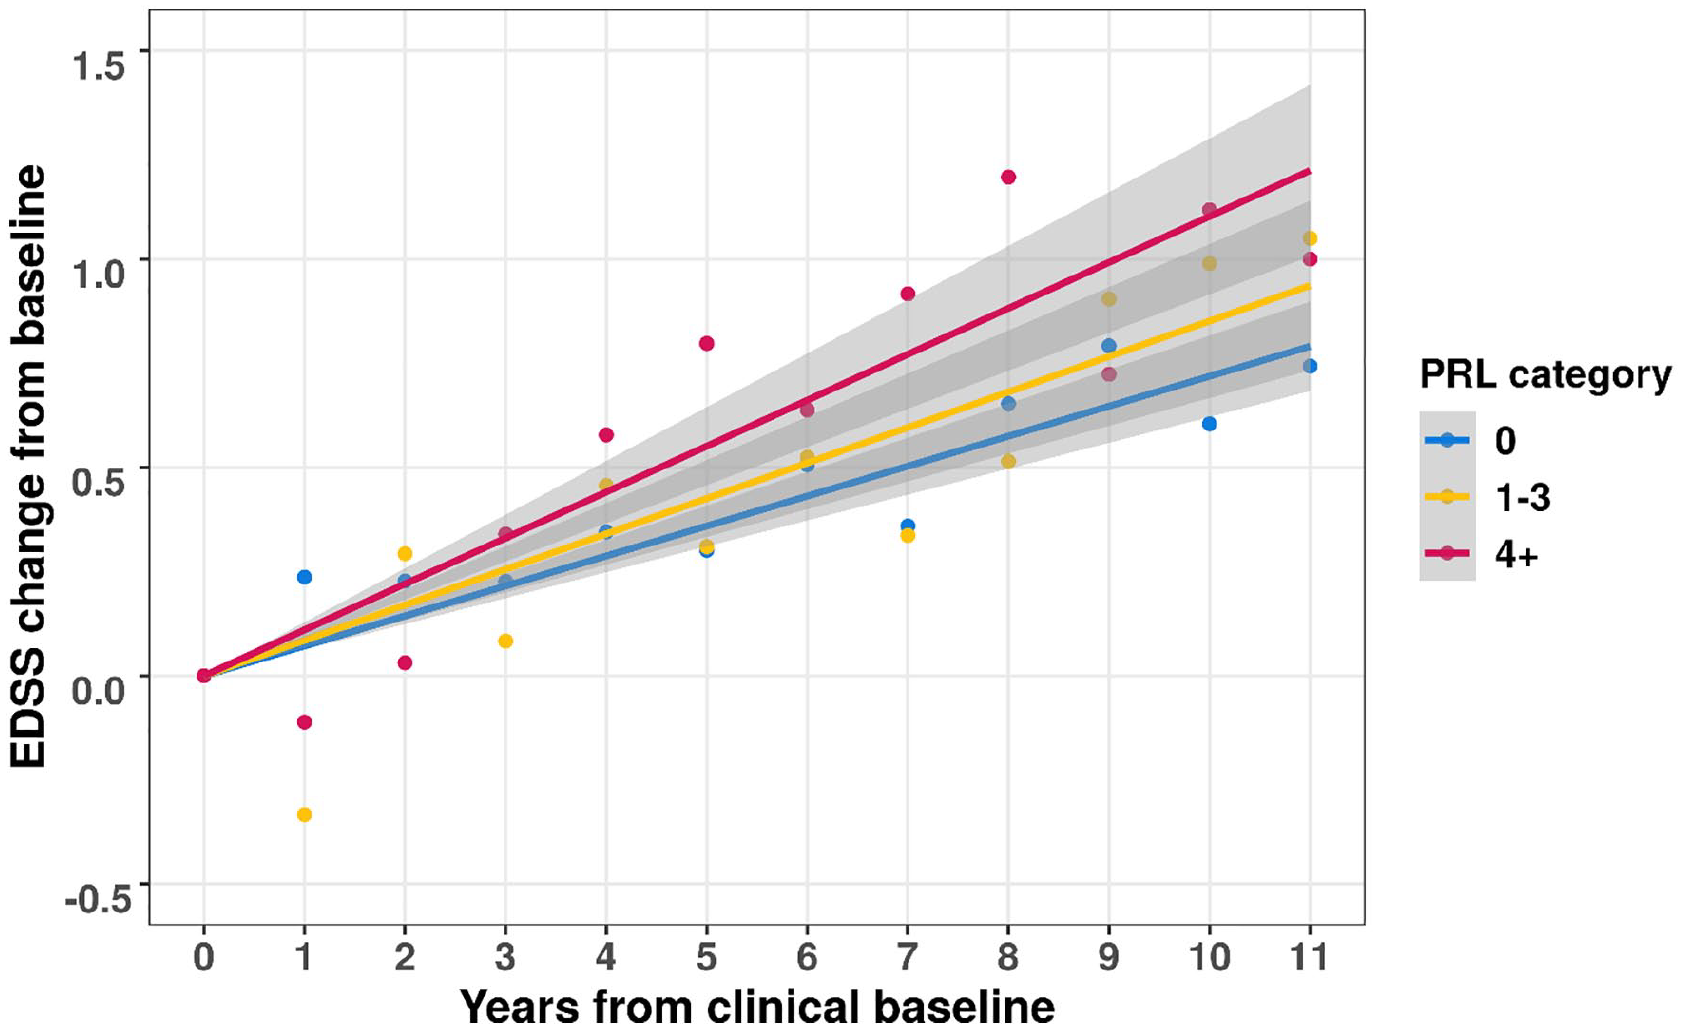
Profile plots visualizing longitudinal EDSS changes between PRL categories.
Association between PRL by time from baseline interaction and EDSS change.
PRL: paramagnetic rim lesion; T2-LV: T2 lesion volume.
β values for PRL by time interaction associations are given with the associated p-value in parentheses. “Full model” included a main factor of PRL, main factor of time from baseline clinical visit, and PRL by time interaction, and covariate main factors of baseline age, sex, baseline T2-LV, baseline disease duration, per-visit DMT use, and per-visit disease course. “Full model w/relapses” included an additional covariate containing binary indices (no = 0, yes = 1) as to whether a relapse was reported at the time of the clinical visit or in the time since the previous visit. Significant β values (p < 0.05) are shown in bold
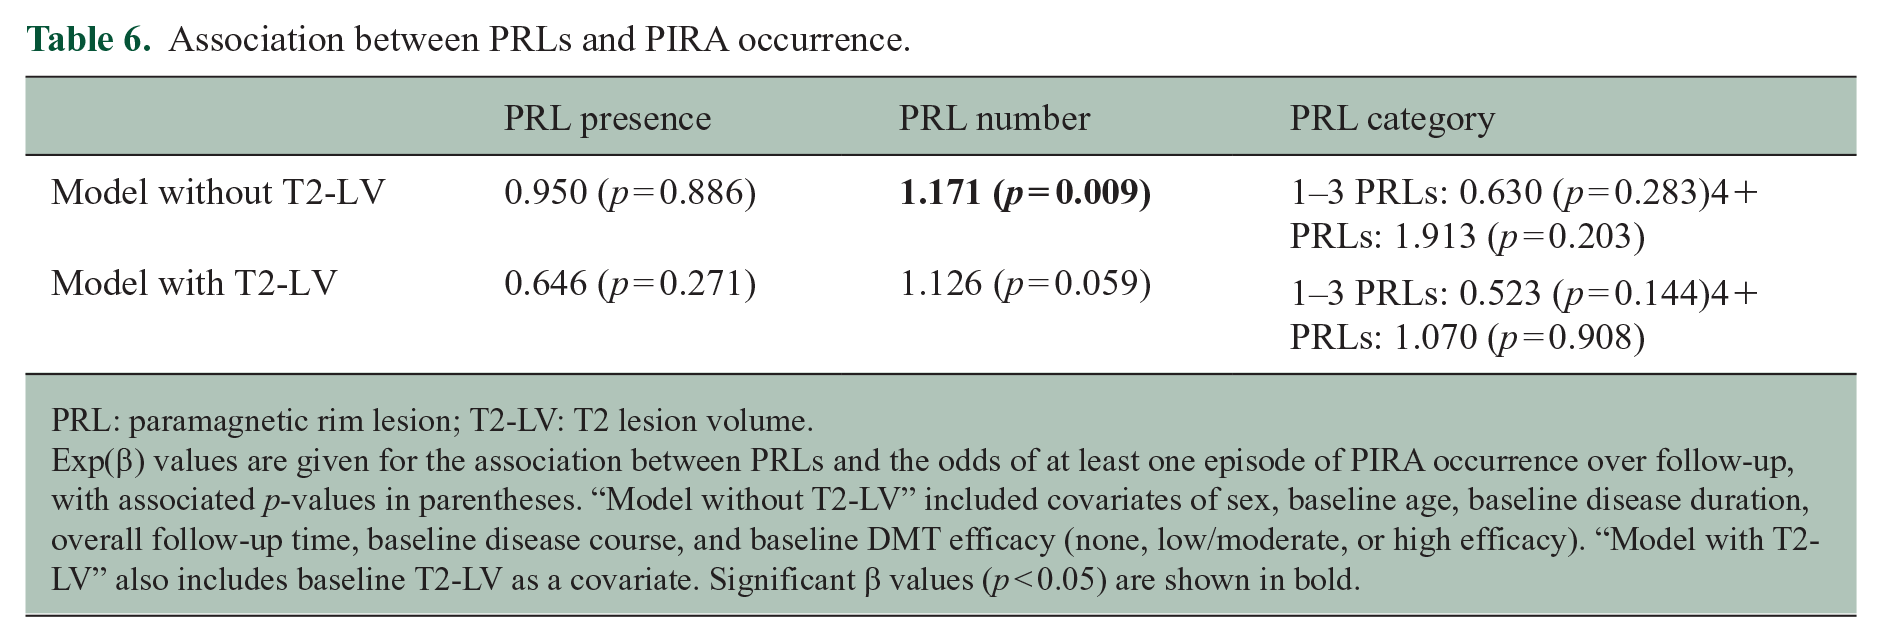
Table 6 shows linear model β values and associated p-values for the associations of PIRA occurrence (yes/no) with PRL presence, PRL number, and PRL category. Greater PRL number was significantly associated with greater odds of at least one PIRA episode occurring over follow-up (exp(β) = 1.171, p = 0.009) in an initial model excluding baseline T2-LV. This association became a trend in a secondary model including T2-LV as a covariate (exp(β) = 1.126, p = 0.059).
Association between PRLs and PIRA occurrence.
PRL: paramagnetic rim lesion; T2-LV: T2 lesion volume.
Exp(β) values are given for the association between PRLs and the odds of at least one episode of PIRA occurrence over follow-up, with associated p-values in parentheses. “Model without T2-LV” included covariates of sex, baseline age, baseline disease duration, overall follow-up time, baseline disease course, and baseline DMT efficacy (none, low/moderate, or high efficacy). “Model with T2-LV” also includes baseline T2-LV as a covariate. Significant β values (p < 0.05) are shown in bold.
Figure 2 visualizes the mediating effect of relapse number on the association between PRL presence and overall EDSS change. The overall effect of PRL presence on overall EDSS increase was 0.392 (p = 0.033) and the direct effect of PRL presence was 0.379 (p = 0.047). Relapse number mediated 3.3% of the association between PRL presence and overall EDSS increase.
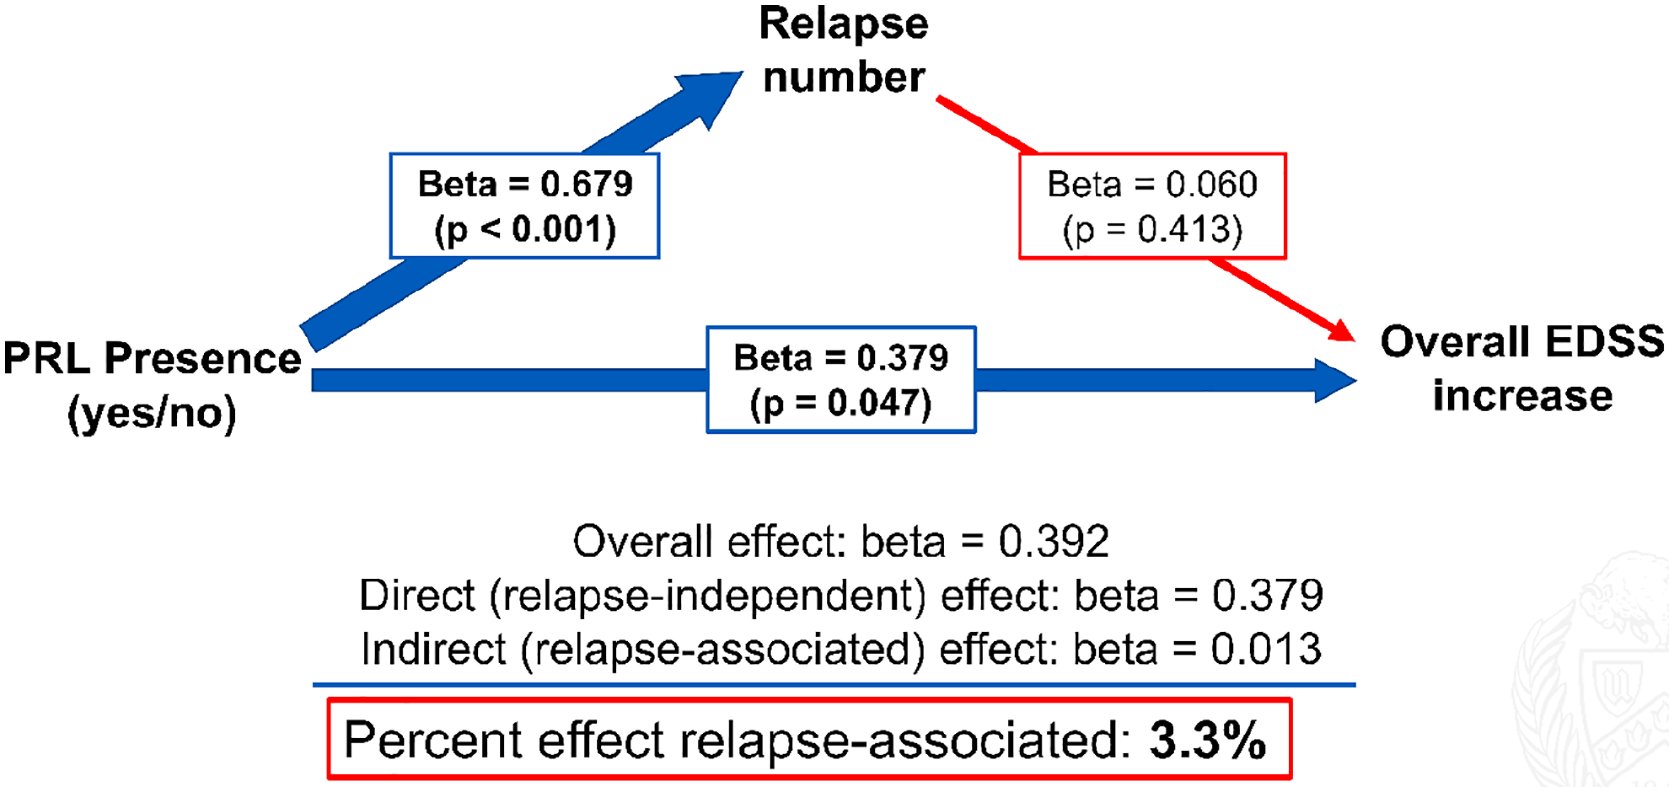
Mediation of relapse number on PRL-associated EDSS increase.
Discussion
Overall, our results show that the presence of PRLs is associated with greater relapse rate over long term (10 years). PRLs were most associated with brainstem and visual relapses. In addition, PRLs were associated with greater rates of EDSS progression. These findings are strengthened by the high number of yearly clinical visits included in the study (1868 visits from 172 pwMS), which provided a substantial dataset for mixed-effects modeling and enabled subgroup analysis of pwCIS and pwRRMS for relapse rates.
In a previous study of 42 pwMS followed over 2 years, we showed that pwMS experiencing relapse had greater incidence, number, and volume of PRLs than pwMS who did not experience relapse. 7 In this study, we partially reproduced and extended these results in a larger cohort of 172 pwMS by showing that PRL+ pwMS had greater ARR and relapse prevalence over a mean overall follow-up time of 10.2 years than PRL− pwMS. An analysis of the subset of pwCIS and pwRRMS confirmed that these results were not due to greater proportion of PRL+ pwMS having a progressive form of the disease. Further analysis showed that the relapses tended to be brainstem, visual, or pyramidal subtypes. It is unclear why this was the case, but may be due to preferential spatial localization of PRLs (e.g. periventricular). 23 Future work evaluating the association between lesions in these and other functionally relevant tracts may further elucidate the mechanistic underpinnings of MS symptomatology.
Our results showed that PRLs were associated with greater EDSS change independently of other potential confounding factors, such as baseline age, sex, and baseline T2-LV. In the mixed-effects models, PRL+ pwMS had an additional EDSS increase in 0.046 per year compared to PRL− pwMS, and patients with high PRL load (i.e. 4+ PRLs) had an additional EDSS increase in 0.052 per year compared to PRL− pwMS. Our results confirm and extend previously reported associations between PRLs and longitudinal EDSS increases with a larger cohort, longer overall follow-up times, a much greater number of clinical visits, and with the assessment of T2-LV as a potential confounding factor.9–11
A recent study showed that pwMS who experience PIRA have a greater average number of PRLs. 13 We replicated and extended these results by showing a similar association when controlling for factors, such as baseline age and disease course. This finding is important because it shows that PRLs predict PIRA at an individual level, in addition to the group level shown in the mixed-effects models, further exhibiting their utility as a clinical decision-making tool.
Mediation analysis showed that only 3.3% of the association between PRL presence and overall EDSS increase was mediated by relapse number. In addition, the positive associations between PRLs and EDSS increase were nearly unaltered in the mixed-effects models that included a per-visit relapse (yes/no) covariate (i.e. “Full model w/relapses”). These results provide evidence that PRLs are associated with relapse-independent EDSS progression, in addition to greater acute inflammatory (i.e. relapse) activity. It is likely that this relapse-independent effect is driven by gradual tissue destruction due to chronic active inflammation. 24
Interestingly, we found that among pwCIS or pwRRMS at baseline, those with at least one PRL were more likely to convert to SPMS over the follow-up. These results are in line with the previous reports that PRLs are associated with earlier conversion to SPMS. 5 Together, these findings may indicate that PRLs are the characteristic of a state of inflammation (acute and chronic) proceeding the progressive form of MS.
One limitation of this study is its retrospective, observational nature, which resulted in a lack of routine scheduled serial follow-up clinical visits for PIRA assessment, which may have masked PIRA episodes. Despite this limitation, we were able to replicate a previously described association between PIRA and PRL number. Future prospective studies are needed to confirm our initial results. Another limitation of the study is the use of a single baseline MRI scan, which limited assessment of how over time PRL changes (i.e. PRL appearance and disappearance) were associated with disability progression. Collection and analysis of follow-up scans is ongoing and will be the focus of future work. Finally, the mediation analysis relied on only two EDSS estimations and therefore was less precise (i.e. retained more noise) than the other analyses.
Conclusion
Presence of one or more PRLs at baseline is associated with greater relapse rates and greater rate of EDSS change over a mean follow-up time of 10.2 years, and number of PRLs is associated with greater odds of PIRA. These results provide evidence that PRLs are a marker of a more aggressive active disease course.
Footnotes
Acknowledgements
The authors thank Zach W and Daisy R for their feedback on the manuscript.
Data Availability Statement
The data that support the findings of this study are available on reasonable request from the corresponding author.
Declaration of Conflicting Interests
The author(s) declared the following potential conflicts of interest with respect to the research, authorship, and/or publication of this article: J.A.R., M.M., T.W., F.Sa., A.B., D.J., N.B., and F.Sc. have no conflicts of interest to disclose. M.G.D. has received personal compensation from Bristol Myers Squibb, Novartis, EMD Serono, and Keystone Heart, and financial support for research activities from Bristol Myers Squibb, Novartis, Mapi Pharma, Keystone Heart, Protembis, and V-WAVE Medical. B.W.G. has participated in speakers’ bureaus for, served as a consultant for, and has received research support from Biogen, EMD Serono, Novartis, Genentech, Celgene/Bristol Myers Squibb, Sanofi & Genzyme, Janssen, Horizon, Bayer, and Labcorp. Dr. B.W.G. also serves on the editorial board for BMJ Neurology, Children, CNS Drugs, MS International, and Frontiers Epidemiology. R.Z. has received personal compensation from Bristol Myers Squibb, EMD Serono, Sanofi, and Novartis for speaking and consultant fees; he received financial support for research activities from Sanofi, Novartis, Bristol Myers Squibb, Mapi Pharma, Keystone Heart, Protembis, and V-WAVE Medical.
Funding
The author(s) disclosed receipt of the following financial support for the research, authorship, and/or publication of this article: Research reported in this publication was supported by grants from the National Institutes of Health (grant no. R01NS114227 from the National Institute of Neurological Disorders and Stroke, and grant no. UL1TR001412 from the National Center for Advancing Translational Sciences). The content is solely the responsibility of the authors and does not necessarily represent the official views of the National Institutes of Health.