
Abstract
Background:
The circulating metabolome incorporates multiple levels of biological interactions and is an emerging field for biomarker discovery. However, few studies have linked metabolite levels with quantitative neurologic function assessments in people with multiple sclerosis (pwMS).
Objectives:
We quantified metabolomic differences between pwMS and healthy controls (HCs) and assessed the association of metabolites with disease severity.
Methods:
We profiled 517 metabolites using liquid chromatography-mass spectrometry (Biocrates Inc.) for participants from the MS Partners Advancing Technology and Health Solutions (MS PATHS). We conducted a multicenter cross-sectional study and applied linear regression to assess the association between metabolites and neurological function measures in multiple sclerosis (MS), including walking speed, manual dexterity, and processing speed.
Results:
Among 1010 participants (837 MS; 71.2% relapsing-remitting MS; 173 HC; mean age: 44.5 (standard deviation (SD): 11.4); 73.9% female; 12.7% non-white), pwMS showed decreased levels of phosphatidylcholines (PCs) and different amino acids (AAs) but increased triglycerides (TGs). Metabolites showed an association with worse neurologic function; for instance, a 1-SD decrease in PC aa C36:6 was associated with 21.36% (95% confidence interval (CI): 11.07–30.46; p = 1.35E−04) slower walking speed.
Conclusions:
This large study identified lipid alterations linked to MS severity. Future longitudinal studies will evaluate if these metabolite levels predict MS outcomes.
Keywords
Introduction
Multiple sclerosis (MS) is the most common neuroinflammatory disorder targeting the central nervous system (CNS). 1 The disease affects millions worldwide, mainly targeting young and middle-aged individuals.2,3 The heterogeneous pathoetiology of MS makes it difficult to identify reliable biomarkers for the disease. Currently, the diagnosis and monitoring of MS relies mainly on clinical evaluation and magnetic resonance imaging (MRI) results. Therefore, a deeper evaluation of possible disease biofluid biomarkers can supplement MRI and existing clinical measures.
Metabolomics offers a comprehensive “snapshot” of tissue-specific cellular metabolism and holds promise for developing MS biomarkers. Metabolic alterations were observed in people with multiple sclerosis (pwMS), some of which were associated with MS progression.4,5 However, existing studies have largely focused on differences in the metabolome of people with and without MS or considered singular measures of disability. Assessment of the association between changes in individual metabolites or metabolomic pathways with detailed quantitative measures of neurologic function, such as iPad®-based multiple sclerosis performance test (MSPT), can evaluate disease outcome severity.
Therefore, this study aimed to evaluate the connections between serum metabolomic profiles and the MS status and the association of metabolite levels with quantitative measures of neurologic function in a large multi-national cohort of pwMS.
Material and methods
Participants and sampling
We included pwMS and healthy controls (HCs) from the MS Partners Advancing Technology and Health Solutions (MS PATHS) network, a 10-site consortium enrolling people with MS from seven centers in the United States and three European centers. HCs were selected to be representative of the overall distribution of pwMS in MS PATHS (V.16.0) (Figure 1). MS PATHS was sponsored by Biogen.
6
During clinic visits, the study gathered standardized clinical information on MS, including the MSPT. This test uses a self-administered, iPad®-based, computerized system to measure neuroperformance and was designed to closely resemble the multiple sclerosis functional composite (MSFC).
7
Component tests assessed cognition (processing speed test, PST: a test measuring the number of correct responses, where higher scores indicate better cognition), upper extremity motor function (manual dexterity test, MDT: tablet-based timed 9-Hole Peg Test, where higher times reflect worse dexterity), and lower-extremity motor function (walking speed test, WST: a 25-foot timed walk, where higher times indicate slower walking speed). Demographic and clinical data were gathered, including age, sex, self-reported race, smoking status (categorized as never smoker, former smoker, current smoker, or unknown smoking history), and body mass index (BMI) derived from weight (kg) divided by height (m2). We classified BMI into three categories: Underweight (<18.5), healthy weight (18.5–24.9), overweight (25.0–29.9), and obesity (⩾30.0). In addition, MS-specific information was collected, such as the age at onset; disease courses (relapsing-remitting MS (RRMS), progressive MS (PMS), and other disease courses); and classes of disease-modifying therapies (DMTs) classified based on their efficacy (
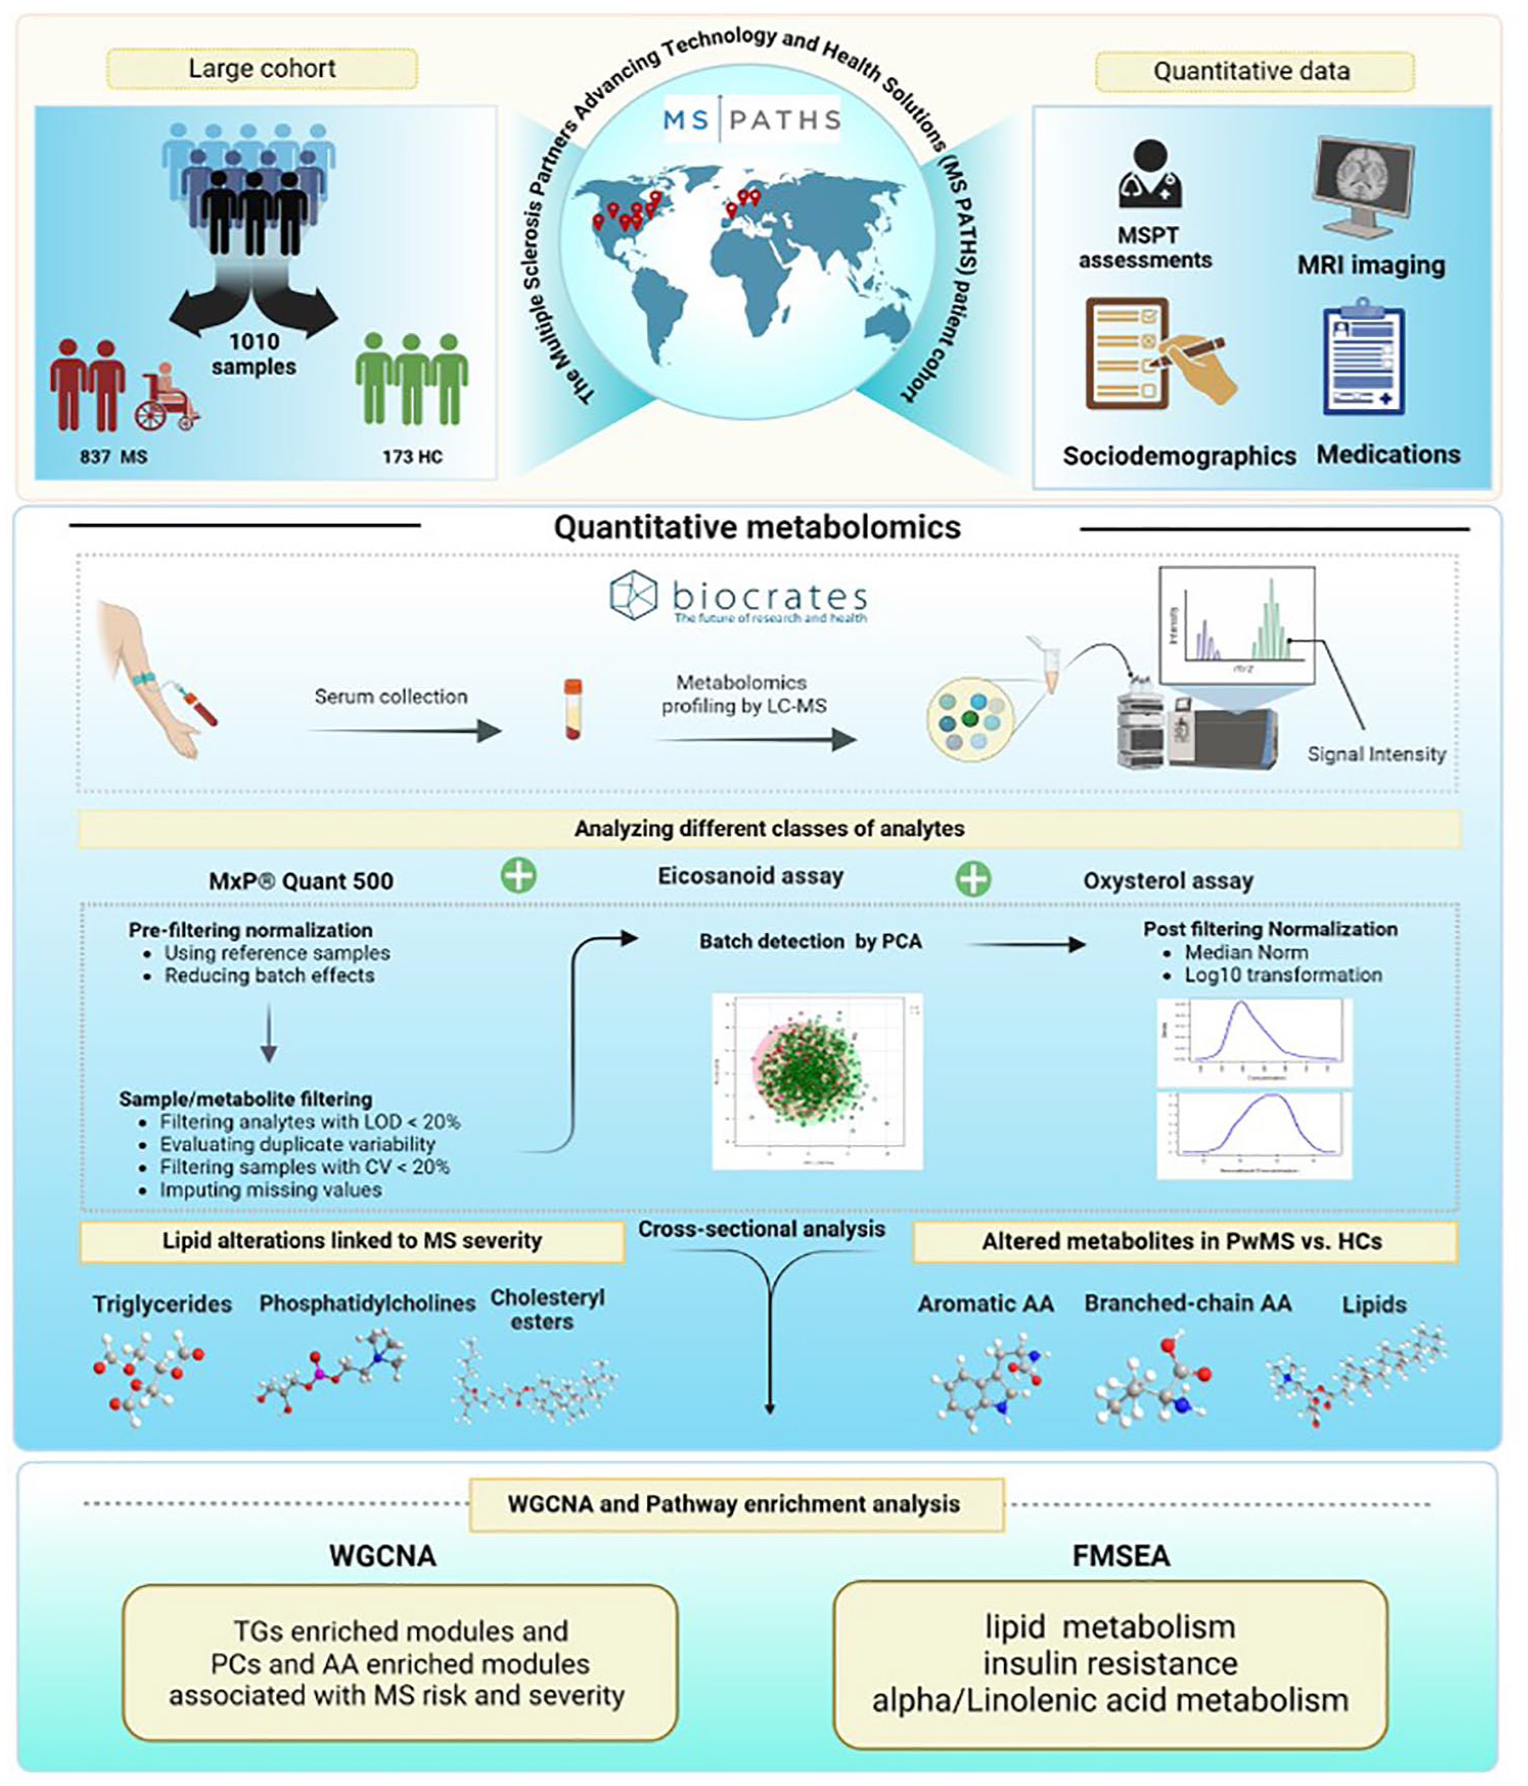
Overview of the study and the MS PATHS data set.
Summary statistics of characteristics of the study participants.
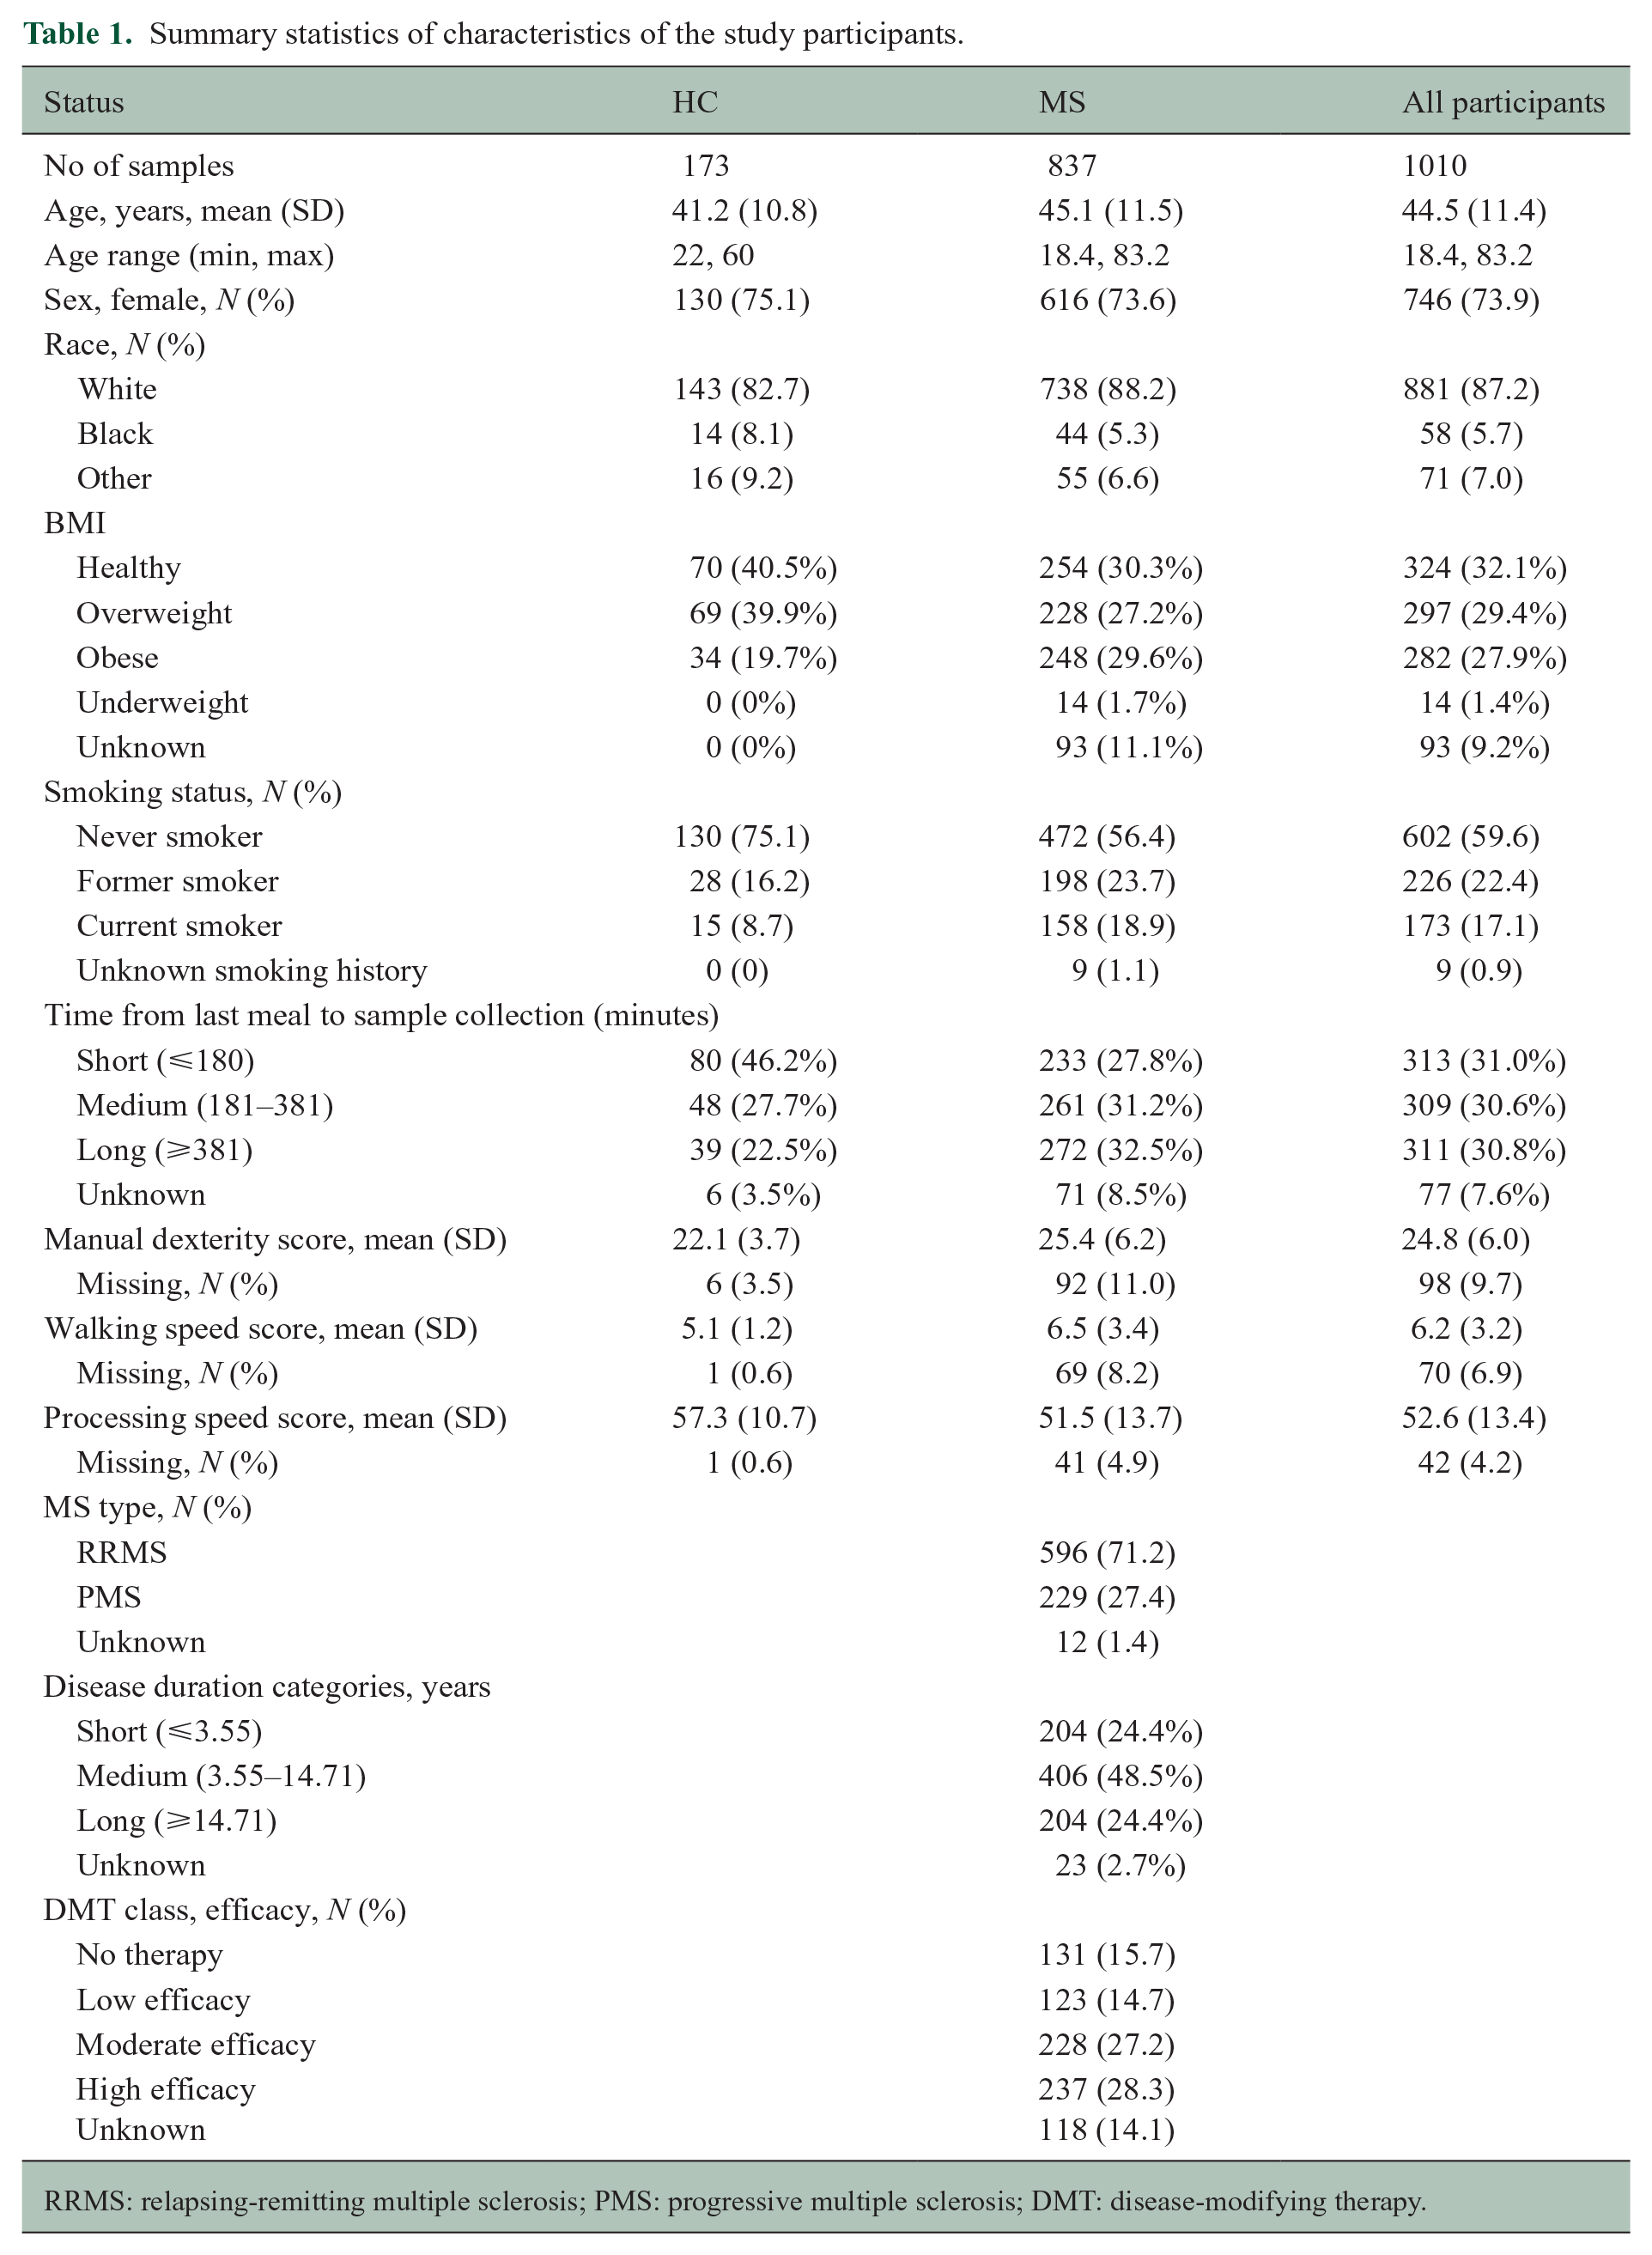
RRMS: relapsing-remitting multiple sclerosis; PMS: progressive multiple sclerosis; DMT: disease-modifying therapy.
Assessment and quality control of metabolomic profiles
The serum levels of 517 targeted metabolites were measured using liquid chromatography-mass spectrometry (LC-MS) at Biocrates Inc.
8
This metabolomics approach utilized the MxP® Quant 500 assay, eicosanoid assay, and oxysterol assay, measuring metabolites across various biochemical classes, eicosanoids, oxysterols, and cholesterol by LC-MS (
Statistical analysis
Primary analysis comparing metabolite levels between pwMS and HCs
Initially, for individual metabolites, we used generalized linear models in univariable analyses to compare metabolite levels between pwMS and HCs. Subsequently, we employed multivariable models, adjusting for age, sex, race, smoking status, BMI, and the duration between the last meal and sample collection, with categorical variables converted to factor variables for facilitating statistical analysis. A false discovery rate (FDR) corrected two-sided p < 0.05 determined statistical significance.
Analysis of MSPT outcomes and metabolite levels in pwMS
Next, we fitted linear models to assess the association between individual metabolites and MSPT outcomes, which include WST, MDT, and PST. Models were adjusted for a similar set of covariates as in models comparing pwMS to HCs but further adjusted for disease course, DMT, and disease duration.
Metabolite set enrichment analysis
Metabolite enrichment analyses included (1) weighted gene co-expression network analysis (WGCNA) and (2) a priori-defined metabolite set enrichment analysis (MSEA). WGCNA method does not require prior knowledge of the metabolites, facilitating the unbiased construction of correlated metabolite networks. This approach offers a robust framework to identify highly correlated hub metabolites, centrally located within each module to address the multiple testing challenges associated with analyzing hundreds of metabolites and to investigate metabolic set-wide relationships to derive meaningful biological insights from functionally correlated metabolites.
9
For each identified module, we computed the eigen-metabolites that correspond to the first principal component and were utilized to assess the association of modules with MS status and MSPT outcomes. A detailed outline of the WGCNA analysis is provided in the
For the a priori-defined metabolite pathway analysis, we performed enrichment analyses incorporating the known biological relevance of associated metabolites. We performed MSEA which employs pre-ranked statistics of metabolites based on their association with the MSPT outcomes and a list of biological pathways related to sets of metabolites to calculate the enrichment score (ES) for each metabolite set. The list of pathways was obtained from the Kyoto Encyclopedia of Genes and Genomes (KEGG) pathway database using the KEGG ID assigned to either individual metabolites or metabolite classes in cases of incomplete data sets, such as for TGs and PCs. The ES indicates the degree of overrepresentation of a metabolite set at the extremes of the entire ranked list of metabolites. To account for variability in set sizes, the normalized enrichment score (NES) adjusts for differences in the number of metabolites within each set, allowing for meaningful comparisons. The FDR-adjusted p value was used to evaluate the statistical significance of the NES. 10
Results
Participants
After quality control for both samples and metabolites, we included 1010 individuals who contributed serum samples collected within 90 days of completion of the MSPT, covering an age range from 18 to 83 years. This included 837 individuals diagnosed with MS (mean age: 45.12 ± 11.48 years; 73.6% female) and 173 HCs (mean age: 41.2 ± 10.77 years; 75.1% female). Most pwMS analyzed in this study had RRMS (71.2%). Descriptive statistics of the demographic data are summarized in Table 1.
Metabolomic differences in pwMS compared with HCs
We observed variations in metabolomic profiles in pwMS compared with HCs. In univariable analysis, pwMS showed a significant increase in the class of triglycerides (TGs) and decreased levels of phosphatidylcholines (PCs) and different classes of amino acids (AAs) such as branched-chain amino acids (BCAAs: valine (Val), leucine, and isoleucine (Leu/Ile)) and aromatic amino acids (AAAs: phenylalanine (Phe), tyrosine (Tyr), and tryptophan (Trp)) as well as AA-related metabolites (e.g. homoarginine, homocysteine, and alpha-aminoadipic acid). This difference in metabolomic profiles between the two groups remained consistent in a multivariable analysis examining the relationship of metabolite levels with disease status while adjusting for age, sex, race, smoking status, BMI, center, and duration between the last meal and sample collection. Results were also consistent in subgroup analyses, stratifying the MS samples according to MS subtype or by DMT class (Figure 2). The statistical details for consistently significant metabolites across all subgroups are provided in Table 2 of
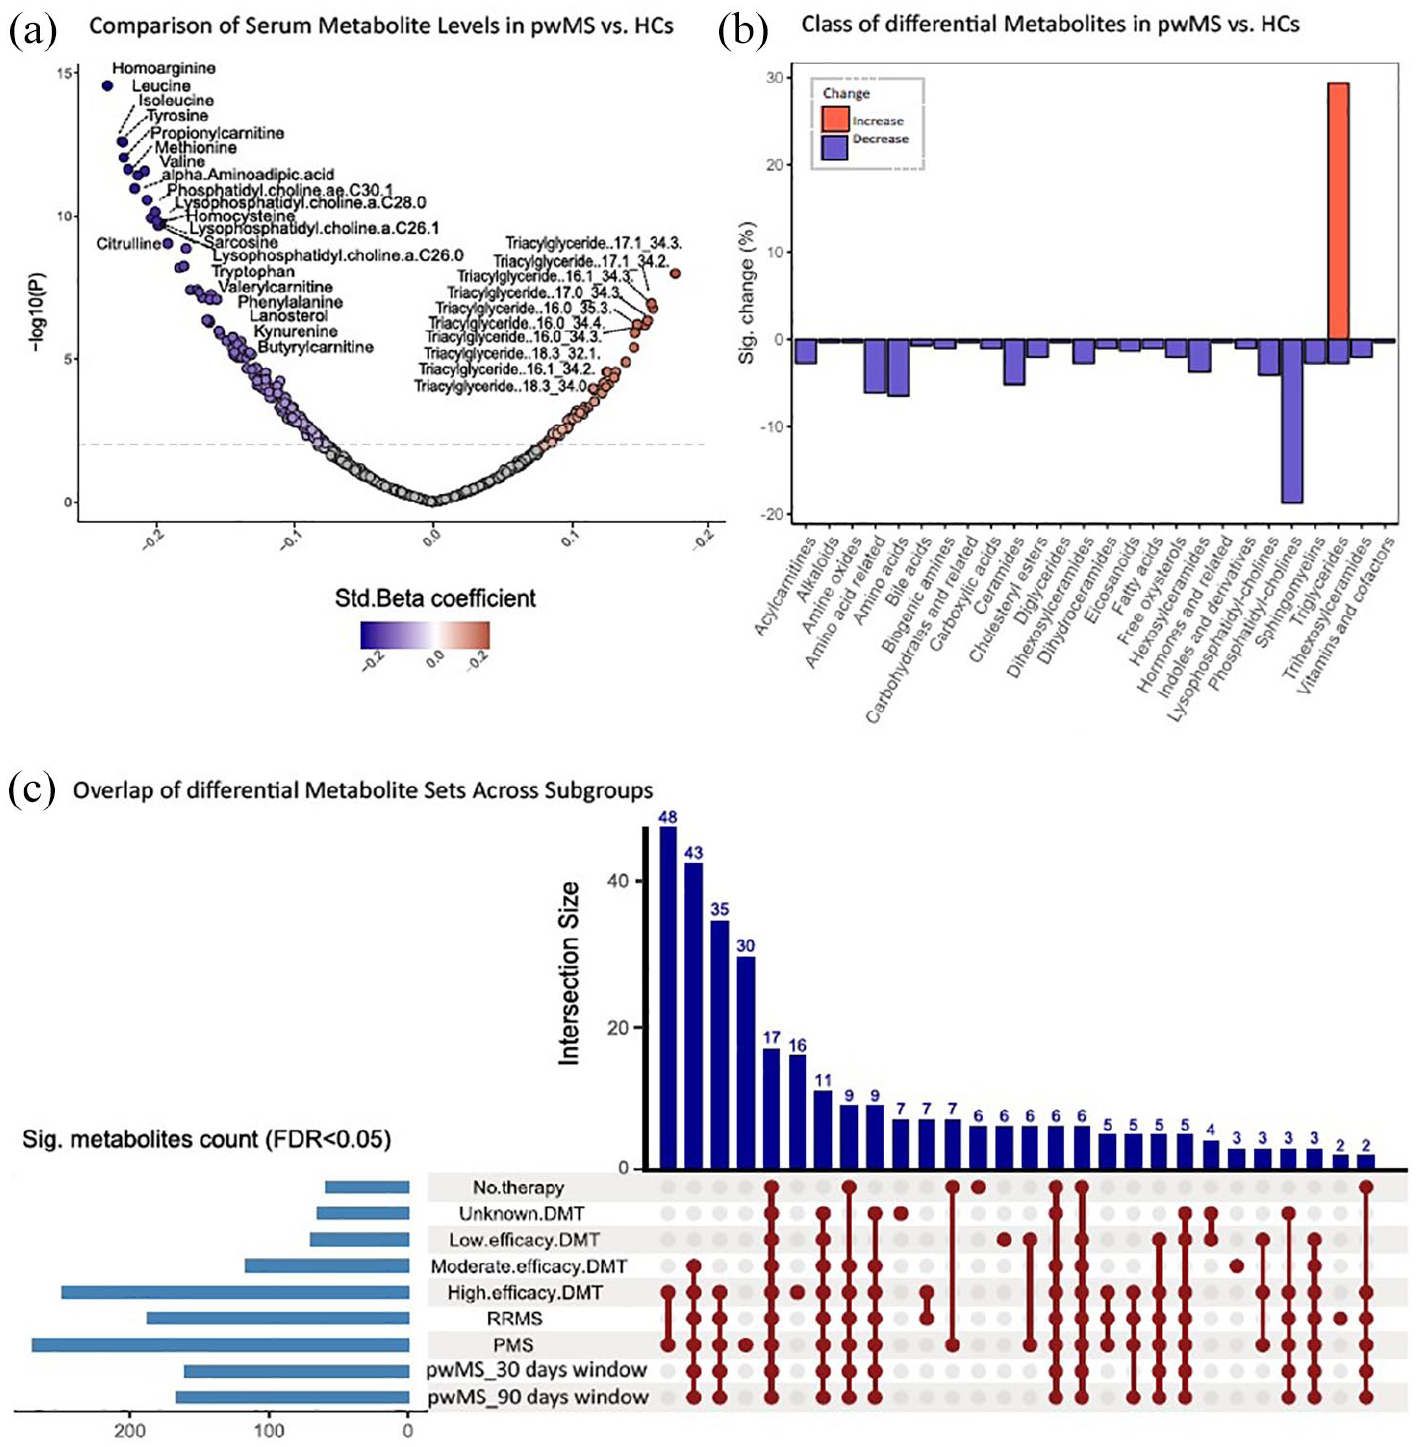
Differences in metabolomic profiles between pwMS and HCs. (a) The volcano plot shows differences between pwMS and HCs, with the x-axis representing fold change in metabolite levels and the y-axis representing −log10(p value) from the t-test. Labeled dots indicate differentially accumulated metabolites in the serum samples of two groups (FDR-adjusted p < 0.05). (b) The pattern of metabolic alterations in pwMS compared with HCs. The x-axis represents different classes of metabolites, and the y-axis shows the percentage of metabolites within each class that exhibit either increased or decreased levels. (c) Upset plot of significant metabolites across subgroups (FDR-adjusted p < 0.05). Each bar represents a group of metabolites found in a set of subgroups. The y-axis indicates the intersection size (number of metabolites shared across subgroups).
Results of assessing metabolomic differences between pwMS and HCs using WGCNA.
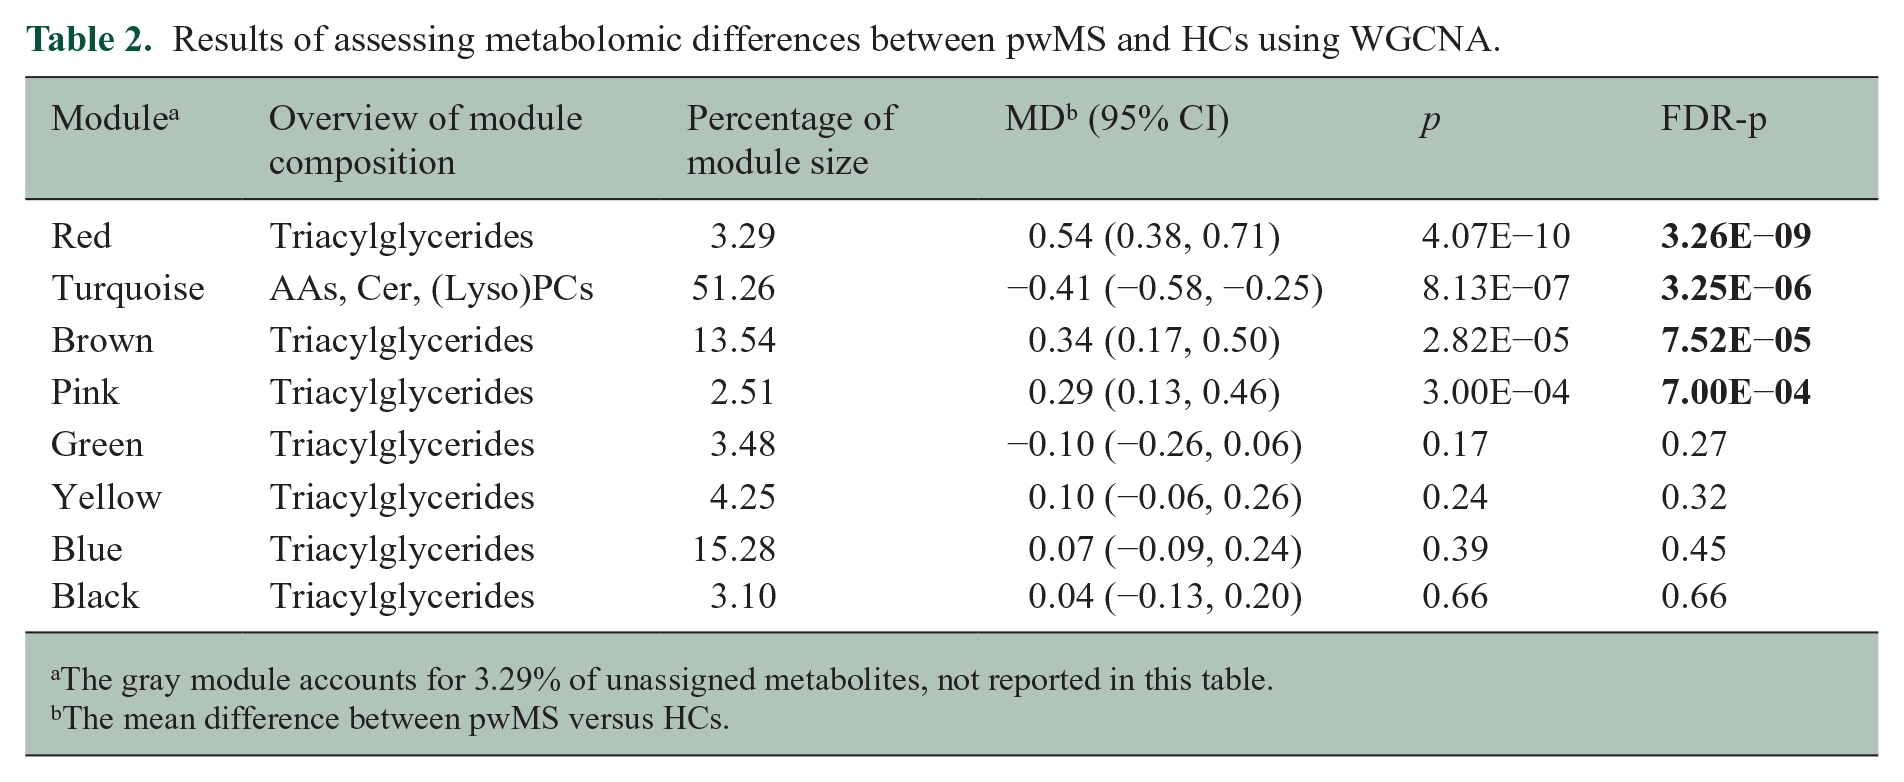
The gray module accounts for 3.29% of unassigned metabolites, not reported in this table.
The mean difference between pwMS versus HCs.
Metabolites uniquely significant in PMS compared with HCs (and absent in other subgroups) were predominantly from the following classes: TGs, PCs, ceramides, hexosylceramides, cholesteryl esters, sphingomyelins, as well as arachidonic acid and one bile acid (
Variations in individual metabolites concerning MSPT outcomes
We also observed notable links between certain lipid classes (TGs, PCs, fatty acids, and cholesterol esters) associated with neuroperformance outcomes and generally consistent across individual MSPT outcomes. For example, one standard deviation (SD) decrease in the serum levels of PC aa C36:6 and eicosapentaenoic acid (EPA) was significantly associated with worse manual dexterity and walking speed (manual dexterity: for PC aa C36:6: −5.23s slower; 95% confidence interval (CI): −7.31 to −3.15; p = 9.36E−07; for EPA: −2.60s slower; 95% CI: −3.82 to −1.39; p = 3.04E−05; walking speed: for PC aa C36:6: 21.36% slower; 95% CI: 11.07% to 30.46%; p = 1.35E−04; for EPA: 11.57% slower; 95% CI: 4.96% to 17.71%; p = 8.51E−04). Slower processing speed was linked to higher levels of TGs and bile acids and lower levels of AA-related metabolites, although none of the individual metabolite associations with PST reached statistical significance after FDR adjustment (Figure 3).
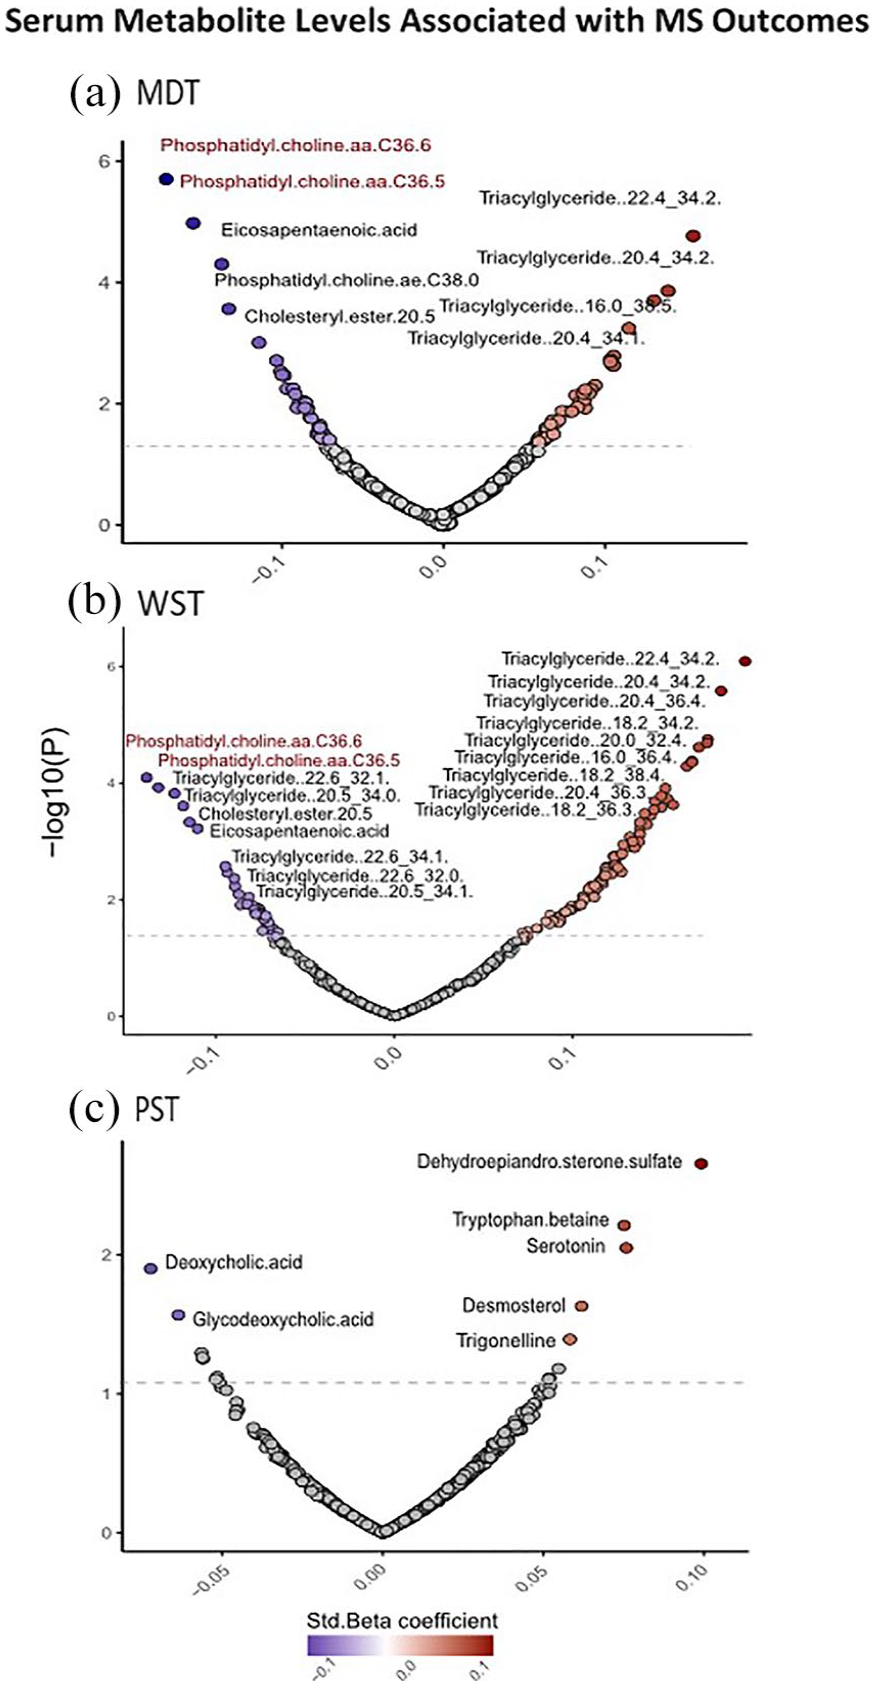
Individual metabolites associated with MSPT outcomes in multivariable models. (a) The volcano plot shows metabolites associated with manual dexterity score, with each point representing a metabolite. Significant associations with FDR-adjusted p < 0.05 are labeled; (b) significant association of metabolites with walking speed score (FDR-adjusted p < 0.05); and (c) association of metabolites with processing speed score (p < 0.05).
WGCNA analysis
For WGCNA analyses, we identified modules of clustered metabolites associated with disease status and severity. Notably, the red, pink, brown, and turquoise modules were significantly correlated with disease status, indicating differences between pwMS and HCs. The red, pink, and brown modules, enriched with TGs, were associated with MS status, with the red and pink modules also linked to MDT and WST outcomes, while the red and brown modules correlated with PST. The turquoise module, enriched with PCs, ceramides, and AA-related metabolites, was associated with MS status MDT and PST. Highly connected, hub metabolites, in the red, pink, brown, and turquoise modules were TG(16:0_34:3), TG(22:4_32:0), TG(14:0_34:0), and sphingomyelin(C16:0), respectively. In addition, the green and blue modules were linked to MDT and WST, with the blue module only associated with WST. The results of associations between modules, MS status, and MSPT outcomes, along with the metabolite compositions in each module, are presented in Table 2 and Figure 4.
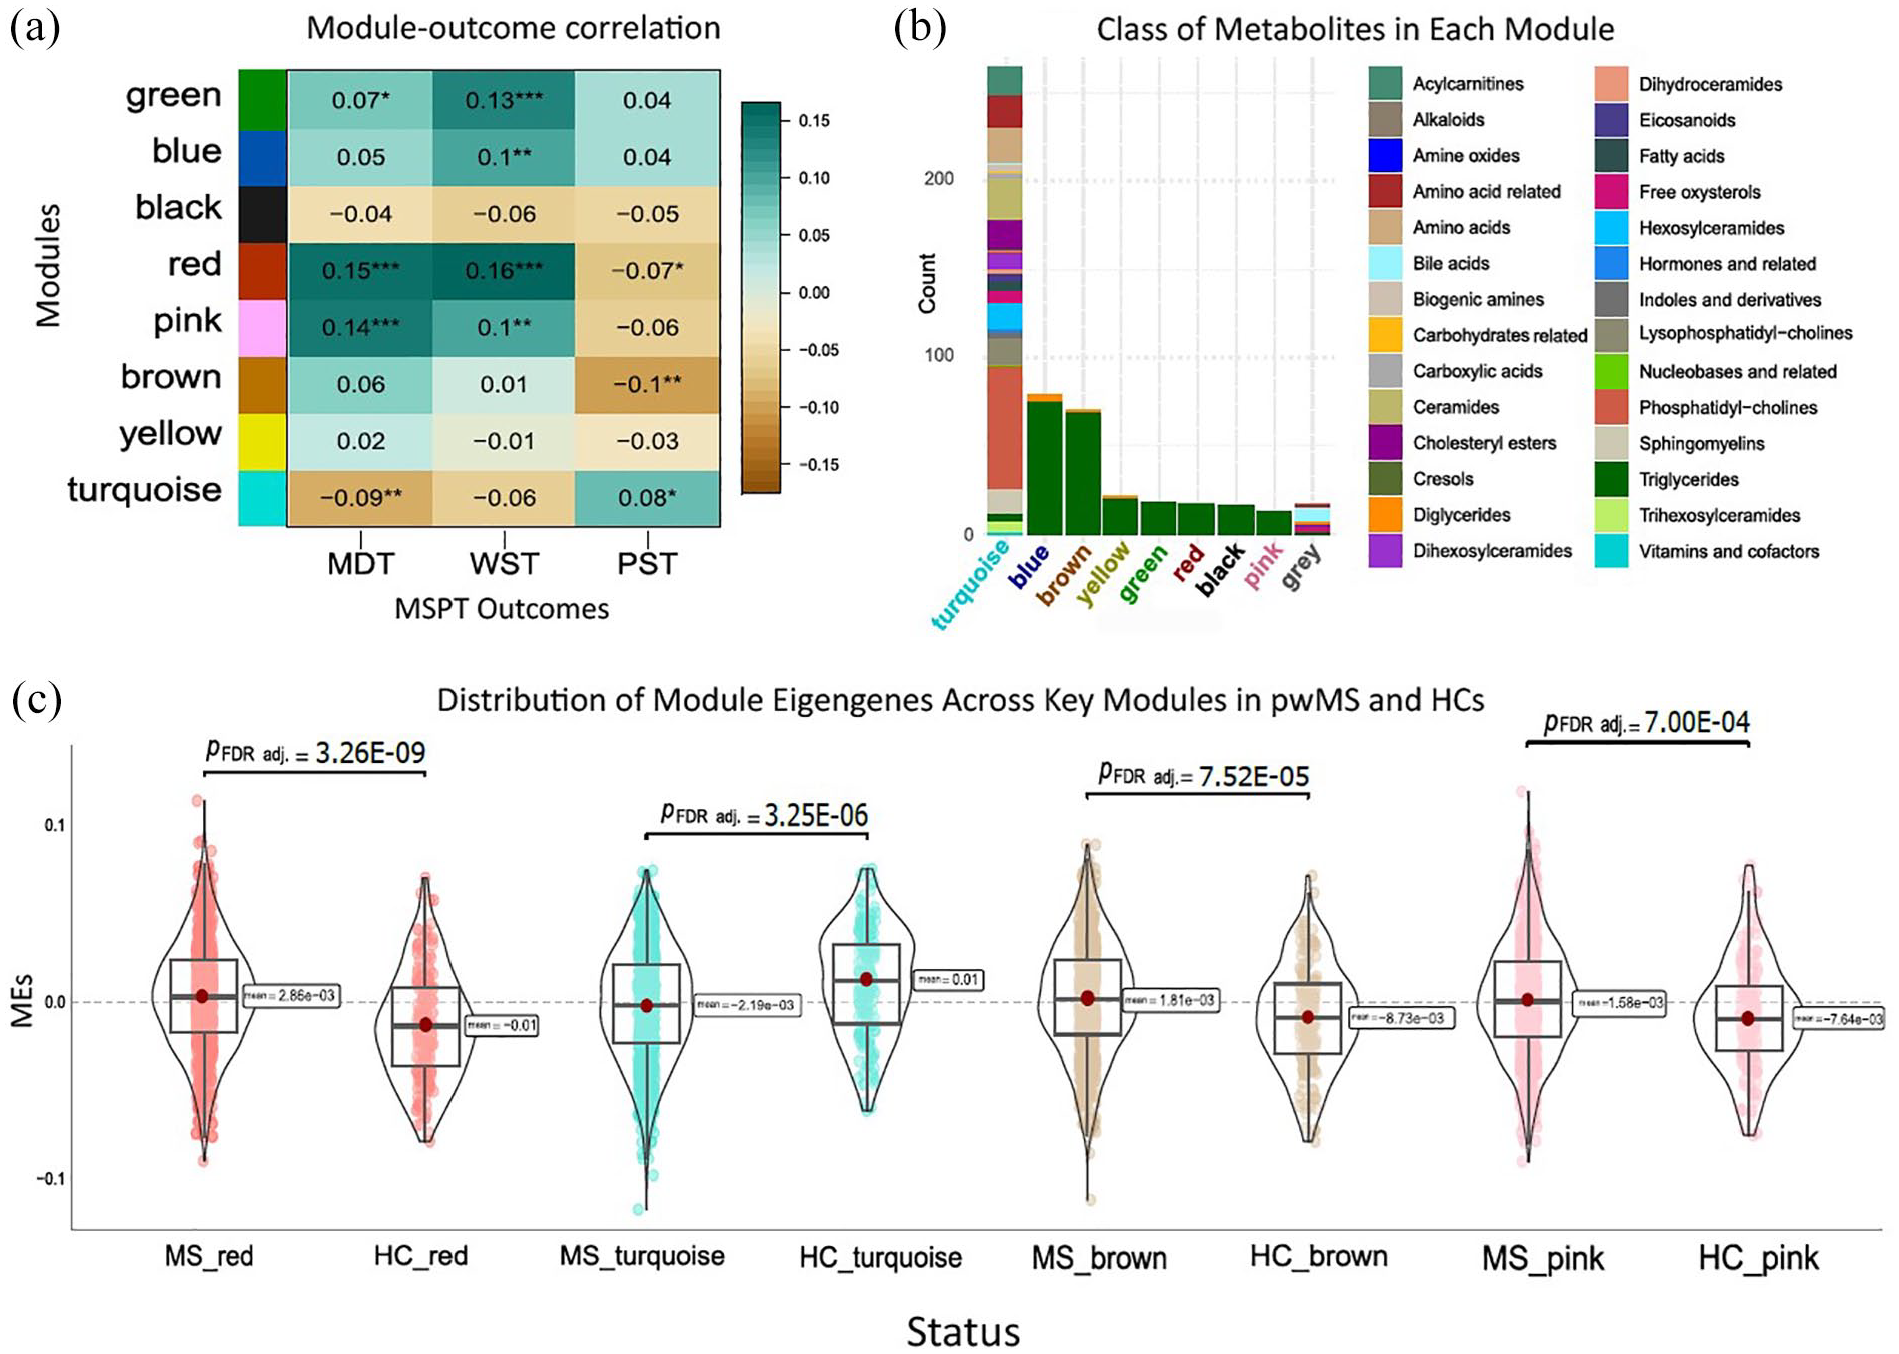
Modules of clustered metabolites associated with odds of MS and symptom severity. (a) The heatmap plot shows the module–trait correlation matrix. The x-axis indicates MSPT outcomes, and the y-axis indicates modules of clustered metabolites obtained from WGCNA. The values inside the heatmap indicate the correlation coefficient, and the number of stars denotes statistical significance levels: one star (*) for p < 0.05, two stars (**) for p < 0.01, and three stars (***) for p < 0.001. (b) The stacked bar chart summarizes the types of metabolites grouped in each module. The x-axis displays the module names, while the y-axis indicates the metabolite count in each module. The key for the metabolite classes is shown on the right side of the chart. (c) The violin plots illustrate the comparative distribution of module eigengenes across significantly associated modules between pwMS and the HCs (FDR-adjusted p < 0.05).
MSEA
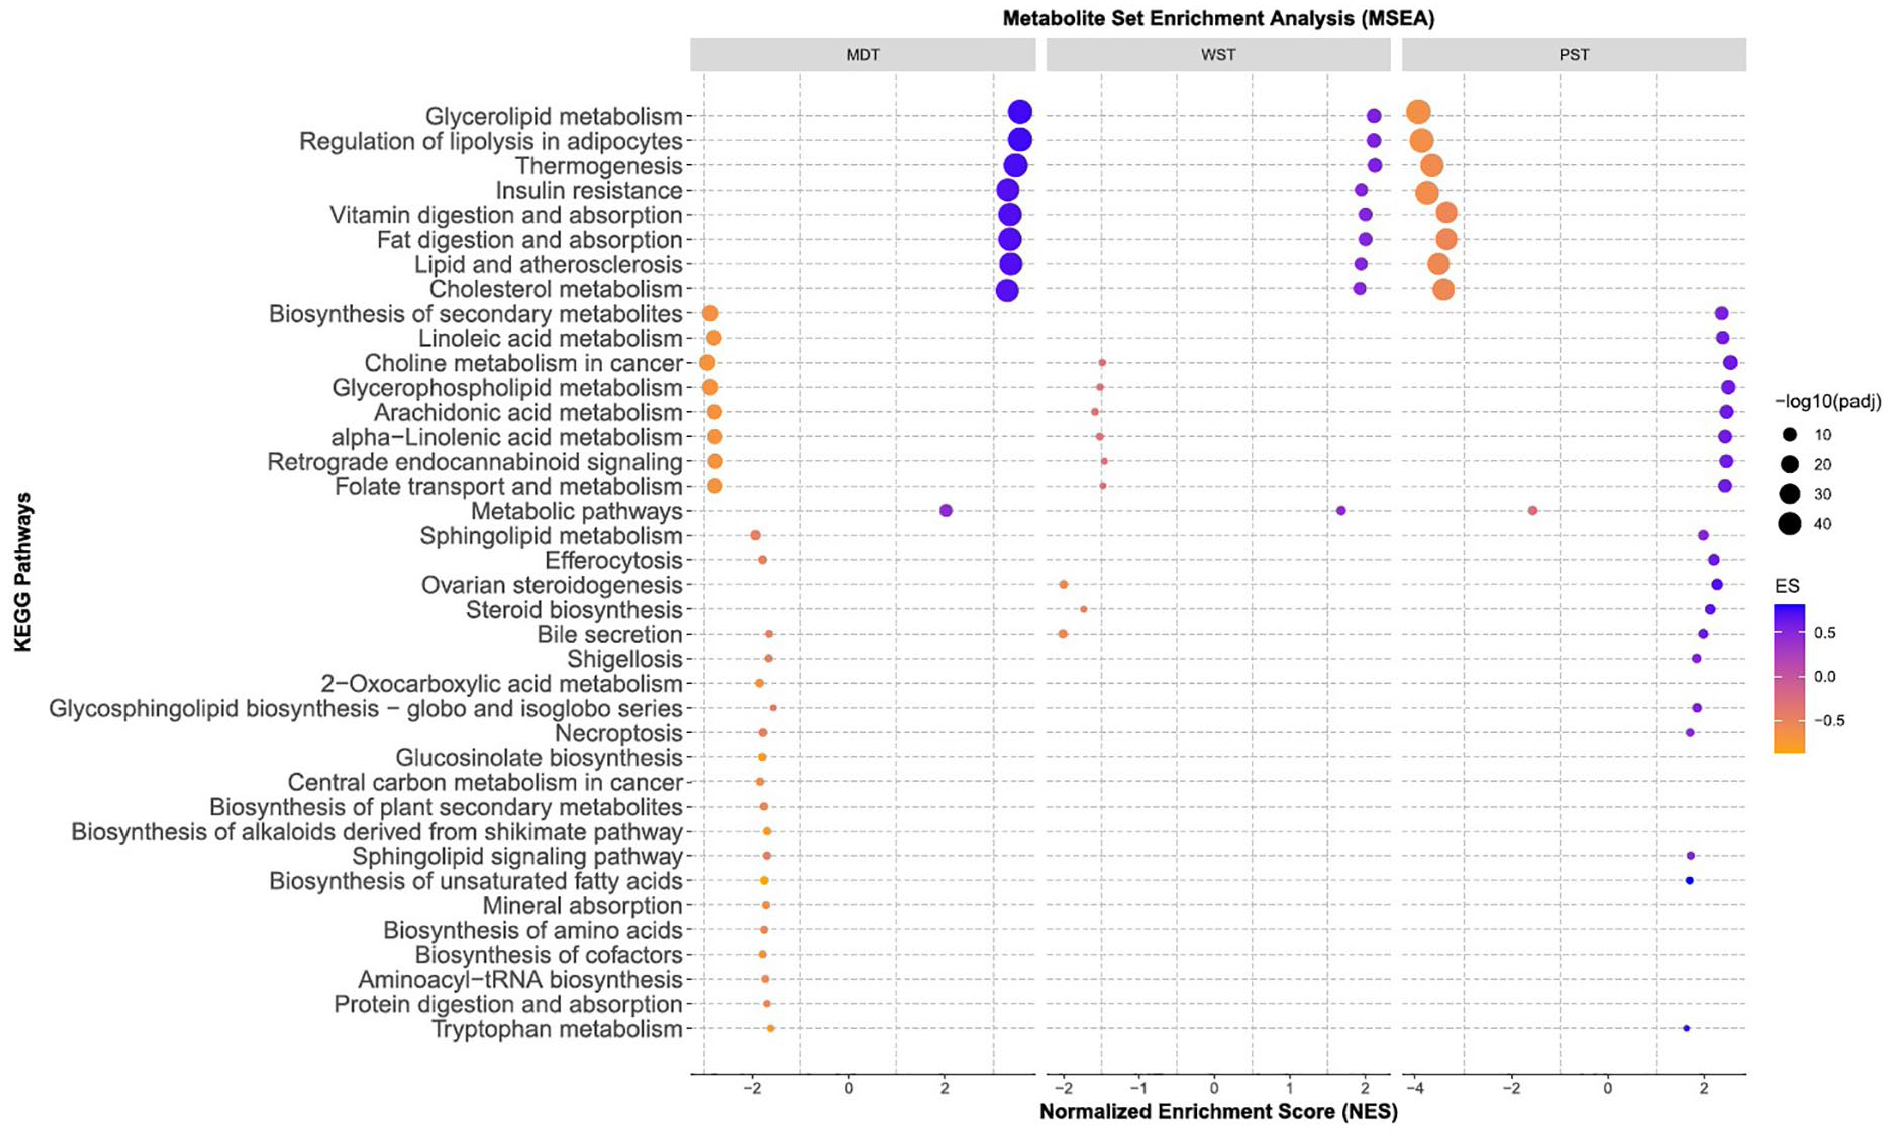
The results of the MSEA, utilizing predefined pathways, consistently identified pathways linked to PCs and TG metabolism associated with MS severity (Figure 5;
Biological pathways associated with MS severity.
Sensitivity analyses
The pattern of metabolic differences between pwMS and HCs remained mostly consistent in multivariable models, further adjusted for center or region effects. Significant metabolites associated with disease status were relatively consistent in crude and fully adjusted models. Furthermore, the results remained consistent when including samples collected within 90 or 30 days before/after the completion of the MSPT measures.
Discussion
In this large-scale, multi-site study, we performed a targeted metabolomics analysis and identified differences in metabolomic profiles between pwMS and HCs through comprehensive individual and pathway-based analyses. We found significant differences in lipids of different classes, including reduced levels of PCs/LysoPCs and increased levels of TGs in pwMS, as well as numerous AA-related metabolites. The same pattern of lipid alterations was found in association with worsened upper and lower-extremity motor functioning. Our pathway enrichment analyses revealed disrupted lipid metabolism linked to disease severity.
Our results are strengthened by large size, multicenter design, collection of detailed standardized clinical and demographic data, comprehensive assessment of circulating metabolites for pwMS and HCs, and assessment of sensitive, quantitative neuro performance outcomes. We controlled potential batch effects by using the same metabolomics platform for all samples. We also benefited from quantitative rather than relative abundance of metabolite levels, which was largely the focus of prior studies in MS. We performed rigorous and stringent preprocessing and quality control filters, assuring the reliability of metabolomic data. Moreover, we performed an array of sensitivity analyses confirming the validity of our findings across different assumptions and scenarios (i.e. the effect of the time gap between sample collection and MSPT completion, MS type, and DMT class). We also conducted complementary methods of network and pathway analysis to provide biological interpretations of metabolic changes associated with MS status and severity.
Consistent with our findings, prior research has shown abnormalities in lipid metabolism in pwMS in different biofluids, including serum,11–13 and cerebrospinal fluid (CSF).14,15 For instance, higher serum levels of TGs have shown an association with increased EDSS scores and MRI outcomes and have been suggested as a potential prognostic biomarker for MS.16,17 However, the interplay between the cause-and-effect relationship of lipid changes and MS progression is still under investigation; abnormal lipid metabolism could potentially contribute to the inflammatory responses in MS. Previous studies collectively confirm the pro-inflammatory effect of increased levels of TGs on the development of autoinflammatory diseases.18,19 This effect can be due to TG’s influence on effector T cells and inflammation. 20 TG-rich lipoprotein lipolysis can induce astrocyte lipid droplets and cellular stress pathways. 21 Our pathway enrichment analysis also highlights the importance of TG-related metabolic pathways, such as glycerolipid metabolism and regulation of lipolysis in adipocytes for MS severity.
In addition, we found lower levels of PCs in pwMS and an association with disease severity across subgroups categorized based on MS type or DMT classes. The lysoPCs have been reported to modulate the immune response, and the lysoPC to PC ratio can be considered an indicator of inflammation-related enzyme activity. 12 Also, levels of PCs may affect MS severity by triggering stress responses by affecting the size and dynamics of lipid droplets in immune cells. 22
Besides, we noted a significant decrease in the serum levels of AAAs and BCAAs in pwMS. This pattern was consistent across subgroups of PMS or RRMS and in multivariable and network analysis. While AAs such as AAA and BCAA appear to define a unique metabolic signature for MS status, lipid metabolism—particularly alterations in specific TGs, ceramides, and other lipid classes—emerges as a central feature of MS progression. These results underscore the critical role of lipid dysregulation in MS progression and highlight the potential of lipidomics in developing biomarkers for MS progression. Longitudinal analysis is necessary for further validating these results and clarifying the temporal effects of DMTs on lipidomic profiles and their relationship to disease progression.
In line with our findings, other studies have characterized pwMS by altered plasma levels of AAs.23–31 A recent large, multi-cohort, untargeted metabolomics analysis has revealed significant changes in the metabolism of AAAs and BCAAs metabolites in pwMS and associated with higher MS disability scores. 4 Dysregulated levels of BCAAs may contribute to altered energy metabolism and mental fatigue in pwMS. 32 Our pathway enrichment analysis also suggested the role of different pathways related to AAA and BCAA metabolisms, including glucosinolate biosynthesis and 2-Oxocarboxylic acid metabolism for MS severity.
Limitations
Longitudinal analysis is required to assess how metabolite levels affect changes in MS outcomes over time. Our metabolic panel was weighted toward lipids and may not provide the overall metabolomic signature of pwMS. In addition, dietary habits, exercise, and the gut microbiome were not available. Also, the participants were non-fasting, which can impact their metabolic profiles. However, we accounted for the time gap between the sample collection and the last meal by adjusting our models accordingly.
Conclusion
Overall, we found increased TGs, decreased PCs, and AAs in the serum sample of pwMS compared with HCs along with lipidomic changes associated with the MS severity. Biological interpretation of our results revealed pathways related to lipid metabolism in connection with quantitative measurements of neurological performance in MS. These findings may be beneficial for the personalized management of MS following further longitudinal analysis.
Supplemental Material
sj-docx-1-msj-10.1177_13524585251325468 – Supplemental material for Metabolic and lipid alterations in multiple sclerosis linked to disease severity
Supplemental material, sj-docx-1-msj-10.1177_13524585251325468 for Metabolic and lipid alterations in multiple sclerosis linked to disease severity by Rezvan Noroozi, Hui-Hsin Tsai, Ketian Yu, Paola Bronson, Karunakar Samuel, Kien Trinh, Ru Wei, Ellen Tsai, Farren BS Briggs, Pavan Bhargava and Kathryn C Fitzgerald in Multiple Sclerosis Journal
Supplemental Material
sj-xlsx-2-msj-10.1177_13524585251325468 – Supplemental material for Metabolic and lipid alterations in multiple sclerosis linked to disease severity
Supplemental material, sj-xlsx-2-msj-10.1177_13524585251325468 for Metabolic and lipid alterations in multiple sclerosis linked to disease severity by Rezvan Noroozi, Hui-Hsin Tsai, Ketian Yu, Paola Bronson, Karunakar Samuel, Kien Trinh, Ru Wei, Ellen Tsai, Farren BS Briggs, Pavan Bhargava and Kathryn C Fitzgerald in Multiple Sclerosis Journal
Footnotes
Consent to Participate
As part of the MS PATHS, the patients/participants involved in this study provided written informed consent.
Data Availability Statement
Requests to access the data sets presented in this article should be directed to the corresponding author.
Declaration of Conflicting Interests
The author(s) declared the following potential conflicts of interest with respect to the research, authorship, and/or publication of this article: K.Y., E.T., and H-H.T. are employees of and hold stock/stock options in Biogen. K.T., R.W., and P.B. were employees at the time of study conduction and held or may hold stock/stock options in Biogen. P.Bh. is supported by a Harry Weaver Neuroscience Scholar Award from the National MS Society.
Ethical Considerations
The MS PATHS was approved by Ethics committees or institutional review boards at all participating centers.
Funding
The author(s) disclosed receipt of the following financial support for the research, authorship, and/or publication of this article: Biogen sponsored the MS PATHS project and the metabolic study, and it serves as the hub for data sharing.
Supplemental Material
Supplemental material for this article is available online.
References
Supplementary Material
Please find the following supplemental material available below.
For Open Access articles published under a Creative Commons License, all supplemental material carries the same license as the article it is associated with.
For non-Open Access articles published, all supplemental material carries a non-exclusive license, and permission requests for re-use of supplemental material or any part of supplemental material shall be sent directly to the copyright owner as specified in the copyright notice associated with the article.