
Abstract
Background:
Monitoring radiologic disease activity (RDA) is standard of care in multiple sclerosis (MS) because new lesions on magnetic resonance imaging (MRI) are associated with adverse outcomes and frequently prompt treatment reassessment and optimization. Coregistration-fusion comparison (CF) is more sensitive than conventional side-by-side comparison (CS) for detecting new lesions.
Objectives:
To apply CF to identify CS-missed RDA on brain MRIs originally reported as “stable” and to evaluate whether CS-missed RDA predicts future disease activity.
Methods:
This retrospective cohort included 314 people with MS (pwMS) with three consecutive brain MRIs: previous MRI (t1), index MRI (t2; reported “stable” on CS), and subsequent MRI (t3). CF was applied to three-dimensional Fluid-Attenuated Inversion Recovery (FLAIR) to identify CS-missed new lesions on t2 versus t1. Future RDA was defined as ⩾1 new lesion on t3 versus t2. Clinical disease activity (CDA) was defined as clinical relapse and/or confirmed disability progression during follow-up after t2.
Results:
CF identified 183 CS-missed new lesions in 65/314 pwMS (20.7%). Future RDA (70.8% vs. 16.1%; p < 0.001) and CDA (20.0% vs. 10.0%; p = 0.028) were more frequent in the CS-missed lesion group. Relapse and disability progression, when analyzed separately, did not differ between groups. CS-missed RDA independently predicted future RDA (adjusted odds ratio (aOR) = 10.43; 95% confidence interval (CI) = 5.31–20.46, p < 0.001) and CDA (aOR = 2.49; 95% CI = 1.10–5.65, p = 0.029). Each additional missed lesion at t2 was associated with more new lesions at t3 (incidence rate ratio (IRR) = 1.205; 95% CI = 1.184–1.226, p < 0.001).
Conclusion:
CF reclassified one in five pwMS reported as “stable” on CS as having CS-missed RDA, which predicted future disease activity.
Introduction
Multiple sclerosis (MS) is a chronic, immune-mediated demyelinating and neurodegenerative disease of the central nervous system (CNS) affecting millions of people worldwide. 1 MS typically affects young adults and leads to impairment of physical functioning, cognition, quality of life, and employment. More than 20 disease-modifying therapies (DMTs) are currently available, which can greatly reduce relapse rates, radiologic disease activity (RDA), and disability progression. 2
Magnetic resonance imaging (MRI) is an important paraclinical tool in MS clinical care and plays an essential role in MS diagnosis, prognosis, and disease monitoring.3–5 The presence of RDA, defined as new T2 lesions and/or new gadolinium-enhancing lesions on follow-up MRI, is a well-accepted radiologic biomarker of active inflammatory disease. It is a strong predictor of future clinical progression and is regarded as nearly equivalent to clinical relapses in people with relapsing–remitting MS (RRMS).3,6,7 New T2 lesions are the preferred imaging outcome measure for active inflammation in the context of DMT efficacy monitoring according to the MAGNIMS-CMSC-NAIMS recommendations. 3 This RDA measure has also been incorporated into several available treatment-response scoring systems, with “no evidence of disease activity” considered as the ultimate treatment goal in MS.6,8–11
Traditionally, to detect RDA on follow-up MRI scans, radiologists evaluate serial T2-FLAIR images for the development of new lesions using the conventional side-by-side comparison (CS). However, this method can be time-consuming, is prone to reading errors, and can be difficult for people with MS (pwMS) who have extensive disease burden.12–17
Recently, Picture Archiving and Communication System (PACS)-integrated, semiautomated coregistration-fusion (CF) has been developed to assist radiologists in detecting new lesions and has been adopted into standard clinical workflows at several institutions.12–18 Although previous studies have shown CF to be a more sensitive and accurate approach for detecting RDA and significantly reducing radiologists’ reading time,12–17 CS remains the current standard in many practices, and the clinical impact of missed RDA when using CS has not been evaluated.
The aims of this study were to (1) identify the frequency of missed RDA on routine follow-up MRI scans previously interpreted using CS and (2) determine whether missed RDA when using CS predicts future radiologic and/or clinical disease activity.
Methods
Study design
This retrospective study was conducted at an academic tertiary referral MS center. This study was approved by our institutional research ethics board. Because of the retrospective nature of the study, the need for informed consent was waived.
Population and clinical data
pwMS eligible for the study were identified from our institutional PACS and radiology information system (RIS) database queries and met the following inclusion criteria:
(i) Age and diagnosis: Patients ⩾18 years of age with a diagnosis of MS previously established by a subspecialty-trained MS neurologist.
(ii) MRI requirements: At least three consecutive standard MS protocol brain MRI studies, including the following: a. Previous brain MRI (t1): MRI performed within 6–36 months before the index brain MRI. b. Index brain MRI (t2): MRI performed during January 2017–December 2018, a period during which radiologists in our department were using CS to compare three-dimensional (3D) FLAIR sequences before adoption of CF. This scan was reported as “stable” by subspecialty-trained neuroradiologists experienced with MS imaging interpretation. c. Subsequent brain MRI (t3): MRI performed within 6–36 months of t2.
pwMS were excluded if MRI studies lacked 3D-FLAIR images or if image quality was severely degraded by artifacts precluding accurate comparison using CF.
For each pwMS, clinical data were collected from the electronic medical record and our institutional MS registry. Variables included age, sex, MS phenotype, disease duration, and prior-year relapse count at the clinical assessment during the t1–t2 interval. Expanded Disability Status Scale (EDSS) and DMT status (categorized as none, low–intermediate efficacy, and high-efficacy therapies) were collected at two time points: (1) the baseline clinical assessment during the t1–t2 interval and (2) the clinical assessment after t2 and before t3. We also recorded the time interval between t2 and the follow-up clinical assessment. Finally, we documented the occurrence of clinical relapses and confirmed disability progression during follow-up after t2.
Clinical relapse was defined as newly developing neurological symptoms or reactivation of pre-existing neurological deficits for a minimum of 24 hours in the absence of fever or infection, occurring at least 30 days after the preceding episode.
Disability progression was defined as an increase in EDSS at clinical follow-up after t2 by 1.5 points if the baseline EDSS score was 0, 1 point for previous scores of 1.0 to 5.0, and 0.5 points for scores >5.5, sustained for at least 6 months.
Future RDA was defined as ⩾1 new lesion on t3 compared with t2.
Future clinical disease activity (CDA) was defined as the occurrence of a clinical relapse and/or confirmed disability progression during the subsequent clinical assessment after t2.
Image analysis
Brain MRI
All pwMS underwent the MS brain MRI follow-up protocol3,18 on 3T MRI scanners (Siemens Skyra, Siemens Healthcare, Erlangen, Germany) with 20-channel head/neck coils, which included 3D-FLAIR, axial 2D-T2 TSE, 3D-T1 MPRAGE, and Diffusion-Weighted Imaging (DWI) sequences. Post-gadolinium T1 TSE was an optional sequence.
3D-FLAIR parameters are as follows: TR/TE = 8000/374 ms, TI = 2400 ms, voxel size = 0.9 × 0.9 × 1 mm3, FOV = 256 × 232 × 176 mm3, and total acquisition time = 4 minutes 20 seconds.
Semiautomated, coregistration-fusion
Image interpretation was performed on dedicated radiology workstations. Readers were free to adjust window settings and could use multiplanar reconstruction in any plane.
CF was performed using the volume-matching function on our institutional PACS (Carestream Health, Rochester, NY, USA). For each pwMS, prior 3D-FLAIR images (t1 or t2) were automatically coregistered with current images (t2 or t3). The coregistered images produced color-coded overlays: new/enlarging lesions appeared in blue, shrinking lesions in orange, while background structures and static lesions retained normal grayscale.12–16 The CF color-coded overlay FLAIR (CF-FLAIR) images were displayed alongside the original FLAIR images, and any new/enlarging lesions identified were confirmed through synchronized review of both the original FLAIR and CF-FLAIR images (Figure 1).
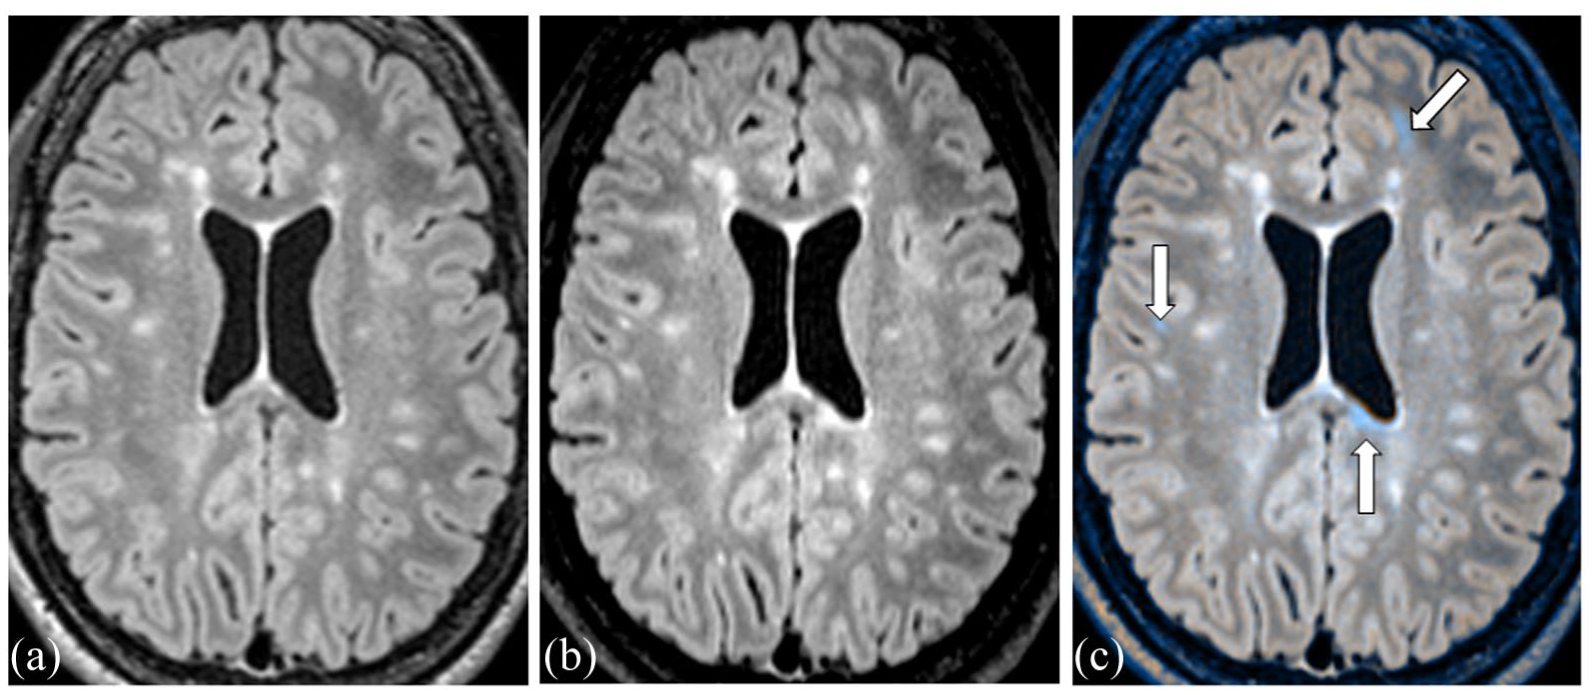
Example of PACS-integrated, semiautomated coregistration-fusion (CF) MRI comparison: Axial 3D-FLAIR reformats at (a) previous brain MRI (t1), (b) index brain MRI (t2), and (c) CF color-coded overlay FLAIR images of t2 on t1. The CF method identified three new T2 lesions in blue (arrows) that were reported as “stable” using the conventional side-by-side method.
Radiological assessment
Image analysis was performed by a neuroradiology fellow (M.P. (Reader 1)) and two neuroradiologists (T.R.L. (Reader 2) and S.S. (Reader 3)), who had prior training and experience using CF in routine clinical practice. Because the aim of the study was to identify lesions missed on prior MRIs originally reported as stable, the readers were not blinded to the original radiology reports at the time of CF re-review. However, they were blinded to future radiologic and clinical outcomes.
New lesions were defined as new T2-FLAIR hyperintense white matter lesions measuring at least 1 mm in maximal diameter, identified on the CF-FLAIR images, appearing blue, and confirmed on the original FLAIR images.
Enlarging lesions were defined as pre-existing white matter lesions that unequivocally increased in size by at least 50%, 19 as detected on the CF-FLAIR images, and confirmed on the original FLAIR images.
CF was applied to compare 3D-FLAIR images between t2 and t1. CS-missed new lesions were defined as new lesions detected on CF re-review of t2 that had previously been reported as “stable” using CS.
Reader 1 recorded the number, size (largest diameter), and location of these lesions. All scans were independently re-evaluated using CF by Reader 2 and Reader 3. Inter-reader agreement for patient-level detection of CS-missed new lesions was assessed using Cohen’s kappa (κ), after which discordant readings were resolved by consensus. pwMS were then classified into two groups: CS-missed new lesions or CF-confirmed stable.
Baseline lesion burden was categorized as mild (<20 lesions), moderate (20–50 lesions), and extensive (>50 lesions), as per MAGNIMS-CMSC-NAIMS recommendations. 3 The availability of gadolinium-enhanced sequences and the presence of any enhancing lesions were also documented.
Future RDA was assessed by comparing 3D-FLAIR images between t3 and t2 using the same methodology.
The study design and workflow are summarized in Figure 2.
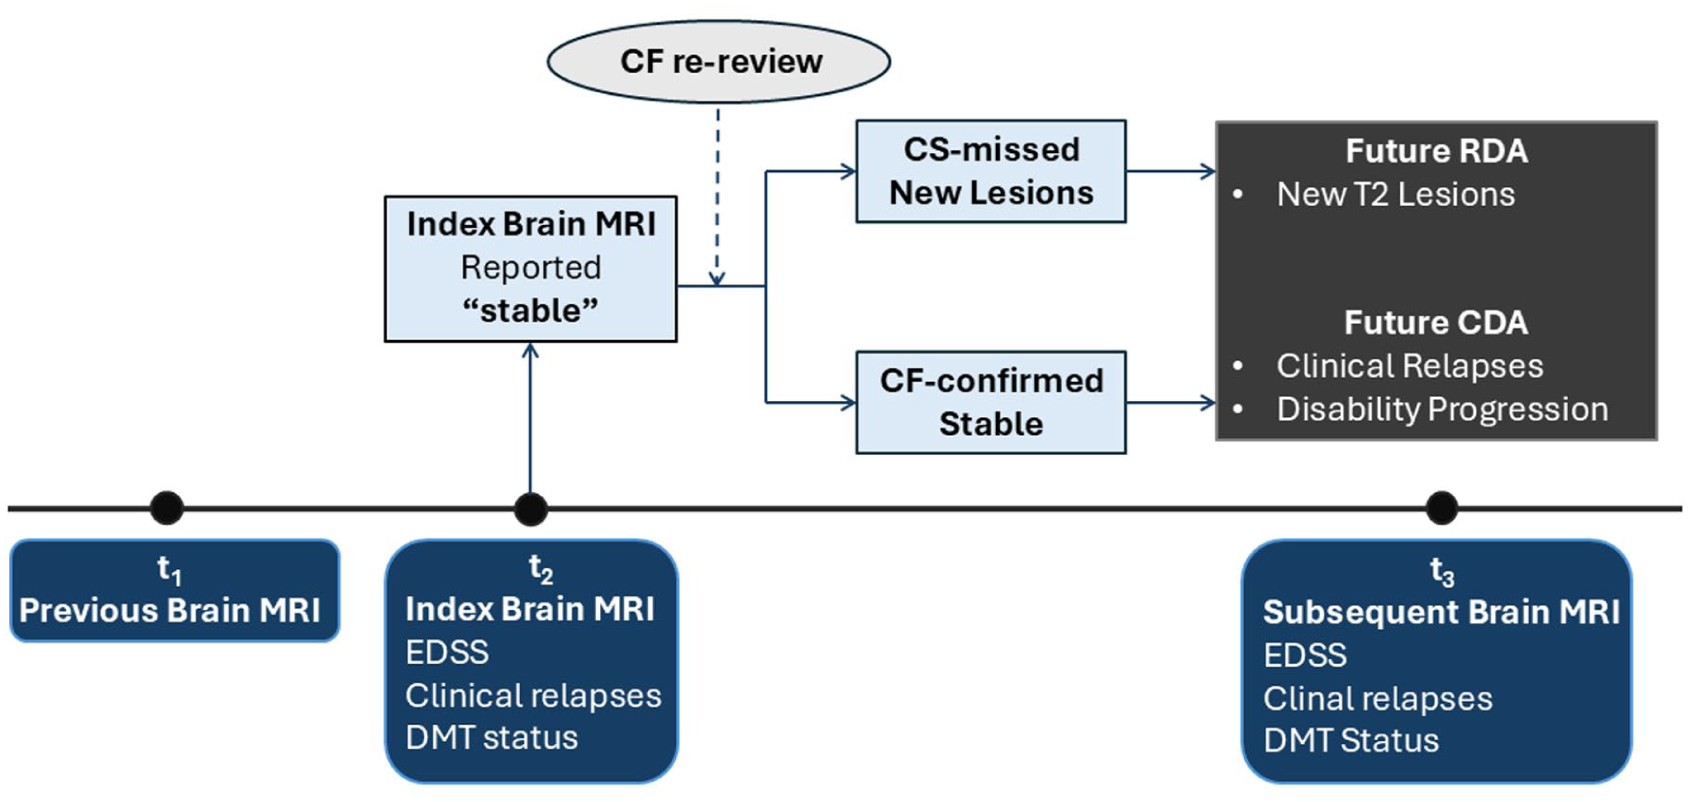
Study design.
Statistical analysis
Statistical analyses were performed using Stata software version 15.1 (StataCorp, College Station, TX, USA). Continuous variables were summarized as medians with interquartile ranges (IQRs), whereas categorical variables were expressed as counts and percentages. Differences between groups were evaluated using the Pearson chi-square (χ²) or Fisher’s exact test for categorical variables and the Mann–Whitney U test for continuous variables.
Univariable and multivariable logistic regression analyses were performed to evaluate predictors of future RDA at t3 and CDA between t2 and subsequent clinical assessment. Multivariable models were adjusted for age, sex, disease duration, baseline EDSS, prior-year relapse count, baseline lesion burden, follow-up interval, and DMT status during the t2–t3 interval. For radiologic outcomes, the follow-up interval corresponded to the time between t2 and t3. For clinical outcomes, the follow-up interval corresponded to the time between t2 and the subsequent clinical assessment. As a sensitivity analysis, we repeated regression models using an alternative definition of CS-missed new lesions restricted to lesions measuring ⩾3 mm in maximal diameter.
A Poisson regression model was used to examine the relationship between the number of CS-missed new lesions at t2 and the number of subsequent new lesions at t3.
Results
Cohort characteristics
A total of 314 pwMS were included, contributing 942 MRI studies (314 t1–t2 pairs and 314 t2–t3 pairs). All pwMS had an RRMS phenotype. The median age was 44.1 years (IQR: 37–51), and 234 (74.5%) were female.
At t2, the median disease duration was 8.9 years (IQR: 4.4–15.8), and the median baseline EDSS was 2.0 (IQR: 1–2.5). The median EDSS at subsequent clinical follow-up was 2.0 (IQR: 1–2.5).
Baseline lesion burden at t2 was categorized 3 as mild (<20 lesions) in 98 (31.2%), moderate (20–50 lesions) in 112 (35.7%), and extensive (>50 lesions) in 104 (33.1%) pwMS.
DMT status at baseline was none in 71 (22.6%), low–intermediate efficacy therapy in 208 (66.2%), and high-efficacy therapy in 35 (11.1%) pwMS. DMT status at follow-up was none in 84 (26.8%), low–intermediate efficacy therapy in 190 (60.5%), and high-efficacy therapy in 40 (12.7%) pwMS. Across both intervals, 66 (21%) pwMS remained off DMT, 210 (66.9%) pwMS remained on the same DMT, 15 (4.8%) pwMS switched from one DMT to another between baseline and follow-up, 5 (1.6%) pwMS initiated DMT at follow-up after being off DMT at baseline, and 18 (5.7%) pwMS discontinued DMT between the two intervals.
The median time interval between t1 and t2 MRIs was 12 months (IQR: 11–15), and the median time interval between t2 and t3 MRIs was 13 months (IQR: 11–18.8). The median time between t2 MRI and follow-up clinical assessment was 12 months (IQR: 2.75–14).
Twelve pwMS (3.8%) had prior-year relapses, and the median prior-year relapse count was 0 (IQR: 0; range: 0–2).
Between t2 and the subsequent clinical assessment, clinical relapses occurred in 12 pwMS (3.8%), disability progression in 28 pwMS (8.9%), and CDA in 38 pwMS (12.1%).
Demographic, MRI, and clinical characteristics are summarized in Table 1.
Demographic, MRI, and clinical characteristics of the cohort by index MRI status.
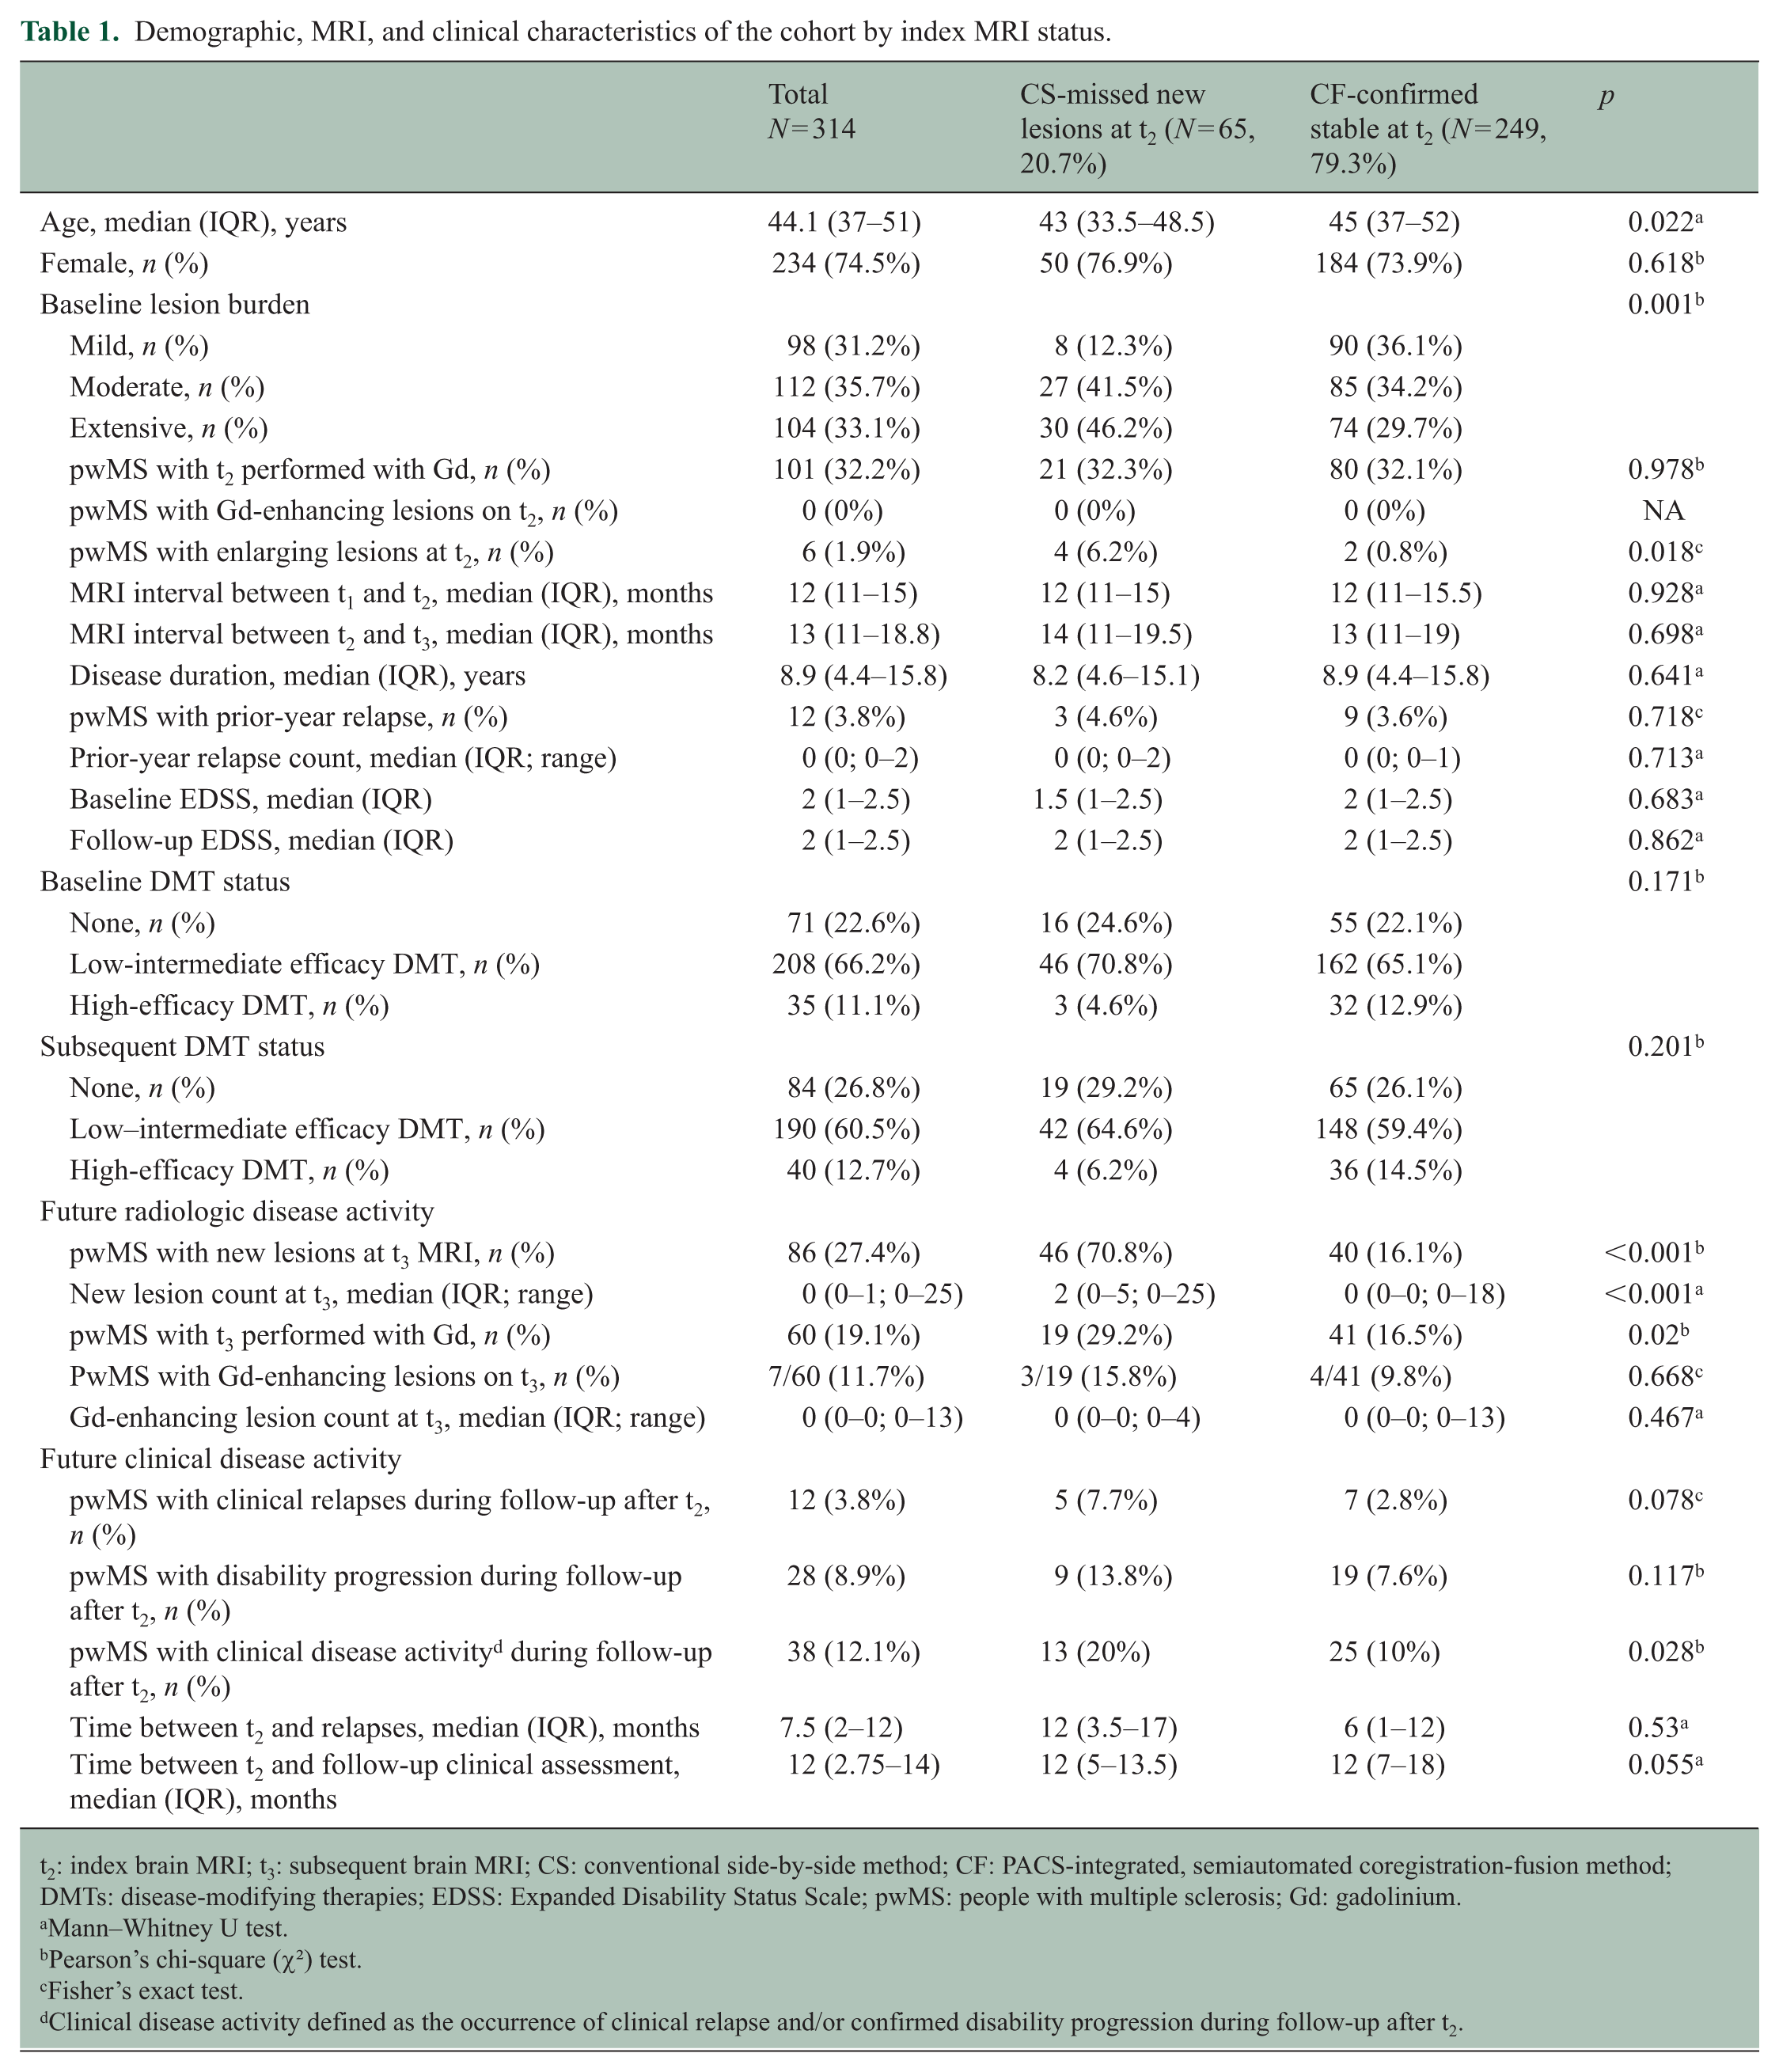
t2: index brain MRI; t3: subsequent brain MRI; CS: conventional side-by-side method; CF: PACS-integrated, semiautomated coregistration-fusion method; DMTs: disease-modifying therapies; EDSS: Expanded Disability Status Scale; pwMS: people with multiple sclerosis; Gd: gadolinium.
Mann–Whitney U test.
Pearson’s chi-square (χ²) test.
Fisher’s exact test.
Clinical disease activity defined as the occurrence of clinical relapse and/or confirmed disability progression during follow-up after t2.
Characteristics of CS-missed new lesions
A total of 183 new lesions were missed on t2 using CS. The median number of missed new lesions per pwMS was 2 (IQR: 1–3.5; range: 1–20). The median size of missed new lesions was 4 mm (IQR: 3–6; range: 2–12 mm). Most missed lesions were ⩽5 mm (72.7%), including 28 lesions (15.3%) measuring <3 mm. Larger missed lesions (⩾10 mm) were uncommon, with only six lesions (3.3%).
CS-missed new lesions were most frequently located in the deep white matter (42.1%), followed by periventricular (23.0%), subcortical (18.0%), juxtacortical (7.1%), brainstem (4.4%), cerebellum (2.7%), basal ganglia (1.6%), and thalamus (1.1%) (Table 2).
Characteristics of CS-missed new lesions at index MRI.
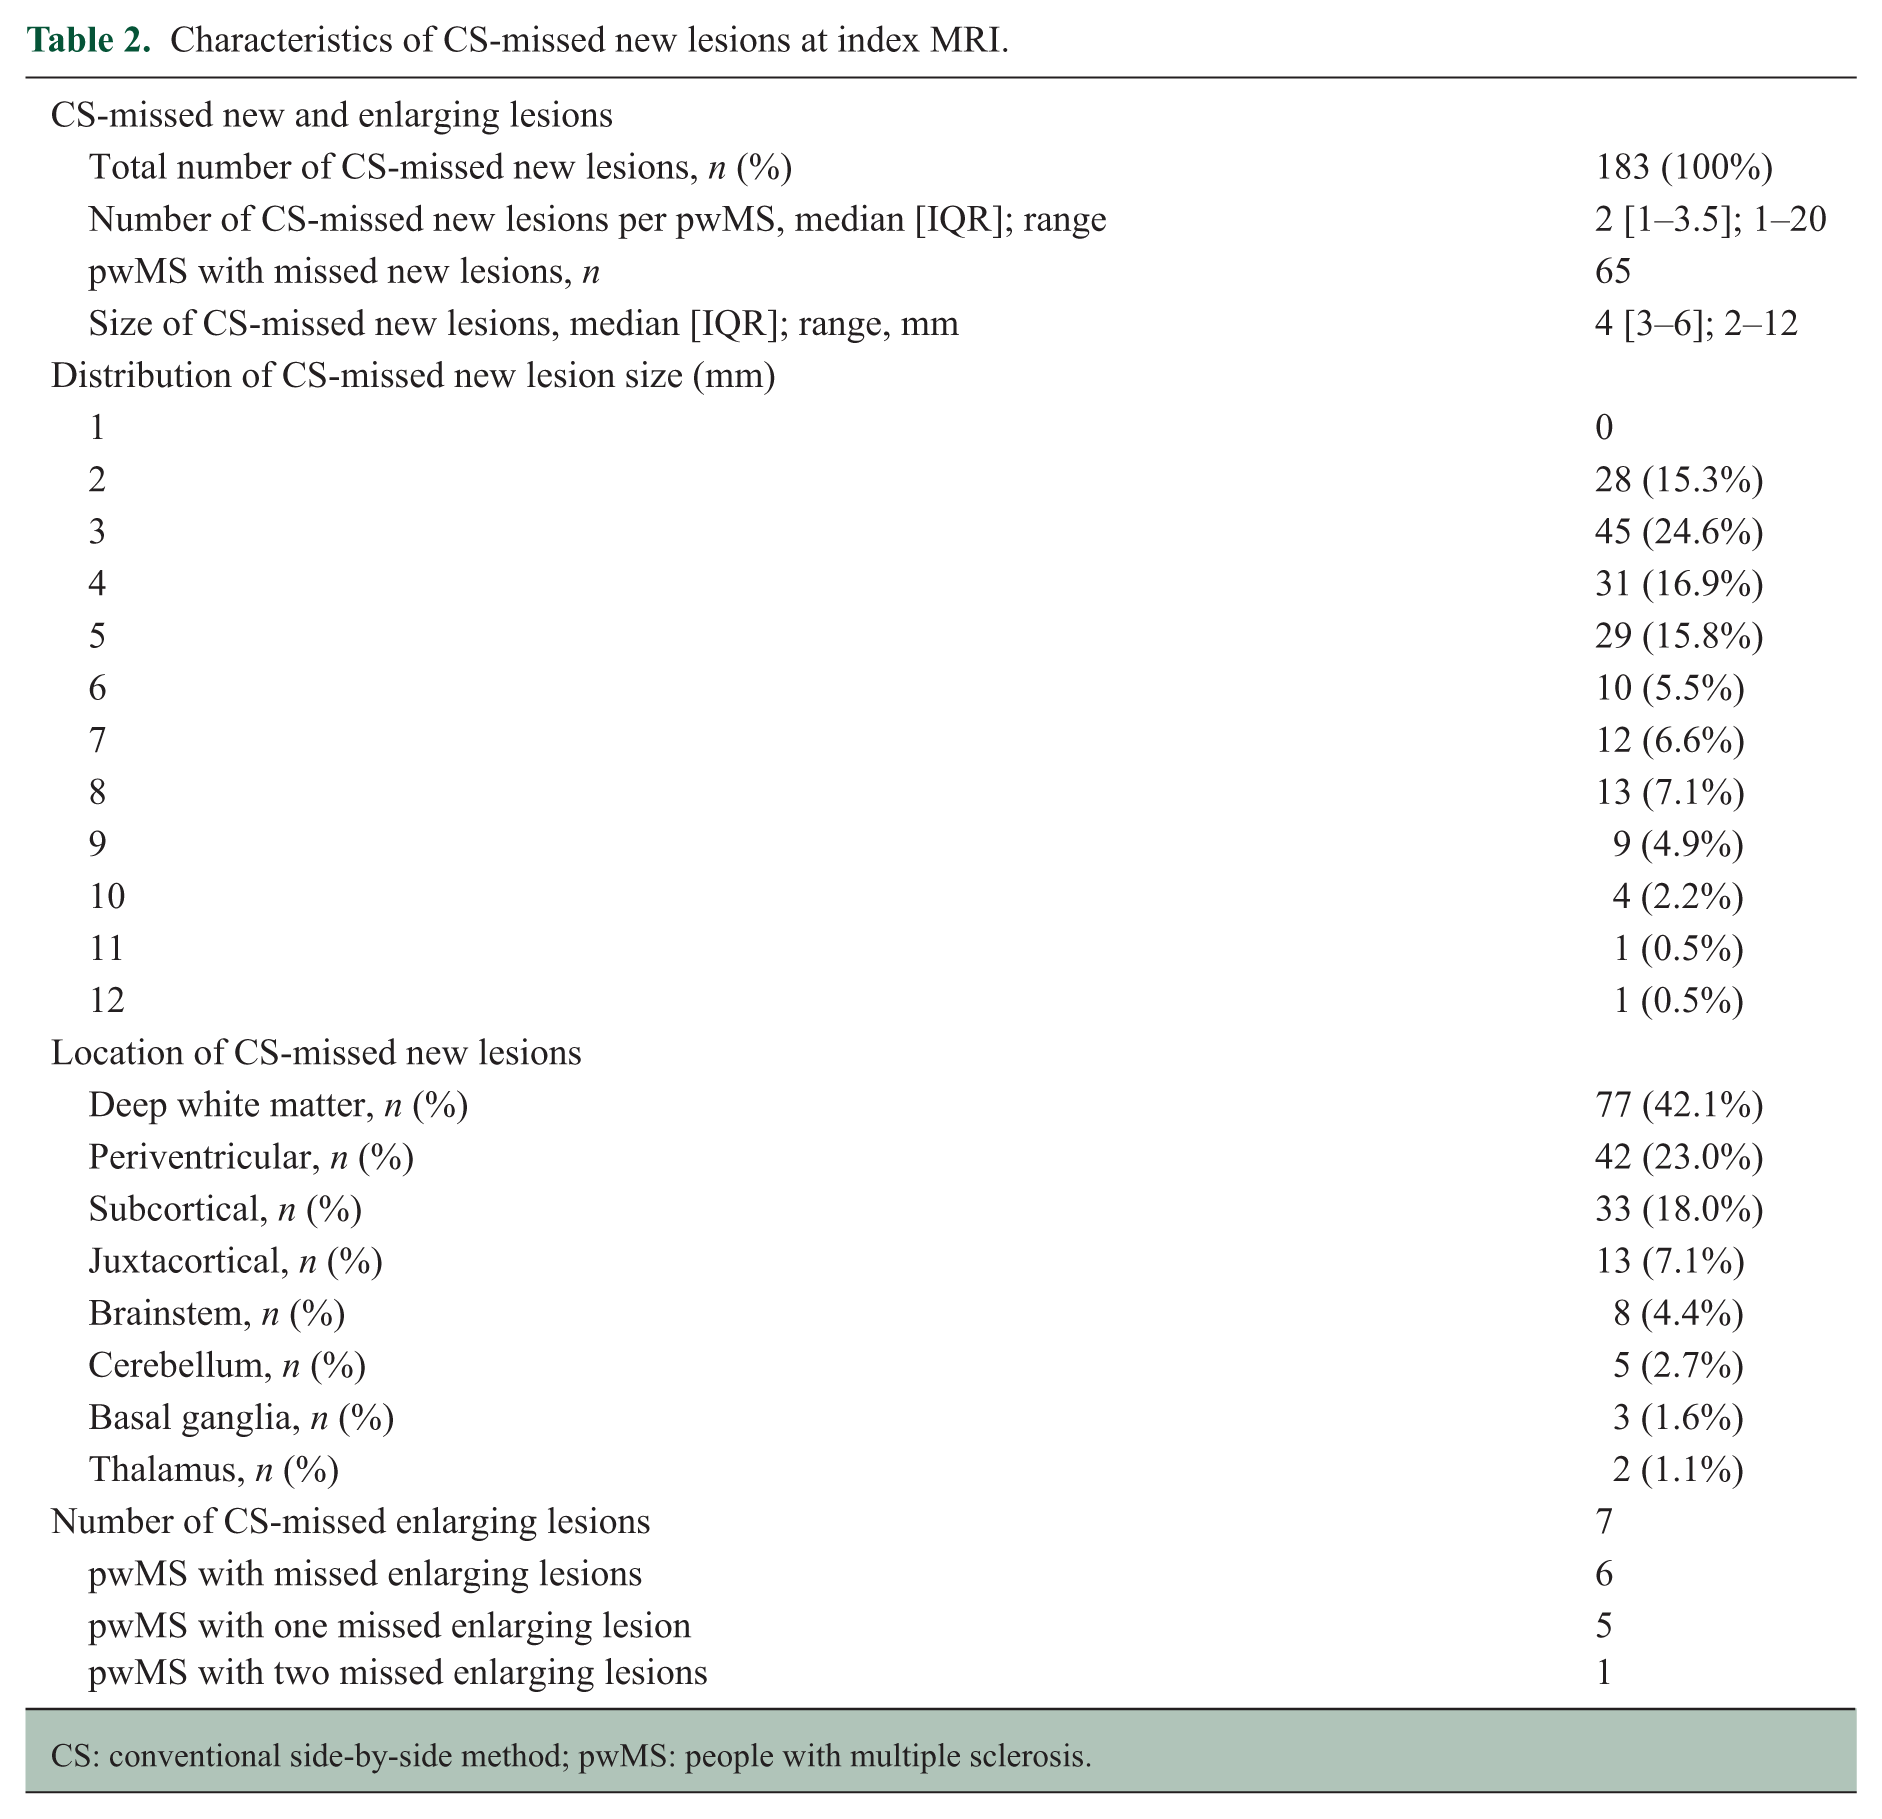
CS: conventional side-by-side method; pwMS: people with multiple sclerosis.
In addition, seven enlarging lesions were missed at t2 in six pwMS, including five with one enlarging lesion and one with two enlarging lesions.
PwMS with CS-missed new lesions versus CF-confirmed stable
When t2 and t1 MRIs were compared using CF, 65 (20.7%) pwMS were found to have CS-missed new lesions, while 249 (79.3%) were confirmed as stable. Inter-rater agreement for patient-level detection of CS-missed new lesions was almost perfect between Reader 1 and Reader 2 (κ = 0.95; 98.6% agreement) and between Reader 1 and Reader 3 (κ = 0.82; 93.3% agreement).
pwMS with CS-missed new lesions were younger than the CF-confirmed stable group (median age: 43 vs. 45 years, p = 0.022).
Baseline lesion burden differed significantly between groups (p = 0.001), with a higher proportion of moderate and extensive lesion burden in the CS-missed lesion group.
pwMS with enlarging lesions at t2 were more frequent in the CS-missed group (4 (6.2%) vs. 2 (0.8%), p = 0.018).
There were no significant differences between groups in sex distribution, disease duration, prior-year relapse count, baseline EDSS, follow-up EDSS, MRI intervals, or DMT status.
Gadolinium-enhanced sequences at t2 were available in 101 pwMS (32.2%). No enhancing lesions were identified at t2 in either group.
Association of CS-missed new lesions with future radiologic and clinical disease activity
Development of new lesions at t3 occurred in 86 pwMS (27.4%) and was significantly more frequent in the CS-missed lesion group compared with the CF-confirmed stable group (70.8%vs. 16.1%, p < 0.001). The median number of new lesions at t3 was higher in the CS-missed lesion group (2 vs. 0, p < 0.001).
Gadolinium-enhanced sequences at t3 were available in 60 pwMS (19.1%) and were more frequently performed in the CS-missed lesion group (29.2% vs. 16.5%, p = 0.02). Among those with gadolinium-enhanced studies, enhancing lesions were identified in 7 of 60 pwMS (11.7%), without a significant difference between groups (15.8% vs. 9.8%, p = 0.668).
The median time interval between t2 and relapse was 7.5 months (IQR: 2–12), and the median time between t2 and subsequent clinical assessment was 12 months (IQR: 2.75–14), without significant differences between groups.
Future clinical relapse did not significantly differ between groups (7.7% vs. 2.8%, p = 0.078). Disability progression also did not significantly differ (13.8% vs. 7.6%, p = 0.117). However, CDA occurred more frequently in the CS-missed lesion group (20% vs. 10%, p = 0.028) (Table 1).
Regression analyses
In univariable logistic regression analyses, the presence of CS-missed new lesions at t2 was strongly associated with future RDA at t3 (OR = 12.65, 95% confidence interval (CI) = 6.72–23.81, p < 0.001) and was also significantly associated with future CDA (OR = 2.24, 95% CI = 1.07–4.67, p = 0.032).
After adjustment for age, sex, disease duration, baseline EDSS, prior-year relapse count, baseline lesion burden, follow-up duration, and DMT status, CS-missed new lesions remained independently associated with future disease activity. For future RDA, the adjusted odds ratio (aOR) was 10.43 (95% CI = 5.31–20.46, p < 0.001). For future CDA, the aOR was 2.49 (95% CI = 1.10–5.65, p = 0.029).
In sensitivity analyses restricted to CS-missed new lesions measuring ⩾3 mm, the association with future RDA remained robust (aOR = 9.99, 95% CI = 5.07–19.69; p < 0.001). The association with future CDA was attenuated, with a strong trend toward statistical significance (aOR = 2.25, 95% CI = 0.99–5.11; p = 0.054). Nevertheless, the direction and magnitude of the associations were consistent with those observed in the primary analysis.
Baseline lesion burden was associated with future RDA in univariable analysis (overall p = 0.001). In the multivariable model, extensive lesion burden independently predicted future RDA (aOR = 2.90, 95% CI = 1.21–6.97, p = 0.017), whereas moderate lesion burden was not significant. In contrast, baseline lesion burden was not associated with future CDA in either univariable or multivariable analyses.
Longer follow-up MRI duration was associated with increased odds of RDA in both univariable (OR = 1.04, 95% CI = 1.00–1.08, p = 0.049) and multivariable analyses (aOR = 1.06, 95% CI = 1.01–1.11, p = 0.032). However, follow-up duration between t2 and subsequent clinical assessment was not significantly associated with CDA.
Age, sex, disease duration, baseline EDSS, prior-year relapse count, and DMT status were not independently associated with either RDA or CDA (Table 3).
Univariable and multivariable logistic regression analyses of future radiologic and clinical disease activity.
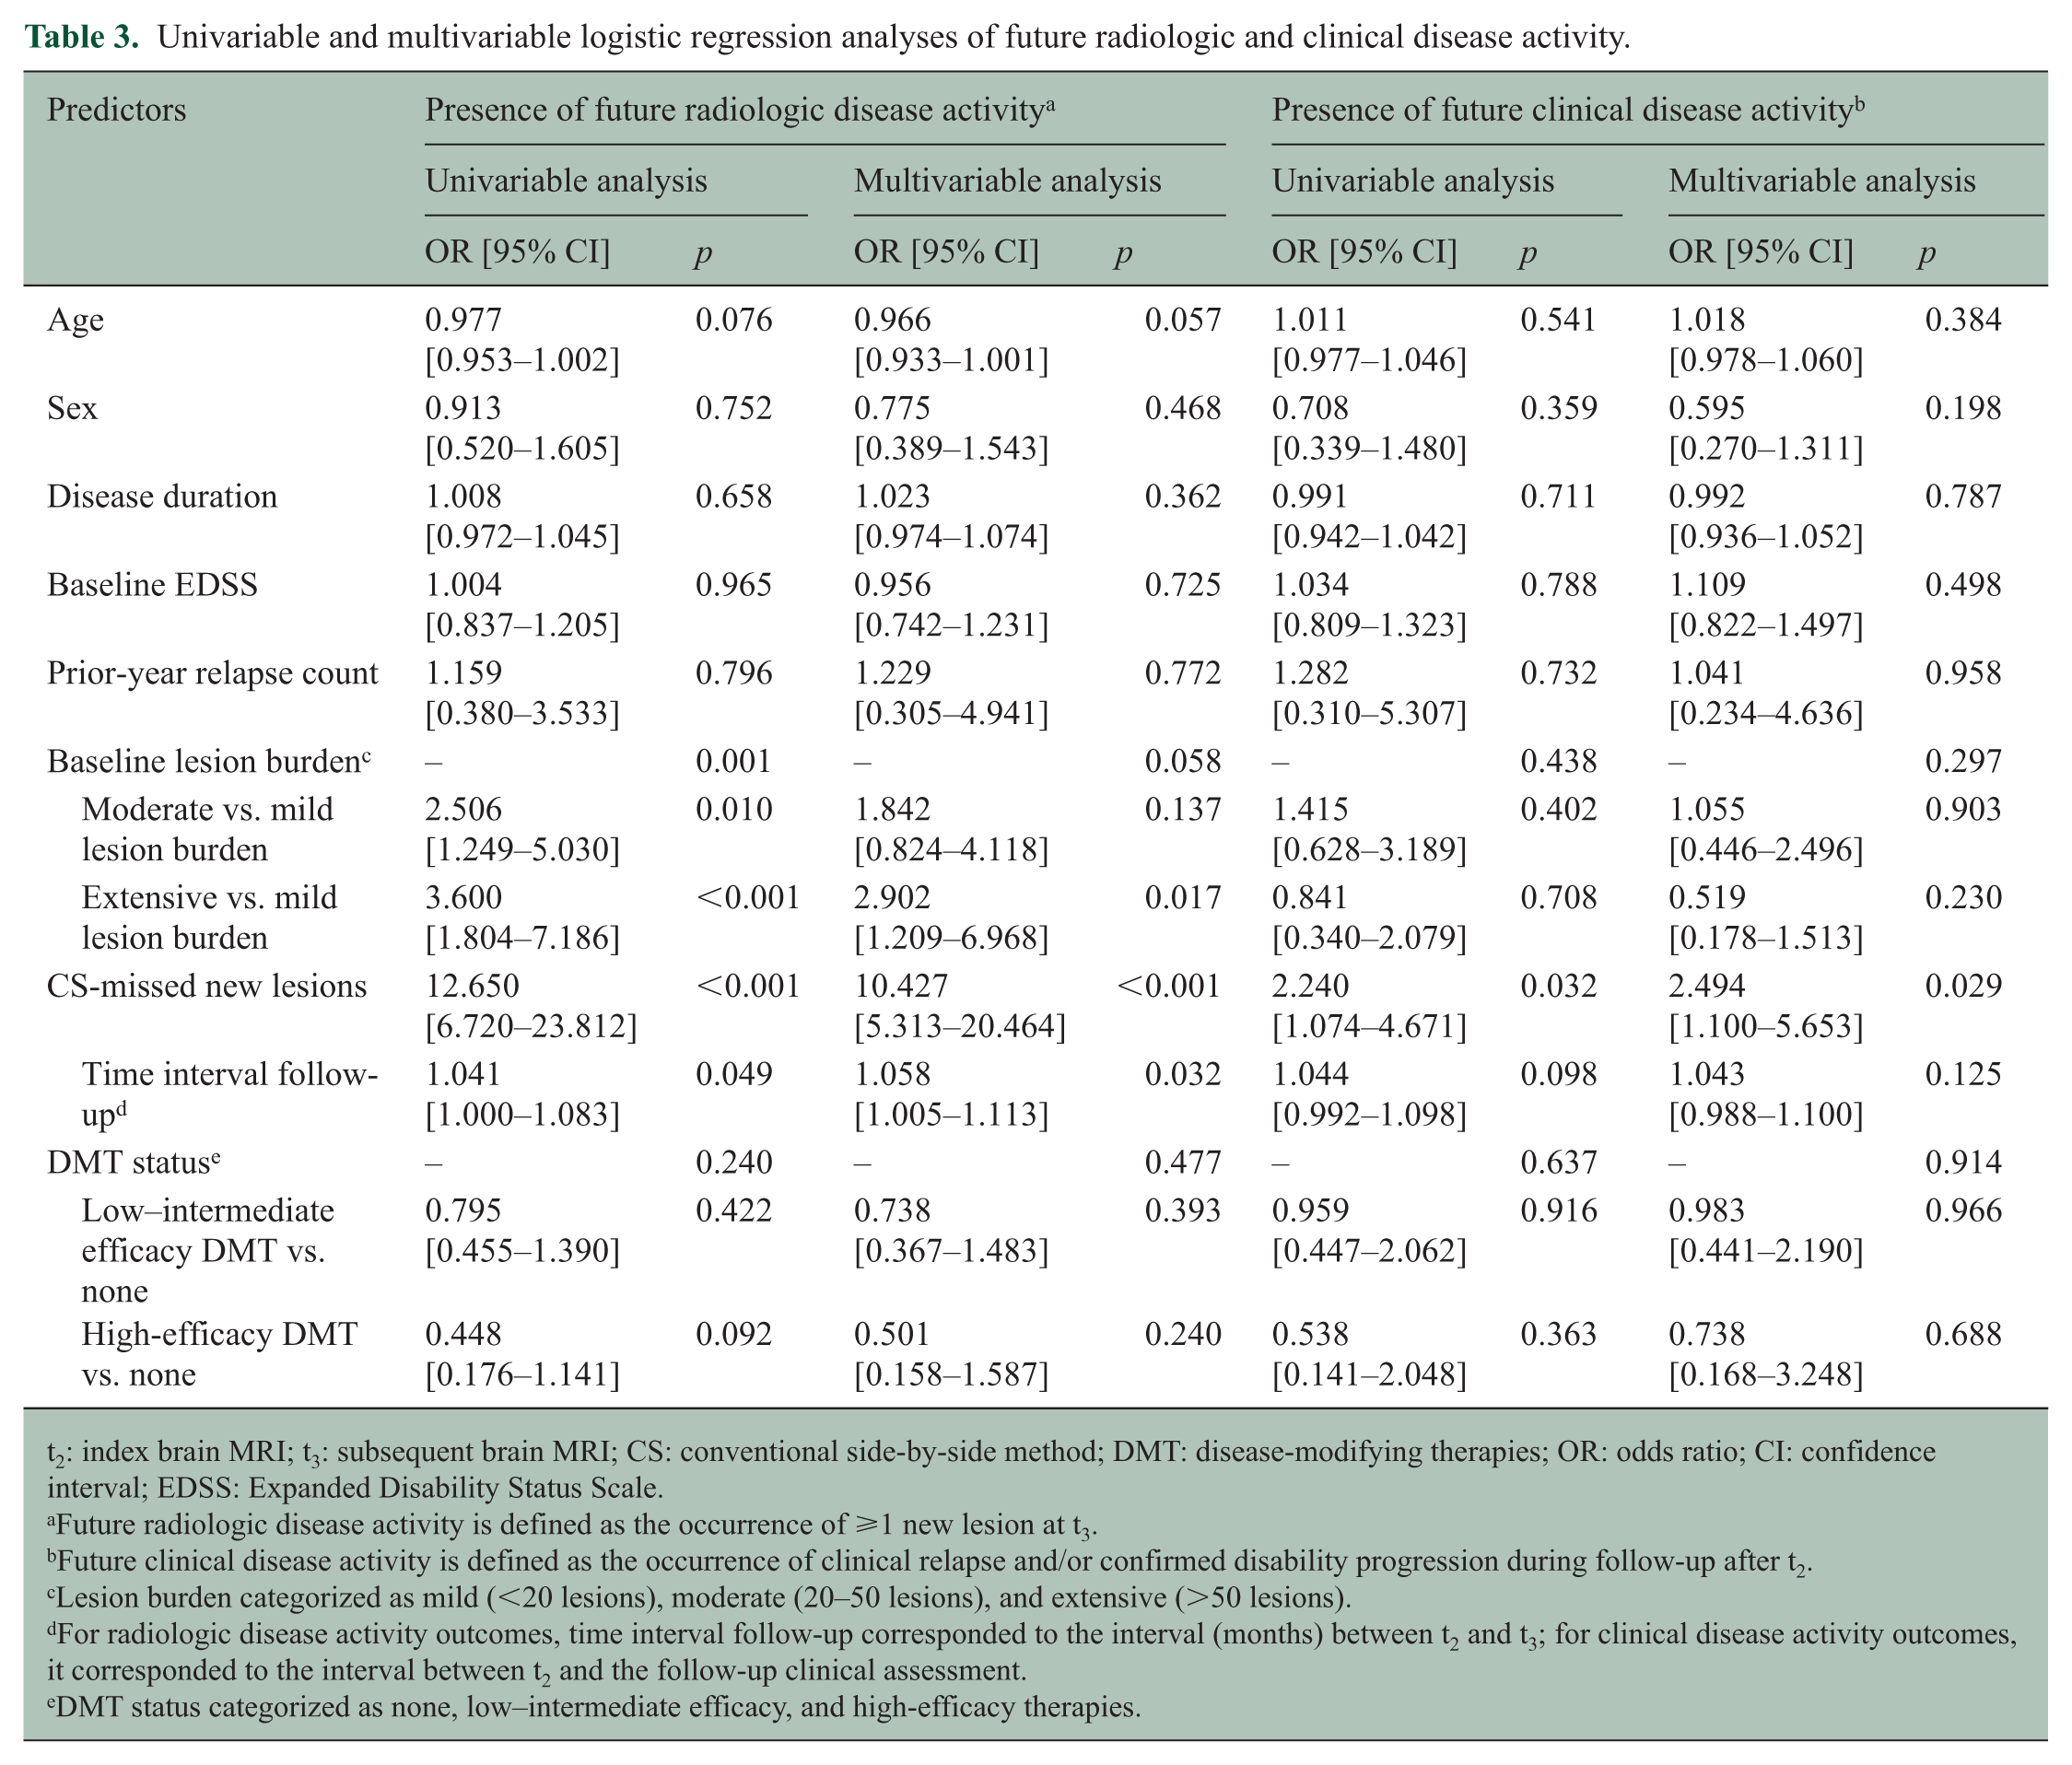
t2: index brain MRI; t3: subsequent brain MRI; CS: conventional side-by-side method; DMT: disease-modifying therapies; OR: odds ratio; CI: confidence interval; EDSS: Expanded Disability Status Scale.
Future radiologic disease activity is defined as the occurrence of ⩾1 new lesion at t3.
Future clinical disease activity is defined as the occurrence of clinical relapse and/or confirmed disability progression during follow-up after t2.
Lesion burden categorized as mild (<20 lesions), moderate (20–50 lesions), and extensive (>50 lesions).
For radiologic disease activity outcomes, time interval follow-up corresponded to the interval (months) between t2 and t3; for clinical disease activity outcomes, it corresponded to the interval between t2 and the follow-up clinical assessment.
DMT status categorized as none, low–intermediate efficacy, and high-efficacy therapies.
In addition, Poisson regression analysis demonstrated a significant positive association between the number of CS-missed new lesions at t2 and the number of new lesions at t3 (incidence rate ratio (IRR) = 1.205, 95% CI = 1.184–1.226, p < 0.001) (Figure 3).
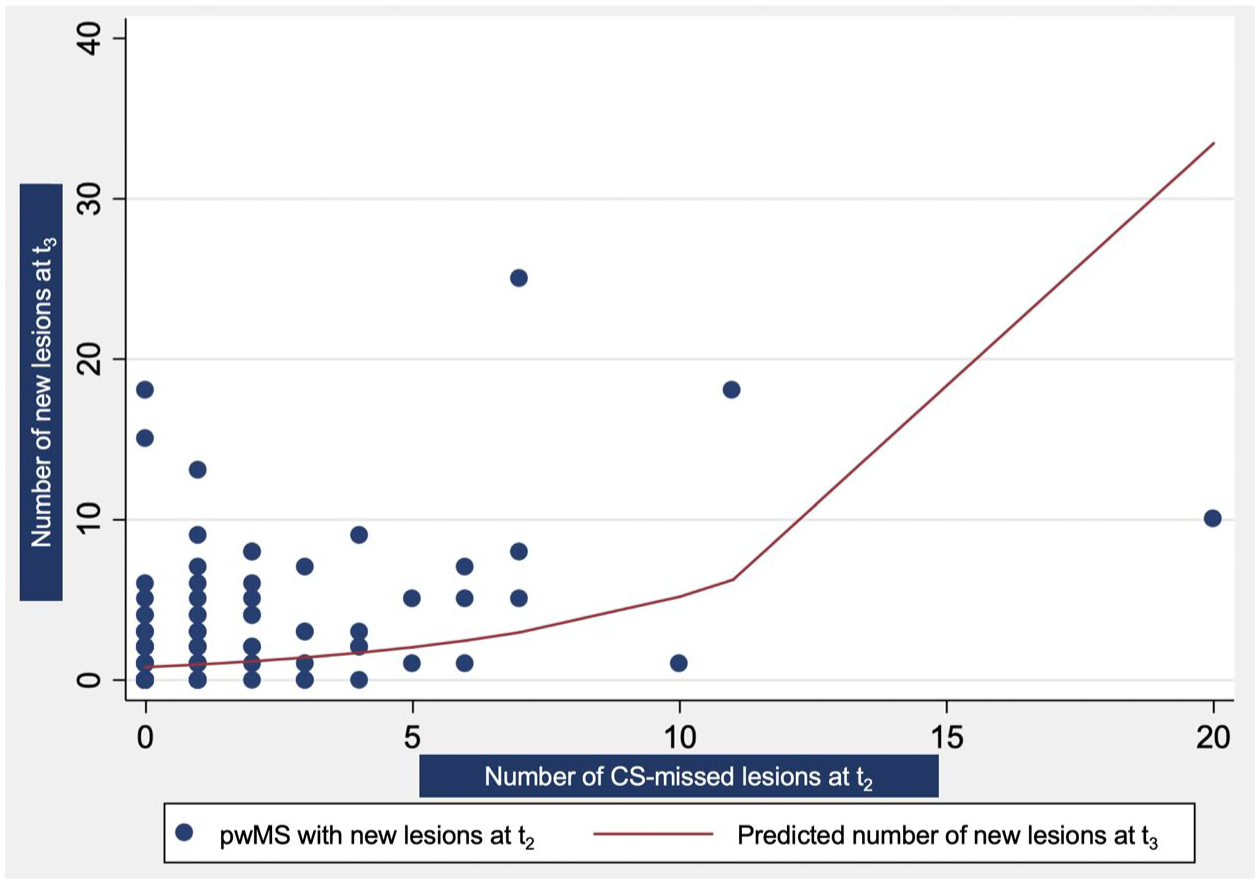
Poisson regression plot showing that each additional CS-missed new lesion at the index MRI (t2) was associated with a 20.5% increase in the expected number of new lesions at the subsequent MRI (t3) (IRR = 1.205, 95% CI = 1.184–1.226, p < 0.001).
Discussion
MRI is the most important paraclinical tool for disease monitoring in MS.3,4 The presence of RDA is a biomarker of ongoing focal disease activity that strongly influences neurologists’ decisions to initiate or change DMTs, as RDA is known to be strongly linked with adverse clinical outcomes.3,6–11,20 Accurate interpretation of follow-up MRI, therefore, requires reliable detection of new lesions to identify RDA. 3
In our study, CF identified CS-missed new lesions in 20.7% of pwMS despite being reported as “stable” by neuroradiologists, consistent with prior studies.13,14,16,17 Most missed lesions were small, with 72.7% measuring ⩽5 mm. The most commonly overlooked lesions were located in the deep white matter, followed by the periventricular white matter. These regions often harbor larger and more confluent baseline lesions, which may obscure newly developed lesions. CS-missed new lesions were also strongly associated with higher baseline lesion burden, as 88% of pwMS with CS-missed new lesions had moderate or extensive lesion burden at baseline. These findings likely reflect both perceptual and cognitive sources of error in CS. 21 CF may help address these limitations by reducing visual search demands, offloading working memory through synchronized coregistration, and providing objectively coregistered CF-FLAIR images.
CS-missed new lesions were strongly associated with future disease activity; notably, 70.8% of pwMS with CS-missed lesions developed new lesions at t3 versus 16.1% of the CF-confirmed stable group. CDA during follow-up occurred in 20% of pwMS with CS-missed new lesions compared with 10% in the CF-confirmed stable group.
Multivariable regression analysis confirmed that the presence of CS-missed new lesions was an independent predictor of both future RDA and CDA. After adjustment for relevant covariates, pwMS with CS-missed new lesions had more than 10-fold higher odds of future RDA and more than twofold higher odds of subsequent CDA. Moreover, each additional CS-missed lesion was associated with an approximately 20% increase in the number of new lesions on the subsequent MRI. When clinical relapse and disability progression were analyzed separately, we did not observe statistically significant independent associations. This likely reflects the relatively small number of individual clinical events and limited statistical power, whereas the composite CDA outcome provided greater sensitivity to detect clinically meaningful disease activity. 7
Our findings highlight the prognostic value of new lesions as a marker of ongoing and future disease activity, consistent with prior studies demonstrating that new lesions are strongly associated with subsequent RDA and CDA in pwMS.7,20 Our results support the view that even a single new lesion detected by CF warrants closer monitoring, consistent with the current MRI monitoring frameworks that classify any new lesion in subsequent MRI as evidence of active inflammatory disease.6,8,9,11 In clinical practice, detection of new lesions on follow-up MRI also directly informs therapeutic management, often prompting treatment reassessment and consideration of DMT optimization, even in the absence of overt relapse.6,7,9,11 pwMS with CS-missed new lesions, therefore, represent a high-risk subgroup, underscoring the importance of adopting CF for detecting subtle RDA.
To our knowledge, this is the first study to validate that CF not only improves radiologists’ accuracy in detecting new lesions compared with routine CS but also, more importantly, enhances the identification of pwMS with CS-missed new lesions who are at increased risk of future disease activity. Thus, CF adds clinical value beyond technical sensitivity by reclassifying a subset of pwMS previously labeled as “stable” under CS into an RDA category.
The MAGNIMS recommendations suggest the use of gadolinium-based contrast agents in selected follow-up MRIs, particularly in pwMS with extensive lesion burden. 3 CF could potentially reduce reliance on gadolinium in this scenario, although it is not intended to replace contrast when clinically indicated.
Adopting CF may enhance clinical practice by improving the detection of RDA and identifying a subgroup of pwMS at higher risk of future disease activity. In addition, several emerging automated AI-assisted tools may help streamline clinical workflow and enhance imaging interpretation in pwMS; however, their clinical validation and radiologist oversight remain essential before integration into practice.22–25
Our study has several notable strengths. First, it reflects a real-world cohort of pwMS with MRI follow-up using a CF workflow, enhancing practical relevance and highlighting commonly missed lesion locations. Second, the analysis focuses on pwMS cases initially classified as “stable” on CS, offering a stringent test of whether CF can reveal clinically meaningful disease activity that might otherwise go undetected. Third, the significant association between the presence of CS-missed new lesions and future disease activity strongly supports the prognostic utility of adopting CF in routine radiology practice and aligns with the prior evidence that new lesions predict future disease activity. 7 Finally, CF may reduce reliance on gadolinium in routine follow-up MRIs of pwMS with extensive baseline lesion burden.
Nevertheless, several limitations should be acknowledged. First, this was a retrospective, single-center cohort study, which may limit generalizability and introduce potential selection bias. Second, all paired comparisons in this study were compared using CF on the same MRI platform and 3D-FLAIR sequence; thus, performance across different scanners or FLAIR acquisition techniques was not evaluated. In addition, this study was not designed as a formal diagnostic accuracy study of CF, and false-positive lesion detection was not systematically measured in this cohort. Third, the number of pwMS with CS-missed new lesions was modest, and future CDA was relatively infrequent, limiting the power of separate analyses of relapse and disability progression. Finally, variability in MRI and clinical follow-up intervals may have influenced lesion accrual rates and detection of CDA. Larger cohorts with longer and more standardized follow-up MRI and clinical intervals are needed to determine whether CS-missed new lesions independently predict relapse and disability progression.
In conclusion, improved lesion detection with CF reclassified about one in five pwMS reported as “stable” on MRI using CS as having missed RDA. This reclassified subgroup was associated with future disease activity, particularly future RDA. These findings support the potential value of incorporating CF into routine MRI monitoring in pwMS.
Footnotes
Author’s Note
This study was recently highlighted as a scientific poster presentation (poster#679) at ECTRIMS 2025, Barcelona, Spain.
Declaration of Conflicting Interests
The authors declared the following potential conflicts of interest with respect to the research, authorship, and/or publication of this article: Suradech Suthiphosuwan has received personal compensation for speaking from Novartis. Timothy Reynold Lim, Fasna Raufdeen, Minth Punpichet, Amy Wei Lin, Shobhit Mathur, Yingming Amy Chen, and Aditya Bharatha have no disclosures. Jiwon Oh has received research funding from Biogen Idec, Brain Canada, Roche, the MS Society of Canada, and the National MS Society and has received personal compensation for consulting or speaking from Biogen Idec, EMD Serono, Amgen, Novartis, Roche, and Sanofi Genzyme.
Funding
The authors received no financial support for the research, authorship, and/or publication of this article.
Ethics Approval Statement
This study was approved by our institutional research ethics board. Because of the retrospective nature of the study, the need for informed consent was waived.
Data Availability Statement
Data supporting the findings of this study are available within the article or from the corresponding author upon reasonable request.