
Abstract
Background:
Chronic lesion tissue expansion (CLTE) reflects slow, concentric growth of established multiple sclerosis (MS) lesions and is linked to central brain atrophy and disability progression. Whether existing MS disease-modifying therapies (DMTs) differentially influence this aspect of progressive MS biology remains unclear.
Objectives:
To compare the effect of current DMTs on CLTE in a multicentre, real-world MS cohort.
Methods:
We conducted a retrospective, observational study using linked clinical data from MSBase and the MSBase Imaging Repository. Data from patients aged ⩾18 years with ⩾3 longitudinal MRI scans, and 7 therapies with ⩾100 stable treatment epochs were included. Therapy effects on CLTE, new T2 lesions, and brain atrophy were assessed using epoch-based covariate-adjusted generalised estimating equation models, with fingolimod as a comparator.
Result:
The cohort included 564 patients contributing 1648 stable treatment epochs. After adjustment for demographic, clinical, and imaging covariates, B-cell depleting therapy was the only DMT associated with significantly lower CLTE (β = −4.03, p = 0.017) relative to fingolimod. CLTE was independently associated with age, baseline lesion volume, and centre effects.
Conclusions:
B-cell depletion is associated with reduced CLTE, a promising biomarker of progressive MS biology.
Background
Chronic multiple sclerosis (MS) lesions that exhibit active inflammation at the lesion edge were first identified in autopsies of patients with secondary progressive MS in 2001. 1 Such ‘progressive plaques’, necessarily sampled at a single timepoint, were postulated to represent slowly expanding lesions (SELs) that could contribute to disease worsening, independent of the development of new MS lesions or clinical relapses. The rim of these lesions is infiltrated by activated microglia and associated with low-grade myelin breakdown.1,2 Iron accumulation is observed in macrophages in some cases. 3
These pathological insights have been important in furthering our understanding of progressive MS, but do not provide a means of monitoring disease progression in-vivo. Traditional magnetic resonance imaging (MRI) indices, such as T2 lesion burden, do not sensitively detect chronic inflammation and correlate poorly with disability progression. Therefore, several MRI methods, including slowly expanding chronic lesions, have been proposed as potential biomarkers to meet this need.
Gradual and concentric growth of T2-weighted lesions has been used to designate MRI SELs. 4 Similar to their pathological equivalent, radiological SELs feature a central core with reduced T1 signal intensity compared to non-SEL lesions, indicating more severe axonal loss.5,6 Two approaches have been used to identify and quantify SELs. The first is based on calculation of the Jacobian determinant of the deformation field at each lesional voxel between non-linearly registered scans; 4 and the second on co-registration and alignment of the centroids of individual chronic lesions between sequential MRI scans. 7 The former technique permits binary classification of lesions as SELs/non-SELs and provides the baseline volume of those lesions. Using the latter method, the aggregated volume of expanded lesional tissue across all brain lesions can be calculated to yield a chronic lesion tissue expansion (CLTE) volume and rate. 8 This metric shows remarkable patient-level consistency across multiple epochs. 9
These markers of chronic lesion expansion are associated with progression independent of relapse activity (PIRA). Specifically, SEL volume is associated with faster disability progression in relapsing remitting, secondary progressive and primary progressive MS (PPMS).6,9–12 and with whole, and in particular central, brain atrophy.9,13 Similarly, paramagnetic rim lesions (PRLs) are associated with more severe disability in people with MS (pwMS).13–15
Attempts to assess the effect of disease-modifying therapies (DMTs) on the course of chronic lesion expansion have been limited. A small cohort of 52 patients with relapsing-remitting MS (RRMS) on fingolimod or natalizumab was followed over 24 months and the results suggested a limited effect of these DMTs in preventing SEL occurrence. 16 A larger cohort of 732 patients with PPMS from ORATORIO, a phase III study of ocrelizumab, demonstrated reduced longitudinal measures of chronic lesion activity, including T1 hypointense lesion volume accumulation and normalised lesion T1 signal intensity decrease, in the treated cohort compared to placebo. 6 In an extension of the phase IIb trial of Bruton’s tyrosine kinase inhibitor tolebrutinib in RRMS, in which serial MRI were assessed in 124 patients, SEL volume was lowest at 72 weeks in those on the highest dose of tolebrutinib. 17 Similarly, in a phase II trial of evobrutinib in RRMS, SEL volume was reduced at 48 weeks in patients on the highest dose of evobrutinib compared to lower doses. 18 Notably, these studies used the Jacobian determinant of the deformational field between baseline and follow-up scans to designate SEL candidates; and reported the ‘SEL volume’ as the volume of the corresponding baseline T1 or T2 lesions, rather than the actual volume of expanded tissue.
In this study, we have retrospectively assessed the differential impact of DMTs on lesion expansion using a volumetric CLTE measure. The identification of DMTs that positively impact CLTE trajectories in retrospective cohorts may help to identify agents that warrant further investigation in prospective clinical trials targeting progressive MS biology.
Methods
This is an observational, retrospective, longitudinal study to assess changes in CLTE in pwMS treated with DMTs. All data was directly obtained from the MSBase registry, an international online research platform for patients with MS containing pseudonymised clinical data; 19 and MSBase Imaging Repository (MSBIR), a pseudonymised repository of corresponding raw MRI images and MRI analysis metrics. 20
Written or verbal informed consent was obtained from all patients in accordance with local regulations; the MSBase registry was approved by Melbourne Health Human Research Ethics Committee and by each participating site’s institutional review board.
Study population
Patients aged 18 years or older, diagnosed with MS according to the McDonald 2017 criteria, with ⩾ 4 clinical visits entered into MSBase over ⩾ 24 months were included in the study. 21 Exclusion criteria included use of an investigational drug or procedure during the observation period, PPMS, or a history of any other central nervous system (CNS) demyelinating disorder.
Data were exported from the MSBase Registry on 1 November 2023, and included age, sex, Expanded Disability Status Scale (EDSS) 22 at each clinical review, acute relapses and DMT history. Imaging data from corresponding patients with ⩾ 3 MRI scans, collected over ⩾ 2 years, was extracted from MBSIR following the application of CoeusTM, a web-based imaging metadata search interface (Sydney Neuroimaging Analysis Centre, Sydney). Furthermore, imaging criteria required for automated lesion and volumetric image analysis included the availability of pre-contrast 3D T1-weighted and volumetric 3D FLAIR sequence acquisitions, and longitudinal protocol stability, as described previously. 23
We further refined the study data set as follows. For each patient, for every interval between two sequential MRIs, treatment at the start and end of each epoch was recorded. Epochs during which DMT changed were excluded from further analysis. Therapies with ⩾ 100 stable treatment epochs available were included in the analysis. Patients treated with alemtuzumab were considered to be continuously receiving this therapy from the first exposure onwards; or until another DMT was commenced. For other therapies, a gap in treatment of more than 6 months (or 12 months for ocrelizumab/rituximab) classified the patient as being on no treatment thereafter; or until another DMT was commenced.
MRI acquisition and analysis
T2 FLAIR lesions were automatically segmented on each MRI scan using a validated artificial intelligence-based commercial tool, iQ-SolutionsTM (MS Report), henceforth iQ-MSTM (Sydney Neuroimaging Analysis Centre, Sydney). 23 Whole-brain CLTE was then calculated from pairwise lesion masks using previously published methods.7,9 Briefly, CLTE was quantified from serial co-registered lesion masks by measuring the expanding component of pre-existing chronic T2 lesions between sequential scans, with correction for brain atrophy-related lesion displacement, as previously described.7,8 For a given patient, absolute CLTE was therefore calculated for each treatment epoch, namely, between the initial scan and second scan, between the second and third scan and so on; and absolute CLTE was expressed as a percentage of the baseline T2 lesion volume (see Figure 1 for a representative example from this cohort). Epochs with a baseline matched T2-lesion volume of <100 mm3 were not included in the analysis. New T2 lesions and annualised percentage brain volume change (PBVC) were also automatically calculated for each treatment epoch using iQ-MS.
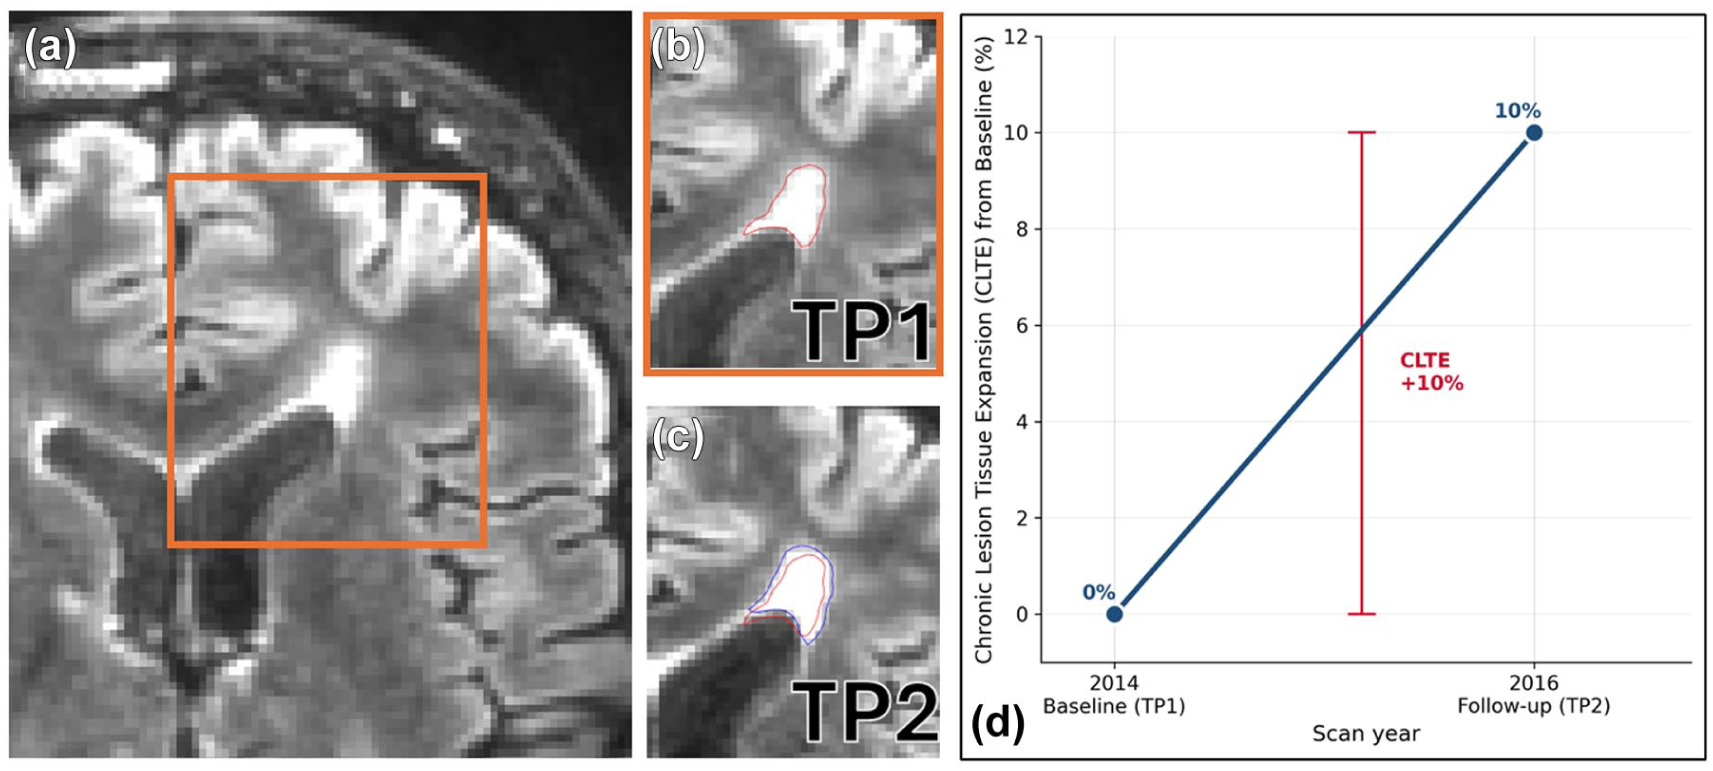
Representative example of chronic lesion tissue expansion (CLTE). (a) Axial FLAIR image at baseline (TP1, 2014) showing a chronic T2-hyperintense lesion; the orange box denotes the region magnified in panels B and C, (b) Magnified baseline view with the automatically segmented lesion mask outlined in red, (c) Co-registered follow-up FLAIR image (TP2, 2016) showing the baseline lesion mask (red) overlaid on the expanded follow-up mask (blue); the difference between the two masks represents chronic lesion tissue expansion and (d) Corresponding longitudinal trajectory of CLTE for this patient, expressed as a percentage of the baseline T2 lesion volume. Over the course of this epoch (from TP1 to TP2), CLTE was +10%.
For each MRI timepoint, the EDSS score closest to that timepoint was recorded (within 6 months of the timepoint, or within 12 months where the preceding and following EDSS scores were stable).
Statistical analysis
Descriptive statistics were calculated for baseline demographic characteristics, unadjusted T2 lesion activity, brain atrophy and chronic lesion tissue changes.
Statistical analysis was performed using IBM SPSS Statistics (version 31). The associations of treatment and other patient characteristics with new T2 lesion count, annualised PBVC and CLTE (expressed as a percentage of baseline T2 lesion volume) were analysed using generalised estimating equation (GEE) models, with fingolimod, the treatment group with the largest sample size, pre-specified as the reference category. All models were adjusted for sex, age, baseline EDSS, disease and treatment duration at baseline, preceding relapse rate, baseline T2 lesion volume, previous therapy class and study centre. For new T2 lesion counts, a negative binomial GEE with log link and an offset term for epoch duration was applied. Both PBVC and CLTE were modelled using normal-identity GEE models; epoch duration and percent brain volume change were additionally included as covariates in the CLTE model. Statistical significance was set at p < 0.05.
Results
Study cohort and demographics
In total, 564 patients from five sites (four in Australia and one in the United States) meeting both clinical and imaging inclusion criteria were identified in MSBase/MSBIR (Table 1). This cohort included patients whose brain MRI scans were acquired between February 2011 and March 2023. Mean age at index MRI was 42.5 (SD 11.1) years, with a female-to-male ratio of 3.1:1. Median disease duration at index MRI was 5.8 years (interquartile range (IQR) 2.5–11.9 years). Therapies for which >100 epochs were identified included glatiramer acetate, interferon-β, fingolimod, dimethyl fumarate, alemtuzumab, natalizumab and anti-CD20 monoclonal antibodies (ocrelizumab and rituximab, henceforth ‘B-cell depleting therapy’). Other DMTs were excluded from further analysis. In total, 1648 eligible treatment epochs (range 2–13 per patient) with a median duration of 381 days (IQR 332–490 days) were identified. Median baseline total T2 lesion volume was 3.53 mL (IQR 0.99–9.78 mL).
Baseline patient and imaging data.
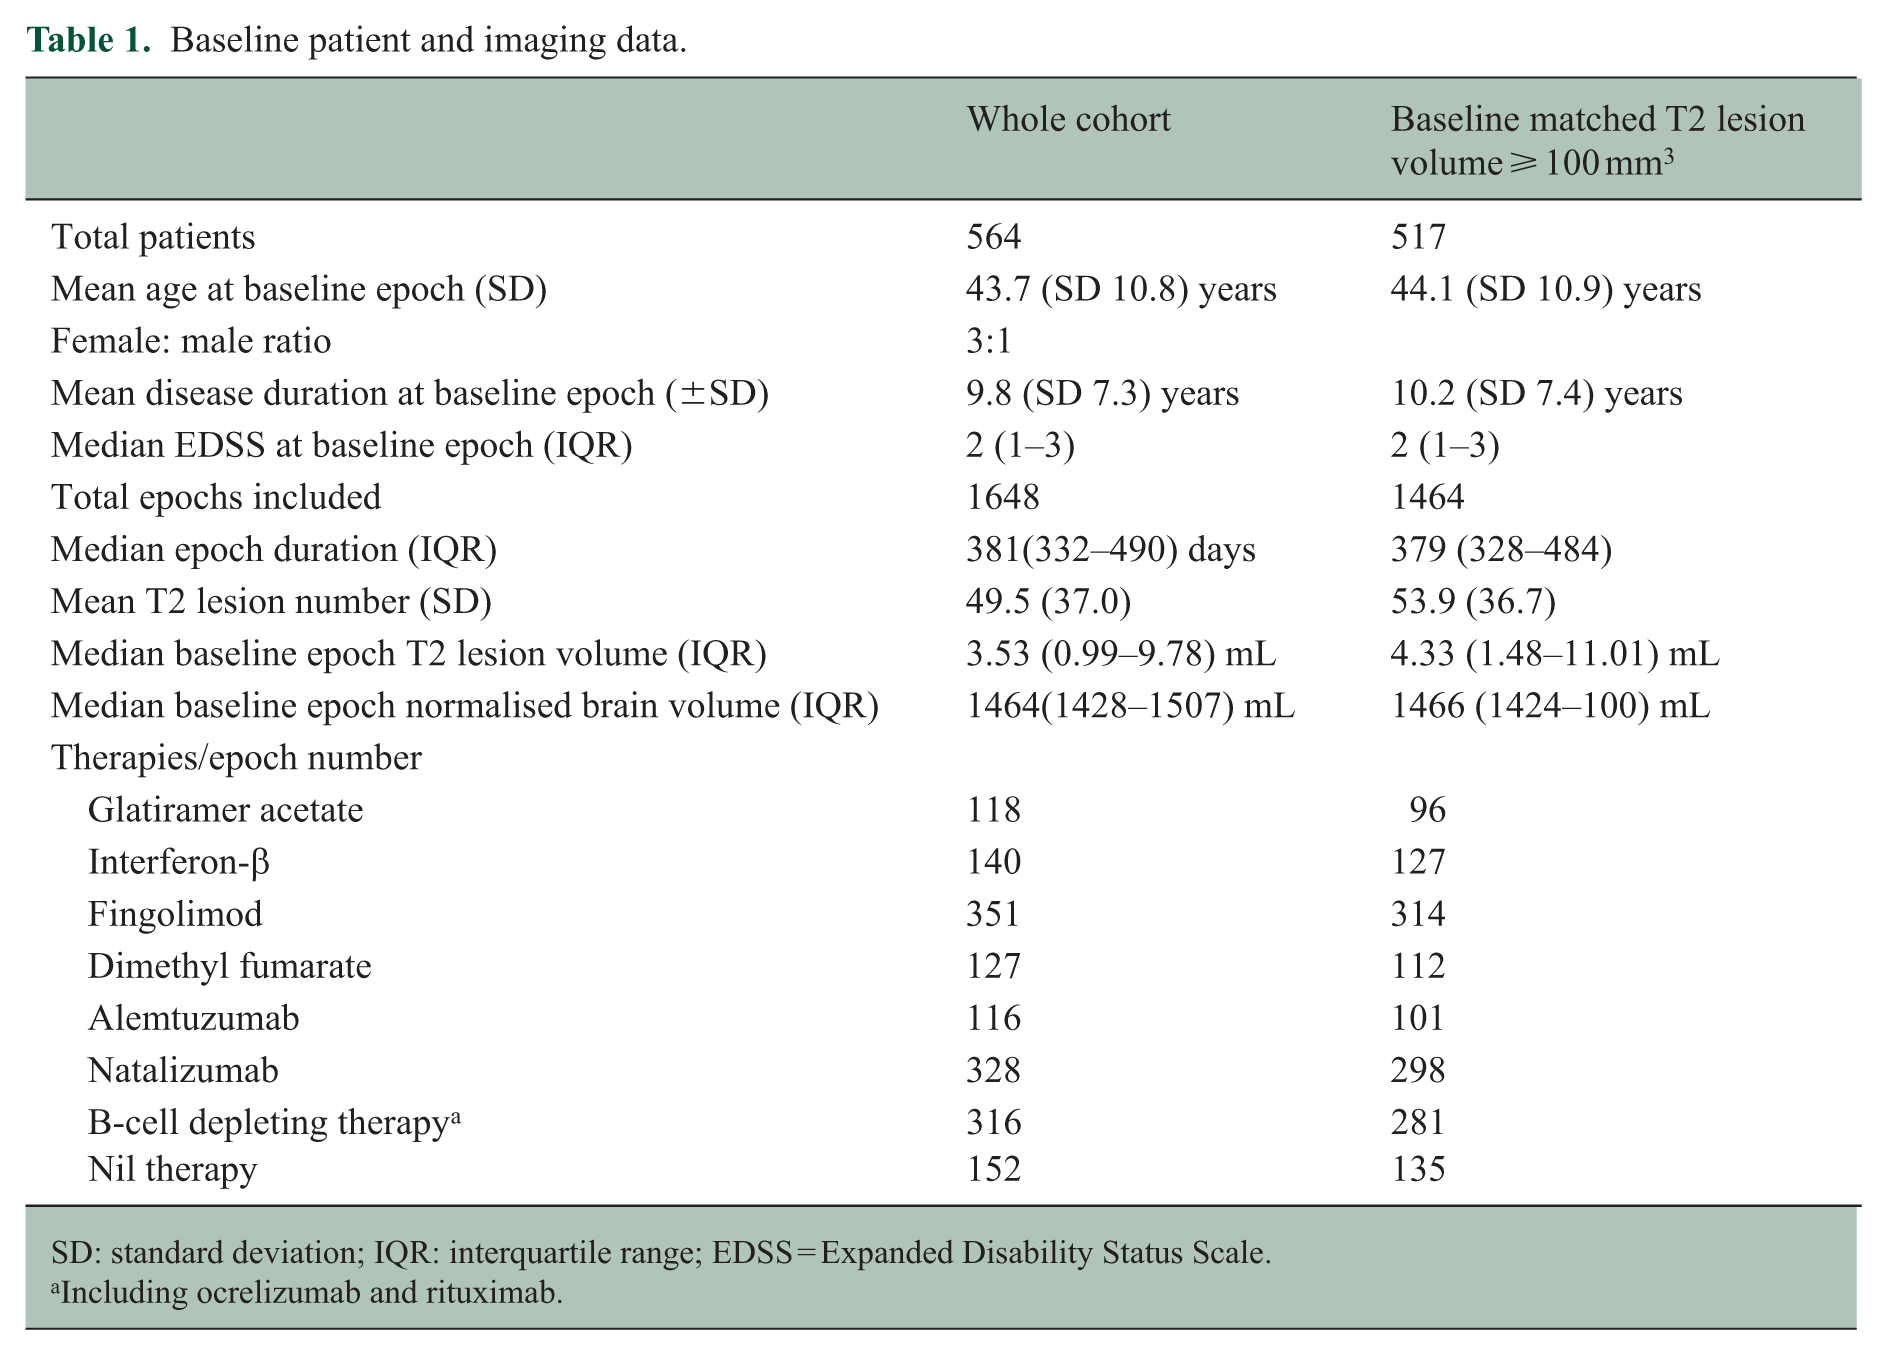
SD: standard deviation; IQR: interquartile range; EDSS = Expanded Disability Status Scale.
Including ocrelizumab and rituximab.
Epoch-based analysis
In absolute terms, for epochs with a baseline volume of >100 mm3, the mean number of new T2 lesions per epoch was 0.30 (SD 1.2); annualised mean new T2 lesion number was similar (0.31, SD 1.5). The mean annualised PBVC was −0.39% (SD 1.4%). The annualised rate of CLTE was 245 (SD 1418) mm3 per year; and mean annualised percentage rate of CLTE was 5.6% (SD 17.3%). Both CLTE statistics were normally distributed (Supplementary Figure 1).
Per therapy, mean annualised rates of new T2 lesions, PBVC and CLTE (absolute and as a percentage of baseline T2 lesion volume) in this cohort are shown in Table 2. The unadjusted CLTE rate ranged from 3.0% to 6.8% per year and was lowest in the B-cell depleting therapy group. B-cell depleting therapy also tended to have the greatest impact on whole brain atrophy and, with natalizumab, was associated with the least T2 lesion activity.
Per therapy mean (SD) unadjusted outcomes.
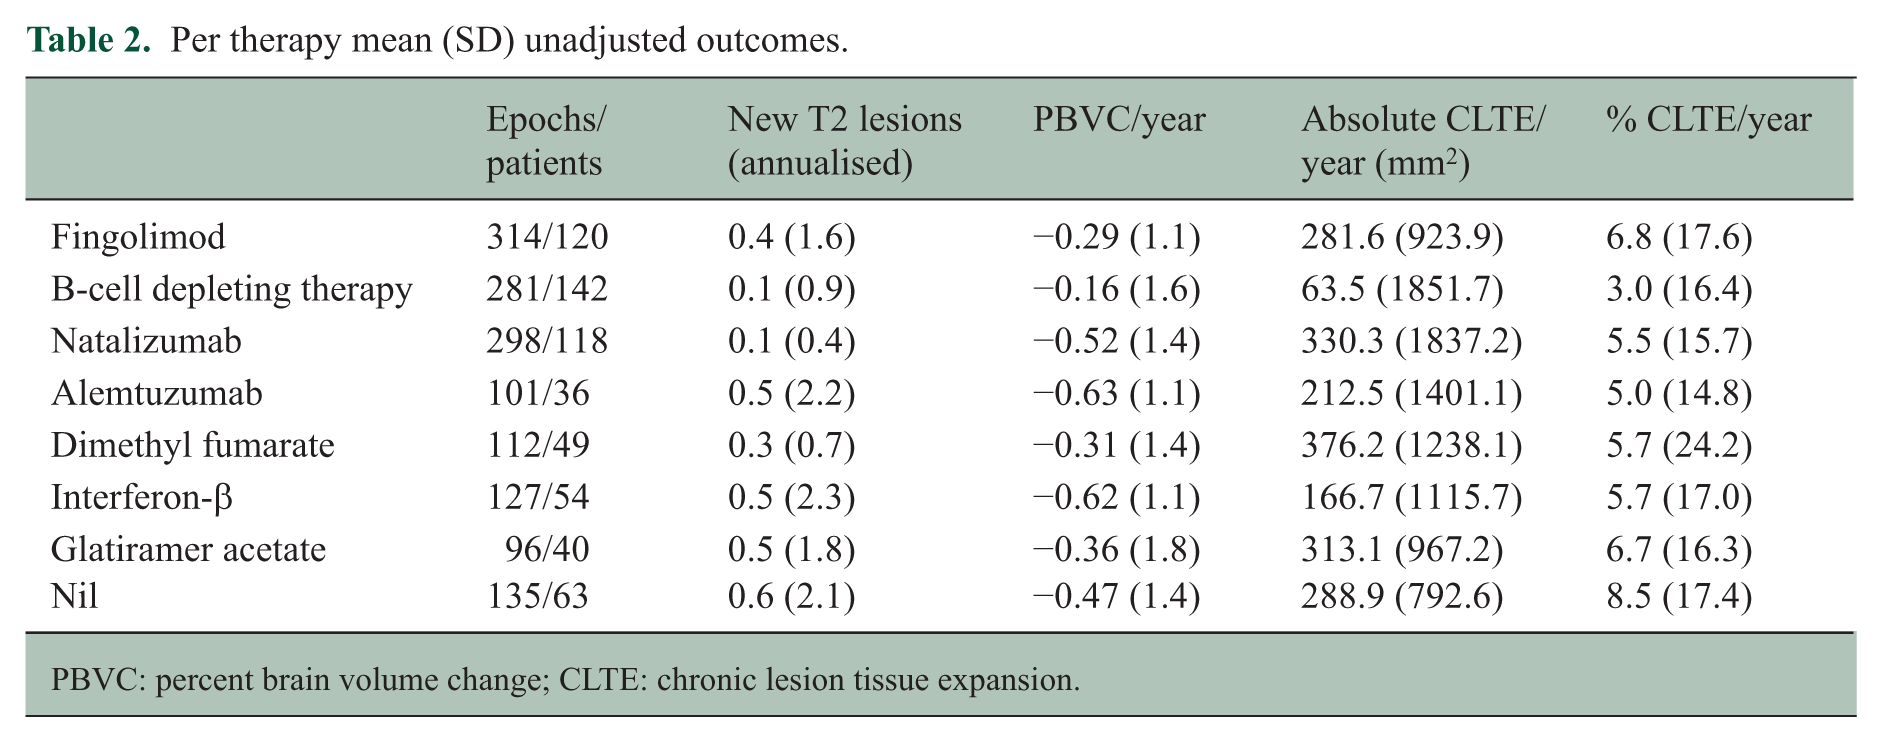
PBVC: percent brain volume change; CLTE: chronic lesion tissue expansion.
In the multivariable generalised model, B-cell depleting therapy was the only therapy associated with significantly lower CLTE (Figure 2), expressed as a percentage expansion of the baseline T2 lesion volume, than fingolimod (β = −4.03, SE = 1.69, p = 0.017), although the overall (omnibus) effect of treatment in the model was not significant (Wald χ² = 0.597, p = 0.44), indicating that treatment groups were not jointly associated with CLTE. The corresponding covariate-adjusted estimated marginal means indicated that B-cell therapy was associated with the lowest CLTE (~1% expansion per epoch), whereas fingolimod showed substantially higher expansion (~5% per epoch). Age (β = +0.21% CLTE per year; p < 0.001), baseline T2 lesion volume (β = −0.26% CLTE per mL; p < 0.001) and contributing centre (χ² = 39.09, p < 0.001) were also predictors of CLTE. Disease duration, baseline EDSS, prior treatment class, preceding annualised relapse rate (ARR), epoch length and PBVC in the epoch were not associated with CLTE.
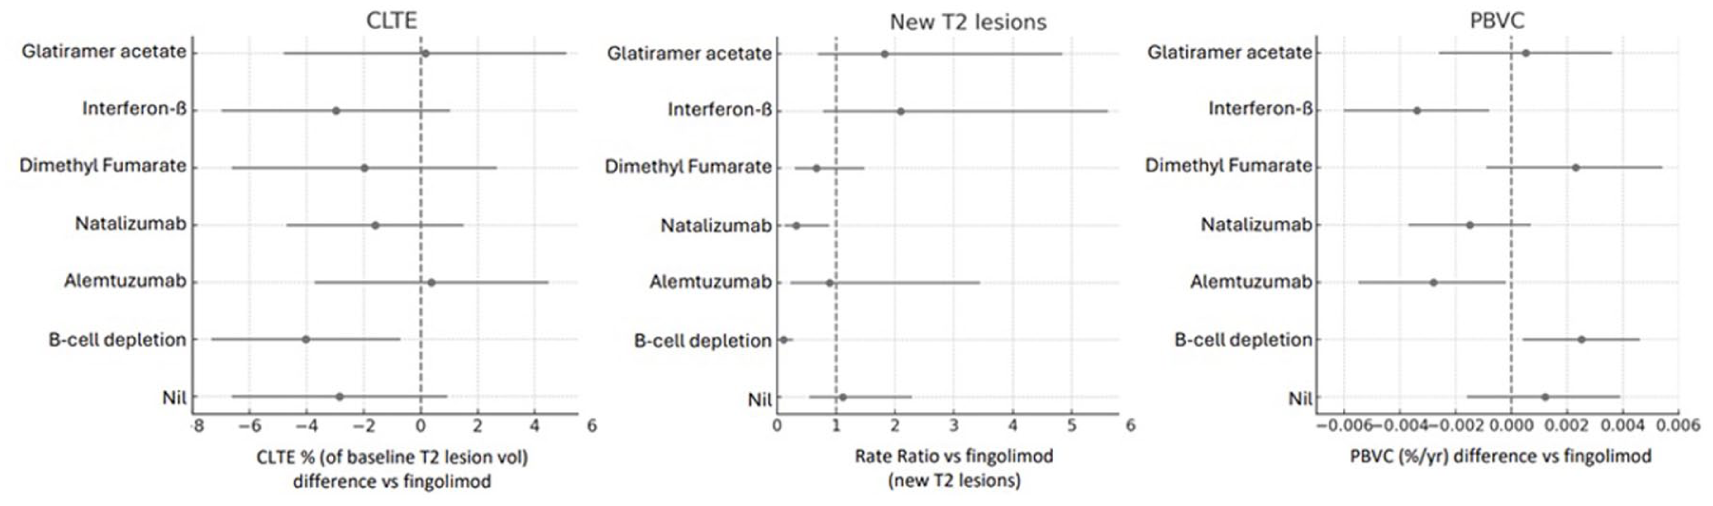
Forest plots showing main treatment outcomes (new T2 lesions, PBVC and CLTE) versus the reference therapy (fingolimod).
B-cell depleting therapy was also associated with a markedly lower accumulation of new T2 lesions (rate ratio (RR) 0.11, 95% CI 0.04–0.27, p < 0.001) relative to the reference (fingolimod), corresponding to adjusted mean rates of 0.02 versus 0.23 lesions/year (Figure 2). Natalizumab also showed a significantly lower rate of new T2 lesions (RR 0.33, 95% CI 0.12–0.88, p = 0.027; adjusted mean 0.08 lesions/year), whereas estimated rates on other therapies did not differ significantly from fingolimod. Older age (RR per year of age 0.96, 95% CI 0.94–0.99, p = 0.01) and longer duration on pre-epoch treatment (RR per year of prior treatment 0.82, 95% CI 0.72–0.93, p = 0.001) were independently associated with fewer new T2 lesions, and contributing centre had a modest but significant effect (p = 0.048). Disease duration, baseline EDSS, baseline lesion volume, preceding ARR, baseline brain volume, sex and prior treatment class were not significant predictors.
Annualised PBVC also differed significantly between treatment groups after adjustment for demographic, clinical and imaging covariates (Figure 2). Compared with fingolimod, only B-cell depleting therapy was associated with significantly less brain atrophy (β = +0.003, p = 0.020; mean difference + 0.25% per year). The duration of treatment prior to the epoch had a significant (β = +0.00042, p = 0.003) but numerically small association with PBVC, corresponding to a 0.04% PBVC/year for each year of prior therapy; and the contributing centre also had an impact (p < 0.001). Age, disease duration, baseline EDSS, baseline lesion volume, preceding ARR and baseline brain volume were not significant predictors.
Predictors of all outcomes in the GEE model, together with statistics, are included in Supplementary Table 1.
Discussion
In this multicentre cohort, we demonstrate that CLTE, a quantitative MRI metric reflecting slow, concentric growth of established T2 lesions, is measurably influenced by MS DMTs. Among the seven therapies evaluated, B-cell depleting therapy demonstrated the smallest growth of chronic lesion tissue and was the only treatment associated with a reduction in CLTE compared with fingolimod, underscoring heterogeneity in therapeutic impact on chronic lesion biology. B-cell depleting therapy was also associated with significantly less brain atrophy than fingolimod, in keeping with our prior work demonstrating that CLTE is a primary driver of central brain volume loss. 9 The impact of B-cell depletion on PBVC in our cohort (−0.16% per year vs −0.29% per year on fingolimod; adjusted difference + 0.25%/year, p = 0.020) appears more substantial than reported in pivotal trials of ocrelizumab in relapsing MS, 24 although differences in study populations, analysis methodologies and therapeutic comparator limit direct interpretability across studies.
Unsurprisingly, high-efficacy therapy with both B-cell depleting therapy and natalizumab markedly reduced the accumulation of new T2 lesions.
Our previous work has shown that radiological evidence of slow lesion expansion, as measured by CLTE, is associated with tissue destruction, accelerated central brain atrophy, choroid plexus enlargement and, most importantly, disability progression.7,9,25,26 However, there is scant literature on the impact of existing MS DMTs on this aspect of progressive MS biology. Together with analogous (albeit methodologically different) findings from clinical trials of ocrelizumab, the results here suggest the possibility that depletion of B cells, in particular those in perivascular and potentially meningeal compartments, can partially suppress the ‘smouldering’ inflammatory milieu that drives axonal transection and chronic demyelination at the rim of a proportion of chronic MS lesions.6,27,28 Compared to interferon-ß, B-cell depletion is also associated with modestly reduced composite PIRA in clinical trials of ocrelizumab in relapsing MS; 29 and insufficient B-cell depletion was a predictor of PIRA in a smaller cohort. 30 A preferential effect of B-cell depletion on CLTE is biologically plausible. In chronic active MS lesions, inflammation is ‘compartmentalised’ behind an intact or partially restored the blood–brain barrier (BBB) and consists of tissue-resident CD8+ T cells and CD20+ B-cells in perivascular and meningeal niches.31,32 Although anti-CD20 therapies have limited penetration across the BBB, peripheral B-cell depletion may indirectly influence intrathecal immune activity by reducing ongoing trafficking of B cells into the CNS and limiting replenishment of dynamic B-cell populations, 33 as well as altering antigen presentation and downstream T-cell–mediated inflammation. Consistent with data indicating that SELs and their severity follow a centrifugal, periventricular gradient, our group and others have postulated the existence of an MS-specific soluble/diffusable factor, potentially produced by intrathecal B cells, that induces tissue damage through microglia activation.32,34
By contrast, therapies that predominantly inhibit peripheral lymphocyte trafficking (fingolimod, natalizumab) or exert short-lived immune reconstitution (alemtuzumab) may have limited ability to modify chronic, intraparenchymal tissue changes. 16 However, alemtuzumab therapy is associated with depletion of memory B cells; 35 and we note the discrepancy between the effect of alemtuzumab on brain atrophy in our study and the robust, sustained impact on this metric seen in pivotal trials, likely reflecting both limited sample size (n = 38 patients) and the highly selected, treatment-refractory population receiving this therapy in real-world data sets. 36 The complex immune alterations induced by different DMTs may also have distinct effects on chronic lesion expansion that are not easily predicted by focusing on the effects of specific cell populations. Importantly, CLTE was independently associated with age and baseline T2 lesion volume, consistent with prior findings linking lesion expansion to accumulated tissue injury and, potentially, age-related epigenetic and metabolic changes in microglia that may exaggerate inflammatory responses in the rim of smouldering MS lesions.3,25,37
There were also significant centre effects on both PBVC and CLTE outcomes, highlighting the challenges posed by real-world scanner differences and protocol variability, which in turn affect the accuracy and robustness of automated lesion segmentation and volumetric assessment. MRI scans were also collected over an extended period between 2011 and 2023, during which time scanner hardware and software technology have significantly evolved. 38 Notably, PBVC was not independently associated with CLTE in this epoch-based analysis, potentially reflecting short-term interval modelling, multicentre imaging variability and prior observations that CLTE may relate more strongly to central rather than whole-brain atrophy. 9 While intra- and inter-site harmonisation of MS imaging protocols will facilitate more robust interrogation of treatment effects on chronic lesion dynamics, real-world clinical imaging is invariably noisy. However, we have seen a progressive shift to longitudinally stable, standardised 3D imaging protocols in most centres participating in MSBIR, particularly following integration of iQ-MS, which requires longitudinal parameter stability, into the platform. The use of MSBIR is a central strength of this study, enabling the acquisition of >1600 real-world treatment epochs across diverse centres and computation of complex measures such as CLTE at scale, opening new avenues for discovery in progressive MS biology. The substantial expansion of MSBIR since data extraction (2023) will greatly increase statistical power for future analyses.
The use of epoch-based modelling, which more faithfully reflects real-world treatment patterns and accommodates therapy switches, is another novel strength of the study. CLTE, a plausible marker of progressive MS biology, has been shown to exhibit a near-linear temporal trajectory within individuals in single centre studies; 9 and may therefore be well suited to an epoch-based analysis framework for studying the effects of DMTs on compartmentalised inflammation. However, in an adjusted GEE analysis (data not shown), we were unable to detect an effect of switch to B-cell therapy (based on within-patient short-term changes in CLTE slope) in our cohort after accounting for treatment lag (by excluding the first treatment epoch) and, to ensure reproducibility, requiring ⩾ 2 subsequent consecutive B-cell therapy epochs. In the small residual cohort of suitable epochs, CLTE variability was higher than expected, likely underpowering this analysis.
Our study has additional important limitations. Treatment allocation was retrospectively ascertained, non-randomised and subject to indication bias; although adjusted, residual confounding is likely. Several treatment groups remained relatively small, decreasing power for between-therapy comparisons. As discussed, centre effects were substantial for all three primary outcomes, reflecting heterogeneous MRI protocols and other technical factors across sites. Our CLTE pipeline also used fully automated AI-based lesion segmentation without manual QA. Finally, although CLTE is a meaningful measure of chronic lesion biology, we did not demonstrate an association with EDSS in this cohort.
From a translational perspective, CLTE and AI-based segmentation tools may help bridge the gap between research imaging biomarkers and routine clinical monitoring. Automated tools for the detection of conventional lesion activity, such as iQ-MS, have already been validated in clinical settings; 23 incorporation of CLTE quantification into software-based medical devices could support earlier recognition of progressive disease biology and inform treatment escalation or sequencing decisions. However, real-world implementation will require further multicentre validation against clinical outcomes, demonstration of longitudinal reproducibility at the individual-patient level, and integration into existing radiology workflows. This study provides the first large-scale, real-world evidence that CLTE, a biological marker of smouldering MS inflammation, is differentially modified by DMTs. Specifically, only B-cell depletion showed a statistically significant effect, complementing existing clinical trial data on SEL dynamics in patients treated with ocrelizumab, a therapy associated with a reduction in PIRA. Our study is nevertheless exploratory and should be viewed as proof-of-concept. With the continued expansion of MSBIR, the present analysis should be repeated with larger cohorts, propensity-weighted emulation trials and the inclusion of emerging therapies. Ultimately, CLTE may become a practical imaging surrogate for progressive MS biology in clinical trials and, potentially, in supporting treatment selection or sequencing in clinical practice.
Supplemental Material
sj-docx-1-msj-10.1177_13524585261459228 – Supplemental material for Impact of multiple sclerosis disease-modifying therapies on chronic lesion tissue expansion
Supplemental material, sj-docx-1-msj-10.1177_13524585261459228 for Impact of multiple sclerosis disease-modifying therapies on chronic lesion tissue expansion by Daniel Guilfoyle, Kayla Ward, Samuel Klistorner, Nathaniel Lizak, Heidi N Beadnall, Robert Zivadinov, Bianca Weinstock-Guttman, Izanne Roos, Helmut Butzkueven, Anneke van der Walt, Katherine Buzzard, Olga Skibina, Mike G Dwyer, Yael Barnett, Elaine Lui, Meng Law, Andy Shieh, Alexander Klistorner, Chenyu Wang, Tomas Kalincik and Michael Barnett in Multiple Sclerosis Journal
Footnotes
Declaration of Conflicting Interests
The authors declared the following potential conflicts of interest with respect to the research, authorship and/or publication of this article: D.G. received conference travel support and/or speaker honoraria from Alexion, Novartis and Roche. K.W. has served on scientific advisory boards for Sanofi and Argenx and has received conference travel support and/or speaker honoraria from Roche, Novartis and Merck. She has received institutional grant-funded support from Sanofi-Genzyme, Novartis, Merck, Roche and Alexion. S.K. has no disclosures to report. N.L. received conference travel support from Merck. H.B. is a member and Deputy Chair of the Research Management Committee of MS Australia. They have received honoraria for attendance at advisory boards and travel sponsorship from Biogen-Idec, Merck-Serono, Novartis, Sanofi-Genzyme and Roche. They have received speaker honoraria from Biogen-Idec, Merck-Serono, Novartis, Sanofi-Genzyme and Roche. They have been or are currently a primary investigator for clinical trials sponsored by Biogen-Idec, Novartis and Clene Nanomedicine. They have been or is a sub-investigator on research grants from Biogen-Idec, Bristol Myers Squibb, Merck-Serono, Novartis and Roche. R.Z. received personal compensation from Bristol Myers Squibb, EMD Serono, Sanofi and Biogen for speaking and consultant fees. He received financial support for research activities from Bristol Myers Squibb, Genentech, Neurogenesis and Protembis GmbH. B.W. has no disclosures to report. I.R. served on scientific advisory boards, received travel support and/or speaker honoraria from Roche, Novartis, Merck and Biogen. H.B. is an employee of Monash University and has accepted travel compensation from Merck. His institution receives honoraria for talks, steering committee activities and research grants from Roche, Merck, Biogen, Novartis and UCB Pharma, MRFF, NHMRC Australia, Trish MS Foundation, MS Australia and the Pennycook Foundation. He receives personal compensation for steering group activities for the Brain Health Initiative from the Oxford Health Policy Forum and is funded by a National Health and Medical Research Council (NHMRC) Australia Investigator Grant. A.v.d.W. served on advisory boards and received travel honoraria and unrestricted research grants from Novartis, Merck and Roche. She serves as the Chief Operating Officer of the MSBase Foundation (not for profit) and receives payment for this. Her primary research support is from the NHMRC of Australia and MS Research Australia. K.B. has received speaker’ s honoraria and/or education support from Biogen, Teva, Novartis, Genzyme-Sanofi, Roche, Merck, Argenx, UCB, CSL and Alexion, and has been a member of advisory boards for Merck, Alexion, Argenx, UCB and Biogen. O.S. received honoraria and consulting fees from Bayer Schering, Novartis, Merck, Biogen and Genzyme. M.G.D. received grant support from Novartis, Bristol Myers Squibb, Merck-Serono, Keystone Heart Ltd., Protembis GmbH and V-Wave Ltd., and consulting fees from Bristol Myers Squibb, Protembis GmbH and Keystone Heart Ltd. Y.B. is a consulting neuro-radiologist to Sydney Neuroimaging Analysis Centre and has received conference travel support and/or speaker honoraria from the Neuro-ophthalmology Society of Australasia and the Australian and New Zealand Association of Neurologists. E.L. has no disclosures to report. M.L. has no disclosures to report. A.S. is an employee of Sydney Neuroimaging Analysis Centre. A.K. has received research grants from MS Australia. C.W. is an employee of Sydney Neuroimaging Analysis Centre. T.K. served on scientific advisory boards or as a consultant for MS International Federation and World Health Organisation, Therapeutic Goods Administration, Sanofi, BMS, Roche, Janssen, Genzyme, Novartis, Merck and Biogen, received conference travel support and/or speaker honoraria from WebMD Global, Merck, Sandoz, Novartis, Biogen, Roche, Eisai, Genzyme, Teva and BioCSL and received research or educational event support from Biogen, Novartis, Genzyme, Roche, Celgene, Merck and Alexion. M.B. has served on scientific advisory boards for Sanofi, Roche, Novartis, Alexion and Biogen and has received conference travel support and/or speaker honoraria from Australian and New Zealand Association of Neurologists, World Congress of Neurology, Roche, Alexion and Merck. He has received institutional grant-funded support from the Medical Research Future Fund (Australian government), the NHMRC (Australian government), BMS, Novartis, Merck and Alexion. He is the honorary Chief Research Officer for Sydney Neuroimaging Analysis Centre.
Funding
The authors received no financial support for the research, authorship and/or publication of this article.
ORCID iDs
Data availability statement
MSBase is a data processor, warehousing data from individual principal investigators who agree to share their datasets on a project-by-project basis. Data access access to external parties can be granted at the sole discretion of each MSBase Principal Investigator (the data controllers), who will need to be approached individually for permission. To make a request for data access, please contact the corresponding author for instructions.
Supplemental material
Supplemental material for this article is available online.
References
Supplementary Material
Please find the following supplemental material available below.
For Open Access articles published under a Creative Commons License, all supplemental material carries the same license as the article it is associated with.
For non-Open Access articles published, all supplemental material carries a non-exclusive license, and permission requests for re-use of supplemental material or any part of supplemental material shall be sent directly to the copyright owner as specified in the copyright notice associated with the article.