






Abstract
The main objective of this article is to provide a comparative analysis of the impact of the components that determine positions on the left–right scale using data from the European Social Survey (ESS) which, in addition and in contrast to previous studies, includes the post-communist countries of Central and Eastern Europe. Our findings show the stronger effect of the partisan component vis-à-vis other factors, resulting in further proof of the main role that parties play in influencing voters’ positions on the left–right scale, as long as they constitute the main and most visible actors around which electoral competition develops. Moreover, there are significant variations among countries regarding the impact of the partisan component, principally stemming from the degree of ideological polarization in party systems.
Keywords
Introduction
Aside from analyses focused on the study of ideology as doctrine and early studies on attitudes, belief systems and values (most concerned with clarifying the degree to which individuals are ideologically consistent), the main studies of locations on the left–right scale have tended to take these positions as an expression of ideological leanings that include preferences on values, issues and parties. In addition, they see location on the left–right axis as one of the fundamental variables structuring party competition and explaining election outcomes in the vast majority of contemporary democracies.
Specifically, the psychosocial approach to voting behaviour established that ideological identification on the left–right scale anchors voting (Fleury and Lewis-Beck, 1993; Inglehart, 1979, Inglehart and Klingemann, 1976; Medina, 2010; Percheron and Jennings, 1981; Sani and Montero, 1986). Rational choice theory has suggested that ideology enables individuals to reduce the costs associated with having to learn about different policy proposals; thus, ideology becomes the centerpiece of competition between parties to win the support of voters (Downs, 1957; Hinich and Munger, 1994; Iversen, 1994; Listhaugh et al., 1994; Przeworski and Sprage, 1986; Rabinowitz and MacDonald, 1989; Sanders, 1999).
However, despite the large number of studies focusing on the left–right continuum, only a small number closely analyse the nature and characteristics of locations on the scale, attempting to identify the elements that explain and produce these positions. These analyses begin with the study by Inglehart and Klingemann (1976), who were the first to talk about the components which determine location on the scale: a partisan component comparable to party loyalties and an issue or ideological 1 component associated with positions on current issues of debate. The authors prove and conclude in this work that a partisan component outweighs the issues component. The formation of an ideological standpoint requires information, skills and motivation, and proximity to a party provides heuristics that simplify the assessment of what is happening in the political realm. This is precisely why the party element of the left–right dimension has a greater impact on left–right locations, up to the point that voters recognize and use ideological labels in connection with political parties, without knowing what this entails regarding to their own positions on the issues (Inglehart and Klingemann, 1976: 244).
After this first work, authors such as Klingemann himself (1979), and others such as Huber (1989), Knutsen (1995, 1997), Freire (2006a, b, 2008) and Medina (2004, 2010) have continued to look at the nature of left–right positions, presenting different findings related to the European electorate. In this sense, the Knutsen and Freire works, for instance, downplay the role of the partisan component defended by Inglehart and Klingemann, and stress the relevance of value orientations and social identities, respectively, as a symptom of the continued growth of New Politics.
Following these contributions, but above all Inglehart and Klingemann (1976), the main objective of this article is to provide a comparative analysis of the impact of the components which determine positions on the left–right scale using data from the European Social Survey (ESS), which in addition and in contrast to previous studies on the subject includes countries in Central and Eastern Europe that were part of the former socialist bloc. Thus, this article addresses the following question: Do ideological preferences based on values, beliefs or issues have greater weight than party loyalties or other factors related to the system of cleavages structuring partisan conflict in each country? Empirical evidence will show the greater importance of the partisan component, resulting in further proof of the main role that parties play in voters' positioning on the left–right scale.
The proximity to a party appears to be the most practical way to make the task of evaluating the events in the political arena and understanding the issues of debate easier and less time-consuming (Campbell et al., 1960; Shively, 1979). Moreover, and, as several studies have already highlighted, the structure of individuals’ value and belief systems is fundamentally emotional in nature and is the consequence of affect toward certain political groups charged with a strong symbolism (Conover and Feldman, 1981; Levitin and Miller, 1979; Sniderman, 1993; Sniderman and Tetlock, 1986; Sniderman et al., 1991). In other words, one way that voters meet their cognitive needs is through the feelings and bonds they build up with political groups, in particular, political parties, as long as they constitute the main and more visible actors around which electoral competition develops (Van der Brug et al., 2008: 590).
In addition, our findings also show that there are significant variations among countries regarding the impact of the partisan component on positions on the political spectrum. As will be seen, these differences are not due to the age of democratic regime, i.e. the distinction between established and consolidating democracies. In fact, they are related to the degree of ideological polarization of party systems, seeing that higher levels of polarization increase clarity and the differentiation between political alternatives (Freire, 2006a, 2008; Medina, 2010) and also foster the development of partisan ties (Berglund et al., 2005; Rico, 2010; Schmitt and Holmberg, 1995).
This article is divided into three sections. In the first, we analyse the distribution of voters’ positions on the left–right scale in each country and their evolution, comparing data from the first wave of the ESS in 2002–2003 with data from the fourth wave in 2008, in order to have a better understanding of our dependent variable. These distributions seem to have their origin in the dynamics that develop between voters and parties within each political system, being a first insight of the pre-eminence of the partisan component of the left–right scale. The second section explores the weight of each of the components considered as determinants of left–right voters’ positioning, at the same time that a new measure of the partisan component is proposed instead of ‘vote intention’ typically used in previous studies. While vote intention does not refer exactly to party attachments, the measure adopted here is based on voters’ partisan ties and captures the direction and intensity of the partisan component on the left–right scale.
After verifying both the pre-eminence of the partisan component and cross-national variations in this regard, a third section is devoted to analysis of the factors behind these differences. Concretely, we investigate whether the distinction between consolidating and established democracies has any influence on the magnitude of the effect of the partisan component, as long as this distinction may bring differences in terms of party supply institutionalization. However, empirical evidence will show this influence to be absent, at the same time that ideological polarization proved to be the main force promoting cross-national variations. Lastly, in a brief conclusion we summarize the most important findings of our comparative analysis of locations on the left–right scale in Europe.
Where do Europeans place themselves? Some preliminary evidence of the pre-eminence of the partisan component on the left–right scale
Before analysing which elements motivate locations on the scale, it is necessary to know how voters’ are distributed. Do Europeans tend to be in the centre, the left or the right on the continuum? Is it possible to distinguish groups of countries according to their ideological leanings? How did positions change between 2002–2003 and 2008? Are patterns of continuity dominant or were there significant changes? Which are the sources of change if this is the case?
Table 1 gives the mean scores of each of the countries of the ESS for each of the waves on a scale of 0 to 10, where 0 and 10 represent the most extreme left and right positions, respectively. Overall, scores are moderate: the average for all countries was 4.88 in 2002–2003 and 4.97 in 2008, revealing a slight but statistically significant turn to the right between 2002–2003 and 2008.
Average ideological positions in Europe, 2002–2003 and 2008.

aCountries are ranked according to the values of their ideological average in 2002–2003. There are no data for Austria and Italy in the ESS fourth wave.
The standard deviation is given in parentheses. The levels of statistical significance of the t-test are as follows: ***p < 0.001; **p ≤ 0.01; *p ≤ 0.05; †p ≤ 0.10.
Source: Based on data from the European Social Survey, 2002–2003 and 2008.
Regarding the countries with the most extreme scores, in 2002–2003 Greece had the ideological position furthest to the right (5.69), replaced by Poland in 2008 (5.75); while Spain had the scores furthest to the left in both waves of the ESS, with a 4.41 in the first wave and 4.55 in the second. A comparison of the ideological means for both waves allows us to see small but statistically significant changes from one period to the other, although we cannot say that there was a widespread shift in one direction or another. Thus, for example, the ideological mean for Greece, Portugal, Ireland, Denmark, the UK and The Netherlands shifted to the left, but in Poland, Hungary, Sweden, Spain, Finland and France to the right.
The series of graphs in Figure 1 shows the distributions of voters’ positions on the scale from 0 to 10 and grouped into three categories: left [0 to 4]; centre [5] and right [6 to 10]. The main feature that stands out in all these distributions is that their mode always falls in the centre: 5 on the continuum. This confirms the ideological moderation indicated by the mean scores. However, from 2003 to 2008 some noteworthy variations can be detected in certain countries. In Slovenia, Denmark and the Czech Republic, positions at 5 on the scale decreased by more than five percentage points, while in Hungary and Ireland the reverse occurred. In other words, in a small number of countries the centre decreased, while in others it increased.
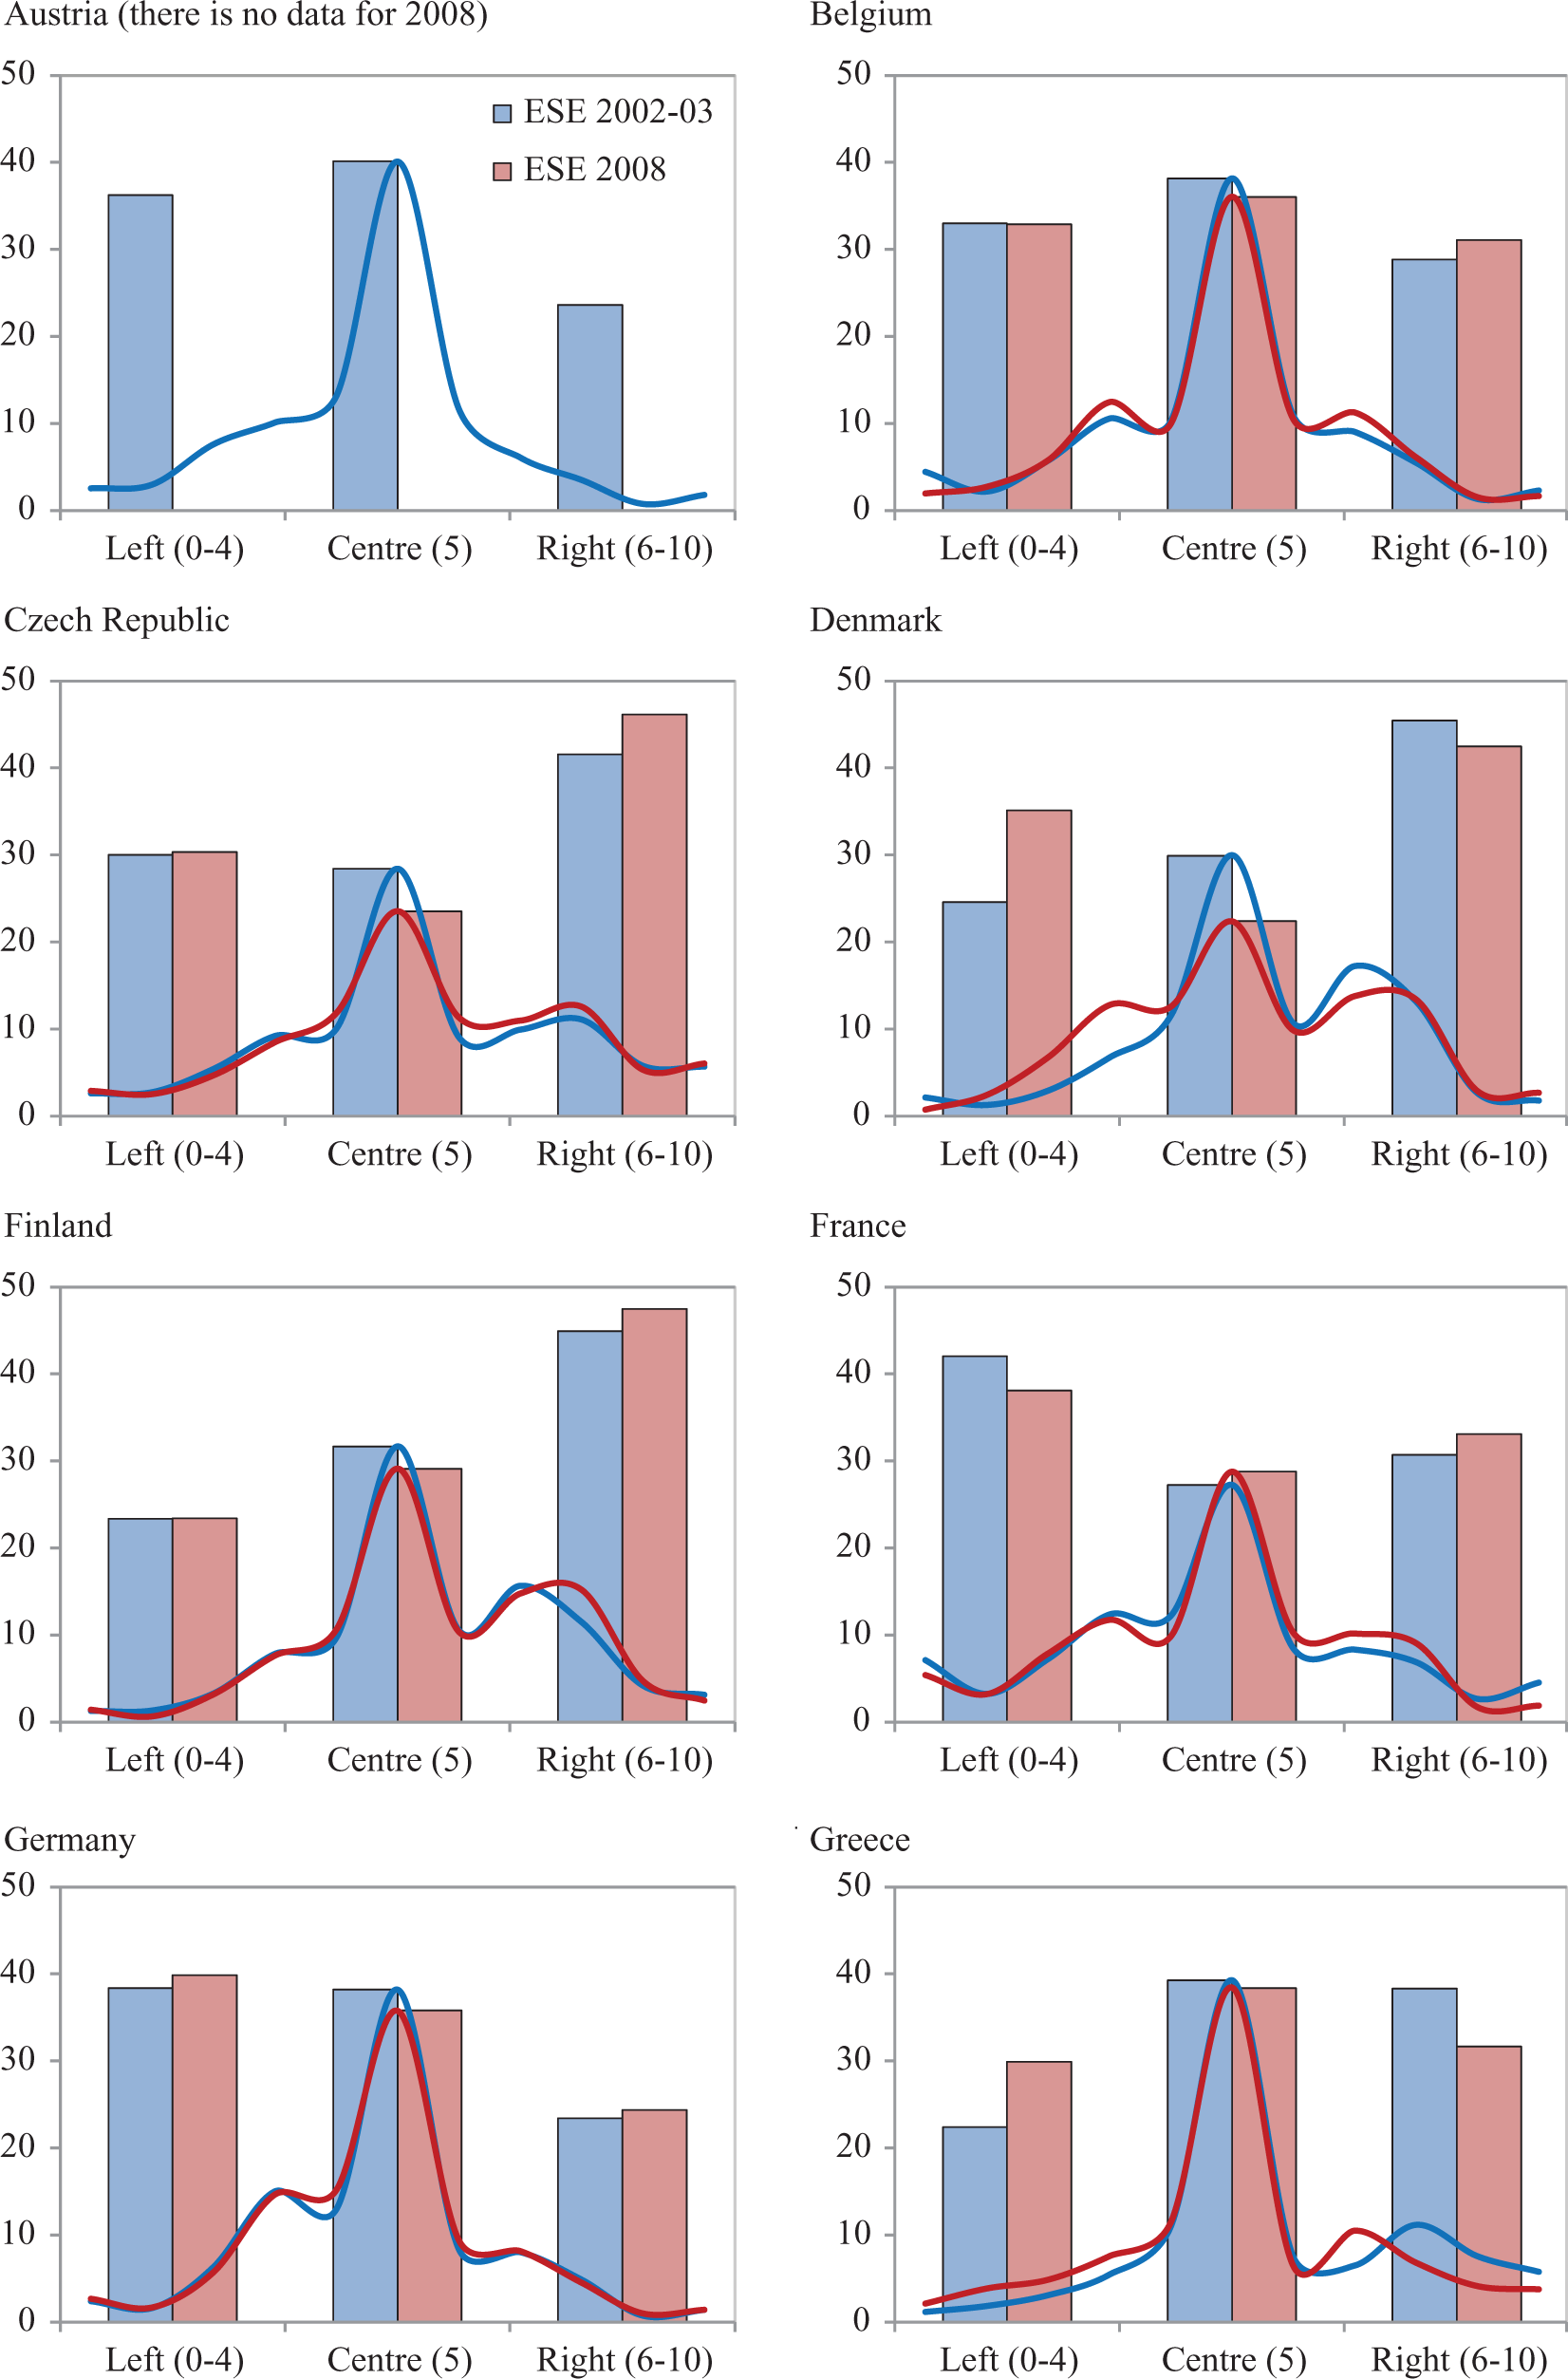
Distribution of ideological orientations on the left–right scale.
These changes not only affect the modal category but also extend to the comparison between the left and right segments. For example, positions on the left side of the scale declined by more than 12 percentage points in Hungary and Poland between 2002–2003 and 2008, and expanded between 6 and 11 points in Denmark, Portugal, Greece and Slovenia. Regarding the evolution of the right segment, what stands out between 2002–2003 and 2008 is its growth in Poland (15 points) and Hungary (7 points) and its decline in Ireland, Greece and Portugal (about 7 percentage points in these three countries).
Far from following any unequivocal pattern, all these changes in voters’ positions on the left–right scale appear to be the consequences of specific ideological adjustments between voters and parties, when the latter compete for the electoral support of the former.
In this regard and by way of illustration, the graphs in Figure 2 show the trend in ideological distribution for three countries for both of the ESS waves considered, adding to this the average position of the voters of the main parties in each system and the percentage of the vote received by each of them in the parliamentary elections prior to each wave of the survey.
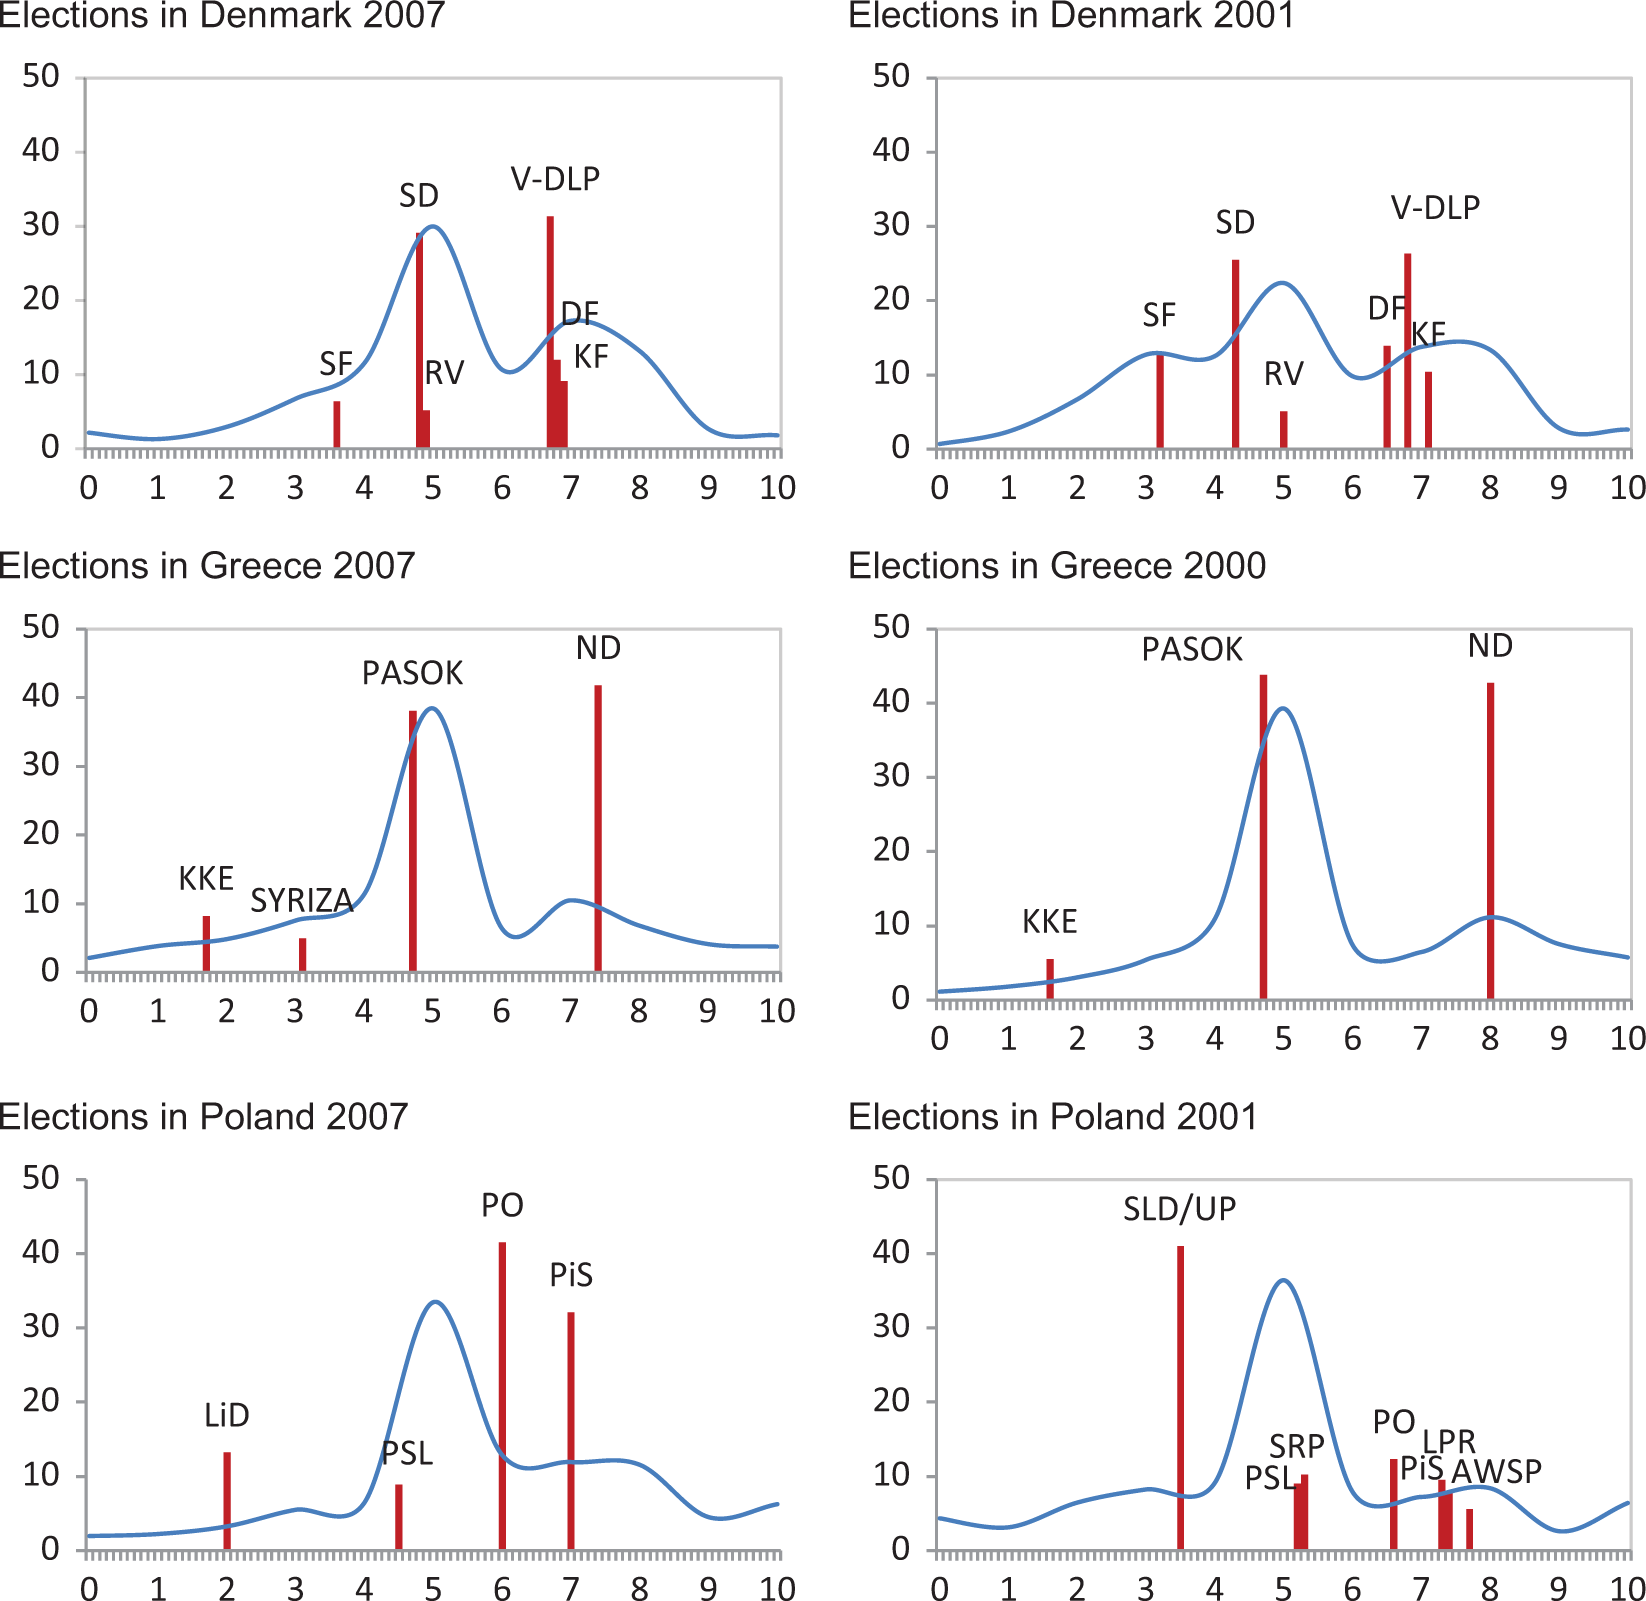
Voting trends and ideological orientation in Denmark, Greece and Poland.
These graphs show, for example, that Denmark’s move to the left was in large part related to the electoral growth of the Socialist People’s Party, which in the Danish parliamentary election of 2007 increased its vote by more than 7 percentage points with respect to the 2001 election. 2 This new left party with environmentalist tendencies managed to increase its presence in parliament to 23 seats, while the Liberal Party, although successfully defending its mandate, lost weight in the Danish Parliament after an election campaign in which the central issues were tax cuts vs. the need to maintain and improve the welfare state, pay and working conditions of public sector employees and energy, environmental and immigration policies (Bille, 2008).
Similarly, Greek voters’ shift to the left took place within the context of the electoral growth of the Communist Party of Greece and the Coalition of the Radical Left. 3 Indeed, this new formation was the big surprise in the 2007 Greek parliamentary election, their managing to attain 14 seats, in part, capitalizing on the votes lost by the socialists (PASOK). This growth in left-wing forces that had never formed part of the government and of other minority right-wing parties, such as the Popular Orthodox Rally, 4 was brought on by the growing alienation of voters from the two major parties (PASOK and New Democracy), which resulted in both losing votes in the 2007 election (Mavrogordatos, 2008).
Finally, the advance of positions on the right in Poland reflects voters’ accommodation to a restructuring party system. 5 This reorganization was forged between the elections of 2001 and 2005, and was based on overcoming the division between the successors of the former Communist Party and the Solidarity trade union movement (Millard, 2006) to make way for a new, less fragmented, system 6 in which the main formations were positioned on the right: the conservative Law and Justice party and the Christian democrat Civic Platform.
To sum up, all these examples seem to support the hypothesis of the relevance of the political supply in voters’ positioning on the left–right scale. Whether to reduce cognitive dissonance or due to the occurrence of projection or persuasion processes, the fact is that voters adjust their ideological positions and those of political parties in accordance with their voting behaviour, this being first evidence, albeit indirect, of partisan component significance.
Social structure, parties or ideological preferences? Accounting for left–right positions
This section analyses the impact of different factors on locations on the left–right scale. Are voters’ positioning primarily based on their values, their positions on the issues that are at that moment subject to political debate or their ties to a particular political party? Or, on the contrary, do their positions on the scale have more to do with characteristics directly related to their place in the social structure? In other words, what is more important in determining positions on the scale: values and issues, party loyalties, or other factors related to the system of cleavages that structure partisan conflict in each society?
The effect of each of these factors on positions on the scale is subject to empirical analysis, and results may vary on an individual level, by country and over time. However, as has also been pointed out, voters want to make minimum effort to gather, organize and understand the political information in their environment, and these cognitive needs and limitations contribute to the predominance of the partisan component over other factors.
To examine these questions, a least squares regression model has been used, where the dependent variable is respondents’ position on the left–right scale. The independent variables refer to different elements of class and religious cleavage, 7 and they have been introduced in blocks to verify the percentage of variance explained by each of them separately.
The variables related to the cleavages have been collected and arranged while bearing in mind the distinction made by Bartolini and Mair (1990: 215) between three dimensions that underlie any fracture of this type: the empirical, the organizational/behavioural and the normative. The empirical dimension consists of specific conflicts with socio-structural roots that serve as the objective basis of these divisions (e.g. belonging to a social class). The organizational and behavioural dimension is the result of interactions among individuals, institutions and organizations, such as parties, which develop as part of the cleavage (e.g. belonging to a trade union). And the normative dimension reflects the awareness of the social groups involved; therefore, it represents the social and political identities formed in response to the conflict that articulates the cleavages and is composed of the beliefs and values that provide a sense of identity and a role to the objective element (e.g. to feel close to a social class or a political party).
The first block is formed by the set of indicators that captures the objective dimension and some aspects of the organizational/behavioural dimension of both cleavages. They measure the first dimension (social class 8 and the frequency of attendance at religious services) and part of the second dimension (the degree of involvement in unions and religious organizations).
The second block includes the ideological component and consists of a set of variables that refers to respondents’ opinions on a series of issues which also contains values. First, there are variables that refer to their positions on the role of the state in the economy and in the redistribution of income, as both issues reveal preferences regarding policies linked to the class cleavage. Secondly, there are variables that refer to the degree of importance of religion in the life of the respondents and their opinions on the ways in which homosexuals and lesbians should act, given the character of this issue as a moral question that concerns the religious cleavage.
Lastly, the third block measures the partisan component of locations and groups together with several variables that have been constructed by assigning the partisan ties of the respondents to the family of parties to which they belong, distinguishing in this way among the following partisan components: liberal, conservative, socialist or social democrat, communist, Christian democrat, agrarian or centre, new left and extreme right. 9 These components are based on differences between the ideological families of parties defined by von Beyme (1986) and further developed by Lewis (2000) for the countries that were previously part of the Communist bloc; to these have been added the new left family of parties that Kitschelt (1994), Müller-Rommel and Poguntke (1995) and others have analysed.
The results of the estimation of the model for each of the countries are given in Table 2. 10 Examination of the regression coefficients and the adjusted R-square – which, in contrast to the regular R-square, takes the size of the sample and the number of predictors into consideration – permits us to draw a series of important conclusions. First, the goodness-of-fit of the model for each country constitutes a fairly wide range of values, where the highest adjusted R-square corresponds to Greece (0.61) and the lowest to Ireland (0.09). In other words, there are countries for which the model explains their locations fairly well (with adjusted R-square above 0.40), and others where this level is slightly too low (adjusted R-square below 0.20).
Locations on the left–right scale (regression coefficients)


n.a.: These variables are not available for the countries referred to. The boxes in grey indicate that there are no relevant partisan components for these ideological families for those countries.
Standard errors are given in parentheses. The levels of statistical significance are the following: ***p < 0.001; **p ≤ 0.01; *p ≤ 0.05; †p ≤ 0.10.
Source: European Social Survey, 2002-03.
The countries where the model works best are those of Southern Europe, particularly the recent democracies of Greece, Portugal and Spain. Among the countries with poor goodness-of-fit are Ireland, Belgium and the United Kingdom. However, the low values recorded are not surprising given certain considerations discussed below.
First of all, in Ireland, the low goodness-of-fit of the model is a result of the peculiarities of its party system. The appearance and consolidation of this system were structured around the conflict regarding the constitutional status of the country and its relationship with the United Kingdom (Mair, 1993); as a result, it would be difficult to apply the left–right terminology to these issues and to the parties that defend each of the contending options (Fianna Fáil and Fianna Gael). In the case of Belgium, the goodness-of-fit of the model is modest, due to the characteristics of its party system, fundamentally structured by the division which separates Walloons and Flemish, and where the left–right distinction is only relevant within the subsystem of parties in each community. The weakness of the model for the United Kingdom is due to the much greater importance of the division between Labourites and conservatives than the left–right division, as voters identify much more with the former labels than with the latter (Inglehart, 1979; Inglehart and Klingemann, 1976; Percheron and Jennings, 1981).
Secondly, in almost all of the countries, the coefficients corresponding to the partisan component have significant levels with confidence intervals of 99.9 percent. Moreover, the numerical order of the coefficients of the partisan components is an exact copy in almost all cases of the ideological order of the parties on the left–right scale in each country. In other words, if we order the coefficients from lowest to highest for each country and we compare each of the resulting orders with the order of the parties on the scale – the latter measured by the mean ideological scores of their voters (data not reproduced due to space) – the two orders are found to coincide, with a few exceptions (Belgium, Denmark, France, The Netherlands and Switzerland). In short, not only is the partisan component the main explanation of locations, but its effect makes the scale a true reflection of the structure of party competition and of the configuration of party systems in each country.
Thirdly, although the variables that reflect the ideological component present regression coefficients with levels of significance that do not always have the widest possible confidence intervals, their effect is far from small, indicating the importance of values and issues of debate on positioning on the scale, particularly those related to equality. Thus, in 16 of the 20 countries, opinions about whether or not governments should reduce differences in income levels have an effect on locations; those who agree with government reducing income inequality tending to be located on the left of the continuum and those who disagree on the right (10 of these 16 coefficients are significant at a confidence level of 99.9 percent). This supports the argument made by Bobbio (1998) that the element best defining the left and the right is attitude toward the ideal of equality.
In contrast, views on the desirable degree of intervention by governments in the economy show coefficients with significance levels that are more modest or even not significant. The question of government intervention in the economy seems to have increasingly less influence on positioning, highlighting the historical and contingent nature of the content of left–right labels. In the recent past the issue appeared as one of direct opposition between the parties of left and right; whereas now the complex mix of interventionism and economic liberalism in the economic policies of the majority of countries has blurred the conflict around positions previously expressed in a simple antithetical form.
Another important factor regarding the effect of the ideological component on positions on the left–right scale is the significance level of the regression coefficients of the variables related to the religious cleavage. These coefficients have values that reveal the role of religion in the lives of those interviewed, highlighting the relevance of this cleavage in most European countries today, even those that were assumed to be deeply secular because of the communist experience under the former USSR. Thus, the coefficients recorded for this indicator in Slovenia, Hungary and Poland confirm the importance of the religious cleavage as one of the axes structuring partisan conflict in these countries (Evans and Whitefield, 2000).
Fourth, the objective dimension of the cleavages plays a rarely significant role in locations on the left–right scale. Specifically, the effect of frequency of attendance at religious services on positioning is restricted to nine countries, almost all of them with a majority Catholic population, and where the most frequent church-goers are usually found on the right of the continuum and the least frequent to the left. The effect of social class is also limited to a few cases. Furthermore, its effect (and the direction of its influence) varies and depends on the characteristics of the social groups involved and their political leanings. However, the pattern that tends to dominate in regard to the influence of social class on locations, and as would be expected, is that the proprietors (self-employed with and without employees, farmers and smallholders) tend to be situated to the right of unskilled manual workers. This occurs for all countries where the owning class has a significant effect on locations, except in Austria, where the owners are usually located to the left of unskilled manual workers. However, the Austrian case can largely be explained by the tendency of many unskilled manual workers to give their vote to the extreme right party, the Freedom Party of Austria (Partei Freiheitliche Österreichs): 16 percent of workers in this category reported having voted for this party in the previous general elections, this percentage being six points higher than the total percentage of unskilled manual workers in the Austrian subsample (10 percent).
Finally, while the variables related to the objective dimension of cleavages exhibited a rather weak influence on locations, the variables related to the organizational/behavioural dimension do not compensate for this situation. In fact, the significance of the coefficients for involvement in unions is limited to seven countries, with those involved tending to be more to the left on the scale, and those not involved on the right. In addition, the effect of involvement in religious associations is even more restricted, reduced to four countries and almost always associated with locations on the right side of the ideological spectrum.
Table 3 shows the percentages related to the variance explained by each block of variables in the regression (R-squared change), and the percentage of the total variance explained by the model for each country. The percentage of explained variance for the partisan component is always much higher than for the other two groups of variables, and particularly high in Greece, Portugal, Hungary, the Czech Republic, Italy and Sweden (from 52 percent to 30 percent). 11
Percentage of variance explained for locations on the scale for each of the components.

The countries are ranked based on the magnitude of the variance explained by the partisan component.
The value of the F-test for R-squared change is given in parentheses. The levels of statistical significance for the F-test are the following: ***p < 0.01; **p < 0.05.
Source: Based on the European Social Survey, 2002–2003.
This finding confirms the greater influence of the partisan component on the left–right scale and is consistent with the way that voters’ meet their cognitive needs and on which political affect plays an important role. In fact, all these particularities turn the left–right scale into a useful tool that allows predicting, to some extent, party competition patterns and electoral choice.
Ideological polarization and the degree of consolidation of party supply: A look at some contextual factors that may affect the partisan component
Despite the predominance of the partisan component, however, empirical evidence also indicates the existence of significant differences in the level of variance explained by this component in each of the countries considered. To what are these variations due? Why is the partisan component more important in some countries than in others in explaining the variance in locations on the left–right scale?
One possible hypothesis brings attention to differences in the degree of consolidation of party supply, especially weak in consolidating democracies such as those of Central and Eastern European countries. In this sense, Mainwaring and Torcal (2005) assert the party systems of these countries to be less institutionalized as long as they display higher electoral volatility, weaker party roots in society, and discontinuities in party organizations. Taking this into account, the effect of the partisan component on voters’ positioning on the left–right scale should be greater in established democracies and less in those not consolidated.
However, an alternative hypothesis points to the degree of ideological polarization of party systems as one of the main factors enhancing the effect of the partisan component. This enhancement would be produced through two different mechanisms which tend to overlap. First, greater polarization promotes greater clarity and differentiation of the political forces competing for votes (Freire, 2006a, 2008; Medina, 2010), hence facilitating cognition and, therefore, voters’ self-location and the location they attribute to the parties on the left–right continuum.
Secondly, the accentuation of ideological differences also intensifies sympathies and animosity toward the parties in competition (Berglund et al., 2005; Rico, 2010; Schmitt and Holmberg, 1995), thus benefiting voter cognition, but this time through political affect and aversion (Sniderman, 1993; Sniderman and Tetlock, 1986; Sniderman et al., 1991).
In order to test these two competing hypothesis, a least squares regression model has been specified, where the dependent variable is the percentage of variance of locations explained by the partisan component in each country. The independent variables include both a measure of the age of democracy 12 and the degree of polarizations of party systems. 13
Without doubt, the regression coefficients show how the degree of ideological polarization affects the partisan component, whereas the experience of years with uninterrupted democracy does not produce any influence. This is to say, it appears that being in a consolidating democracy does not hinder party attachment exerting a great effect on voters’ positioning on the left–right scale. In spite of a lesser institutionalization of their party systems, weaker party roots in society, and discontinuities in party organizations, the partisan component in those countries is likewise capable of dictating left–right locations.
In any case, ideological polarization emerges as the main contextual factor that plays a leading part on the partisan component weight, and as a consequence on the voters’ positioning, this influence being explained by the way individuals fill their cognitive needs. Furthermore, this finding adds to other evidence proving that the effects of the age of democracy on left–right positioning disappear when other contextual variables are taken into account (Freire, 2006c; Freire et al., 2009).
Conclusions
Following the line of research initiated by Inglehart and Klingemann (1976) along with data from the ESS, we have examined the distribution of locations on the left–right scale in 20 European countries comparatively and over time and the factors that influence their place on the continuum.
Indeed, one of the main elements of interest in this analysis is its comparative scope, as apart from the Western democracies traditionally studied we have included several countries that formed a part of the prior socialist bloc. The difference in the historical trajectories of these countries in comparison with the other European democracies we have looked at leads us to ask if there are also differences in the importance and behaviour of the components of location on the left–right scale related to these differences.
After noting the predominance of moderation and centrism among European electorates in general, and after examining the similarities and differences in the magnitude of left and right orientations across countries and over time, the analysis of the impact of different components on locations has revealed that the partisan component is of greater importance than the other factors examined in explaining positions on the left–right scale. This is also verified in the case of the ex-communist democracies, confirming the value of the left–right scale as an instrument reflecting partisan competition and electoral choice.
The predominance of the partisan component is partly a result of the need for voters to minimize the time and effort (costs) required to process information and reach conclusions regarding the different political options in the complex world of politics. In this context, proximity to a specific political force is the most accessible and convenient way to reduce these costs, to the extent that the ideological image these forces project and the messages they convey (political cues) act as heuristics (Lau and Redlawsk, 2001; Lodge and Hamill, 1986; Rahn, 1993) that aid in making choices, among them, location on the left–right scale.
In other words, voters place themselves on the scale based on the position that best defines them ideologically, but above all taking into consideration the location of their preferred party (or parties) and other political forces. Proximity to a party and perceived distances from other political formations helps create an image of the structure of competition within the party system; therefore, locations on the left–right scale are to a great extent dictated by the partisan component.
The tendency of voters to locate themselves and make political decisions based on party positions is naturally reinforced by the sometimes highly emotional nature of individuals’ political opinions and preferences, to the extent that they are shaped by affect and aversion toward political groups charged with symbolism, most notably political parties.
Finally, we have shown that variations among countries with respect to the impact of the partisan component do not fit the distinction between established and consolidating democracies. In fact, they reflect the degree of polarization of each country’s party system. When ideological contrasts in the political supply are more pronounced, this activates the heuristic potential of the partisan component, increasing its impact on locations on the left–right scale. First, greater polarization promotes greater clarity and differentiation of the political forces competing for the votes of the electors, facilitating voter cognition in the process and, therefore, voters’ self-location and the location they attribute to the parties on the left–right continuum. And, secondly, the accentuation of ideological differences intensifies sympathies and animosity toward the parties in competition, thus benefiting voter cognition, but this time through political affect and aversion. In conclusion, locations on the left–right scale are mainly explained by the partisan ties of voters, and greater polarization of the party system increases the impact of the partisan component on location.
However, it has to be kept in mind that the way in which we have analysed the relationship between the partisan component and locations on the ideological continuum suffers from an endogeneity problem. Ties to a political party are not independent of an individual’s location on the scale; as a result, it is difficult to differentiate the impact of each. In other words, it is difficult to know which comes first: do individuals occupy a specific location on the left–right scale because of partisan ties, or do they feel specific partisan ties because of where they locate themselves on the scale? Individuals’ identification with a specific place on the left–right scale reflects a convergence of self-location and perceptions of the location of preferred parties.
Ideological polarization, age of democracy and the relevance of the partisan component (regression coefficients)

Standard errors are given in parentheses. The levels of statistical significance are the following: ***p < 0.001.
Source: European Social Survey, 2002–2003.
Giacomo Sani emphasized this very circumstance: the acquisition of political preferences and identification with a location on the ideological continuum occur almost simultaneously and are based on the connections established with leading parties within a specific political cultural environment (Sani, 1974: 207). As far as we know, this reciprocal linkage has been addressed satisfactorily by a specific design of research regarding both the French and the Portuguese cases (Belanger et al., 2006; Lewis-Beck and Costa Lobo, 2009), but more research is needed if we are to disentangle the causal channel of this relationship.
Footnotes
Acknowledgement
I gratefully acknowledge extremely useful comments on earlier drafts of this article from two anonymous reviewers and Miguel Caínzos.
Funding
This research received no specific grant from any funding agency in the public, commercial or not-for-profit sectors.