
Abstract
In this manuscript, we examine the impact of voting for the winning candidate on satisfaction with democracy. While extensive evidence exists documenting this relationship, it is almost entirely correlational in nature. We take advantage of survey timing during the 2000 post-election period in the U.S. when the vast majority of respondents were uncertain about who would win the presidency. Employing 2000–2002 panel data and using a difference-in-differences model, we are able to establish a relationship between electoral outcome and satisfaction with democracy that appears only for respondents interviewed once the outcome became official. We find an increase in satisfaction among winners and a parallel decrease among losers from 2000 to 2002. Importantly, our design allows us to go further than most studies to make causal claims.
While scholars have long been interested in the sources of systemic support, this research has taken on increased urgency as electoral democracies in the Western world have entered a zone of turbulence. Recent developments such as the rise of populist leaders bode ill for the future of both the liberal and electoral components of even older democracies (Levitsky and Ziblatt 2018; McCoy et al., 2018; Albright 2019; Svolik 2019). Here, we look at a different threat to democratic stability in the form of the mass-level fluctuations in support for democracy following electoral outcomes. An enduring focus in the literature on regime support has been to appraise democracy’s resilience by looking at how widespread satisfaction with the national democratic model is. In a foundational piece, Easton starts from the premise that “not all expressions of unfavorable orientations have the same degree of gravity for a political system. Some may be consistent with its maintenance, others may lead to fundamental change” (Easton 1975, 437). He contends that diffuse support—support for what the regime represents—and specific support—satisfaction with what powerholders within the regime actually do—are interrelated but not interdependent (Easton 1975, 439–444). When the former retains a degree of independence from the latter, this indicates that the regime has some intrinsic value.
In this manuscript, we take a look at that question taking advantage of the peculiar nature of the 2000 presidential election in the United States in that it was not immediately clear which presidential candidate won. While the winner is often declared shortly after the polls close, in this case, Al Gore did not concede until 5 weeks following the election. The timing of the measurements from the panel study provides a natural manipulation of outcome uncertainty as the post-election survey in 2000 was fielded when the winner had yet to be declared for most of the respondents. This allows us to pin down whether the winner-loser gap immediately sets in even when both sides still stake a claim at victory. Moreover, while panel data exist that include a pre-election wave, the data employed here are unique because of the presence of post-election uncertainty. Additionally, a portion of respondents were re-interviewed in 2002. We thus have two periods: a “pre-treatment” period (when the winner was uncertain) and “post-treatment” period (when the winner was known) and are accordingly able to estimate a difference-in-differences model. In that regard, our results further bolster both existing correlational results as well as panel data with pre- and post-election waves.
We find an increase in satisfaction among winners and a parallel decrease among losers from 2000 to 2002. More importantly, our design allows us to go further than most studies to make causal claims. Our results comport with a long line of correlational literature in this respect. We test the robustness of the winner-loser gap explanation, and our main result is robust to several different empirical strategies. This allows us to establish that the electoral perceptual screen has a significant and durable influence on one of the conventional measures of diffuse support. In what follows, we briefly review existing works revolving around the winner-loser gap. We then discuss the unique nature of the data as well as the methods used in the analysis before presenting our results, including a series of robustness checks. We conclude with a discussion of the implications of our findings for democratic resilience in light of the 2020 election. The attempts at casting doubt on the electoral outcome that culminated in the Capitol insurrection in January 2021 are rather unique, but we can anticipate that the propensity to contest results is on the rise.
Background
Academic interest in the steadiness of democratic support in the face of defeat has spiked since the turn of the millennium because indicators of trust in government have hit a nadir in the U.S. (Norris 2011; Citrin and Stoker 2018). Democracy, even in consolidated regimes, suffers from a retreat of social capital (Putnam 2000) and/or evolving expectations and values in the public that governing bodies failed to satisfy (Inglehart and Welzel 2005). A related sign in democratic fatigue has been a rise in distrust for the political class, its institutions (Hibbing and Theiss-Morse 1995) and the process of politics in general (Hibbing and Theiss-Morse 2001, 2002). Downward trends in support for specific actors, institutions, and processes have continued unabated especially in the U.S. (Citrin and Stoker 2018) to the point where diffuse support seems more sensitive to the erosion of specific support. The looming risks of democratic fatigue (Foa et al., 2016) or semantic alterations to the meaning of democracy (Alexander and Christian, 2017; Kirsch and Welzel, 2019; Urbinati, 2019; Wuttke et al., 2022) in regimes around the world call for particular attention to the maneuvers of losing partisans and their propensity to remain satisfied with democracy in the abstract. Indeed, the abstract support for the term “democracy” has been reassessed as potentially hollower than it seems when taken at face value (Kirsch and Welzel 2019; Graham and Svolik 2020), thus highlighting the importance of understanding such support.
Satisfaction with democracy is particularly relevant for the subset of citizens who find themselves in the opposition to the powerholders. As Riker (1983, 62) explains, in the aftermath of elections, “losers have nothing and gain nothing unless they continue to try to bring about new political situations.” Their willingness to continue the political fight under the same set of rules and their faith that the next electoral cycle will give their side an opportunity to redeem itself play a key role in sustaining the democratic regime. A losing side expressing high satisfaction with democracy and its institutions after an election is thus a good sign of attachment to a regime that does not always go their way (Gibson et al., 2003; Anderson et al., 2005, 22). This is particularly important in regimes with winner-takes-all electoral rules and in regimes with small winning coalitions because the size of the losing population is greater (Bueno de Mesquita and Smith, 2011). Indeed, democratic structures that give winners more absolute mandates following their victories compound the winner-loser satisfaction gap (Anderson and Guillory 1997; although see Han and Chang 2016). Two-party systems also remove the possibility of attenuating the satisfaction gap for two reasons. First, they compel voters to go all-in on their favored candidates, whereas multiparty systems can entail suboptimal voting choices and consolation for losers who see their preferred parties take part in governing coalitions (Singh 2014). Second, they limit the possibilities of genuine policy congruence (Miller and Ola 1990).
For these reasons, the U.S. is a useful country to examine. It has been established that winner/loser status influences attitudes toward and support for the system in the United States. Scholars have found that one’s status as a winner or loser moderates the effect of political corruption on one’s support for incumbent administrations, including in the U.S. (Anderson and Tverdova 2003). This perceptual gap between winners and losers expands to more diffuse measures of support such as satisfaction with democracy and its procedures. Even though these measures do not tap directly into attitudes toward what democracy represents, they go beyond the context set by the current specific actors. The winner-loser gap result consistently holds across elections over time in the U.S. (Anderson and LoTempio 2002; Craig et al., 2006; Howell and Justwan 2013; Hollander 2014) although the effect seems limited to presidential elections (Anderson and LoTempio 2002). Indeed, presidential contests generate increased participation and affective involvement than other types of elections particularly in this polarized era (Valentino et al., 2011; Huddy et al., 2015).
Although, in a sense, the winner-loser gap is primarily a micro-phenomenon that affects both sides of political spectrums in different electoral cycles (Banducci and Karp 2003), it has far-reaching temporary—and possibly more enduring—consequences in democratic regimes. In a cross-national extension, Toshkov and Mazepus (2020) find that the effects of the gap go beyond mere political support and include general attitudes such as life satisfaction and feelings such as happiness and optimism about the future. The mechanisms undergirding this satisfaction gap include instrumental motives such as policy congruence (Curini et al., 2012; Ferland 2020; Gärtner et al., 2020), affective ones such as the emotional benefits of victory (Thaler 1994; Anderson et al., 2005), or psychological ones such as the need to avoid cognitive dissonance that follows the undesirable outcome emerging from the election (Singh 2014). This can lead to attitude changes that leads individuals to find more common points between the losing candidates they favored and the eventual winner (Craig et al., 2006). Alternatively, losers can find solace in positions that divert blame away from the shortcomings of their preferred candidates onto alleged systemic flaws in the democratic process. This has been particularly evident in 2020 (Laughlin and Shelburne 2021). In so doing, losers cushion the blow of having bet on the wrong horse.
However, the existing literature only provides partial answers to two issues that we seek to address further in this analysis. First, most studies mentioned above adduce correlational evidence—although see Nemčok (2020) who takes advantage of the timing of ESS fieldwork to examine the impact of winner/loser status on satisfaction. And, while panel data has been utilized in the past (e.g., Blais and Gélineau, 2007; Singh et al. 2012; and Williams et al., 2021), existing studies generally examine attitudes immediately before and after an election, whereas we examine a longer time horizon. Finally, the timing of measurement in this panel study provides a variation in outcome certainty. To the best of our knowledge, such an approach is unprecedented in modern presidential elections in the U.S. This is evident insofar as the design allows to see whether the judgments of winners and losers are based on the conviction or on the objective reality of victory. Hence, we get a clearer view of the dynamics and triggers of the gap. This is absent from a traditional pre-/post-election panel design.
Using panel data from the ANES in 2000 and 2002, we hope to further clarify the causality and dynamics of the winner-loser gap in satisfaction with democracy. Indeed, the outcome of the 2000 presidential election was and remains controversial to this day. With the election initially being called for Al Gore, then for Bush, then considered too close to call in the same night (Toobin 2002), 2000 offers a particularly interesting framework for a dynamic study of the winner-loser gap. The eventual edge of four electoral votes in favor of Bush in the Electoral College owed much to the results in the state of Florida where voting irregularities and contested ballots seemed large enough to cast doubt on the victory of the Republican candidate. Among other controversies in Florida, the most important ones included the design of the butterfly ballot in Palm Beach County that led to an unusually high number of votes for third party candidate Pat Buchanan (Agresti and Presnell 2002) and the dismissal of ballots with either too many or not enough marks indicating a clear choice for President (Mebane 2004). Essential to our argument is that the various calls in the media on Election Night and the ensuing legal battle served to intensify and protract the doubt surrounding the winner. With the election outcome still in doubt almost a month after Election Day, prospective winners and losers remained unclear far beyond election night. Craig et al. (2006) have found, in a survey of Florida residents, support for the gap in satisfaction with democracy between winners and losers in the aftermath of the 2000 election only when measured after the investiture of the 43rd President. We now turn to a description of our data and methods.
Data and methods
As noted, while there is a robust literature of the relationship between winning and satisfaction, there is relatively little direct causal evidence. We take advantage of the uncertainty surrounding the winner of the 2000 presidential election during the fielding of the 2000 ANES to measure respondents before and after the outcome was known. Given the controversy surrounding the Florida recount, the election’s outcome was not determined until the Supreme Court released its decision in Bush v. Gore on December 12, and Gore conceded the following day. In total, 94% of the respondents (1462 of 1555) were interviewed before December 13. 1
A portion of the 2000 Time Series sample was re-interviewed in 2002, and both waves are contained in the 2000–2004 ANES Merged File. 2 We therefore have measures of satisfaction at two points in time, one where the winner of the 2000 election was unknown, 2000, and one where it was, 2002. One potential concern is that our second measurement of satisfaction comes nearly 2 years after the winner of the 2000 election was determined. We begin by noting that to the extent that the impact of winning on satisfaction might diminish with time, this would lead to our results being a conservative estimate of the causal effect of winning on satisfaction. With that said, we have reason to anticipate the effect of winning and satisfaction will remain relatively stable over any given 2-year period. For example, Loveless (2020) observes a gap in satisfaction between winners and losers more than 4 years after an election is held—moreover, the gap itself is stable over this time period. This result is consistent with other evidence regarding the relative stability of the gap between winners and losers (e.g., Anderson et al., 2005; Dahlberg and Linde, 2017; Nemčok and Hanna, 2021). Thus, we argue these data are useful for identifying the relationship between winning and satisfaction while cautioning that the 2-year gap does allow for the possibility that some unobserved confounders are partially driving our observed outcome.
We measure satisfaction using the standard question drawn from the Comparative Studies of Electoral Systems block of the ANES asking respondents how satisfied they are with how democracy works in the United States. 3 It is a four-point scale ranging from “not at all satisfied” (1) to “very satisfied” (4), with (2) “not very satisfied” and (3) “fairly satisfied” as intermediate positions. As is common (e.g., Anderson and Guillory 1997; Linde and Ekman 2003), we dichotomize the variable so that those who are “fairly satisfied” or “very satisfied” are coded as one and all others as zero. Results are similar with an ordinal coding of satisfaction. 4 The validity of satisfaction questions has been the object of extensive debate (see Canache et al., 2001). Some scholars view it as more revealing of specific support (e.g., Dalton 1999) while others have defended its diffuse character (e.g., Klingemann 1999). Norris (1999) even recommends not using the measure at all. While it is not clear precisely what the measure is capturing, at the very least it may be picking up an emotional reaction to the democratic process (Anderson and Guillory 1997).
To classify winners and losers, we use self-reported presidential vote choice. As noted, evidence indicates that presidential vote choice is most directly related to system support in the U.S. (e.g., Anderson and LoTempio 2002) and consequently our initial focus is on the respondent’s vote for president. In a subsequent analysis we also consider respondents’ 2002 Congressional vote. 5
Given that we have measures of satisfaction in 2000 and 2002—that is, a “pre” and “post” period—we have a canonical two-period, two-group difference-in-differences model. We classify respondents as Gore and Bush voters (coded one for Bush, zero for Gore). We indicate the year by coding 2000 as zero and 2002 as one. Thus, to calculate the difference-in-differences, we interact the two. We estimate the model with linear regression and cluster standard errors by respondent. 6
While the panel data gives us an ability to estimate the causal effect of winner-loser status on satisfaction, to do so we must assume that parallel trends exist in satisfaction across groups. To examine the plausibility of this assumption with only two periods, we estimate the difference-in-differences after first pre-processing the data using propensity score matching to help account for any potential imbalances in the data. In particular, we match on income (a six-point scale), education (a seven-point scale ranging from less than high school to advanced degree), race (coded one for white and zero for non-whites), age (measured in years), gender (coded one for females), and interest in politics (a three-point scale ranging from “not at all” to “very” interested) as measured in 2000. We present question wording and coding details for all variables in the supplementary material (Supplementerial Material Appendix H). 7
As a further robustness test, we estimate a model including covariates that change from year to year that are related to feelings about democracy. We include interest in politics and income. We also include in the supplementary material (Supplementary Material Appendix C) a model that includes perceptions of the economy’s performance. 8 While there is little change in self-reported interest from 2000 to 2002, there is meaningful movement in self-reported income. 9
An additional complication is that, as noted, there is a Congressional election between the “intervention” of Bush being declared the winner in 2000 and our measure of satisfaction in 2002. We first reemphasize that Congressional vote choice is unrelated to trust in government (Anderson and LoTempio 2002) and as such may not pose a problem for our research design. Nevertheless, we investigate this empirically by recoding winners as those who voted for Bush in 2000 and a Congressional Republican candidate in 2002 (the Republicans gained seats and remained in the majority in the House following the 2002 election) and all others are coded as losers—that is, we only code such “double winners” as winners as a stringent test. 10 We stress that when doing so we cannot interpret our results causally as satisfaction is measured contemporaneously with winning in this model. However, if our earlier results comport with those from this analysis, we can be confident in their validity.
A final concern with this data is that the terrorist attacks of 11 September 2001 might influence attitudes toward satisfaction with democracy, decreasing the generalizability of our results. In particular, a “halo” effect around the president following the attack might make the public more supportive of the system overall. Our sense is that this would make our results a conservative estimate of the impact of voting for the winner as overall levels of satisfaction may have increased. If some electoral losers’ goodwill toward the U.S. increases, satisfaction may also increase. If this is the case, the effect we observe from 2000 to 2002 would be smaller than in more typical years. 11 To examine the magnitude of this possible bias, we estimate models where feelings of pride about the U.S. moderate the relationship between winning and satisfaction. Pride is measured via responses to how the respondent feels when seeing the U.S. flag. This attitude is measured on a four-point scale with a question asking respondents how they feel when they see the U.S. flag, with responses ranging from “not very good” to “excellent. Very few respondents report the lowest level of pride (fewer than 2%) and as such we recode the variable to range from 1 to 3, with the two lowest categories being combined (higher values represent more pride). 12 We include in the model age, income, race, sex, education, interest in politics, and perceptions of the economy’s performance as measured in 2002 (except for education, which was only measured in 2000). Economic performance is measured using a five-point scale ranging from rating the economy as performing much worse to much better. The other variables are coded as before.
Results
Difference-in-differences model estimating impact of winning on satisfaction.
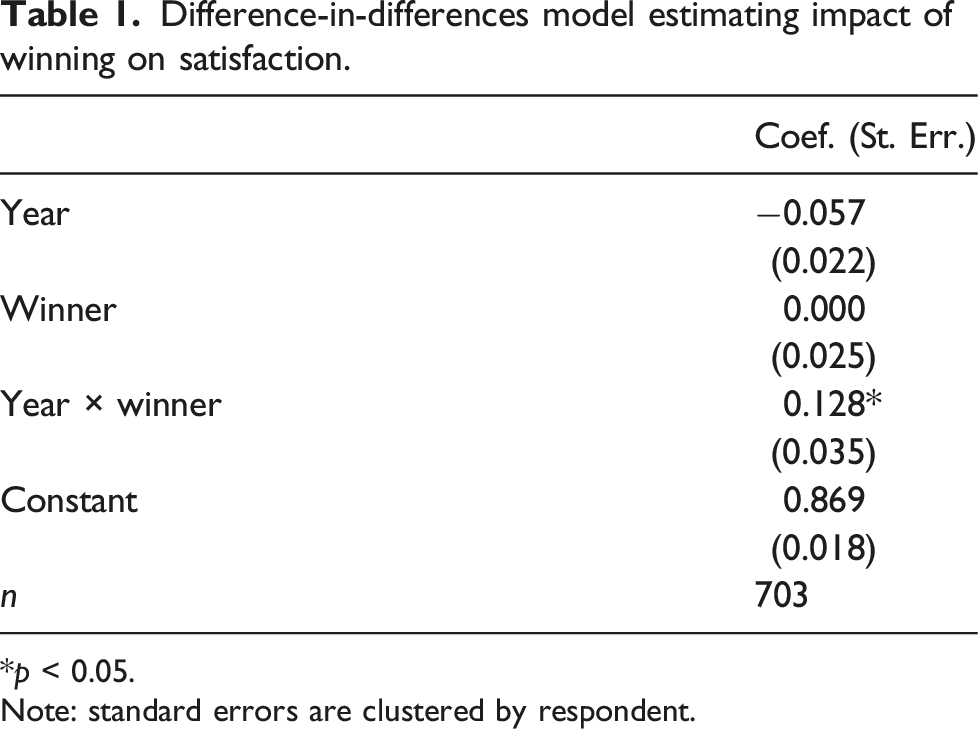
*p < 0.05.
Note: standard errors are clustered by respondent.
We examine the impact of being an electoral winner or loser in more detail in Figure 1, which displays the probability of being satisfied conditioned on vote choice. We first note that Bush and Gore voters were equally likely to be satisfied in 2000—even with a contentious election involving a close and disputed outcome, both are quite high at about 0.87 for each group. From 2000 to 2002 the probability that Bush voters were satisfied increased by 0.071 and Gore voters decreased by 0.057. In other words, our results indicate a roughly parallel effect where winning increases satisfaction and losing decreases it by similar magnitudes. Satisfaction with democracy among electoral winners and losers in 2000 and 2002. Plotted points are predicted probabilities with 95% confidence intervals.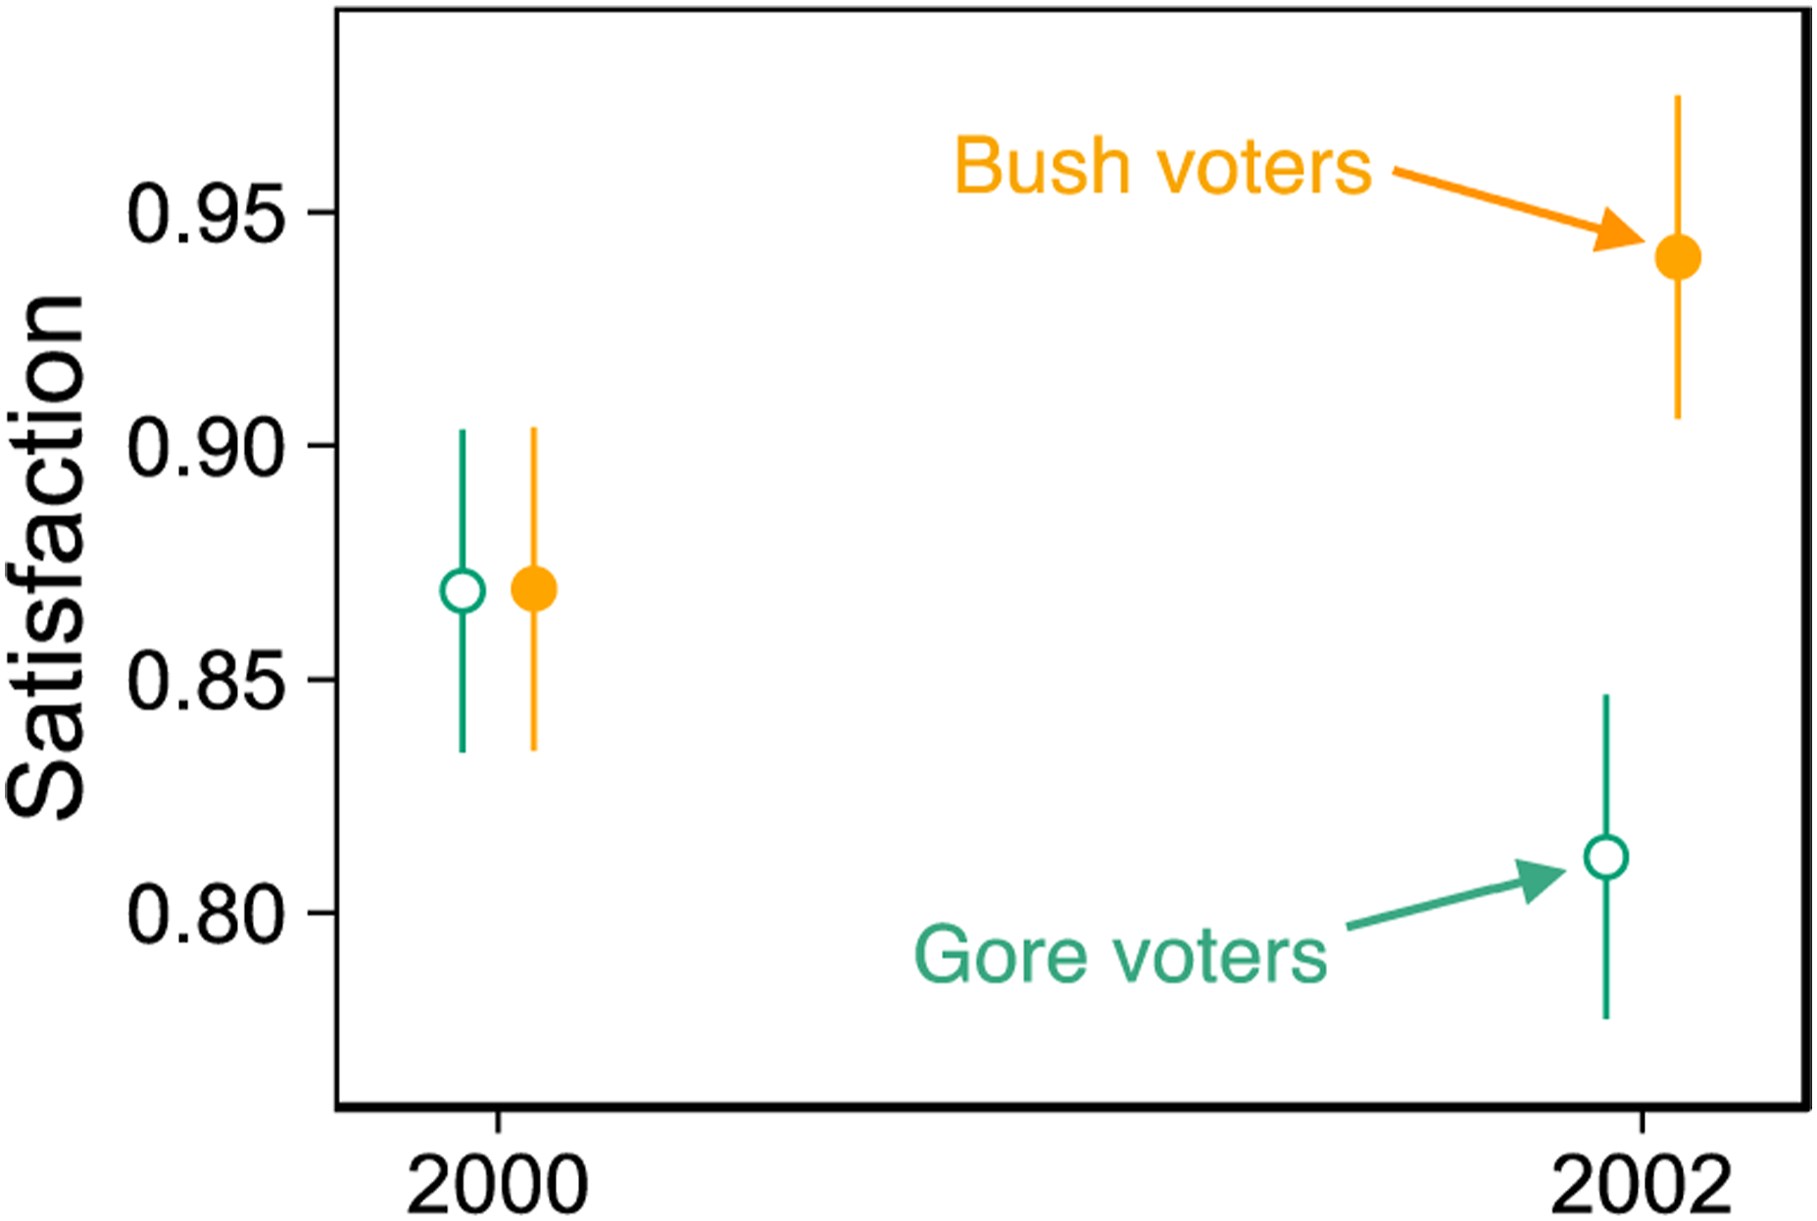
Robustness checks
We next turn to examining the robustness of our result. As noted earlier, we first test for the possibility that there exist any imbalances in our data. Given the makeup of the two different party coalitions, it is perhaps unsurprising that we do in fact observe some imbalance for some of the covariates. We find that the two groups of voters differ by race, income, and gender—full results of the balance test are presented in the supplementary material (Supplementary Material Appendix D). When estimating the model after pre-processing the data to account for the imbalances, we observe a slightly larger effect compared to that presented in Table 1: 0.133 (p < 0.001). We present the full results of this analysis in the supplementary material (Supplementary Material Appendix B).
Second, we estimate a model that adjusts for time-varying covariates. Even though our two waves are only separated by 2 years, suggesting little overtime change, as noted we do observe meaningful shifts for one important control variable (income). Here we observe a treatment effect of 0.123 (p < 0.001), quite similar to the effect observed in Table 1. Full results from this analysis are presented in the supplementary material (Supplementary Material Appendix B).
Third, we estimate a model where we also consider Congressional vote choice in 2002. A respondent is classified as a winner only if he or she voted for Bush in 2000 and a congressional Republican in 2002. We again emphasize that we need to be cautious in giving the results of this analysis a causal interpretation given that satisfaction in 2002 is measured contemporaneously with 2002 vote choice. We estimate two models—one with and without covariates. In the model with covariates, we observe a shift in satisfaction of 0.105 (p = 0.001); in a model that adjusts for time-varying covariates, we observe a shift of 0.110 (p = 0.001). Full results from both analyses are presented in the supplementary material (Supplementary Material Appendix B).
We summarize the results from these various models in Figure 2, where we present the estimated treatment effects with 95% confidence intervals along with results from Table 1 as a point of comparison. As evidenced in the figure, our result is robust to these alternative estimation strategies. While the precise estimate varies across models, the substantive conclusion is quite similar. Estimated impact of voting for winner with 95% confidence intervals.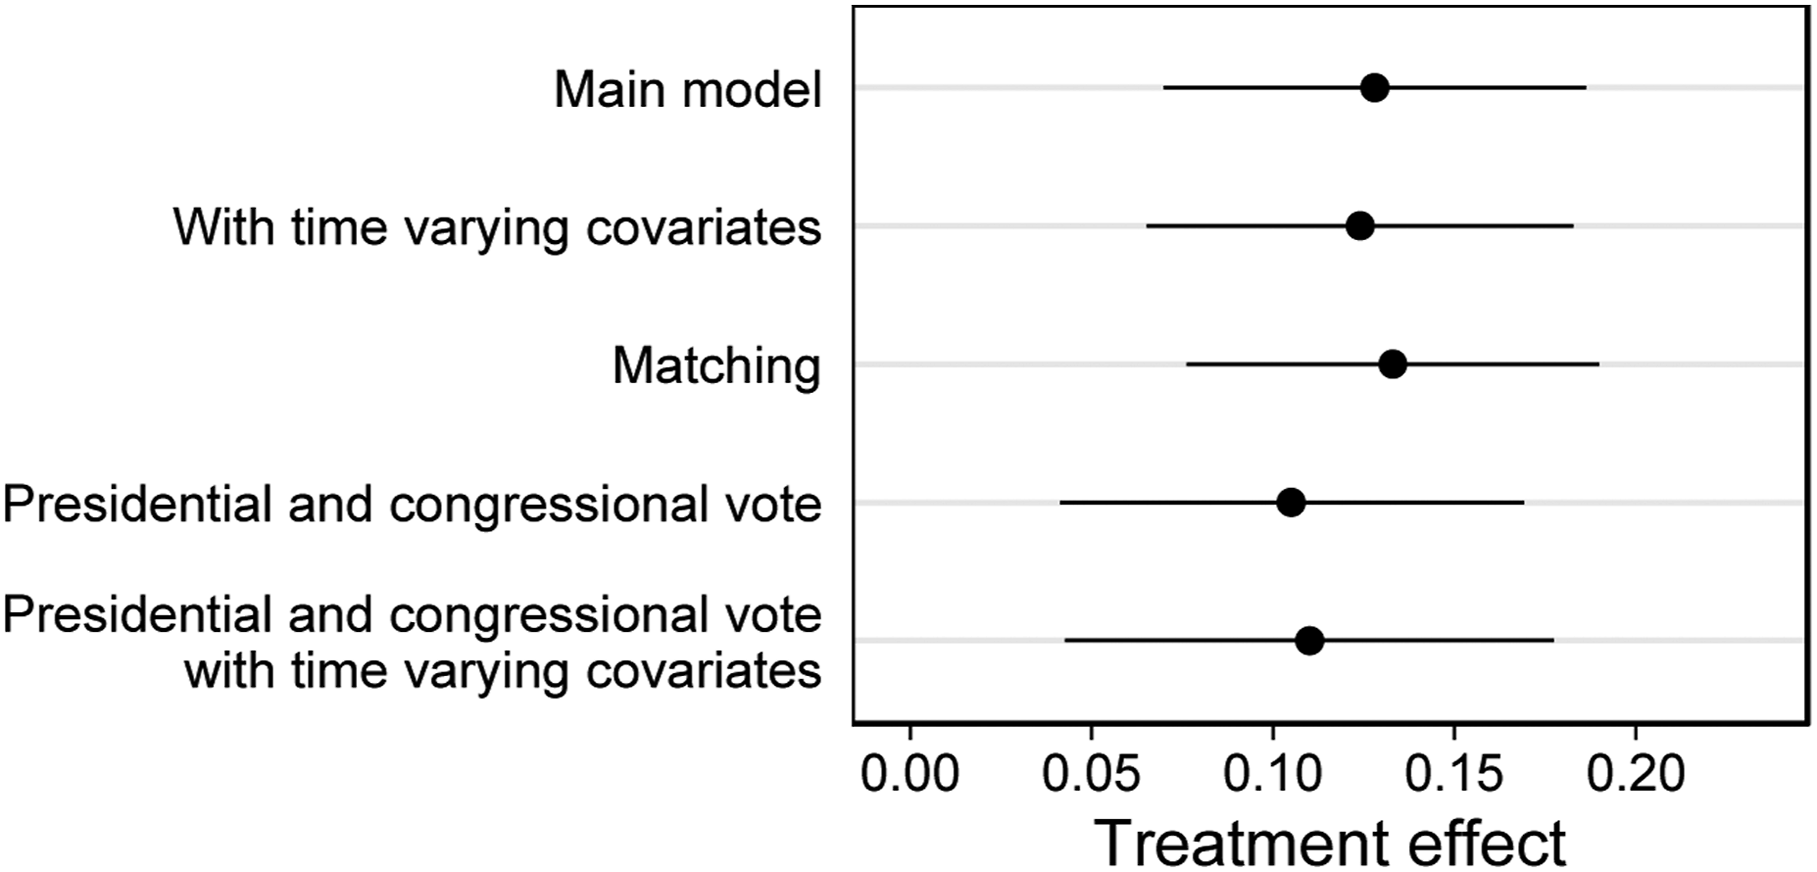
To further probe how well our models reflect the general relationship between winning and satisfaction, we examine if the terrorist attack of September 11th influences our ability to draw inferences from the 2000–2002 panel data. As noted earlier, the attacks potentially increase feelings of patriotism which may also increase satisfaction. To examine how this may influence our results, we estimate a model that allows for feelings of pride about the U.S. to moderate the relationship between vote choice in 2000 and satisfaction in 2002. We reemphasize that these results can best be viewed as associational as pride is measured contemporaneously with satisfaction in 2002. We also note that we would ideally have a measure of pride in both waves, but we are limited to 2002, meaning an untested assumption (in this data) is that the attacks influenced such feelings. We note that there is evidence of such an effect (e.g., Perrin and Smolek 2009; Hetherington and Nelson 2003) and importantly that attitudes toward the U.S. flag represent patriotism rather than nationalism (Skitka 2006) using other data. With these limitations in mind this analysis does allow us to gain some insight as to how the terrorist attacks might alter the pattern between winning and satisfaction.
We begin by noting that the interaction term between our measure of pride in the flag and vote choice is statistically significant (p = 0.038) indicating such feelings moderate the relationship between winning and satisfaction. We display the conditional effect of vote choice in the form of predicted values in Figure 3—full numerical results are presented in the supplementary material (Supplementary Material Appendix G). We observe that the relationship between winning and satisfaction is indistinguishable from zero among those who feel “extremely good” when seeing the U.S. flag, while we observe a statistically significant positive conditional relationship for the other groups. These results suggest that the extent that to the terrorist attacks boosted pride and potentially altered the typical pattern between winning and satisfaction, the results we present in Table 1 are conservative as a result. That is, if some electoral losers had higher feelings of pride—and thus satisfaction—than would be the case in more typical elections as a result of the terrorist attacks, the usual relationship between vote choice and satisfaction would consequently be attenuated. The relationship between vote choice and satisfaction moderated by feelings about the U.S. flag in 2002. Plotted points are predicted values with 95% confidence intervals.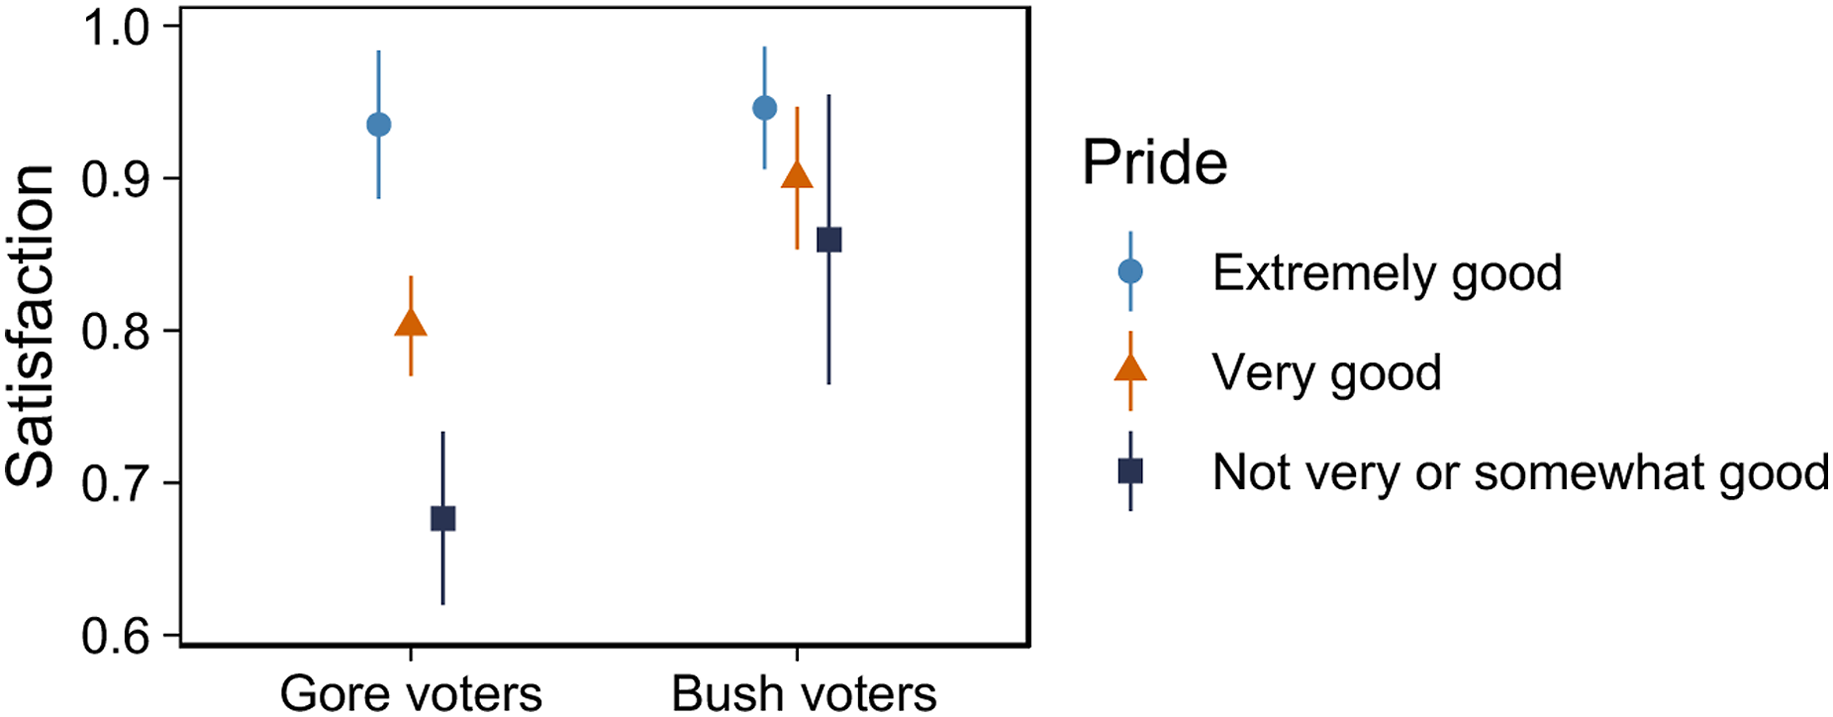
Conclusion
In this article, we sought to estimate the impact of voting for the winning presidential candidate on satisfaction utilizing a set of data that allow us to uniquely identify the nature of this relationship. While a large literature demonstrates a consistent and meaningful association between vote choice and satisfaction, the existing evidence is almost entirely correlational in nature. We argue that because respondents in the first wave of the data we examine were unaware which candidate would win the presidency following the 2000 election in the US, we are able to utilize the uncertainty to estimate a difference-in-differences model to causally identify the relationship. Moreover, our primary result withstands a series of robustness checks. In short, our results lend support to a long line of extant cross-sectional findings.
In light of the evolution of elections under hyperpolarization, appraising the losers’ consent is more relevant than ever. In some of its electoral cycles since the turn of the millennium, the U.S. has seen losing sides actively contesting their defeat. In parallel, obstructionism has become a desirable strategy for the opposition. Starting in 2008 at the elite level (Mann and Ornstein 2016) and abetted by the grassroots mobilization of the Tea Party in the following years (Skocpol and Williamson 2016; Parker and Barreto 2014), systematic obstructionism has presented a first challenge to the traditional conception of losers’ consent. This bears out an overlooked paradox at the heart of electoral competition. Losers are supposed to “work hard at using all legal and defensible means to thwart the efforts of the winners to pursue their desired policies” (Anderson et al., 2005, 4). Yet, at the same time, losers cannot go as far as undermining the regime. In 2000, for the Gore camp, “using all legal and defensible means” translated into demanding partial recounts in specific Florida counties that eventually led to the settlement of the dispute in court (Toobin 2002). As we have shown, this temporarily insulated supporters of the former Vice President from the loss of diffuse support that we uncover in the 2002 wave. We additionally provide suggestive evidence of a moderating role of national pride in informing the winner-loser gap in 2002. Nonetheless, it is increasingly the case that “people whose party is out of power have almost no trust in a government run by the other side” (Hetherington and Rudolph 2015, (1) especially among conservatives (Jost 2017).
From a global perspective, the insights about the satisfaction gap in the 2000 U.S. Presidential election offer an interesting puzzle. Genuine uncertainty about results delays judgments about democracy. In the U.S., however, uncertainty about the distribution of power fades immediately once the results are made official given its winner-takes-all elections. In contrast, since coalition formation offers more room for consolation prizes and relative victories in apparent defeat, proportional representation and multiparty systems help cushion the blow of electoral defeat. Institutional (Anderson and Guillory 1997; Lijphart 2012; Singh 2014) and efficiency motives (Dahlberg and Jonas, 2016; Martini and Quaranta 2019) have been proposed to explain this. We can reasonably suspect that the timing of uncertainty offered by coalition governments with stable party histories marked by cooperation is another factor in preventing a winner-loser gap from ever fully setting in to the degree it does in more majoritarian systems.
We should now note that heavy contestation—albeit of a more polarized nature—accompanied the latest presidential outcome. The last presidential election previews how the winner-loser satisfaction gap can be taken to its most ominous conclusion, perhaps especially when one group is perceived to (unfairly in the eyes of electoral losers) benefit from the outcome (Enders and Thornton 2021). Testifying that perceptions of victory and loss have become more subjective and fluid, some supporters of the losing incumbent have taken their frustration to the Capitol. Elite messaging from a losing candidate decrying an “egregious” and “comprehensive assault” on democracy (Naylor 2021) incited a share of the losing group to go beyond the “legal and defensible” means of fighting an outcome produced through democratic means (Anderson et al., 2005, (4). Some researchers explain this reaction as due to the predominance of specific outcomes and partisan identity protection over the need to preserve democracy for its intrinsic procedural benefits (Mayer et al., 2009; Mayer 2020). Having such a large share of citizens refusing to grant legitimacy to a process that has not produced their desired specific outcomes is unprecedented and bodes ill for the legitimacy of democratic procedures. It also testifies to a change in the perception of elections under populist leadership. With their perceptions of standing for the righteous majority that may be at odds with reality, populist leaders like Donald Trump do not doubt that they are taking the country in the right direction and instead view elections “as a celebration of the majority and its leader” (Urbinati 2019, 8; also see Barr 2009; Caramani 2017). If they are repudiated at the electoral booth, it is either because their righteous solution has been misperceived or because fraud happened.
Overall, our study and recent developments shed light on the excessive rosiness of the scholarly picture of satisfaction with democracy. Indeed, recent experimental evidence points to the weakness of the structural securities of democracy when pitted against forms of support specific to a given party or leader (Svolik 2019; Graham and Svolik 2020). Decreasing support for abstract democratic principles may only reveal the tip of the iceberg of an endemic malaise with systems that no longer placate the concerns of losers of particular contests.
Supplemental Material
sj-pdf-1-ppq-10.1177_13540688211058111 – Supplemental Material for The winner-loser satisfaction gap in the absence of a clear outcome
Supplemental Material, sj-pdf-1-ppq-10.1177_13540688211058111 for The winner-loser satisfaction gap in the absence of a clear outcome by Adrien A. Halliez and Judd R. Thornton in Party Politics
Footnotes
Declaration of conflicting interests
The author(s) declared no potential conflicts of interest with respect to the research, authorship, and/or publication of this article.
Funding
The author(s) received no financial support for the research, authorship, and/or publication of this article.
Supplemental material
Supplemental material for this article is available online.
Notes
Author biographies
References
Supplementary Material
Please find the following supplemental material available below.
For Open Access articles published under a Creative Commons License, all supplemental material carries the same license as the article it is associated with.
For non-Open Access articles published, all supplemental material carries a non-exclusive license, and permission requests for re-use of supplemental material or any part of supplemental material shall be sent directly to the copyright owner as specified in the copyright notice associated with the article.