
Abstract
Many studies have tried to identify citizens’ views about which actors should govern and how. These studies have mostly looked at support for citizens or independent experts being given a greater role. Recently, Hibbing, Theiss-Morse, Hibbing and Fortunato have proposed a new battery of 21 survey items capturing the dimensions along which citizens’ preferences for who should govern are organized. Testing their survey instrument among US respondents, they identified seven dimensions. In this study, we replicate their approach across nine European democracies, namely, Austria, Belgium, Bulgaria, Czech Republic, Finland, Greece, Ireland and the Netherlands. The replication allows, first, to compare citizens’ preferences for political actors between the US and Europe, and within Europe. Second, it provides suggestions for how Hibbing and colleagues’ battery might be adapted and re-used in other countries, enabling further cross-national comparative research on citizens’ preferences for who should govern.
Keywords
Introduction
Research on citizens’ demands for alternatives to elected politicians has grown rapidly (Gherghina and Geissel, 2020). Preferences for who should take political decisions are not trivial. They have been shown to influence citizens’ willingness to accept policy outcomes (Bertsou, 2022; Esaiasson et al., 2019; Towfigh, 2016), their overall trust in the political system (Boulianne, 2018; Jäske, 2019), and their participation in politics (Bengtsson and Christensen, 2016; Gherghina and Geissel, 2017).
In an earlier issue of this journal, Hibbing et al. (2021) proposed a new battery of 21 survey items tested in the US for capturing “ordinary people’s desires for the way their government should operate” (p. 1). Yet, empirical confirmation that their battery and the dimensions it uncovers are exportable outside the US is lacking. According to the authors themselves, “[t]he most pertinent research questions moving forward are the extent to which these conclusions are generalizable across time and borders as well as the degree to which attitudes vary predictably across people and contexts” (p. 11).
This study replies to their call by testing the new battery across nine European democracies: Austria, Belgium, Bulgaria, Czech Republic, Denmark, Finland, Greece, Ireland and the Netherlands. In each country, a sample of at least 1500 citizens representative of age, gender, education and place of residence was surveyed. On that basis, we propose a dual comparison of citizens’ process preferences: first, between Europe and the US and second, across European countries. Such a comparison is the first step in the direction of more a systematic investigation of citizens’ process preferences across countries.
We find, first, that while most of the conceptions of who should govern highlighted by Hibbing and colleagues carry over to European countries, some of these conceptions do not form separate dimensions. Second, while the citizens’ conceptions of who should govern are similarly structured across the nine European democracies, the extent to which citizens support each of these conceptions varies across countries.
A new battery to capture citizens’ preferences for who should govern
Research on citizens’ preferences for how democracy should be organized has boomed over the last two decades. It started from the observation that many citizens do not trust elected politicians and that alternative models centered around citizens or experts were gaining public support (Bengtsson and Mattila, 2009; Font et al., 2015; Gherghina and Geissel, 2019; Goldberg et al., 2020; Hibbing and Theiss-Morse, 2002; Webb, 2013).
Yet, there were three main limitations for the field to address. First, most studies are single-country analyses. Second, the survey items used to capture citizens’ process preferences are different across studies, making it unclear whether the differences observed were due to country differences or item wordings. Finally, most research designs were limited to items about citizens or independent experts as decision-makers, without considering other alternatives.
The new battery recently published in this journal by Hibbing and colleagues proposed to overcome some of these limitations. The battery was extracted from a wider range of survey items administered to a sample of 800 US respondents. The 21 items in the battery (see Supplementary Appendix 1) were selected based on a factor analysis which identified seven key dimensions along which citizens’ process preferences are structured: 1. Citizens’ capability 2. Politicians’ capability 3. Power to the people 4. Power to scientific experts 5. Power to religious, military and business leaders 6. Power to actors closer to citizens 7. Perceptions of the nature of governing
The first dimension relates to how people evaluate the capacity of citizens to make important political decisions (their skills and level of information). This dimension is separated from the third dimension capturing whether respondents would like citizens to have more control over the decision-making process (closer to a model of direct democracy). The second dimension reflects how respondents judge elected politicians. The fourth and fifth dimensions are related to empowering various non-political actors, while distinguishing between actors with a scientific background (scientists, medical doctors, experts) and those coming from other spheres of activities: businesspeople, religious leaders and military generals. The sixth dimension is rather new. It taps into support for politicians who would be novices coming from outside politics and going against the trend of professionalization of politics. The last dimension taps into the nature of governing and separates respondents calling for a more consensual way of doing politics from those who instead perceive politics as a conflict between rigid ideologies.
In the last part of their study, Hibbing and colleagues (2021) examine which socio-demographic characteristics and political attitudes correlate with higher scores on each of the dimensions. Their main findings are threefold. First, sociodemographic variables (age, education, race) do not correlate much with factor scores on the seven dimensions. Only age seems to reduce support for non-political actors and increase support for a more consensual nature of governing. The second main finding is that citizens with higher political knowledge are more skeptical towards citizens’ capabilities and opposed to giving more power to the people, disconfirming the New Politics hypothesis, or the idea that the demand for citizen participation comes from highly educated and politically engaged individuals (Dalton et al., 2001). Higher political knowledge is instead associated with greater support for shifting power to religious, military and business leaders and to scientific actors. Finally, political orientations (social and economic conservatism, authoritarianism) show strong correlations with several dimensions. Shifting power to religious leaders, military generals and businesspeople is positively correlated to being economically and socially conservative and to being more authoritarian. By contrast, shifting power to scientific actors and support for a more consensual nature of governing are correlated with being more liberal, both economically and socially. Authoritarianism is also strongly associated with holding more negative views of politicians’ capabilities.
Our main objective is to replicate Hibbing and colleagues’ battery, using similar exploratory analytical techniques. We stick to exploratory factor analysis as opposed to other methods such as structural equation modelling, as we are not just testing whether already established relationships hold in contexts outside the US, which is the primary aim of SEM (Ockey, 2013). Instead, we seek to explore potentially different underlying dimensions, which may be based on a different constellation of items from the battery, depending on the country context.
The political differences both between the US and Europe and among the European democracies we have included in our study might imply different dimensions across countries. The US has a strong presidential system with an almost perfectly bipartisan configuration, while the European countries in our study have either parliamentary or semi-presidential systems with a multiparty configuration. While there is limited cooperation between Republicans and Democrats, coalition governments are quite common in most of the countries in our study. The strong bipartisanship of US politics might explain why Hibbing and colleagues' study identified the tension between consensual and adversarial styles of governing (dimension 7) as a key marker of citizens’ preferences. Finally, around half of the states in the US have a strong tradition of using referendums and initiatives, which unlike in most European countries, have a binding effect on political decision-making.
All these elements might lead us to expect differences in the process preferences of Europeans compared to US citizens. However, as will be elaborated in the next section, our comparison is not only between Europe and the US. It is also across the nine European countries we cover, which were selected with the aim of capturing a variety of political systems.
Data and method
In January 2022, we fielded an online (CAWI) survey across nine European countries: Austria, Belgium, 1 Bulgaria, Czech Republic, Denmark, Finland, Greece, Ireland, and the Netherlands. The choice of these nine countries was guided by two main considerations. First, we wanted to cover European parliamentary democracies with different party systems and logics of government (ranging from single-party governments to broad coalitions). Second, we wanted to examine process preferences in countries that had not been studied recently, unlike the UK, Germany, France or Spain (Bedock and Pilet, 2021; Font et al., 2015; Gherghina and Geissel, 2019, 2020). Our study also includes three younger democracies with less consolidated party systems (Greece, Czech Republic, Bulgaria). In such democracies, citizens may not distinguish between different alternatives to politicians, but perceive them as related remedies to the collapse of the party system. Finally, all regions of Europe are represented by the country selection: Western, Northern, Central, Eastern and Southern. The diversity of countries represented may lead us to observe variations in how citizens’ conceptions of who should govern are structured.
In each country, we constituted samples of at least 1500 respondents that were weighted to match the characteristics of the general population in terms of age, gender, place of residence and education. In addition to the 21 items from Hibbing et al. (2021), the survey included several questions on respondents’ socio-demographic characteristics, political attitudes and political participation.
The data collected is analyzed in two steps, following the very same procedure applied by Hibbing and colleagues. First, to isolate the dimensions along which respondents are split in terms of process preferences, we run a factor analysis with varimax rotation on a pooled dataset for the nine countries covered. We then re-run the same factor analysis separately by country.
Then, in a second step, we run a series of multivariate regressions to examine the correlates of process preferences. Like in Hibbing and colleagues’ study, the dependent variables for those regressions are the factor scores of all individuals on each of the dimensions extracted from the factor analysis. We use those factor scores as dependent variables in five separate multivariate ordinary least square regressions (one for each dimension detected), which we conducted for each country separately (while also providing the results for pooled sample in Supplementary Appendix 7).
For the independent variables (see Supplementary Appendix 2), we mirrored the ones used by Hibbing and colleagues (2021) as closely as possible, adapting them to the European context (excluding race, for example). We include gender, age, education, subjective income, and place of residence, as basic demographics. Unlike Hibbing and colleagues, we did not have a question on respondents’ political knowledge, however we include variables capturing respondents’ political interest and political efficacy. We also include a measure of respondents’ level of political participation. Similarly to Hibbing and colleagues, we capture respondents’ economic and social conservatism with questions about their attitudes towards income redistribution and immigration. Finally, we include variables measuring respondents’ level of religiosity and authoritarianism, the latter reflecting a preference for strong unchecked leadership in government.
Factor analysis: The main dimensions of European citizens’ preferences
The factor analysis of the pooled data from the nine countries yields different results compared to US. We identify five dimensions instead of 7, with an eigenvalue higher than 1 (see Supplementary Appendix 3, Table A.3.1). 2
Loadings of the 21 survey items on the five dimensions extracted from the factor analysis (pooled sample-all countries).
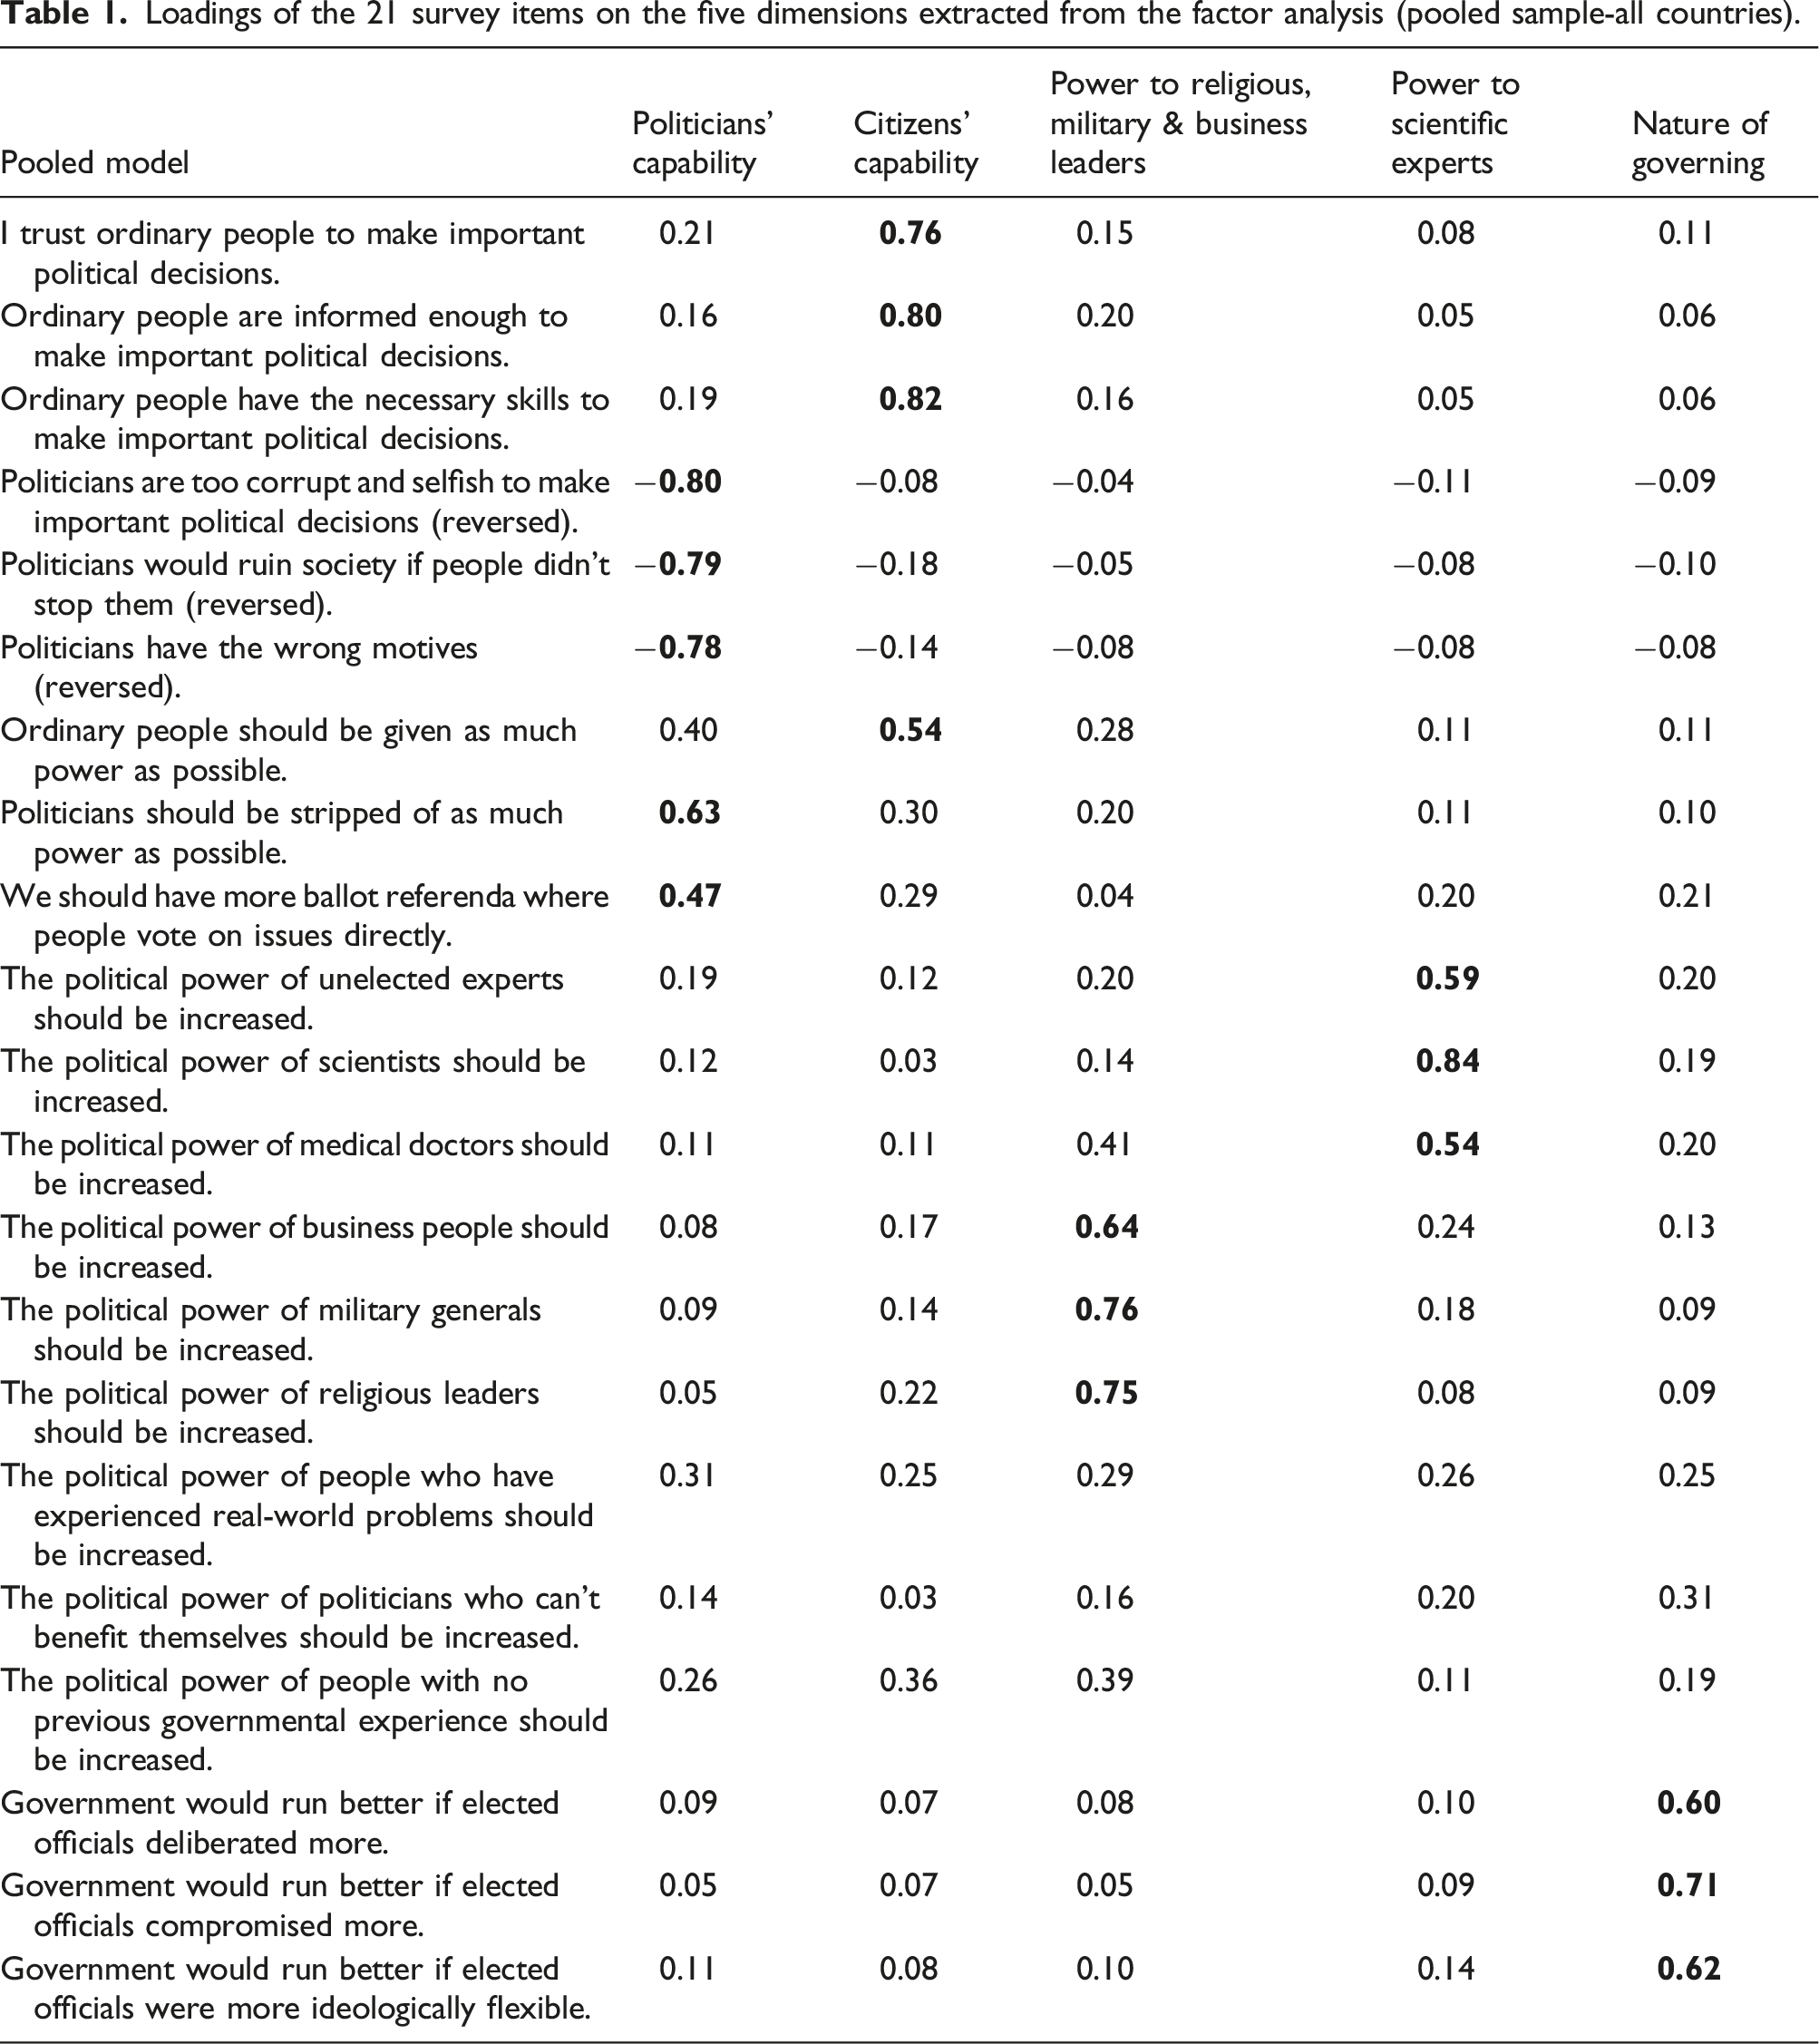
The second dimension extracted corresponds for the most part to Hibbing and colleagues’ dimension emphasizing “citizens’ capabilities”. However, we also find that the item on giving ordinary people as much power as possible loads onto the same dimension as the items on citizens’ capabilities to make important political decisions (0.54). Therefore, unlike Hibbing and colleagues, our results show that the items on giving more power to the people do not form a separate dimension, but correlate with items emphasizing the capabilities of either politicians or citizens. The strong tradition of binding citizen-initiated referendums in the western part of the US might explain why the idea of giving more power to the people forms a separate dimension among US citizens. In the nine European countries of this study, referendums are more often government-initiated and intricately linked to party struggles (Setälä, 2006), which might also explain why the item on referendums loads onto the politicians’ capability dimension, unlike in the US.
The third and fourth factors extracted correspond to the ones identified in the US regarding the role of scientific experts and of military generals, religious leaders and businesspeople. We also see that the item on increasing “the political power of people with no previous governmental experience (0.39)” has a rather higher loading on this dimension (just below the cut-off point of 0.4), which suggests that this dimension is about empowering actors from outside traditional representative politics (see next paragraph). For the fourth factor, the meaning is clear and identical to what Hibbing and colleagues found in the US. It is about giving a greater role to scientific experts such as scientists and medical doctors. This dimension connects to recent studies on “technocratic attitudes” in European democracies (Bertsou and Caramani, 2022; Chiru and Enyedi, 2022; Lavezzolo et al., 2021). The fifth dimension extracted corresponds with Hibbing and colleagues’ dimension on the nature of governing and includes the same three items emphasizing the need for more consensus, deliberation and ideological flexibility among elected officials.
Finally, we do not observe a specific dimension among European citizens regarding the role of new actors in politics that are closer to citizens and who have no government experience. Hibbing and colleagues interpreted this dimension as a call for bringing in fresh faces into politics. Among Europeans, the survey items capturing this dimension load onto the same dimension as support for empowering religious leaders, military generals and businesspeople. A potential explanation would be that, in Europe, such actors would also be perceived as a new type of actors in politics, while in the US such profiles can be more commonly found among elected politicians. This is especially true for religious leaders and military generals. Religious leaders have historically played a key role in US politics, be it within the civil rights movements (e.g. Dr Martin Luther King), in pro-life conservative movements, but also as Congressmen (e.g. Reverend Raphael Warnock, current Senator of Georgia). Religious leaders have become much less present in European politics, except perhaps in Orthodox countries (Ramet, 2019). It is also not unusual for military generals in the US to serve as Secretary of State (e.g. Alexander Haig and Colin Powell) or for US Presidents to have held a career in the military. In fact, 29 of all 45 US presidents served as military officers prior to taking office, while military profiles are much less common in European governments. The difference between the US and Europe is a bit less straightforward when it comes to empowering businesspeople, who are increasingly present in the politics of both regions. From 2015 to 2017, 231 out of 435 members of the US House of Representatives held previous occupations that fell within the business and banking category (Kramer, 2017). In Europe, several former business executives also held leading government positions, such as Babiš (CZ), Berlusconi (IT), and Löger (AT). The greater permeability between politics, business, religion and the army might explain why such actors are not associated to newcomers in US politics, while they are perceived as such in Europe.
We also run the factor analysis separately by country. Despite the diversity of political systems, we identify the same five dimensions in all nine countries (also when splitting the French and Dutch-speaking parts of Belgium). The only exception is Denmark where a sixth factor can be extracted based on an eigenvalue greater than 1. However, this sixth factor explains less than 5% of the overall variance (see Supplementary Appendix 4). Strikingly, the meanings of the five dimensions are also similar, as the items loading onto them are the same across countries (see Supplementary Appendix 5). In all nine countries, the five dimensions identified are about “politicians’ capabilities”; “citizens’ capabilities; “power to scientific experts”; “power to religious/military/business leaders”; and “nature of governing”. We therefore have four dimensions related to the actors that citizens want to govern and a fifth one related to ideas about politicians governing in a more consensual as opposed to adversarial style. The latter dimensions on “power to religious/military/business leaders” and “nature of governing” have been much less present in previous research on citizens’ views about politics. Finally, we did not find separate dimensions for “the role of non-traditional actors with no past governing experience” or “power to the people” in any country. The only exception is Denmark, where the sixth factor includes items relating to the idea of empowering people, which (as will be elaborated in the next paragraphs) is potentially explained by the role of participatory instruments in Danish politics.
The fact that citizens’ preferences for who should govern are similarly structured across countries is a major finding. It opens the door for cross-national comparisons of the popularity of each dimension and of the individual and contextual determinants of support for each dimension. While the five dimensions travel relatively well across countries, this does not rule out that some conceptions of who should govern are widely supported by citizens from one country but widely rejected by citizens from another country. We make a first step in this direction, by comparing the countries’ mean factor scores on each of the five dimensions. Figure 1 shows the mean factor score on each dimension for respondents from the nine countries, with stars indicating whether the mean factor score differs significantly from that of the overall sample.
4
Mean factor score on each dimension per country. Note: the stars indicate when the country’s mean score on the dimension differs significantly from the pooled sample’s mean score on the same dimension.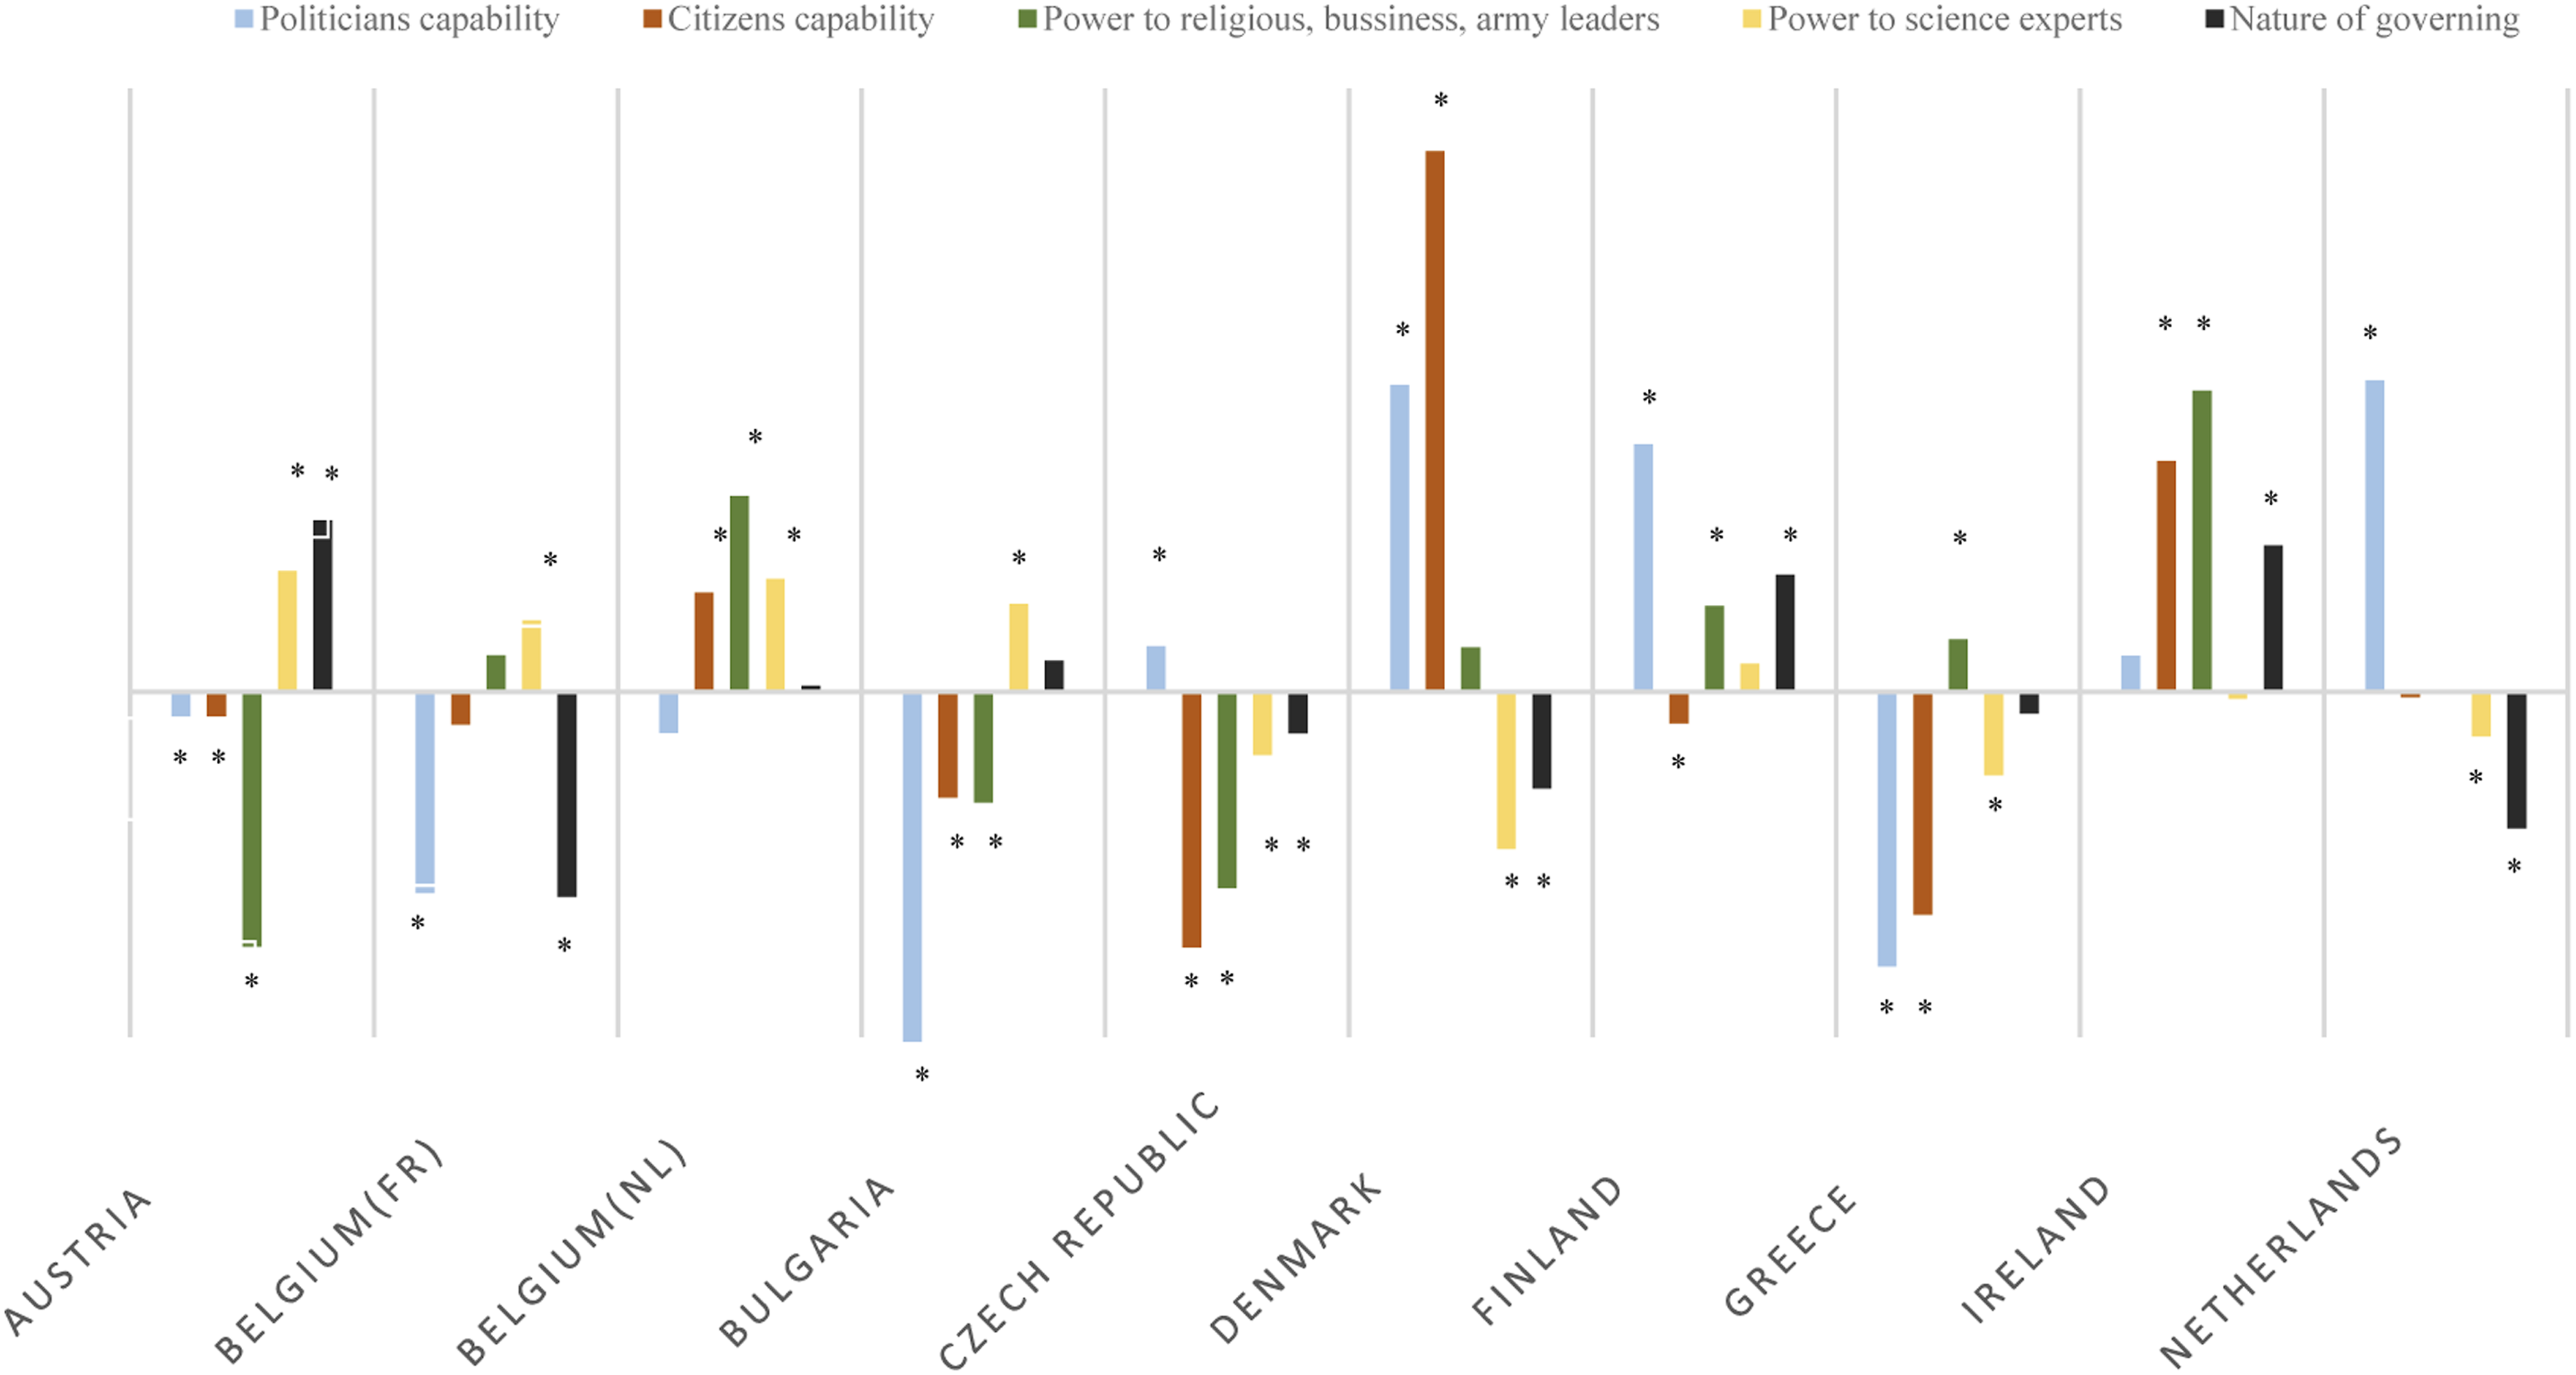
First, regarding how citizens evaluate politicians’ capabilities, we find that citizens are on average more negative in Bulgaria, Greece and French-speaking Belgium and more positive in Denmark, Finland and The Netherlands. 5 Previous research found that corruption undermines citizens’ evaluations of politicians (Van der Meer and Hakhverdian, 2017). This might explain why citizens from Denmark, Finland and The Netherlands, which perform well on Transparency International’s Corruption Perception Index (Transparency International, 2021), are less critical of politicians while those from Bulgaria and Greece, which perform comparatively worse, are more critical of politicians. Political trust is also generally higher in Flanders than in Wallonia, where political scandals led to several resignations and the break-up of the regional government majority in 2017 (Close et al., 2022). This might explain why citizens from French-speaking Belgium stand out as less confident in politicians’ capabilities, unlike their Dutch-speaking counterparts. Political instability might also explain the lower mean scores in Bulgaria and Greece: Bulgaria was governed by four different cabinets between 2020 and 2022 while Greece was governed by eight different cabinets between 2009 and 2019.
Turning to citizens’ capabilities, citizens from Denmark and Ireland score higher on average while those from Bulgaria, Czech Republic, and Greece are least confident in citizens’ capabilities. Past experiences with citizen participation might explain these differences. In Ireland and Denmark, direct and deliberative instruments, such as referendums, citizens’ assemblies, consensus conferences and deliberative polls have influenced important political decisions at the national level. By contrast, the last three national referendums in Bulgaria were all ruled invalid due to low voter turnout and the only national referendum in Greece was ignored by government. Ireland and Denmark also score comparatively higher than Czech Republic, Bulgaria and Greece on the 2021 Varieties of Democracy Participatory Democracy Index (V-Dem Institute 2021). The country differences in mean factor scores on citizens’ capabilities might also be related to interpersonal trust. Data from the 2020 Eurobarometer show that the percentage of citizens who either ‘totally trust’ or ‘tend to trust’ people from their own country ranges between 90 and 95% in Denmark and Ireland (where the mean factor scores on citizens’ capabilities are the highest). By contrast, the percentage of citizens expressing at least some trust in fellow citizens ranges between 63 and 71% in Bulgaria, Greece and Czech Republic.
When it comes to empowering religious leaders, military generals and businesspeople, citizens from Ireland, Dutch-speaking Belgium and Finland score the highest while those from Austria, Czech Republic and Bulgaria score the lowest. Although the grouping together of several different actors makes it difficult to interpret these differences, we offer tentative explanations for some of these differences. In Austria and Czech Republic, skepticism about businesspeople might be underpinned by past experiences with billionaires-turned-politicians, such as Frank Stronach in Austria and Andrej Babiš in Czech Republic. Stronach’s political career lasted less than a year after several controversial televised debates (Prodhan, 2013) and Babiš was asked to resign as prime minister after being implicated in a scandal around misappropriation of EU funds (Harris, 2018). In Bulgaria, where the President is a former military general, military expenditure more than doubled between 2018 and 2019 making it one of the biggest NATO spenders (Dimitrov, 2019). However, Bulgarians are considerably less trusting of their army than citizens from the other countries in this study (according to 2020 Eurobarometer data).
Regarding the role of scientific experts, differences are small across countries. The mean scores are slightly higher among citizens from Austria, Belgium and Bulgaria, while citizens in Denmark, the Czech Republic and Greece are on average more negative. Danes are much less accustomed to technocrats with a scientific background in government (Vittori et al., 2023), and are more often consulted on science and technology matters than citizens from the other countries, as exemplified by the Consensus Conferences of the Danish Board of Technology. This might explain why Danes do not push for empowering scientific experts even further.
Finally, we are also cautious not to overinterpret the seemingly small differences in support for a more consensual style of governing between countries. The mean factor scores on this dimension are lowest in French-speaking Belgium, The Netherlands and Denmark, which are known for having competitive multi-party systems governed by broad coalitions. By contrast, the mean factor scores on politicians with a more consensual style of governing are highest in Austria and Ireland, which have traditionally been governed by four or five main parties that alternate in power. The findings may support the claim that multi-party systems with limited alternation encourage preferences for a more adversarial style of politics, while those with fewer parties and more alternation encourage a moderate center-seeking political culture (Mair, 1996). Yet, support for a more consensual style of governing is also higher in Finland, which has a competitive multi-party system.
We have shown that even if the battery forms coherent conceptions of who should govern that travel across the nine countries, these conceptions are not equally held by citizens from the nine countries. We attempted to explain some of the cross-national variation in support for the different dimensions, but these explanations remain tentative as the small number of countries prevents us from systematically testing the effects of contextual predictors.
Correlates of variations in process preferences
Significant results of the OLS regression analyses of citizens’ factor scores in the nine countries.
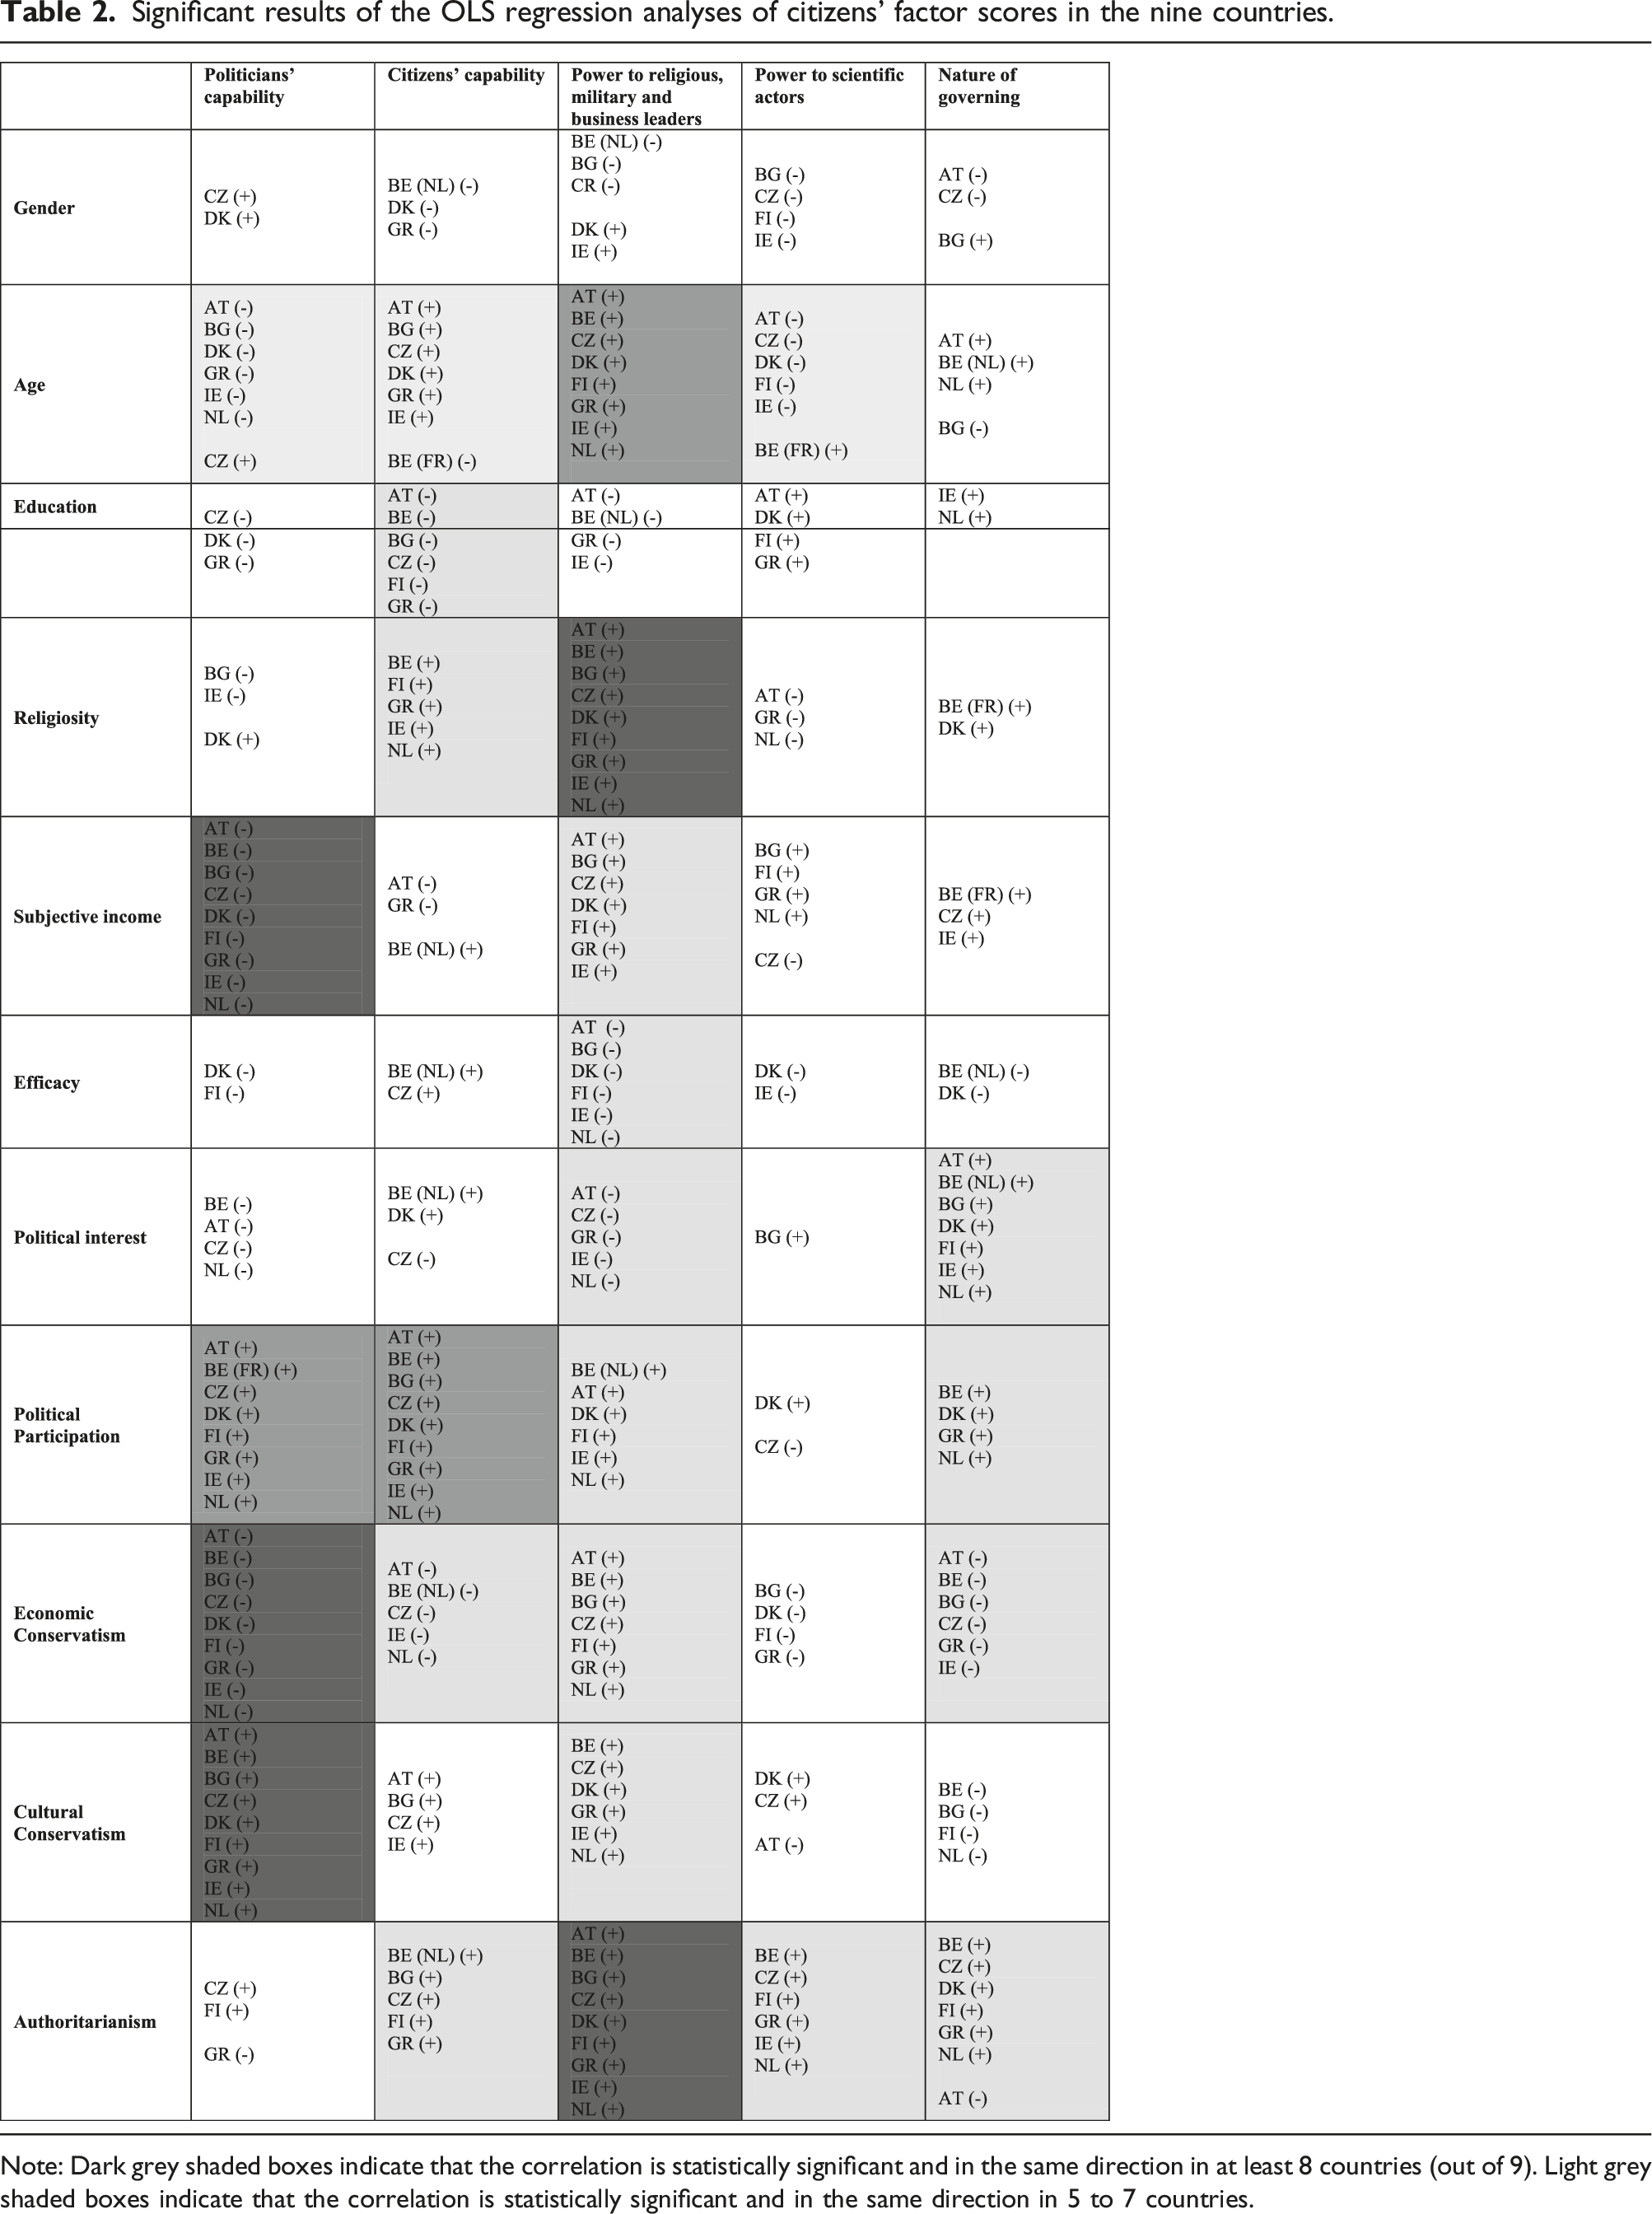
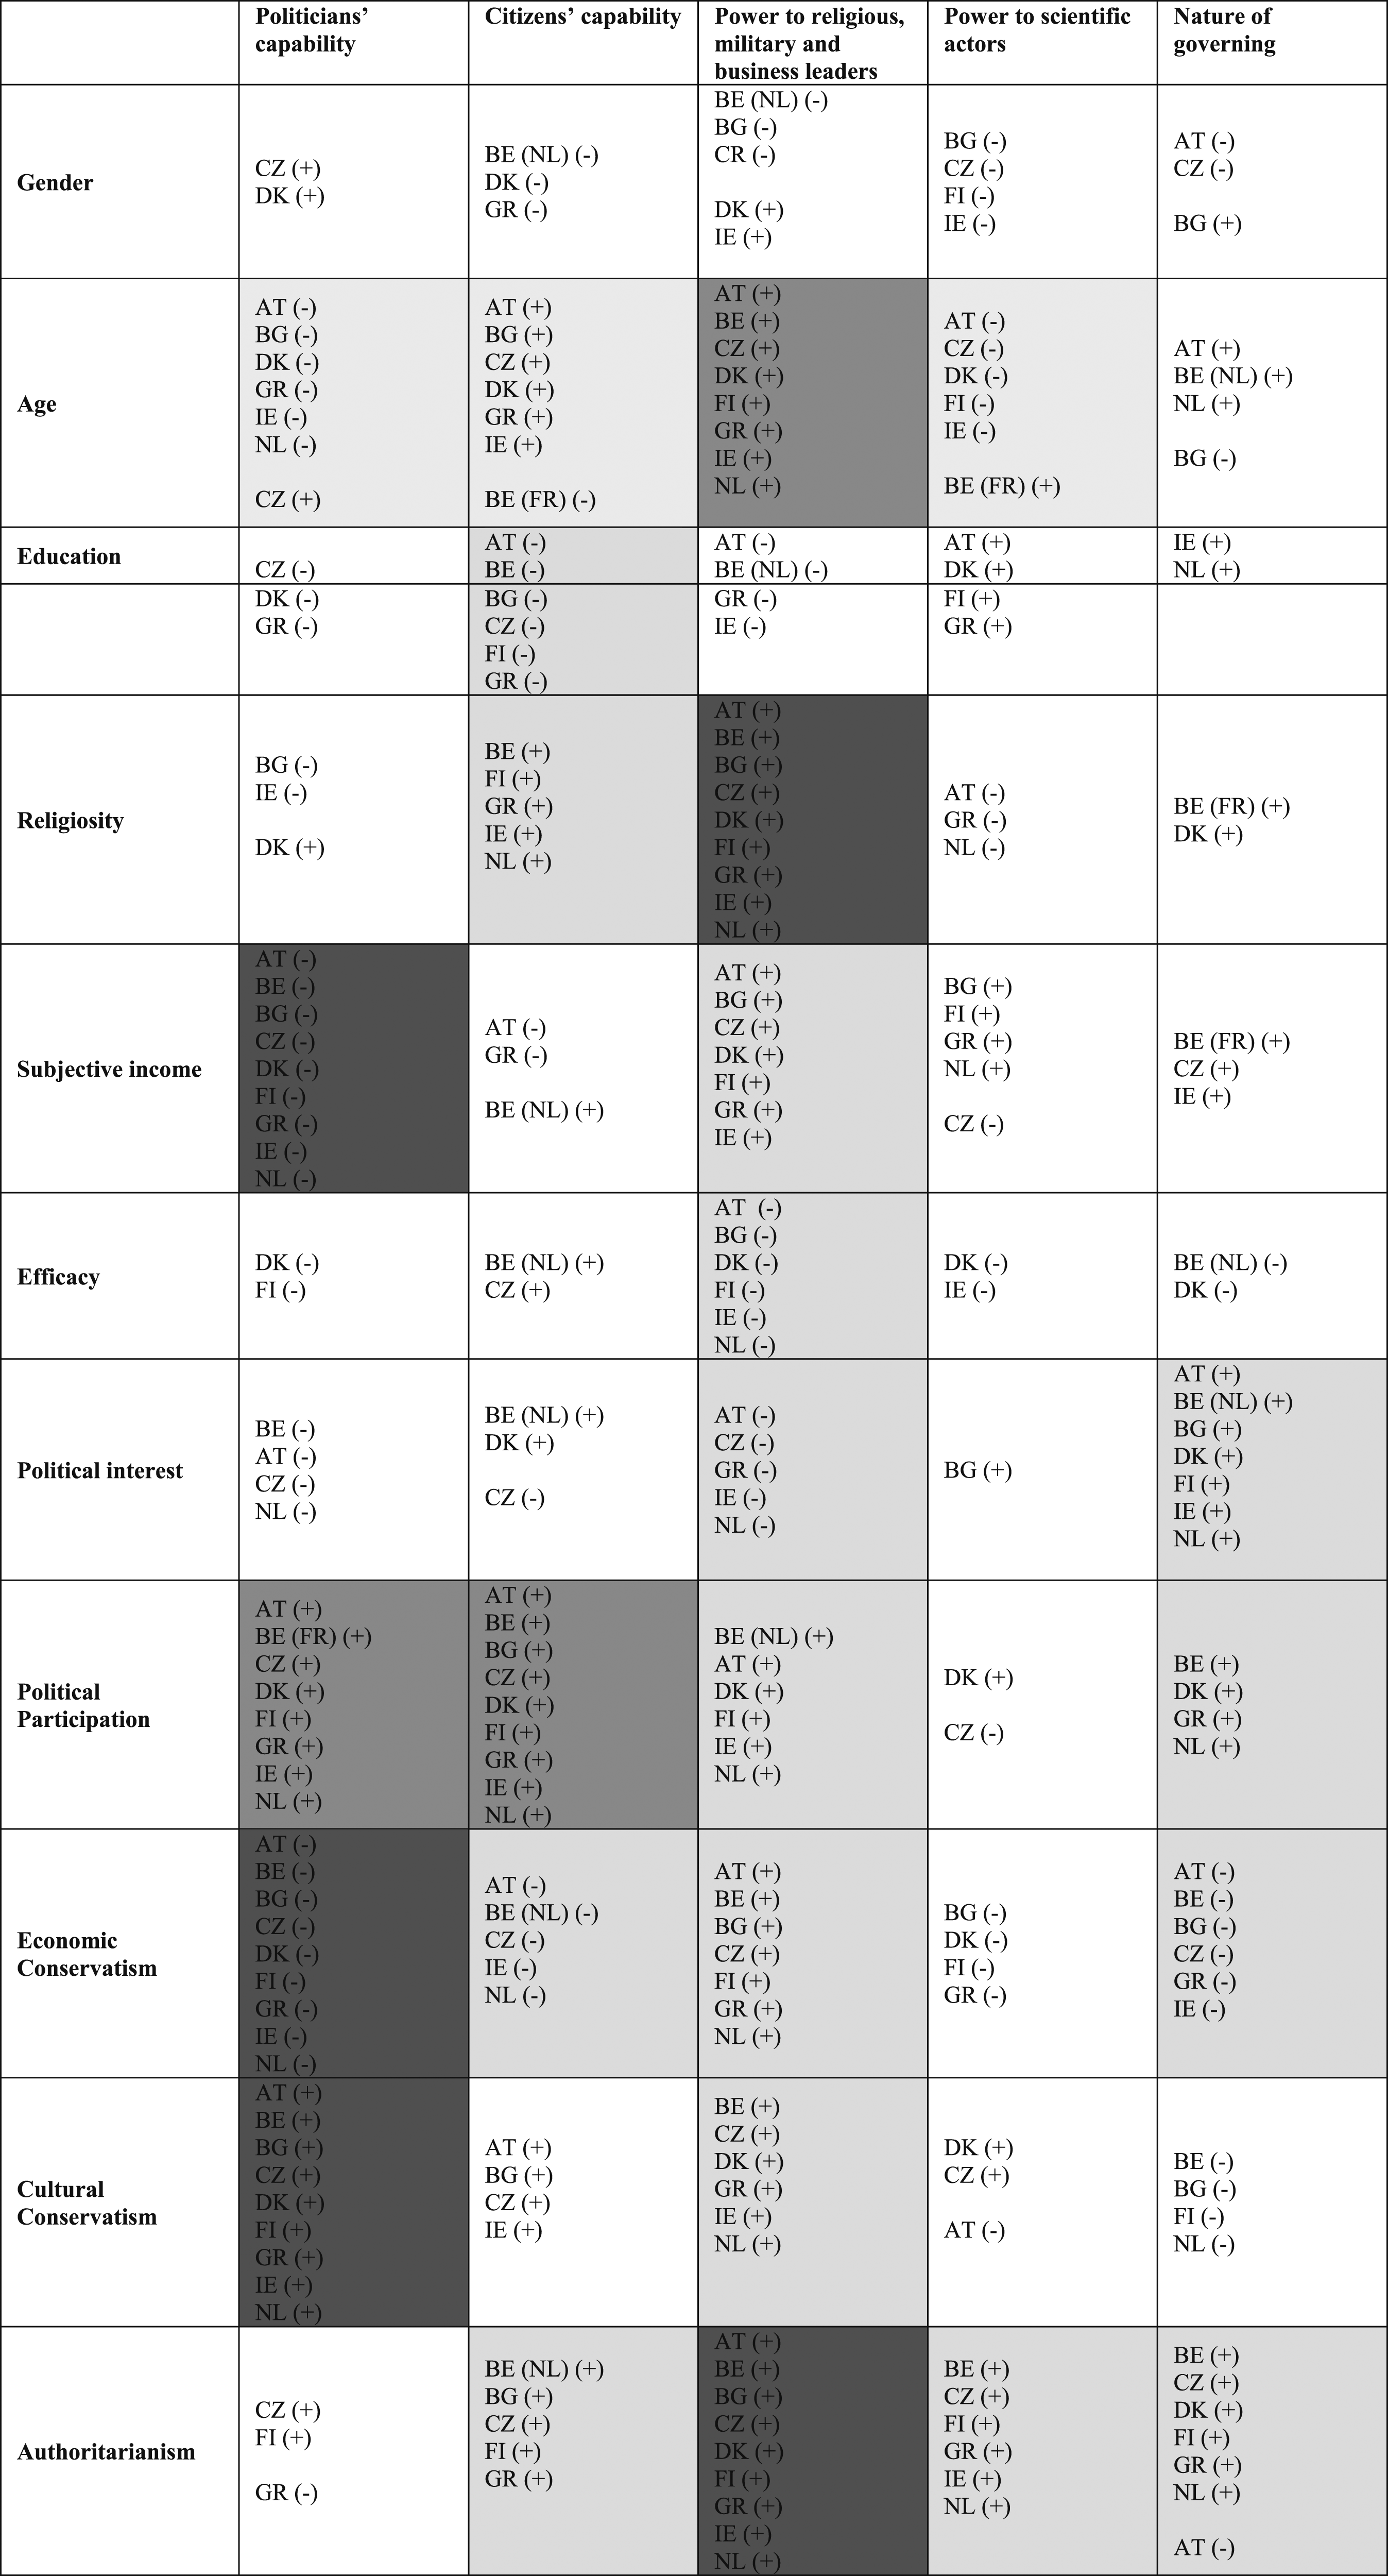
Note: Dark grey shaded boxes indicate that the correlation is statistically significant and in the same direction in at least 8 countries (out of 9). Light grey shaded boxes indicate that the correlation is statistically significant and in the same direction in 5 to 7 countries.
There are several observations to be made, the most striking being the relative consistency of the predictors across countries. There is only one association – between gender and giving more power to religious, military and business leaders – for which we observe statistically significant effects going in opposite directions across several countries. In most cases, however, the predictors go in the same direction, but are not always significant in all countries. This finding suggests, at first glance, that the profiles of citizens scoring high (or low) on each dimension are relatively similar across countries.
The results from Table 2 show that some of predictors, namely age, economic conservatism and authoritarianism, are useful for explaining support for most of the dimensions under study, while others are only associated with one or two dimensions. Starting with age, which is negatively associated to politicians’ capabilities and to giving a greater role to scientific experts in almost all countries but positively associated with citizens’ capabilities and to empowering religious, military and business leaders. Second, economically conservative respondents tend to be less critical of politicians in all countries, and more inclined towards delegating power to religious, military and business leaders (in seven countries). Thirdly, authoritarianism is associated with supporting a greater role for religious, military and business leaders in all nine countries.
Our measure of authoritarianism is based on one survey item capturing support for strong unchecked leaders. The fact that it is associated with support for empowering religious leaders, military generals and businesspeople might indicate that this dimension has an authoritarian component. In Supplementary Appendix 10, we have also tested whether the item on strong leaders might be incorporated into the 21-item battery on process preferences (as opposed to being included as a covariate). The results show that support for strong leaders does not form a separate dimension, but that its highest factor loading (0.36) is with the dimension on empowering religious leaders, military generals and businesspeople, suggesting that support for such profiles might indeed have an authoritarian component, at least for some respondents. Such findings stress the need to address more systematically, and with more items, the relationship between authoritarian attitudes and other process preferences in future studies. Integrating support for authoritarianism into the equation is all the more important given the recent rise and access to power of parties with authoritarian inclinations in Italy, Sweden, Hungary and Poland.
Other predictors of citizens’ process preferences also worth stressing, even if they are only significantly associated with one or two dimensions. Regarding the socio-demographic factors, for example, we see that subjective income is clearly associated to being more negative about politicians (in all nine countries), and to more positive views towards a greater role for religious/military/business leaders and experts. We also observe that higher educated citizens tend to be less positive about citizens’ capabilities in Austria, Belgium, Bulgaria, the Czech Republic, Finland and Greece, confirming studies about higher educated citizens’ skepticism towards instruments of direct citizen participation (Anderson and Goodyear-Grant, 2010; Coffé and Michels 2014; Pilet et al., 2022; Rojon and Rijken, 2021). Finally, as in the US, religiosity is positively associated with support for empowering religious, military and business leaders in all countries.
We found fewer statistically significant associations between citizens’ political attitudes and behaviors and their factor scores on the five dimensions. The exception is support for increasing the role of religious, military and business leaders, which is more often observed among citizens with lower levels of political efficacy and political interest. Political interest is also positively associated to support for a more consensual way of doing politics in seven countries. We finally observe that citizens who are more politically active are generally more positive about both politicians’ and citizens’ capabilities in almost all countries. This variable has, by contrast, almost no effect in Hibbing and colleagues’ study among US respondents. Distinguishing between institutional and non-institutional forms of participation shows that the former are especially related to support for empowering religious, military and business leaders, while the latter are more strongly related to support for citizens’ capabilities and for a more consensual style of governing (see additional analyses in Supplementary Appendix 9)
The results we have discussed show that the effects of our predictors tend to go in the same direction in most countries where the effects are statistically significant. While this might suggest that the profiles of respondents scoring high (or low) on each of the dimensions are relatively similar across countries, future studies might investigate the deviant countries or countries where there is no statistically significant effect. For example, why is it that political interest leads to higher scores on citizens’ capabilities in Denmark and Belgium and lower scores in Czech Republic? Future studies might also include a greater number of countries to more systematically test whether the effects of certain respondent characteristics and attitudes are common to European democracies in general or attributed to certain clusters of democracies (e.g. old vs. new democracies).
Conclusion
This study has tested the new battery of 21 items on citizens’ views regarding who should govern proposed by Hibbing et al. (2021) in an earlier publication of this journal. We have fielded it across nine European democracies. With this new study, we propose a dual comparison of citizens’ process preferences: between the US and Europe, and across several European countries with varying political systems and cultures.
The first and main findings is that, among Europeans, the new battery produces five dimensions. They relate to how citizens evaluate (1) politicians’ capabilities, (2) citizens’ capabilities, (3) the empowering of businesspersons, military generals and religious leaders, (4) the empowerment of scientific experts, and (5) the nature of governing (consensual vs adversarial). Unlike in the US, we do not observe a dimension related to giving direct power to the people, nor to empowering actors closer to citizens (with real-life experience, and no vested interest), which instead seems to be related to support for businesspersons, military generals and religious leaders. Interestingly, the same five dimensions have been found across the nine countries, meaning that it is along those lines that citizens are split in their preferences for who should govern.
The five dimensions also allows tapping into differences across countries regarding the dominant process preferences. For example, we observe some countries in which citizens are more positive about politicians (like in Denmark, Finland and The Netherlands), some countries where views tend to be more positive towards citizens (Denmark and Ireland), and some countries that are more positive on average towards giving a greater political role to scientific experts (Austria, Belgium and Bulgaria), or to non-traditional actors with experience outside of politics, such as businesspeople, religious leaders or military generals (Ireland, Dutch-speaking Belgium and Finland).
The next step in our analyses was to examine which factors were significantly associated with the five dimensions. In contrast to findings from the US, we observe statistically significant associations with several sociodemographic characteristics like age and income. Yet, similarly to the US, we found that the most significant associations are with general political attitudes (like political participation) and with ideological attitudes (economic and social conservatism and authoritarianism).
Overall, we believe that this replication contributes several important messages. First and foremost, it appears that the new battery could be a good starting point to study citizens’ preferences for who should govern, as it produces the same dimensions in all European countries. It also allows comparing citizens’ preferences across the Atlantic. We believe, in that respect, that our study is first an invitation for scholars to start from this battery and to extend the study of process preferences to other countries, ideally across different continents.
A question that should however be posed is whether it would be with the exact same battery of 21 items or with some adaptation. In our nine European countries, we have only observed five dimensions, meaning that the battery could be reduced to 15 items. Yet, our study is only the first replication of Hibbing and colleagues’ battery in other countries. It would still be wiser to test the full battery in a few more countries, potentially on other continents, before concluding that the battery could be shortened. We have also identified interesting connections between support for strong unchecked leaders and for the role of religious, military and business leaders. Therefore, future studies might try to expand the battery by including certain measures of authoritarianism. A last important element for future use of this battery is to adapt the wording of the three items capturing citizens’ evaluation of politicians’ capability. The three items used are all framed negatively. The direction of at least one of them should be changed.
Second, one might question how the dimension on the nature of governing should be articulated in relation to other dimensions of process preferences. Most of the dimensions refer to the qualities and merits of different actors in government while the nature of governing refers specifically to how politicians might adapt their governing style towards greater compromise and negotiation. Future researchers might think about items that reflect the role of deliberation in politics more broadly, rather than linking it specifically to the performance of politicians.
Finally, the battery proposed by Hibbing and colleagues has potential beyond identifying what could be the main dimensions of citizens’ process preferences. Another strength is that it simultaneously collects information about how citizens evaluate the political role of a diversity of actors. Using such a battery has two advantages compared to existing research. First, it goes beyond studies which have so far only focused on citizens’ preferences for three groups of actors: citizens, politicians and experts (see Webb, 2013; Bengtsson and Christensen, 2016; Font et al., 2015; Gherghina and Geissel, 2020). Second, as the battery does not ask citizens to declare which actors they prefer, but to simultaneously rate several actors, it has the potential for studying preferences for models combining different kinds of actors. Therefore, a next natural next step will be to make use of the battery to isolate groups of citizens with distinct process preferences, some of whom may have a strong inclination towards one actor, while others may be favorable towards a combination.
Supplemental Material
Supplemental Material - Who do Europeans want to govern? Exploring the multiple dimensions of citizens’ preferences for political actors in nine European countries
Supplementary Material for Who do Europeans want to govern? Exploring the multiple dimensions of citizens’ preferences for political actors in nine European countries by Jean-Benoit Pilet, Davide Vittori, Sebastien Rojon, and Emilien Paulis in Party Politics.
Footnotes
Declaration of conflicting interests
The author(s) declared no potential conflicts of interest with respect to the research, authorship, and/or publication of this article.
Funding
The author(s) disclosed receipt of the following financial support for the research, authorship, and/or publication of this article: This study is supported by H2020 European Research Council (grant agreement no. 772695).
Supplemental Material
Supplemental material for this article is available online.
Notes
Author biographies
References
Supplementary Material
Please find the following supplemental material available below.
For Open Access articles published under a Creative Commons License, all supplemental material carries the same license as the article it is associated with.
For non-Open Access articles published, all supplemental material carries a non-exclusive license, and permission requests for re-use of supplemental material or any part of supplemental material shall be sent directly to the copyright owner as specified in the copyright notice associated with the article.