
Abstract
In this article, we try to investigate which factors affect the visits to cultural heritage (CH), using Italy as a case study. We adopt a broad definition of CH including archaeological and historical sites, historical buildings and museums, focusing our attention on State CH. In our empirical analysis, we use a rather innovative indicator of CH value, that is, the monetary value of State CH, officially provided by the Ministry of Economy and Finance. Using these data, this article aims at evaluating if such monetary value has a significant role in stimulating visits to cultural sites for the years 1996–2010. We also control for other factors potentially affecting the number of visits to cultural sites, such as alternative tourist attractors and the regional performance in the tourism sector. To the best of our knowledge, this is the first study that attempts to investigate the effect of CH monetary value on cultural participation.
Introduction
In this article, we aim to investigate what factors affect the visits to cultural heritage (CH), using Italy as a case study. We adopt a broad definition of CH including archaeological and historical sites, historical buildings and museums, focusing our attention on State CH. More precisely, in our empirical analysis, we try to assess whether the quality of CH has a role in stimulating visits. We also consider other external variables related to demand and the presence of alternative tourist attractors that may affect the number of visits to CH.
For our analysis, useful insights come from the extensive literature on both cultural participation and cultural tourism, however ‘elusive’ is the definition of cultural tourism (Guccio et al., 2017a; Richards, 1996). In the economic literature, the interest for the investigation of the determinants of individual and social demand for CH is quite widespread from a theoretical as well as an empirical point of view (Ateca-Amestoy, 2013; Gil and Ritchie, 2009; Johnson and Thomas, 1992; Luksetich and Partridge, 1997). We address this issue from a specific empirical perspective: we focus on physical visits, leaving aside other forms of use such as the ‘virtual’ ones (Navarrete, 2013). Moreover, unlike most of the literature on culture participation (Ateca-Amestoy and Prieto-Rodriguez, 2013), we do not use survey data from CH visitors to investigate the role of individual features of cultural consumers, we rather pay attention to the effects exerted by the quality of CH and of the surrounding environment. Hence, looking at the attractive power of CH endowment and other tourist features in each Italian region, our research relates to the strand of literature studying the role of local resources to boost tourism and, more generally, the growth of local economies (Girard and Nijkamp, 2009; Herrero-Prieto, 2011; Richards and Hall, 2000).
A peculiar and innovative feature of this article is the variable used to capture the quality of CH. We employ the monetary value of State movable CH, officially provided by the State General Accounting Department (Ragioneria Generale dello Stato (RGS)) of the Italian Ministry of Economy and Finance (Ministero dell’Economia e delle Finanze). It has to be noted that, as will be explained later (‘Data sample’ section), data are available for 17 Italian regions out of 20. As a matter of fact, because of their special autonomy, three regions are independent from the ministry as for cultural matters, and thus their CH is not included in national policies. Though the role of quality to explain museum attendance has been explored in the literature (Luksetich and Partridge, 1997), to the best of our knowledge, this is the first study that employs monetary measures of value to investigate this effect.
A further element capturing our attention is the relationship between visits to CH and the tourism sector. We do not address the issue on whether visiting CH is the main motivation for travelling or just a collateral motivation (Cellini and Cuccia, 2013; Richards, 2002). Using a parametric approach, we rather try to assess if the quality of CH enhances visits to cultural sites, controlling also for several covariates, such as tourist attractors and the regional performance in the tourism sector. To explore the latter, we use a rather innovative variable, that is, the Data Envelopment Analysis (DEA; Charnes et al., 1978) efficiency scores computed at regional level for the Italian tourism supply (Cuccia et al., 2016). We assess the robustness of our empirical findings using different estimators and, also, controlling for stationarity in our data. We find that both the quality of CH and the efficiency of the tourism sector positively affect the number of visits to Italian State CH. Overall, our results are robust to the estimation model and the sample included in the estimation. These results are interesting as they can influence policies aiming at using cultural tourism to boost local development.
The analysis develops as follows. In the ‘Background’ section, a review of the literature on cultural participation and cultural tourism is provided. The ‘Data and methods’ section briefly presents the main features of our case study, that is, the Italian State CH, and describes the data and the empirical method. The ‘Results and policy implications’ section discusses the results obtained and policy implications. Finally, the last section offers some concluding remarks.
Background
There is an extensive literature trying to assess the demand function for culture. Most papers consider the demand for performing arts (see, e.g. Ateca-Amestoy, 2008; Seaman, 2006), and several studies concentrate on the demand for CH and museums (see, e.g. Brida et al., 2011). Fernández-Blanco and Prieto-Rodríguez (2004) suggest classifying these studies in two groups: the first group focusing on the identification of the socio-economic characteristics of museum audiences (Ateca-Amestoy and Prieto-Rodriguez, 2013; Fernández-Blanco and Prieto-Rodríguez, 1998, 2004), and the other one focusing on the estimation of the demand function (Gil and Ritchie, 2009; Johnson and Thomas, 1992; Luksetich and Partridge, 1997). As for the first group, Fernández-Blanco and Prieto-Rodríguez (1998, 2004) employ a multinomial probit model to estimate the role of socio-economic variables (sex, age, education, civil state, workload and income) to explain attendance to museums, among other types of cultural consumption. Specifically, they refer to the data of the National Survey on cultural consumption in Spain. Ateca-Amestoy and Prieto-Rodriguez (2013) contribute to the literature on cultural participation concentrating on the forecasting properties of regression models for arts participation.
Our study is in line with the second group of studies that focus on the estimation of the demand function (Gil and Ritchie, 2009; Johnson and Thomas, 1992; Luksetich and Partridge, 1997). Gil and Ritchie (2009) use a survey to assess the relationship between the image of a museum and visitors’ satisfaction. Specifically, they differentiate between residents and tourists and find the same positive effect on both groups, with differences in the definition of the image of the museum. Luksetich and Partridge (1997), using data from the US 1989 Museum Survey, estimate the demand function considering several socio-demographic indicators (income, age, sex, race and museum membership) to assess the characteristics of museums visitors. Their results are in line with most studies about cultural attendance (Ateca-Amestoy and Prieto-Rodriguez, 2013; Seaman, 2006): low elasticity of demand, lower museum attendance among minorities and possibility to use increased revenues from admission fees to enhance quality and stimulate new visitors. Luksetich and Partridge (1997) also consider the effect of museum quality, using as explanatory variables five dummies for the museums’ collection value (ranging from USD 100.000 to more than USD 1 billion) and the age of the museum. They find a positive association between attendance and their measures of quality.
Similar to Luksetich and Partridge (1997), in this work we also try to assess the effect of CH quality on visits. We focus on the attractiveness of cultural sites, without considering the socio-demographic characteristics of their ‘users’. The peculiarity of our approach is that we use the monetary value of State CH, officially provided by the Italian Ministry of Economy and Finance (RGS, 2012) 1 to indicate the quality of CH and, thus, to explain its capacity to attract visitors. 2 In this respect, our approach differs from most studies within cultural economics that have tried to assess the value of CH and museums.
As a matter of fact, the debate about the values of culture has characterized cultural economics. Several authors acknowledge the coexistence of a wide range of values: cultural, social, artistic, existence, option and bequest. These values, on the one side, justify public intervention and, on the other side, make it difficult to assess the value of culture and CH in particular (Frey, 1997; Grampp, 1989; Klamer, 1996, 1997, 2013; Throsby, 2001). In the case of CH and museums, Peacock (1994: 10) underlines the ‘difficulties of definition and measurement’ of the sector which is characterized by subjectivity of choices and the lack of complete inventory of museums’ stocks. 3 The need to identify these different values led to the development of various methods to assess the value of CH, museums, theatres and so on. These methods either directly ask visitors/participants’ assessment of the value (stated preferences) or infer it from their behaviour (revealed preferences). For a survey on this issue, see the work of Willis (2014). 4 The results of these investigations run often the risk of a bias in the selection of the sample whose preferences were ‘revealed’ through their choices about CH. Furthermore, it was possible that the answers ‘stated’, for instance, in contingent valuation studies, were influenced by the way the question was designed. Hence, these studies can be considered subjective as the assessment varies depending on the preferences of the people and the possibility to influence them.
In our analysis, we also include a series of environmental variables (such as sea, security, regional tourism sector performance, presence of UNESCO World Heritage site (WHS) related to aspects that can explain the attractiveness of a specific region for visitors. This last aspect is in line with several other studies on tourism that try to explain the capacity of a tourist destination (TD) to attract visitors. Therefore, the inclusion in our empirical analysis of tourists’ data (i.e. tourist arrivals) puts this work at the boundary of another strand of research that focuses on the link between tourists and cultural participation (Borowiecki and Castiglione, 2014; Brida et al., 2013, 2016; Cellini and Cuccia, 2013; Herrero-Prieto and Gómez-Vega, 2017). Using data for visitors in Italian CH sites during the time period 1996–2007, Cellini and Cuccia (2013) find that tourist flows positively affect the number of visits to the Italian CH State institutions. On the opposite standpoint, Di Lascio et al. (2011) look at the attractiveness of art exhibitions for tourists in Italy. They find a positive 1-year lagged effect of modern art exhibitions on tourism and a positive mild effect of contemporary art exhibitions on tourist flows, when their organization is continuous over time. They conclude that ‘temporary art exhibitions contribute to increase tourist flows if they are part of a structural characteristic of a destination’ (Di Lascio et al., 2011: 536). Borowiecki and Castiglione (2014) consider the relationship between tourism flows and cultural participation. Their findings confirm that domestic and foreign tourists are associated with different types of cultural activities. Zieba (2016) considers the relation between foreign tourists and performing arts attendance (such as opera and musical) and concludes that tourists affect attendance to opera, operetta and musical. The same author (Zieba, 2017) also studies the relation between culture and tourism considering the socio-demographic characteristics of Austrian tourists. Guccio et al. (2017b) find that a more cultural friendly environment, including pure cultural and leisure activities, helps TDs to take the most from tourists’ resources by increasing overnight stays of tourists.
Data and methods
Italian state CH: Institutions and organization
Italian CH is outstanding and spread out all over the country. 5 CH has always been the ‘core’ of Italian cultural policy, with responsibilities shared between the State and the decentralized levels of government – regions and municipalities. The State, through the Ministry for Heritage, Cultural Activities and Tourism (Ministero dei Beni e delle Attività Culturali e del Turismo (MiBACT)), is responsible for CH protection and for the management of several national heritage institutions. 6 These institutions include a rather heterogeneous set of museums as well as archaeological and historical sites, ranging from ‘superstars’ – such as Pompei or Uffizi – to minor CH with very few visitors.
A close analysis of MiBACT administrative organization is outside the scope of this article 7 ; however, it has to be noted that the management of State CH has been recently reformed. 8 The competences for archaeological and historical sites pertain to techno-scientific territorial structures (Soprintendenze) operating at the peripheral level, respectively, for Antiquities and for Fine Arts and Landscape. Larger museums enjoy special autonomy, while minor ones are grouped and run by Regional Museum Centres (Poli museali regionali). These institutions, in terms of visitors as well as of the value of their endowment, constitute the sample used in this analysis.
Data sample
The data sample employed for our empirical analysis refers only to State CH, because our monetary value indicator is available only for the State. As said before, our research question is whether the monetary value of CH, as captured by the official measure described below, has a role in stimulating visits to cultural sites, after controlling for other factors potentially affecting the number of visitors, such as alternative tourist attractors and the regional performance in the management of the tourism sector.
In our empirical analysis, we use a rather innovative indicator of CH value, that is, the monetary value of State cultural assets, officially provided by the Ministry of Economy and Finance (RGS, 2012) in the State accounting to measure the State patrimony. We consider only the monetary value of movable assets and, thus, we leave out immovable heritage. Though questionable, this is a necessary choice, due to the fact that measures of the monetary value of the immovable heritage are available only at the national level and not at the regional one.
Nonetheless, we believe that our measure still represents a good proxy for the value of CH in the Italian regions. In fact, the monetary value of immovable CH accounts for less than 20% of the total State CH value, implying that our indicator of movable heritage captures the largest part of the State CH value (RGS, 2012). Hence, even if some historical or archaeological sites in our sample do not have movable heritage, it is reasonable to assume that it should be randomly distributed among Italian regions. 9 Furthermore, in some specifications in our empirical analysis, we also include the number of UNESCO WHS in the region. This number should partially capture the endowment of immovable CH of Italian regions and, thus, the related effects on CH visits in the region. Therefore, we believe that our indicator can be considered a good proxy for the value of State CH to investigate its relationship with the number of cultural visitors.
This indicator can be considered a sound measure of the value of CH since it is officially used to evaluate State assets by RGS, that is, the institution responsible for the consistency and reliability of national accounts. The evaluation criteria are established by the Government 10 and are quite detailed. It is worth noting that these criteria recognize the peculiar features of movable CH with respect to ordinary goods and provide detailed indications to take into account such specificity. Moreover, the differences among the various types of movable CH (e.g. paintings, sculptures, books, documents, etc.) are also taken into account. Without entering into details, it could be, however, relevant to summarize the main features of the evaluation assessment. Firstly, it recognizes that the value of movable CH increases over time. The value is calculated through an algorithm including several inputs. More precisely, the value of each item is assessed taking into account: (i) an identification coefficient based on its characteristics and on its initial value when first included in the inventory (coefficiente di identificazione); (ii) the monetary appreciation rate provided by the National Institute of Statistics (coefficiente di rivalutazione; Italian Institute of Statistics (ISTAT)); (iii) the scientific appreciation coefficient based, among the other things, on the degree of conservation and quality (coefficiente di innalzamento di valore scientifico); and (iv) the market value derived from the prices of the most important auction houses (riferimento ai valori di mercato).
The method to assess this indicator is the same for all the Italian regions; thus, we can assume it captures reasonably well the differences in CH value (i.e. the source of variation exploited in the empirical estimate) among them. Overall, in our opinion, with the limitations of any proxy, the use of this indicator seems more reliable to test for the attractive power of CH compared to the widespread use of measures based upon the stated or revealed preferences of visitors themselves (e.g. Luksetich and Partridge, 1997). In fact, the use of our indicator in estimating the demand function should not be affected by endogeneity bias, not being based upon the valuation of visitors (i.e. the same cultural visitors in the dependent variable).
As already said, the above financial measure is available only for CH owned by the State and not for the CH owned by other public administrations or private owners. This is not very limiting, however, as the State is responsible for superstar museums, archaeological sites and monuments and, overall, ticket-paying visitors in State CH accounts for a considerable part of total CH visitors (MiBACT, 2014). Another potential drawback of our indicator of State CH value is that it is available (or, at least, it has been made available to the public) only for the last year in our sample (i.e. 2010). This implies that the variable CULTURAL HERITAGE in our empirical analysis is time-invariant. As will be discussed below, this entails a cost in the empirical specification. Nonetheless, the great majority of the variation in the CH endowment would come in any case from the variation across Italian regions, as the CH endowment within regions tends to be rather stable over a short period of time. Moreover, this variable is measured at the regional level, because for minor institutions it is available on a rather aggregate basis, 11 and disentangling the value for each institution is not feasible.
It is worth noting that this indicator of the value of State CH is not available for three Italian regions. They are de facto excluded because of the institutional arrangements that grant them special autonomy in many fields, including culture. 12 Therefore, our sample covers 17 Italian regions over the period 1996–2010: our data set is a balanced panel with 255 observations.
Table 1 provides a concise description of the variables employed in our analysis, along with the corresponding source for each variable. Then, Table 2 displays the descriptive statistics, while Table 3 indicates some specific descriptive statistics at the regional level.
Variable description.
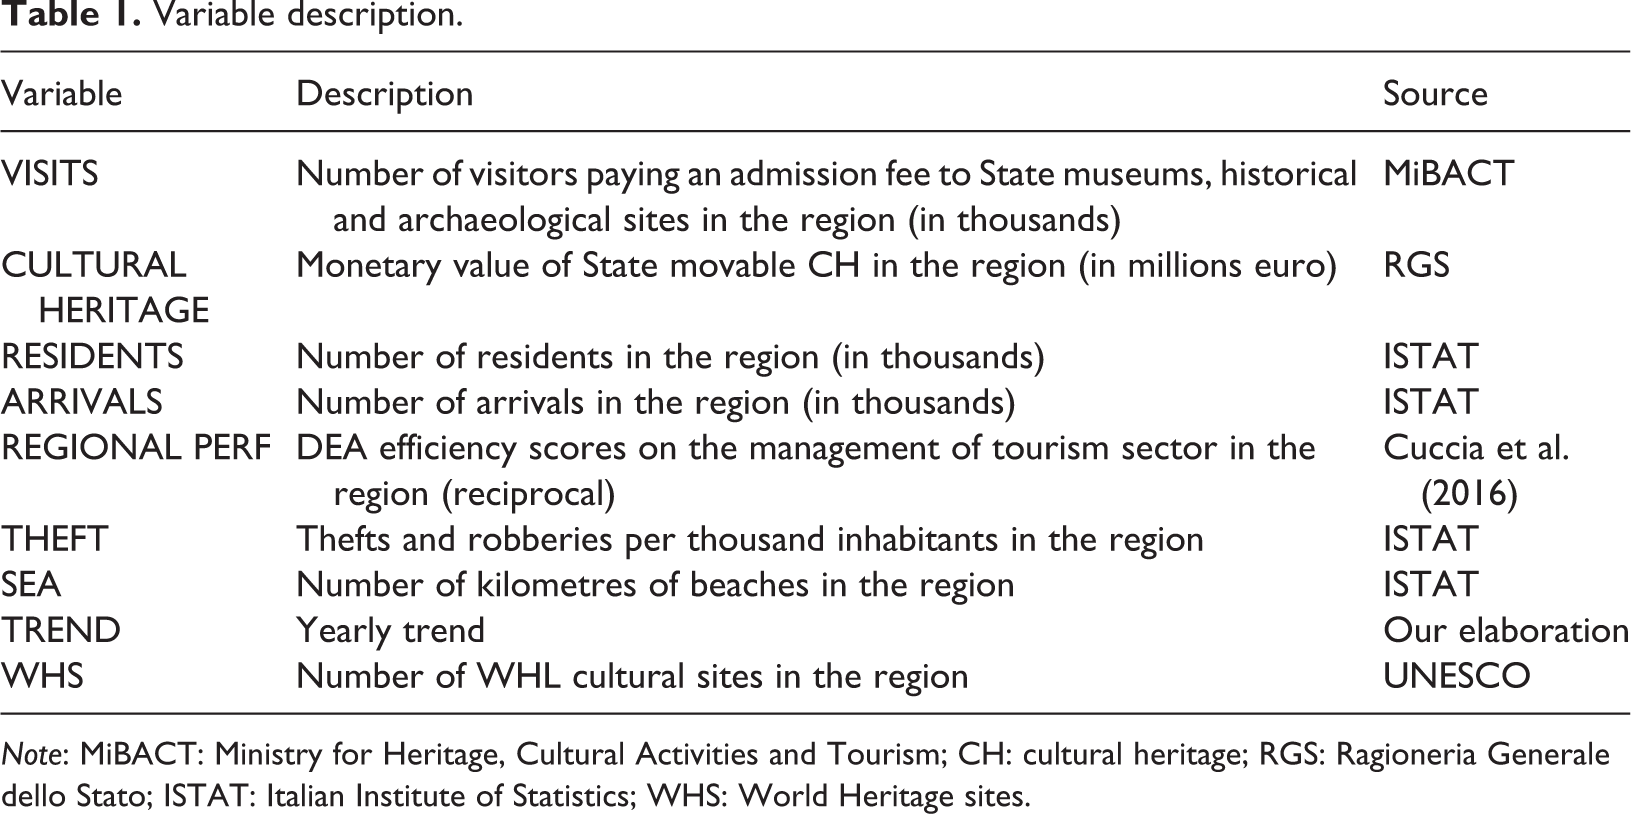
Note: MiBACT: Ministry for Heritage, Cultural Activities and Tourism; CH: cultural heritage; RGS: Ragioneria Generale dello Stato; ISTAT: Italian Institute of Statistics; WHS: World Heritage sites.
Descriptive statistics.
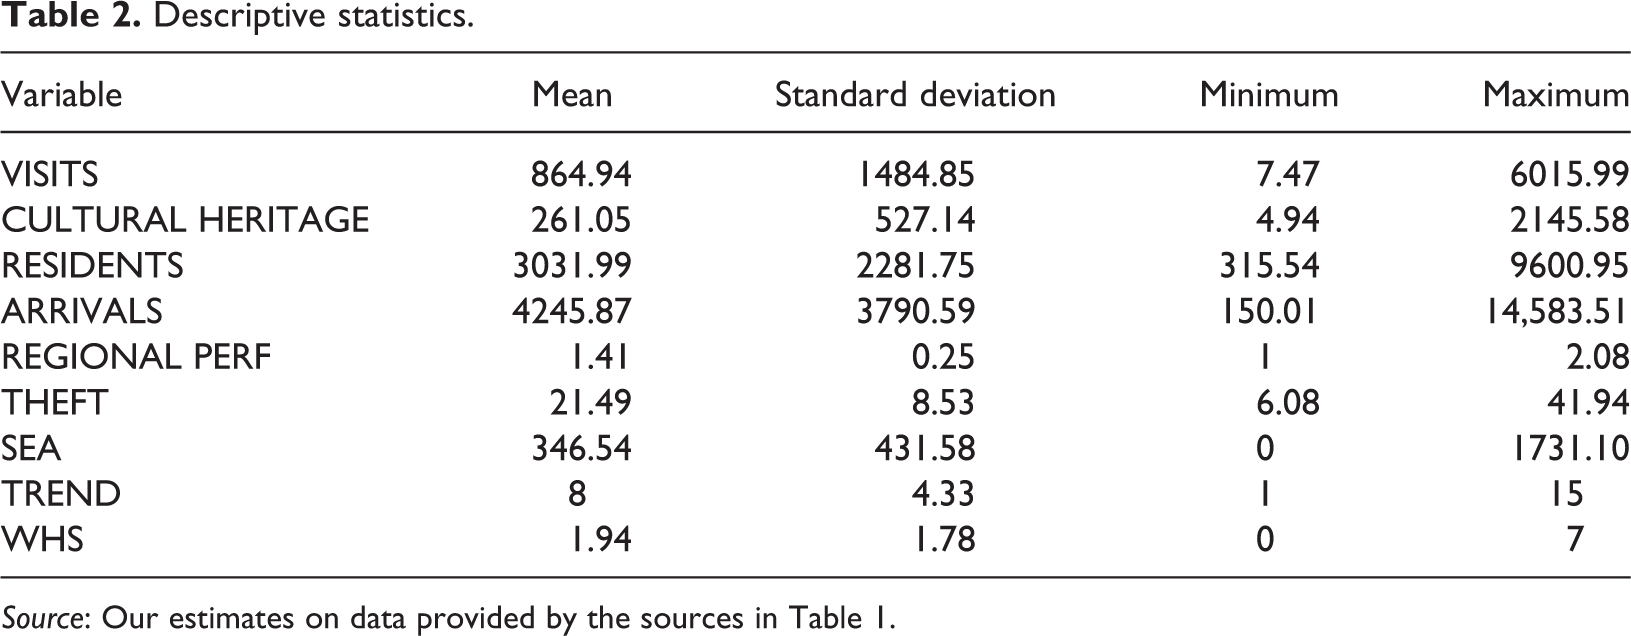
Source: Our estimates on data provided by the sources in Table 1.
Descriptive statistics by region (average values).
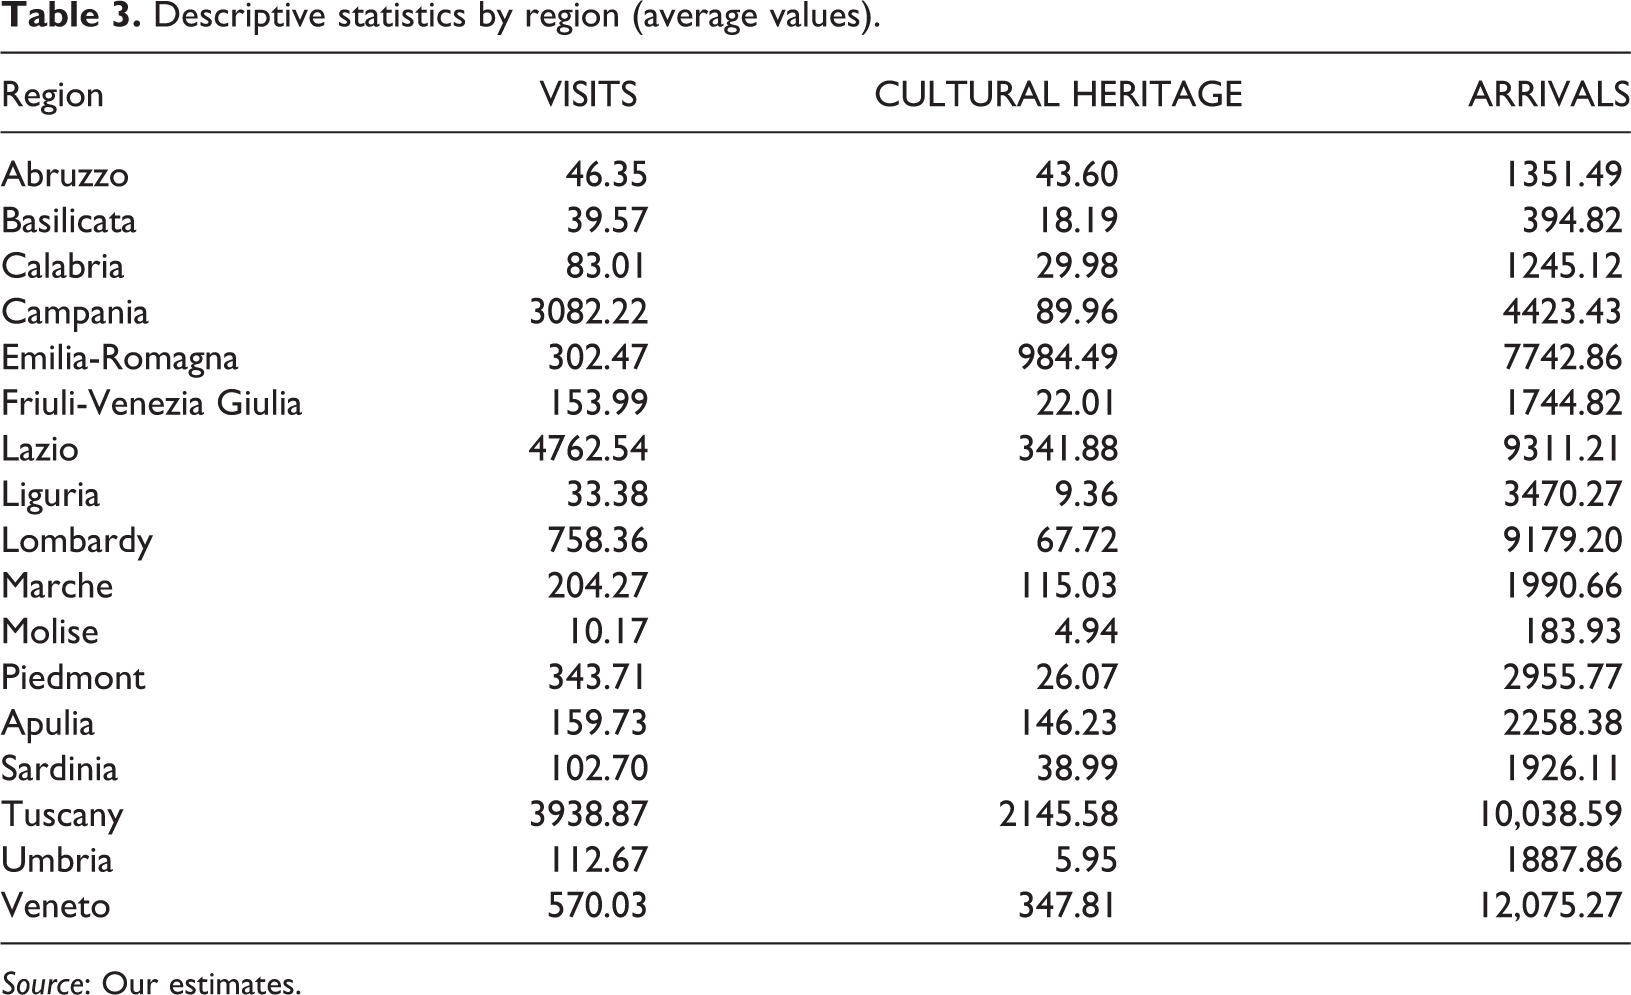
Source: Our estimates.
The dependent variable in our empirical analysis is the number of visitors to State CH paying an admission fee. We use this measure rather than the number of total visitors because not-paying cultural visitors are not accounted in some regions and, therefore, the total number of visitors would have provided a biased measure. For this reason, even if they are strongly correlated in our data set (ρ = 0.95), to avoid such a bias, we consider only the number of paying cultural visitors as the dependent variable. 13
As mentioned, our key explanatory variable is the monetary value of State movable CH provided by RGS (CULTURAL HERITAGE). To capture the effects of immovable CH, in a few specifications, we employ the number of UNESCO WHS. 14 Coherently with the time period of the analysis, we consider the cultural sites which had been included in the WHL by 2010. We have also weighted WHL cultural sites by the years of inscription, to take into account the importance of the listed sites.
In line with the literature (see, e.g. Herrero-Prieto and Gómez-Vega, 2017), we intended to include other variables representing regional cultural supply – for example, the number of theatres, presence of cultural festivals and the number of performances. However, to the best of our knowledge, these data are not available for the whole panel considered in our analysis. 15
To control for the effect of the efficiency in the organization of the tourism sector, in our empirical analysis, we also include an indicator of the regional performance in the management of the tourism sector (REGIONAL PERF) estimated by Cuccia et al. (2016). This is the regional bias-corrected DEA efficiency score, where each efficiency score indicates the relative performance of a regional organization to maximize the return from the tourism sector. 16 In this respect, we wonder whether a higher performance of the tourism sector at the regional level is significantly associated with more cultural visitors in the region. Indeed, this is quite an important issue from the policy perspective of cultural tourism, as it sheds some light on the question if the number of cultural visitors is also affected by the overall efficiency of the tourism sector.
More precisely, Cuccia et al. (2016) estimate DEA efficiency scores employing a Shephard’s (1970) output-oriented distance function and, consequently, efficiency scores assume values between zero (lowest efficiency) and one (highest efficiency). Instead, to increase the variance of the explanatory variable, here we employ a Farrell’s (1957) output-oriented distance function, that is, the reciprocal of the Shephard’s (1970) efficiency measure, implying that efficiency scores assume values between one (highest efficiency) and infinity (lowest efficiency). Therefore, a higher value of our indicator means a lower regional performance and, accordingly, the estimated coefficient of REGIONAL PERF has to be interpreted in reverse. 17
The other explanatory variables are provided by the ISTAT (Istituto Nazionale di Statistica), and their inclusion is based on the previous literature (e.g. Benito et al., 2014; Cuccia et al., 2016) and data availability. More precisely, the following variables are used in our regression: the number of residents (RESIDENTS) 18 and the number of arrivals (ARRIVALS) in each region, to account for the potential demand; thefts and robberies per 1000 inhabitants (THEFT), to capture the effect of an environment with high petty crime in the choice of visiting cultural sites; and kilometres of coasts (SEA) in each region, to control for the regional differences in cultural visitors driven by an alternative tourist attractor rather than CH. We also include a linear time trend (TREND) to take into account the time effects on the number of cultural visitors.
The descriptive statistics in Table 2 show high variation in the number of residents as well as in the value of CH, and in the number of cultural visitors and tourist arrivals. This is not surprising, as it is well-known that regions in Italy have very different size in terms of population. They also display very different scenarios in terms of CH endowment and tourism flows. In particular, from Figures 1 and 2 (see also Table 3), we can see that the regions with the highest value of CH, such as Tuscany, Lazio and Veneto, also show the highest number of cultural visitors. On the other hand, regions as Molise, Liguria and Basilicata, where the value of CH is rather low, tend to have also few cultural visitors.
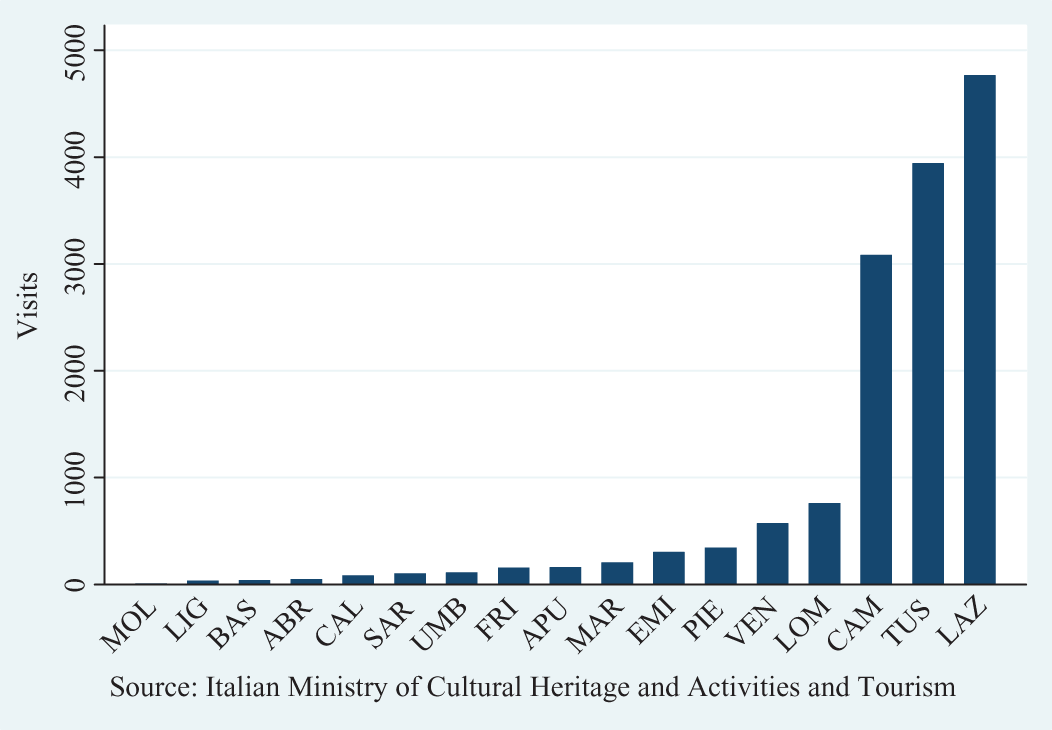
Number of visitors to State cultural sites in Italian regions (in thousands).
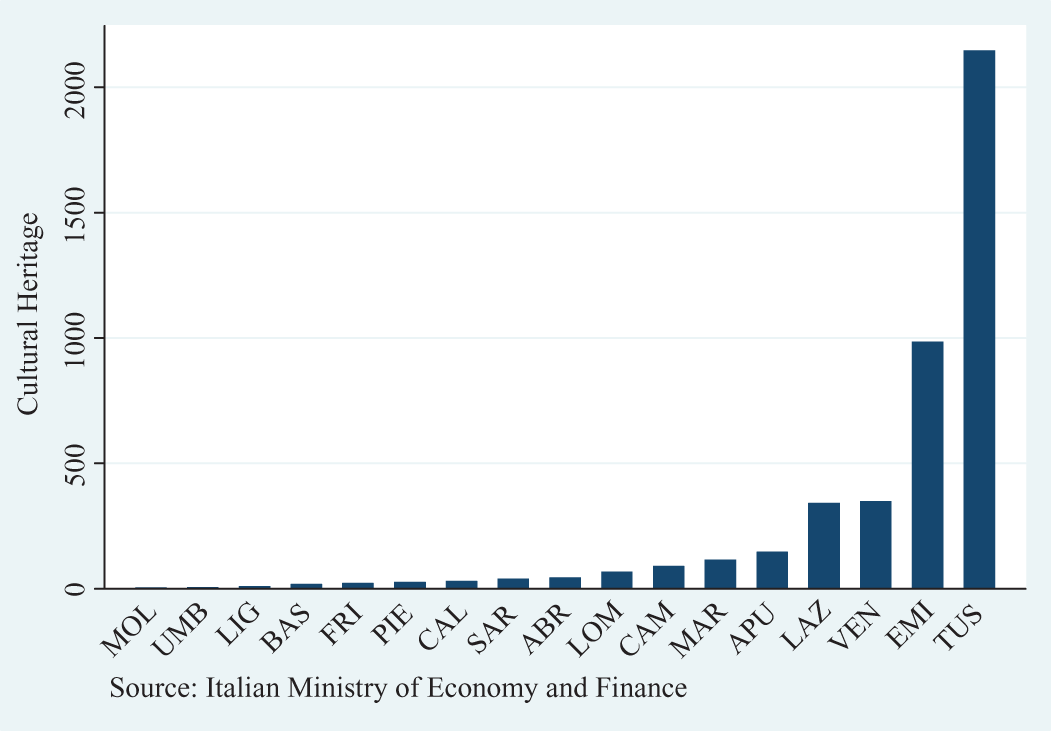
Monetary value of State movable CH in Italian regions (in millions). CH: cultural heritage.
Empirical specification
Since the available measure of CH value is time-invariant, for the characteristics of our data, no attempt is made to establish a causal link among the visitors and the monetary value of CH. Nonetheless, in the following empirical analysis, we try to provide a robust evidence of a significant association between them. We do this controlling for demand factors as well as for other potentially confounding factors, such as tourism flows, the regional performance in the management of the tourism sector and other environmental variables.
Therefore, the main specification of the empirical model is
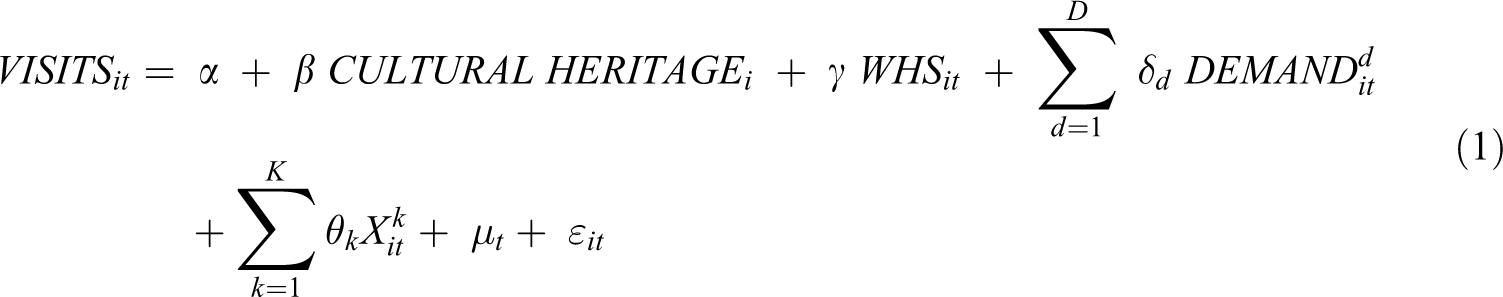
In our regression model, the dependent variable (VISITS) is the number of visitors paying an admission fee to State CH in region i in year t, and our main variable of interest (CULTURAL HERITAGE) is the monetary value of State movable CH in region i. Among the demand factors, we include the number of residents (RESIDENTS) and the number of arrivals (ARRIVALS) in region i in year t, which should represent the potential pool of cultural visitors in the region. We also consider the other above-mentioned control variables, such as the DEA efficiency scores in the management of the tourism sector (REGIONAL PERF) in region i in year t, the number of thefts and robberies (THEFT) in region i in year t, and the kilometres of beaches (SEA) in region i. 19 Finally, to take into account the time effects on the number of cultural visitors, we include a vector of year-specific fixed effects μt or, alternatively, a linear time trend (TREND). 20
We estimate different versions of our model, both considering our measure of CH alone, and along with the number of WHS. Specifically, we use a parsimonious strategy, starting from the baseline ordinary least squares (OLS) model with a limited set of explanatory variables to a more efficient generalized least squares (GLS) with all explanatory variables in equation (1), in order to provide the most robust evaluation of the relationship between the value of CH and the number of cultural visitors. Then, for each specification, we also provide estimates of the elasticity of cultural visitors (VISIT) with respect to the value of CH (CULTURAL HERITAGE). Finally, we provide a robustness check concerning the sample used in our estimates.
As preliminary evidence on the association between cultural visitors and the value of CH, in Table 4, we report the correlation coefficients between them in our data set, considering also the number of WHS as a further proxy for the value of immovable CH in the Italian regions. Not surprisingly, we can see that the number of visitors is highly correlated with our indicators of CH, both in terms of absolute values (Pearson correlation) and in regional rankings (Spearman’s rank correlation).
Correlation between visitors and CH.
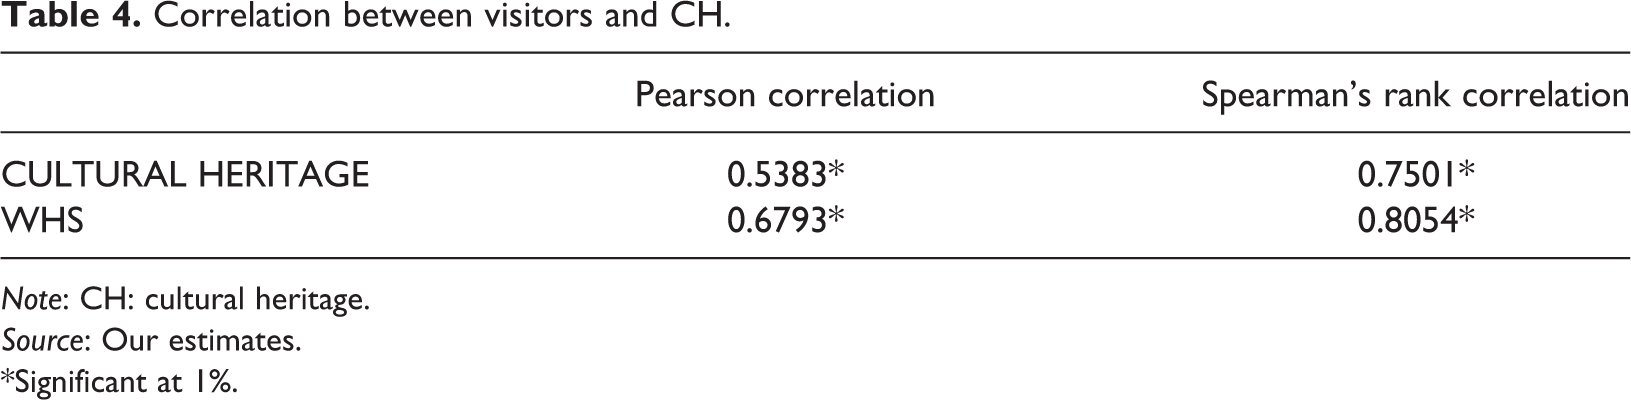
Note: CH: cultural heritage.
Source: Our estimates.
*Significant at 1%.
Before proceeding with the estimation, a preliminary point we need to look at concerns the fact that some of the variables employed in our empirical analysis, if taken as time series, are generally considered nonstationary stochastic processes integrated of order one I(1), implying that the standard statistical inference on the estimated coefficients in equation (1) cannot be considered valid. In particular, Cellini and Cuccia (2013) have shown that, if taken as monthly time series, the number of cultural visitors and tourist arrivals in Italy are nonstationary processes seasonally integrated of order one I(1). In our panel data set, the presence of the cross-sectional regional level smoothed the presence of the unit roots. Nonetheless, it may or may not be enough to eliminate the problem in our estimates and, therefore, we need to test the presence of unit roots.
Looking at the behaviour of our dependent variable over time in Figure 3, indeed, one could be tempted to conclude that, apart from few regions as Lazio and Veneto, the number of cultural visitors at the regional level does not represent a nonstationary process. However, our visual ability to detect nonstationary processes in Figure 3 might not be fully satisfactory. Therefore, in Table 5, we provide different standard unit root tests for panel data. In particular, all three unit root tests are constructed under the null hypothesis that the variable tested contains a unit root (Harris and Tzavalis, 1999; Im et al., 2003; Levin et al., 2002). 21,22 Overall, all three tests tend to reject the null hypothesis of the presence of a unit root in both the number of cultural visitors and tourist arrivals. Therefore, the results of these tests suggest that these variables in our panel data set can be consistently treated as stationary processes.
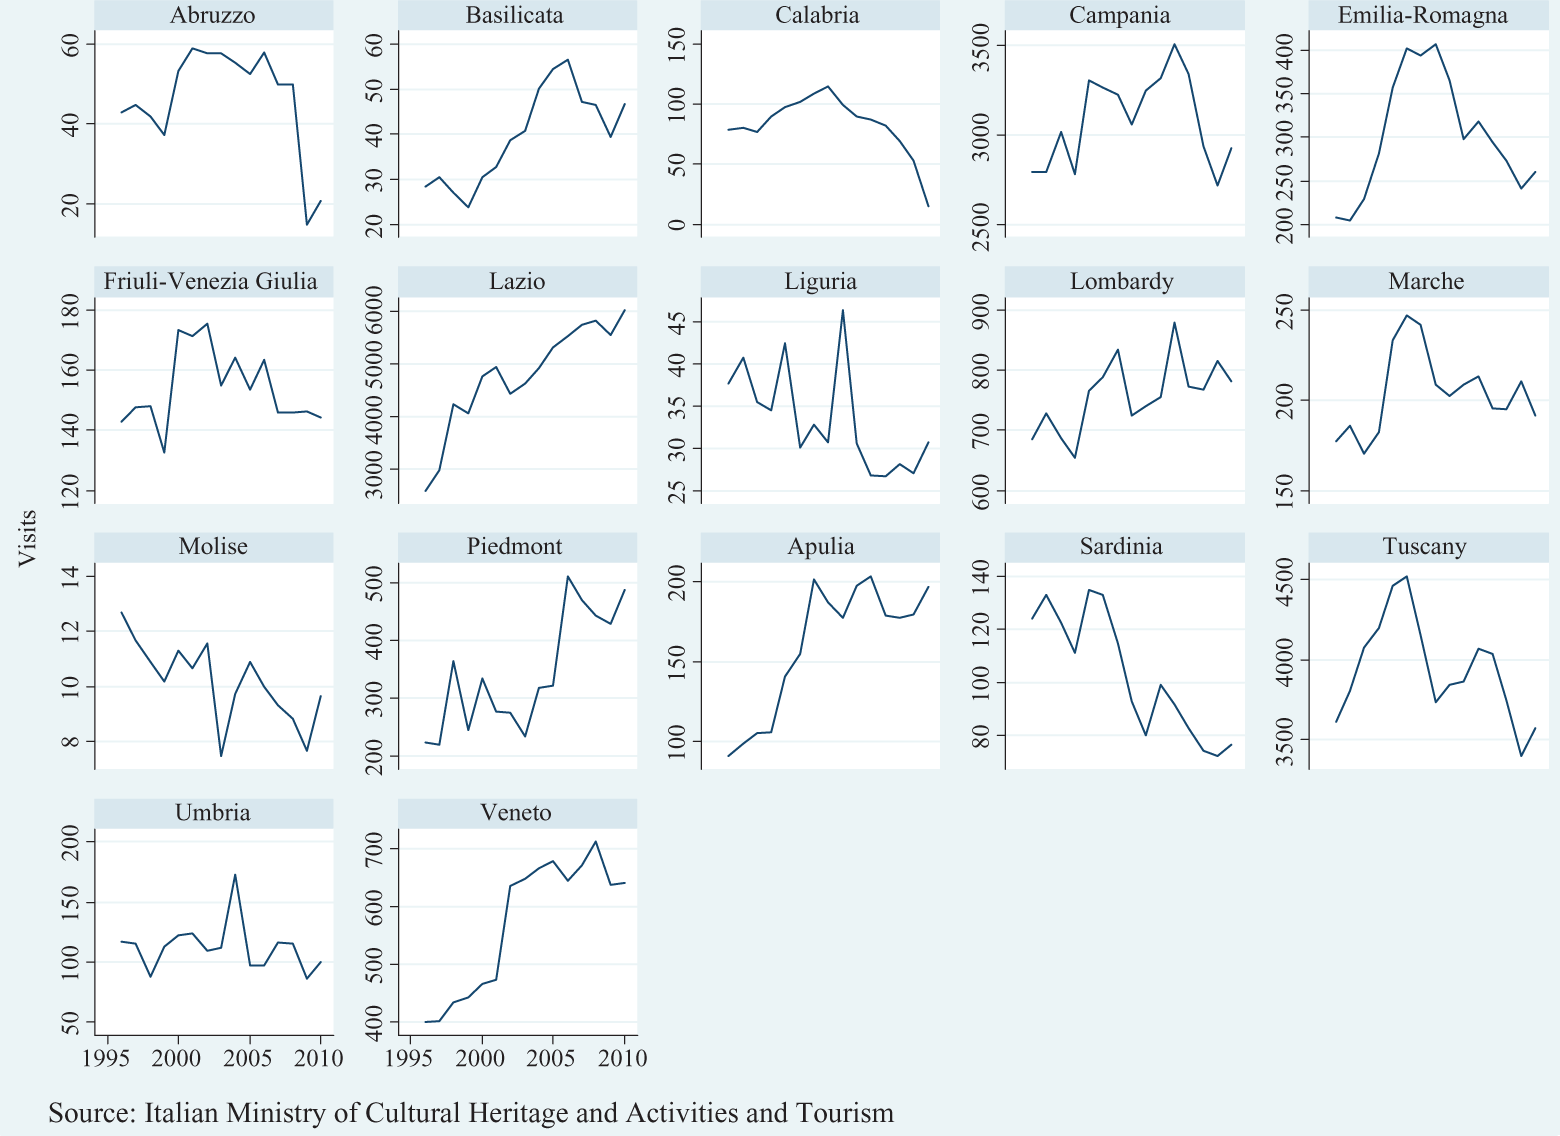
Trend of visitors to State CH in Italian regions in the years 1996–2010.
Unit root tests.
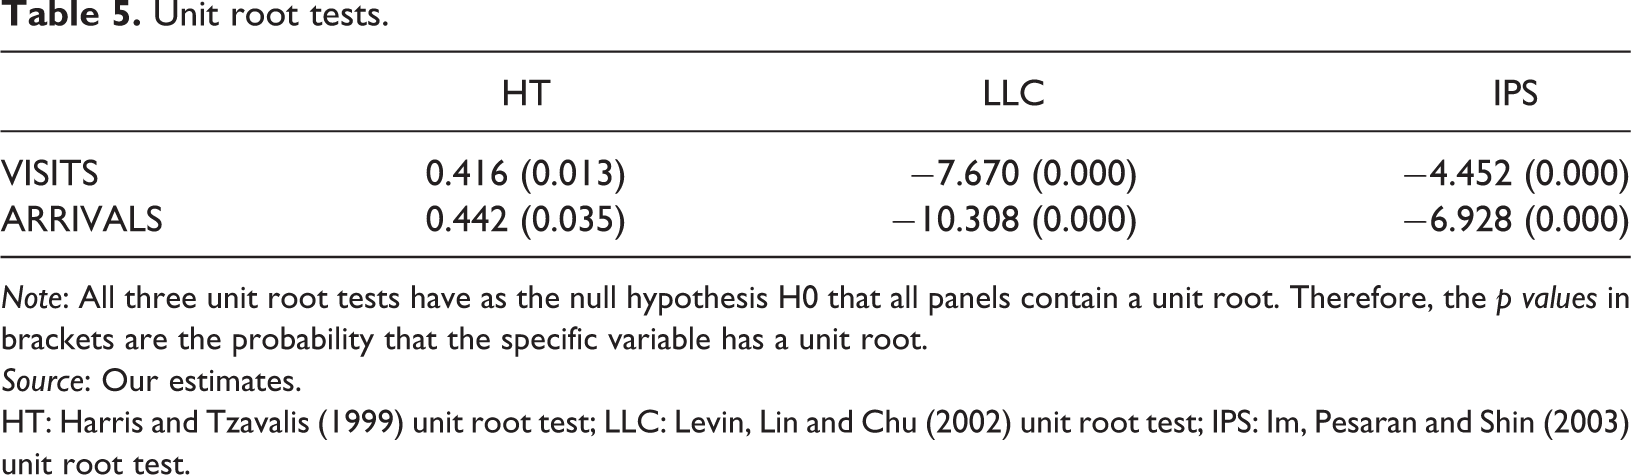
Note: All three unit root tests have as the null hypothesis H0 that all panels contain a unit root. Therefore, the p values in brackets are the probability that the specific variable has a unit root.
Source: Our estimates.
HT: Harris and Tzavalis (1999) unit root test; LLC: Levin, Lin and Chu (2002) unit root test; IPS: Im, Pesaran and Shin (2003) unit root test.
Results and policy implications
Discussion of the results
In this section, we discuss the main results of our empirical analysis, whereas in the next section, we highlight some policy implications of our findings. As we said before, we use a parsimonious strategy, in order to provide the most robust evaluation of the role of CH value in explaining the number of cultural visitors. More specifically, we start from the baseline OLS with a limited set of explanatory variables. Then, since we find, not very surprisingly, evidence of non-normal residuals, we move to a more efficient GLS for panel data with all explanatory variables in equation (1).
Table 6 shows the estimation results. In column (1), we estimate a simple OLS regression with only our main explanatory variable of interest, along with the constant and the linear time trend. The coefficient of CULTURAL HERITAGE is positive and significant, suggesting that, on average, an increase of a million euro in the value of CH is associated with about one point five thousand more cultural visitors in the region. Even if informative on the direction of the association, clearly a lot of omitted variable bias is likely to affect the estimate in (1). Therefore, from column (2) on, we add progressively more robustness to our estimate to test whether the significant association between the value of CH and the number of visitors holds when controlling for other factors.
Determinants of VISITS.
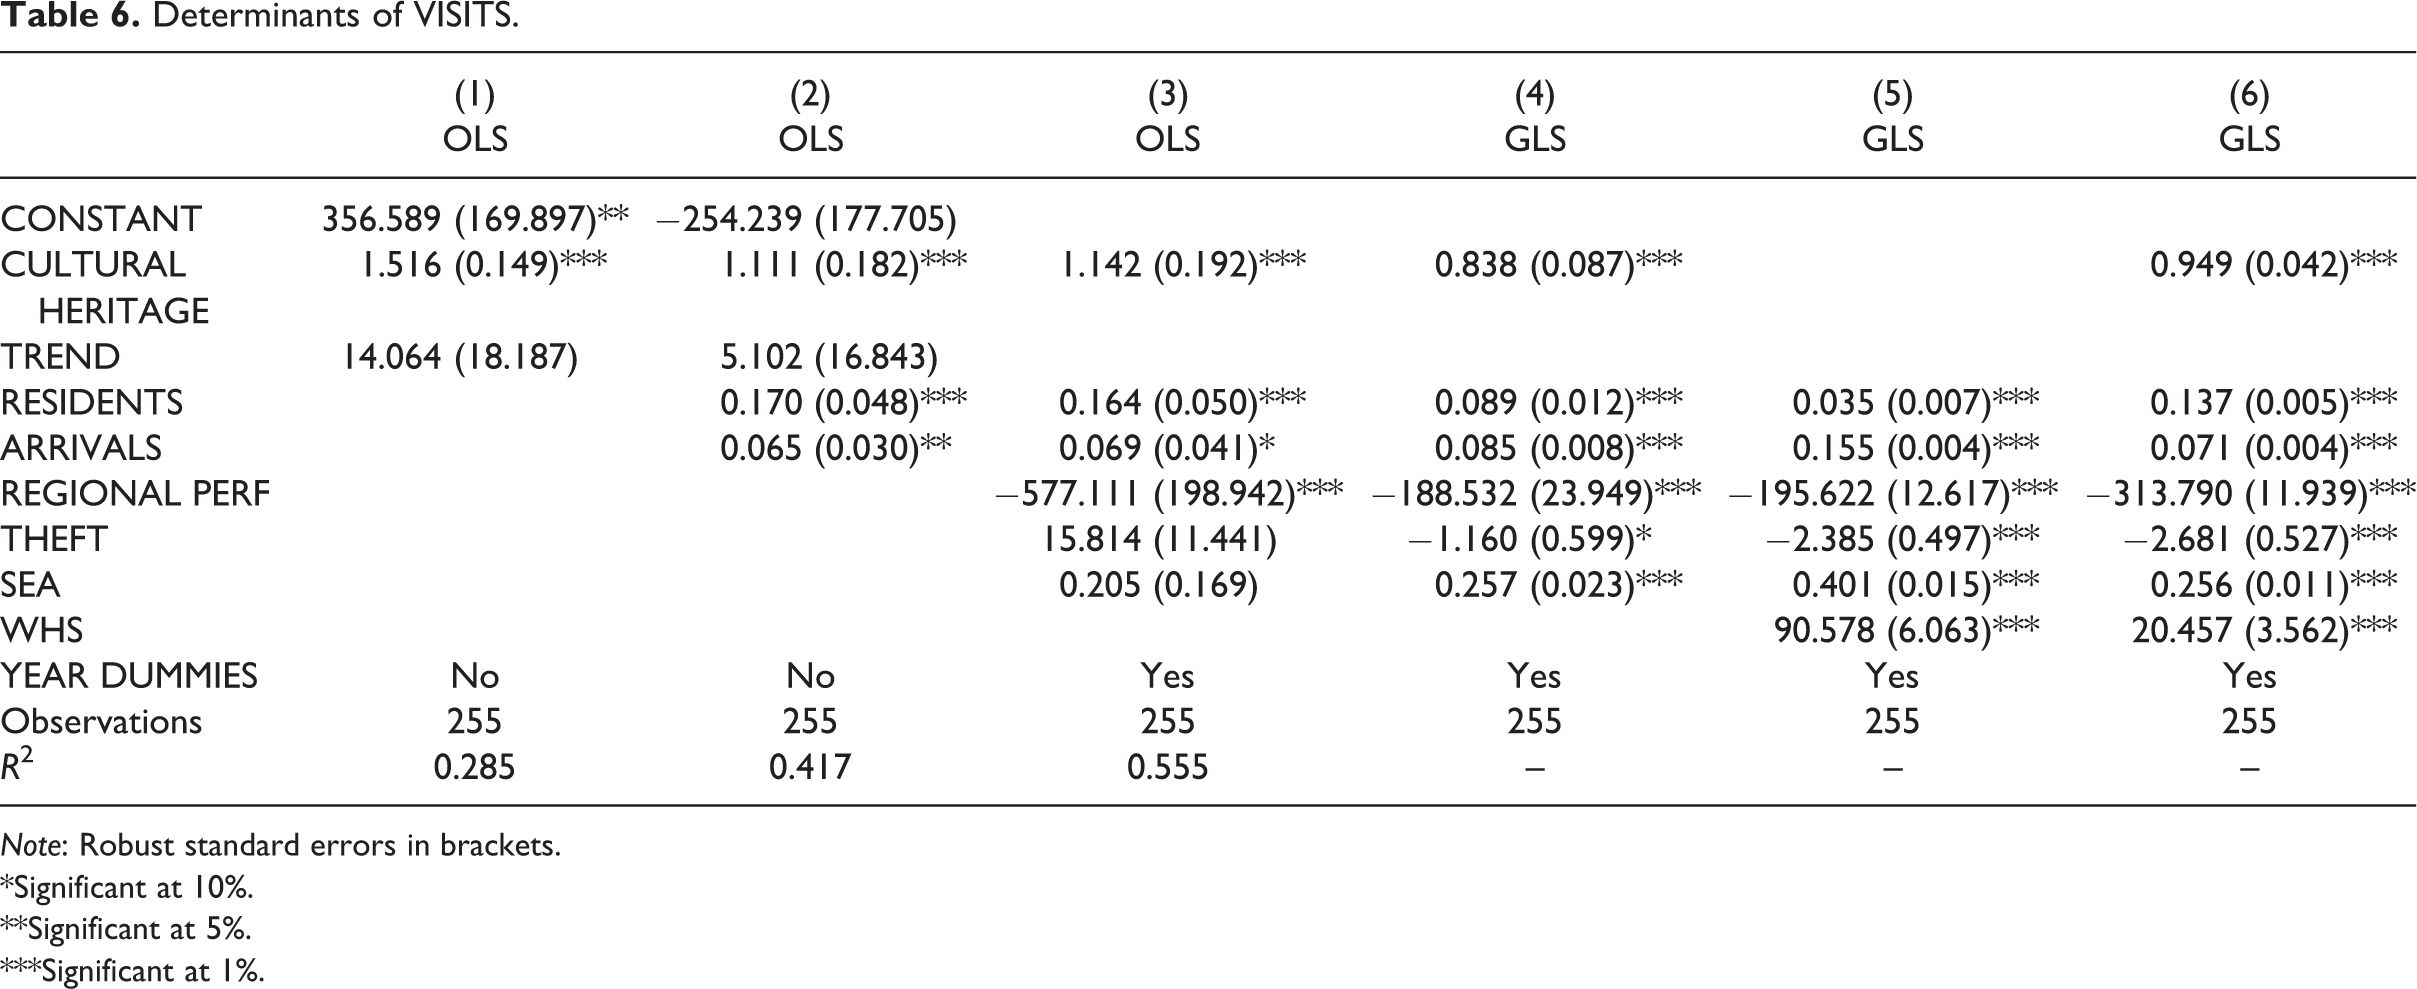
Note: Robust standard errors in brackets.
*Significant at 10%.
**Significant at 5%.
***Significant at 1%.
In column (2), we add the number of residents (RESIDENTS) and tourist arrivals (ARRIVALS), which should represent the potential pool of cultural visitors in the region, that is, the potential demand. 23 Both demand factors are positive and significant, implying that more residents and tourist arrivals are associated with more cultural visitors. As for tourist arrivals, our evidence is in line with recent empirical studies in the literature finding that, at least in the Italian context, tourism flows are among the most relevant determinants of visits to cultural sites (Cellini and Cuccia, 2013). Concerning the value of CH, the estimate in column (2) confirms the positive and significant association with cultural visitors, even if the magnitude is slightly lower.
Furthermore, in column (3), we add our indicators of regional performance in the management of the tourism sector (REGIONAL PERF) and of petty crimes (THEFT) as well as the kilometres of beaches (SEA) in the region, along with a full set of year-specific fixed effects. As we can see, the positive and significant coefficient of CULTURAL HERITAGE appears robust to the inclusion of these confounding factors and, interestingly, we also find that a higher regional performance in the management of the tourism sector is significantly associated with more cultural visitors in the region. 24
However, regression diagnostics for the OLS estimated models in Table 6 provide strong evidence of non-normal residuals. 25 Therefore, in the next columns, we estimate model (1) with a more efficient GLS estimator for panel data. 26,27 In particular, in column (4), we estimate the same specification (3) with GLS. Still, the coefficient of CULTURAL HERITAGE confirms the finding of a positive and significant association with cultural visitors, as well as do the coefficients of demand factors and the regional performance in the tourism sector. With respect to the previous estimates, however, we find that THEFT is significant and with the expected sign, implying that a higher level of petty crimes is associated with less cultural visitors in the region. We also find that SEA is positive and significant, suggesting that alternative tourist attractors could also have spillover effect on cultural tourism.
A potential drawback of our estimates is that, as we already discussed, our measure of CH considers only the movable assets and, thus, it leaves out the immovable heritage. Therefore, in the last two columns in Table 6, we include the number of WHL cultural sites (WHS), which should partially capture the extent of the immovable heritage in Italian regions. More specifically, in (5) we estimate the model with WHS in place of CULTURAL HERITAGE; instead in (6) we include both heritage indicators. Looking at (6), we can see that both coefficients are positive and significant, suggesting that the two indicators of CH are not substitute in explaining the number of cultural visitors. This is not very surprising, as the two indicators concern the movable and the immovable CH in the Italian regions. Furthermore, we have estimated the specifications (5) and (6) considering the number of WHL cultural sites weighted by the years they were nominated in the WHL (as a means of ranking their importance), getting results fully in line with those in Table 6, clearly with a lower estimated coefficient of WHS weighted by the years. 28
Overall, from our estimated coefficients of CULTURAL HERITAGE in Table 6, we can conclude that, on average, an increase of a million euro in the value of CH is associated with about one thousand more cultural visitors in the region. Then, for each specification, in Table 7, we also provide the estimates of the elasticity of VISITS with respect to CULTURAL HERITAGE, computed at the means of the independent variables. As can be seen from Table 7, the estimated elasticities range from 0.45 in the baseline OLS specification to 0.23 in the GLS estimate with all explanatory variables, saying that, on average, an increase of 10% in the monetary value of CH from the average endowment in the sample would increase the number of cultural visitors of about 2–4%.
Elasticities of VISITS.a
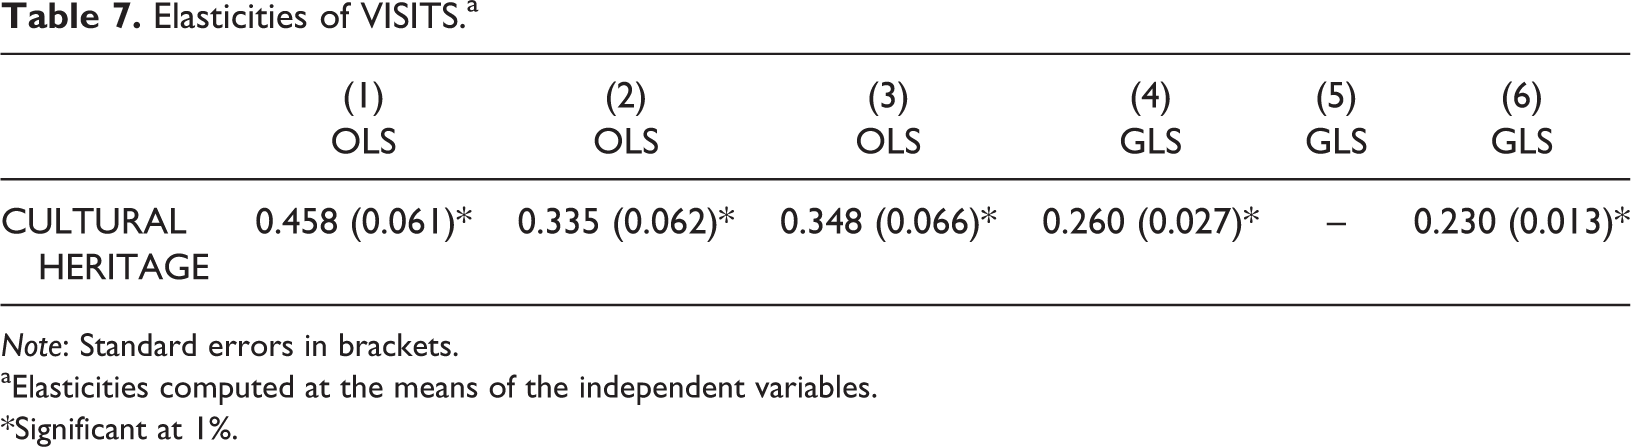
Note: Standard errors in brackets.
aElasticities computed at the means of the independent variables.
*Significant at 1%.
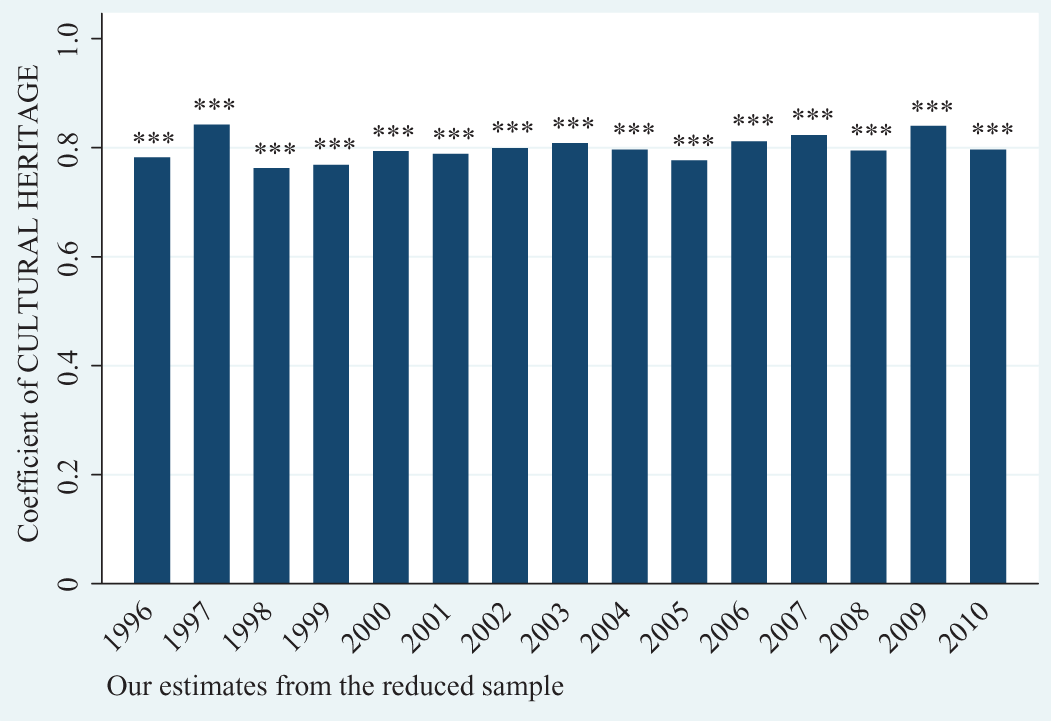
Finally, to check whether our results depend crucially on the inclusion of some regions and years in the sample, we re-estimate model (6) excluding all regions and years one-by-one. Therefore, we run many GLS regressions where in each regression we exclude, firstly, one different region and, then, one different year. Indeed, this further robustness check may be especially relevant for the issue of CH, since we have already seen in the ‘Data sample’ section that the value of CH is not homogeneous across Italian regions. Figure 4 reports the GLS coefficients of CULTURAL HERITAGE, arranged from the smallest to the greatest, from the regional reduced sample; then, Figure 5 reports the GLS coefficients from the yearly reduced sample. 29 As Figures 4 and 5 clearly show, however, our estimates do not depend on the sample included in the estimation, as the coefficient of CULTURAL HERITAGE is always positive and significant. 30
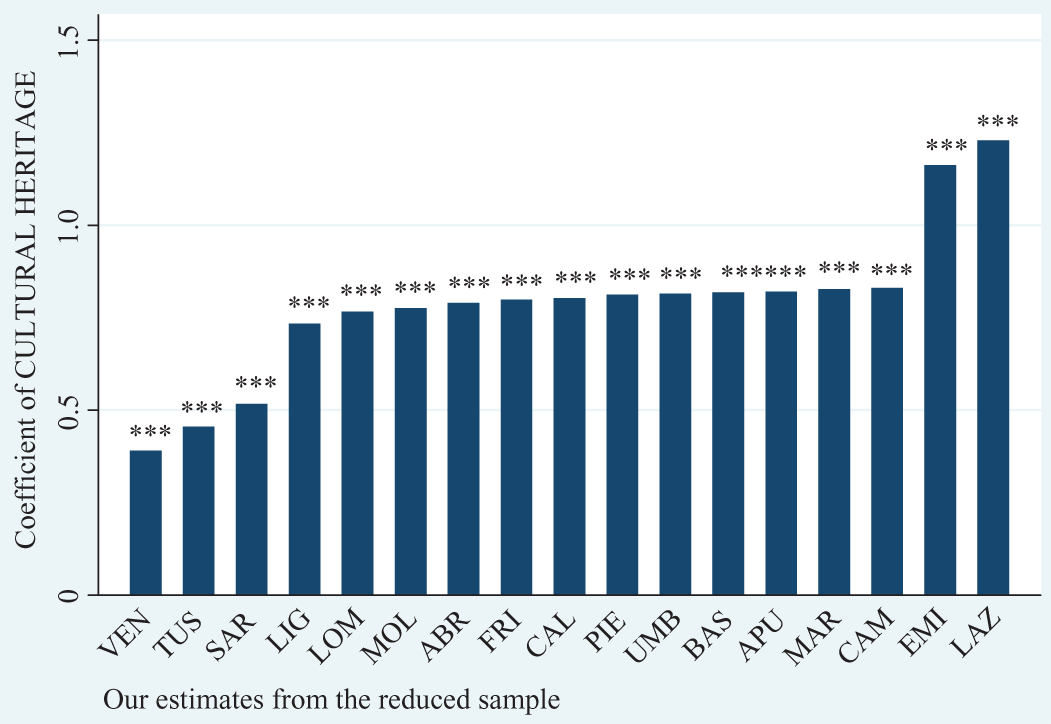
Coefficients of CULTURAL HERITAGE from the reduced sample (regions).
Coefficients of CULTURAL HERITAGE from the reduced sample (years).
Policy implications
Overall, from our estimates, we find evidence of a positive and significant association between the ‘quality’ of State CH, measured by its monetary value, and the number of cultural visitors, robust to the inclusion of many controlling factors, the estimation model and the sample included in the estimation. Furthermore, we interestingly find a significant association between the regional performance in the management of the tourism sector and the number of cultural visitors. These results suggest some implications as for the role of CH (and culture) to attract tourists and for the policies to adopt to boost tourism. First of all, in line with the previous literature (Borowiecki and Castiglione, 2014; Brida et al., 2011, 2016), our article shows that CH is attractive for visitors and, therefore, it is important to foster tourism and to enhance local development. However, to fulfil this objective well-designed policies are crucial.
The result about the impact of the presence of UNESCO WHS, namely the fact that the value of the estimated coefficient is lower for WHS weighted for the number of years, shows that the cultural endowment, even if it is outstanding, is not enough to attract tourists in the long term. In fact, competition increases through time, as it is demonstrated by the continuous enlargement of the WH List, and there is a need for policies capable to keep constantly high the attention on WH heritage (Stocks, 2000). Cultural tourists are increasingly interested in cultural experiences rather than only in visiting single sites (Bonet, 2013) and, therefore, coordinated policies are called for. In this perspective, Cuccia et al. (2017) have outlined the need for reducing vertical fragmentation – in the distribution of competences among different levels of government – and horizontal fragmentation among public, private and non-profit actors operating in a given area.
This argument of promoting coordinated policies finds further support in our result, which shows that the efficient management of the TDs contributes to attract visitors. Indeed, from the policy perspective, this evidence underlines that cultural visitors are not exclusively attracted by the value of CH in the region but also by the efficiency of the TD organization. Thus, coordination in policies can make a difference. The integrated tourism governance can favour the interaction between the public and the private sector and among cultural and tourism suppliers. This aspect is also related to the effect of the other variables considered in our study. In fact, an integrated offer can exploit the potential attractiveness of ‘sun and beach’ combining it to the attractiveness of culture in order to maximize the benefits for the region. At the same time, integrated policies in the area can help in reducing or eliminating the negative effects of crime, guaranteeing quality and security in the TD.
The outcome of the coordination of cultural and tourism policies might be boosted taking advantage of the opportunities offered by the use of technology. For instance, information about tourism facilities, accessibility, cultural services and products and Information and Communication Technology (ICT) applications for communicating heritage need to be provided extensively and systematically, in order to promote the cultural and tourism ‘system’ in a region rather than just the single identities within it.
Concluding remarks
A widespread issue in the literature on cultural tourism concerns the role of the quality of CH in attracting visitors. Exploiting the availability of an official indicator of State CH monetary value in the Italian regions, in this article, we have tried to investigate empirically whether the quality of CH has a role in stimulating cultural visits. Indeed, this is a peculiar feature of our empirical analysis; as such a monetary measure of CH value is quite uncommon in the literature. Moreover, the Italian context is particularly well-suited to address this question as, on the one hand, Italian CH is among the most remarkable in the world and, on the other hand, there is much heterogeneity across Italian regions in terms of CH endowment and cultural tourism. We have also controlled for the effects of the performance of the tourism sector on the number of cultural visitors.
From our empirical analysis, we find that, after controlling for demand and other confounding factors, a million euro more of CH is associated with about one thousand more cultural visitors in the region, robust to the estimation model and the sample included in the estimation. Our estimates also provide evidence of a significant relationship between the regional performance in the management of the tourism sector and cultural visitors.
Even if not conclusive, our study offers a new contribution to the literature on the determinants of cultural visitors. In particular, the use of an ‘official’ monetary measure of the value of CH in our analysis, instead of a measure based upon the stated or revealed preferences of visitors (e.g. Luksetich and Partridge, 1997), seems a more reliable way to test the attractive power of CH, as the estimate of the demand function should not be affected by the endogeneity bias of the visitors’ experience. In this respect, the results provided in our article appear to complement and strengthen the previous evidence on the relationship between CH and cultural visitors. Moreover, our findings on the role of the regional performance of the tourism sector offer insights from a policy perspective, suggesting that the number of cultural visitors is not exclusively due to the value of CH in the region but, indeed, there is a significant role for the efficiency of the regional organization in boosting cultural visitors.
To conclude, we believe that in this study, we have provided a more reliable and robust evidence of the relation between the quality of CH and cultural visitors, especially thanks to the use of our ‘official’ monetary measure of CH in the Italian regions.
Footnotes
Acknowledgements
The authors would like to thank Raffaele Scuderi, Stephen Wanhill and three anonymous referees for their helpful and constructive comments. The authors would also like to thank Roberto Cellini, Tiziana Cuccia and the participants of the Workshop on Local Resources for Tourism: from Impact to Growth at the Kore University of Enna for providing helpful comments.
Declaration of conflicting interests
The author(s) declared no potential conflicts of interest with respect to the research, authorship, and/or publication of this article.
Funding
The author(s) received no financial support for the research, authorship, and/or publication of this article.