
Abstract
Airbnb is arguably the world’s most popular accommodation sharing platform. Its impact on demand and supply within the tourism and hospitality industry is nowadays unquestionable. The present study delves into inspecting the efficiency of Airbnb listings of European cities, as, in spite of the success of Airbnb as a whole, it cannot be presupposed that all listings are equally successful. More specifically, data envelopment analysis (DEA) is employed in this first comprehensive benchmarking attempt within the domain of the sharing economy to date. This article also makes a contribution to robustness by introducing an interactivity note to the base model, thus, inspecting the results for corroboration/discrepancies and going beyond the static analyses that are common in DEA modeling. Ultimately, this is done with the goal of highlighting opportunities for inefficient Airbnb listings to properly utilize their inputs and therefore become more competitive.
Introduction
In line with standard microeconomic theory, tourism supply and tourism demand determine the prevailing price(s) in the tourism economic market. The tourism demand side consists of a multitude of different consumers who are the target group of marketing campaigns of destination management organizations (DMOs), which try to influence consumers’ decisions. On the other hand, the tourism supply side involves a number of diverse stakeholders located at a destination such as DMOs, the accommodation sector, the food and beverage sector, and attractions. All these stakeholders are also interconnected and have an influence on the destinations’ attractiveness and success. Likewise, Airbnb listings are a part of the accommodation sector, which also influence the attractiveness of a destination by providing different nontraditional accommodation options such as staying at a villa or a castle. Moreover, Airbnb is probably one of the most known examples of the sharing economy, which has certainly restructured the accommodation sector in destinations throughout the world.
The sharing economy, also called collaborative consumption/peer-to-peer (P2P) economy, is about individuals sharing by renting, lending, trading, bartering, or swapping goods, services, transportation options, space, or money (Möhlmann, 2015). Despite the fact that sharing is an old phenomenon, collaborative consumption started in the Internet age (Belk, 2014). The dynamic growth of the sharing economy is a result of increased use of the Internet, which has made the connection between demand and supply cheaper and easier. This has created new types of consumers and producers of products/services, which has resulted in new markets that had not been previously seen as monetizable (Geron, 2013). The interesting thing about the sharing economy is that consumers now have access to resources provided by their peers, rather than by companies. Thus, it is also defined as “access-based consumption”, because market-mediated transactions mostly take place without any change of ownership being necessary (Bardhi and Eckhardt, 2012). For instance, individuals do not have to purchase a car or a bike but instead can use car or bike sharing. Thus, there is no change in ownership as the system provides access to the services or goods for a period of time.
In general, the products and services in the sharing economy range from accommodation (e.g. Airbnb, Couchsurfing), car/ride sharing (e.g. Uber, Zipcar), and renting unused items from tools to boats (e.g. Rentoid), to services such as those provided by plumbers, electricians, personal assistants, and so on (e.g. TaskRabbit). Some examples of tourism-specific sharing economy platforms include Vayable and ToursByLocals, which enable travelers to search for experiences in their destination city while enabling local residents to earn money as tour guides in their hometowns (Hoe, 2016).
The sharing economy/collaborative consumption can be divided into two categories: (1) access over ownership and (2) transfer of ownership (Hamari et al., 2015). The first category, access over ownership, means that users offer their goods/services as a limited time rental or lend to their peers (e.g. Airbnb and Rentoid). The second category, transfer of ownership, is about swapping, donating, or purchasing usually second-hand goods from other individuals, such as buying second-hand clothes from SwapStyle (Hamari et al., 2015). Sharing economy platforms are mainly focused on the first category and based on renting. One example is Airbnb, which is one of the largest and best-known accommodation sharing platforms.
In 2017, over 200 million guests arrived to Airbnb accommodations in more than 191 countries worldwide, which represents 4 million listings worldwide (Airbnb, 2017). Moreover, although Airbnb does not own a significant quantity of assets, its value is estimated at US$10bn, which is more than the value of some major hotel chains (Sigala, 2017).
The rise of sharing accommodation platforms such as Airbnb and HomeAway has made it easier to rent unused rooms or houses to other individuals through their websites and mobile applications. Consequently, tourists can stay at a private individual’s apartment/house/room during their vacation and in some cases at much more reasonable prices than staying at a hotel, which may be more appealing to price-sensitive travelers, young people, and families in particular. Due to its size and popularity, conducting more research on the topic of Airbnb is rather essential overall.
As it can be argued that not all listings are equally successful when it comes to utilizing their resources, the present study looks at Airbnb listings with the purpose of investigating their efficiency (i.e. competitiveness), which is also directly linked to the attractiveness of a destination. In other words, Airbnb listings of which cities are the best performers? Thus, the aim of the study is to investigate the overall competitive standing of this particular sector (represented by the average listing) across European cities. This is a clear call for an efficiency analysis, and data envelopment analysis (DEA) was deemed to be the most appropriate methodology for such an endeavor, the adoption of which is accounted for in the “Methodology” section. The final sample consisted of Airbnb listings of 29 cities across Europe, and as such is the first comprehensive benchmarking study within the domain of the sharing economy to date. Given that commercial Airbnb providers constitute about one half of all Airbnb offerings in major European cities such as Amsterdam, Berlin, London, Madrid (Messe Berlin, 2016), and Vienna (Gunter and Önder, 2018), it can be argued that the sharing economy sector as a whole is trying to optimize its overall performance. While some individual listings are privately managed and independent, a non-negligible number of listings are jointly managed by commercial Airbnb providers across European cities. In either case, their objectives (i.e. maximization of outputs) are certainly comparable across the sector. In this study it is therefore assumed that Airbnb hosts act in a way to maximize their profits because they are part of the overall accommodation sector. Ideally, an improved performance leads to a monetary success, which can serve as an extrinsic motivator for the affected stakeholders.
This article also makes a contribution to robustness by introducing an interactivity note to the base model, thus, inspecting the results for corroboration/discrepancies and going beyond the static analyses that are common in DEA modeling. Interactivity refers to a number of alterations made to the base model with respect to variables and is introduced to address some of the methodological pitfalls of DEA modeling, as discussed in the “Methodology” section. The importance of and the need for such an interactivity note were also raised in the previous studies by Wöber (2002) and Önder et al. (2017). In summary, the major outcome of this study lies not only in identifying efficient listings but also in pointing toward areas for improvement and the actual benchmarking partners for the inefficient ones. And by doing so, giving them an opportunity to properly utilize their respective inputs and consequently become more competitive within the Airbnb domain.
Before introducing the empirical section, the “Literature Review” section discusses the theoretical basis of the sharing economy. DEA, the data, and the model are presented in the continuation, whereas the “Findings” section brings a detailed overview of the inefficient and efficient Airbnb listings, benchmarking partners, and a virtual benchmark, along with a summary of the results of the interactive DEA modeling. Finally, the article concludes with a discussion of the contributions and the practical implications of this benchmarking endeavor. Supporting tables are given in the Online Appendix.
Literature review
The sharing economy’s most relevant growth has been within P2P accommodation rental schemes, which have succeeded in surpassing the traditional lodging industry (Sigala, 2017) and which explain why this sector has had such a significant impact on the global tourism industry. Yet, accommodation sharing brings its own problems, along with some unique benefits. For instance, the benefits include less expensive accommodation, monetizing unused spaces, longer stays at destinations, and as a result contributing to the local economy (Haywood et al., 2017). In addition, the sharing economy creates new employment opportunities and income for disadvantaged communities (Dillahunt and Malone, 2015). On the other hand, the problems include overcrowding due to more affordable accommodation prices, which can result in host–guest friction at the destinations. Also, commercial housing and gentrification resulting from Airbnb decrease opportunity in the market for the local population and may eventually increase socio-economic inequality between neighborhoods (Oskam and Boswijk, 2016).
Accommodation sharing is also called P2P accommodation because both the host and the guest are individuals and the transaction, in an ideal case, is not related to any legal entity (e.g. company). Airbnb has evolved since its establishment. In the beginning, Airbnb had mostly individuals who were renting their private houses and rooms. However, once P2P accommodation had become more popular, real estate companies also started using Airbnb. The main drivers of demand for P2P accommodation include sustainability, as well as community and economic benefits (Tussyadiah, 2015). Moreover, low costs, extra amenities such as a washing machine and a fully equipped kitchen at the accommodation, and an authentic experience are other motivations to stay at Airbnb (Guttentag, 2015). Tussyadiah and Pesonen (2016) also confirm that authentic experiences such as having more meaningful interactions with locals are another factor that influences individuals’ choice to stay at P2P accommodation. This also results in longer stays and participating in more activities at the destination (Tussyadiah and Pesonen, 2016). Although Guttentag (2015) finds that low cost is one of the reasons to stay at Airbnb, Tussyadiah (2015) indicates that guests who use P2P accommodation are highly educated and, as a result, may not emphasize cost as a deciding factor when choosing their accommodation. Thus, previous research has shown that the cost of P2P accommodation may be a factor pertinent to guest decision-making, but it is not the only one.
The ratings of P2P accommodation can also be an influencing factor for guests when they choose from among P2P accommodations. Based on textual analysis of online reviews, higher ratings of accommodations are associated with the location of the accommodation, the host’s service and hospitality, and the amenities provided at the accommodation (Tussyadiah and Zach, 2016). While hosts are also rated on the Airbnb website, having a high online rating as a host does not increase the chances of renting out one’s property. On the other hand, being perceived as attractive does increase bookings, since such hosts are also perceived as being more trustworthy (Ert et al., 2016). In addition to trust, cost saving, utility, and familiarity are also found to be important factors of guest satisfaction in P2P accommodation (Möhlmann, 2015).
From the hospitality industry’s perspective, Airbnb and other P2P accommodation services have certain economic impacts. For instance, low-end hotels are being displaced by Airbnb accommodations, whereas the latter do not necessarily need to hire any employees. Thus, in the long run, the number of tourism employees may be reduced due to having less low-end hotels (Fang et al., 2016). This is also confirmed by Zervas et al. (2017), who suggest that Airbnb poses a threat to smaller (low-end) hotels without business facilities, but not to high-end hotels. In corroboration, Hilton and Marriott hotels both indicated an increase in earnings in 2016 despite the rise of Airbnb (Yu, 2017). One threat for hotels could also be related to the location of Airbnb properties: in Barcelona, for instance, they are closer to tourist attractions than hotels (Gutierrez et al., 2017).
Furthermore, price determinants of P2P accommodations (Airbnb) in 33 different cities have also been investigated (Wang and Nicolau, 2017). These authors show that pricing is a complex issue, especially for P2P accommodations, and that prices depend on host attributes, site and property attributes, amenities and services, rental rules, number of reviews, and ratings, whereas chain affiliation and star ratings are the main price determinants for hotels. Similar results are also found in another study, which investigated Airbnb listings in five cities in Canada and found that location, size, and host characteristics influence the price of Airbnb (Gibbs et al., 2017).
In line with above, it is evident that there has not been any research done in the area of efficiency analysis/competitive standing of Airbnb listings. Thus, this study aims to fill this gap in the literature.
Methodology
Data envelopment analysis
DEA is a non-parametric, multivariate technique, which is utilized for measuring “…the relative efficiency of operating units with the same goals and objectives” (Anderson et al., 2008: 189). The term most commonly used in the literature for these entities is Decision Making Units (DMUs), as proposed by Charnes et al. (1978). Examples of DMUs within the tourism and hospitality domain include destinations (Bosetti et al., 2006; Cracolici et al., 2008; Önder et al., 2017), tourism offices (Wöber and Fesenmaier, 2004), tourism websites (Bauernfeind and Mitsche, 2008), travel agents/agencies (Assaf et al., 2011; Fuentes, 2011; Köksal and Aksu, 2007), airlines/airports (Gitto and Mancuso, 2011; Merkert and Hensher, 2011), and general managers/hotels (Barros, 2005; Cheng et al., 2010; Morey and Dittman, 1995).
When discussing efficiency within a DEA context, it should be kept in mind that it is actually the relative efficiency that is being measured as the ratio of weighted inputs and outputs (Donthu et al., 2005). In mathematical terms, this can be expressed as follows:

where u 1 is the weight assigned to output 1, v1 is the weight assigned to input 1, y1 j is the amount of output 1 from unit j, and x1 j is the amount of input 1 to unit j (Emrouznejad, 1995–2012: Tutorial section, para. 3; Wöber, 2002).
Wöber (2002) explains that within the DEA approach, the weights are computed from the data (i.e. not fixed in advance). Moreover, these weights are considered variable in the sense that they vary from one unit to another, as DEA determines them “…in such a way that they should be most favorable to the DMU concerned” (Tone, 1989: 61). Or how Banker and Morey (1989: 246) describe, “…the method bends over backwards to put a DMU’s performance in the best possible light.” Overall, when the efficiency score = 1, this implies that the above unit j is efficient, whereas when the score differs from 1, the unit under observation is labeled as DEA inefficient (Wöber, 2000).
When looking into the advantages of this method, one should not fail to acknowledge that DEA is able to process multiple variables, irrespective of the units in which individual inputs and outputs are measured, and that no a priori information is needed in terms of the importance of the individual variables (Herrero and Salmeron, as cited in Bauernfeind and Mitsche, 2008; Sigala, 2003; Wöber and Fesenmaier, 2004). Wöber (2002: 61) suggests that “…it can be used to compare input/output data making no prior assumptions about the shapes of the probability distributions under study”, whereas Bogetoft and Otto (2011) argue in favor of this deterministic approach due to its flexible production structure. Equally important, it benchmarks DMUs, thereby leading to the identification of benchmarking partners, and allows the inclusion of uncontrollable factors, as discussed in the studies by Wöber and Fesenmaier (2004) and Bosetti et al. (2006) to name a few examples. It has been suggested that its benchmarking analysis is what makes DEA unique (Baek and Lee, 2009). Reynolds and Taylor (2011) also label it as a superior efficiency evaluation method for the very same reasons, whereas Cooper et al. (2004) credit its empirical orientation.
At the same time, one should be wary of the pitfalls, such as the fact that results may change significantly as a consequence of changing/adding variables or adding/deleting DMUs, which should not come as a surprise due to the fact that relative efficiency is measured (Wöber, 2002; Wöber and Fesenmaier, 2004). Other weaknesses mentioned in the literature include “…the impact of omitting important variables, the impact of outliers, and the impact of missing observations”, as discussed in Donthu et al. (2005: 1479–1481). Andersen and Petersen (1993) also raise the issue that DMUs may be classified as efficient if the sum of inputs and outputs is large compared to number of units.
Nevertheless, DEA (along with a number of extensions that exist nowadays) still remains a valuable and widely applied technique in benchmarking across various industries, both in the private and in the public sector (Avkiran, as cited in Sigala, 2003; Cracolici et al., 2008). Its popularity is very much apparent when looking at the enormous number of both academic journal publications and books dealing with methodological developments and applications to everyday business settings (Cook and Seiford, 2009). Thus, as the aim of the current study is to provide a comprehensive benchmarking analysis of Airbnb listings, the choice of the method that is able to accomplish exactly so is fully accounted for. This is clearly evident from the aforementioned advantages of DEA.
Data and DEA model
Airbnb listings may not be considered “formal” tourism businesses, yet these units belong to the accommodation sector and have the same goals and objectives (e.g. increasing revenues, increasing their overall rating), which, as seen earlier, is the prerequisite condition for DEA modeling. The ones benchmarked in this study are situated in 29 European cities. For simplicity purposes, the name of the city is used as a proxy for its listings (e.g. Vienna = Airbnb listings of Vienna). This approach results in the following 29 units: Amsterdam, Barcelona, Berlin, Brussels, Budapest, Cologne, Copenhagen, Dublin, Edinburgh, Florence, Geneva, Genoa, Hamburg, Helsinki, Istanbul, Lisbon, London, Madrid, Munich, Oslo, Paris, Prague, Reykjavik, Rome, Salzburg, Seville, Stockholm, Tallinn, and Vienna. All of these cities belong to European Premier League cities according to European Cities Marketing and each received more than 1.5 million bednights in 2016 (ECM, 2017) in traditional, paid forms of accommodation establishments, which excludes the statistics of Airbnb accommodations. Aside data availability, their individual success in achieving such high numbers of bednights in traditional forms of accommodation is the key factor for inclusion in the sample for this study.
Selection of the input and output variables is one of the most important issues which needs to be addressed if one is to employ DEA accurately. In the current study, this decision was based primarily on Gunter and Önder’s (2018) study on determinants of Airbnb demand in Vienna and the respective regression results, which are elaborated below. Moreover, data availability and methodological requirements concerning the number of DMUs and the number of variables have to be taken into account. Considering the fact that the final sample consists of 29 DMUs, not more than nine variables should be modeled at once if one is to meet the arguable “rule of thumb” (number of DMUs = minimum twice, if not three times, the sum of the study’s input and output variables) and consequently, preserve the discriminatory power, as discussed and criticized in Cook et al. (2014).
The base DEA model proposed in this study consists of four input and four output variables, as shown in Figure 1. The input variables are as follows: (1) number of properties, (2) maximum number of guests, (3) minimum number of nights, and (4) number of photos, whereas the outputs are as follows: (1) annual revenue, (2) occupancy rate, (3) number of bookings, and (4) overall rating.
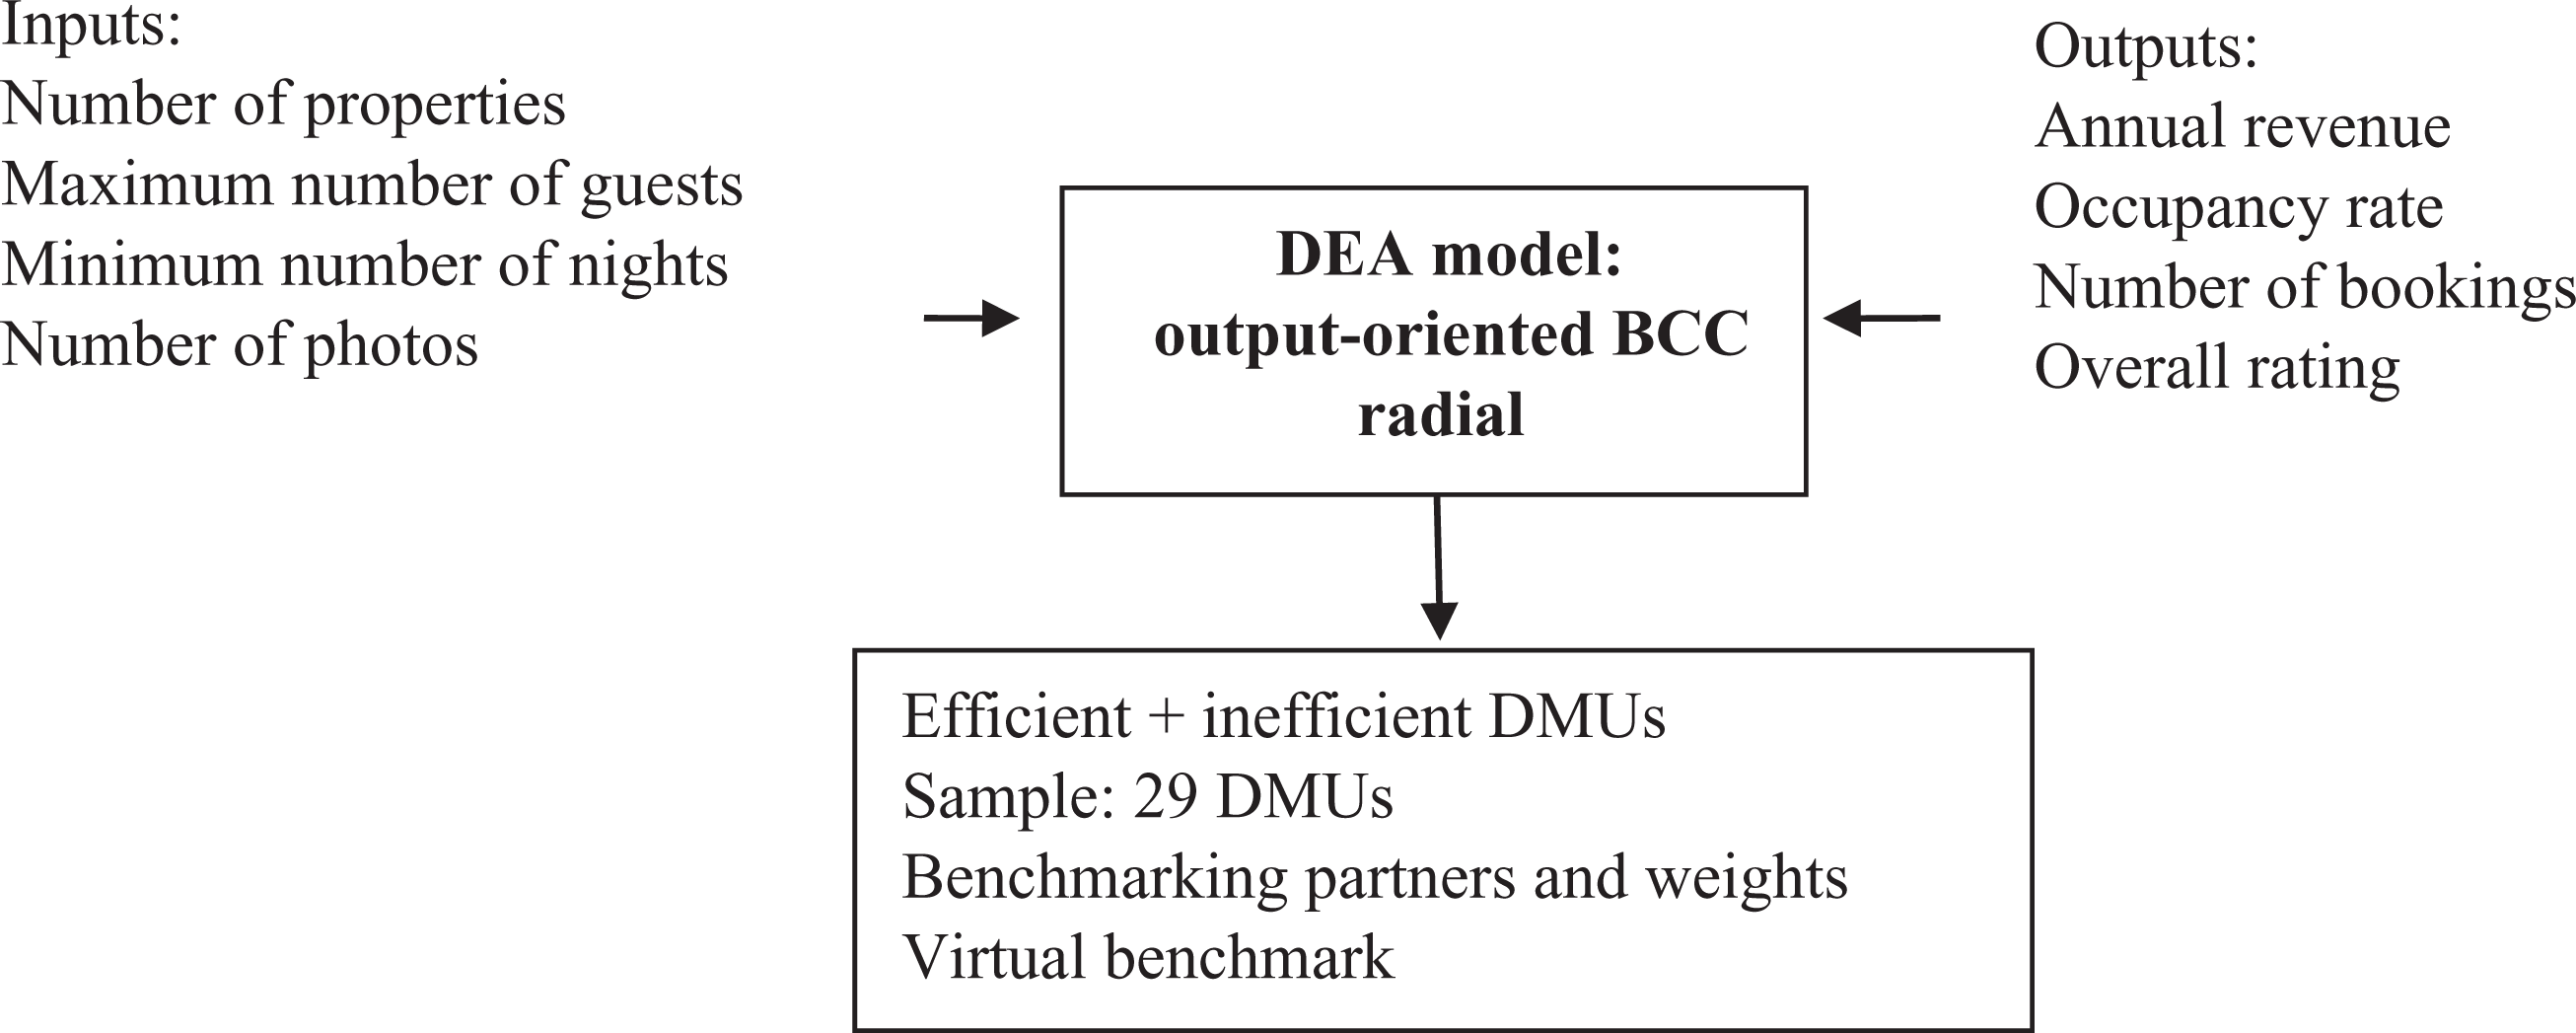
Proposed DEA model—the base model. Source: Authors’ elaboration from Bauernfeind and Mitsche (2008: 250).
Concerning the four input variables, number of properties is used to measure potential saturation of Airbnb listings per city; maximum number of guests is employed to proxy the size of Airbnb listings; minimum number of nights is used to measure the minimum length of stay; while number of photos is employed as a measure for the informative content of the Airbnb listing ads. The latter three variables have been found to be highly statistically significant determinants of Airbnb demand and their coefficient estimates to possess the ex-ante expected algebraic signs, irrespective of whether Airbnb demand was measured in terms of number of bookings or occupancy rate (Gunter and Önder, 2018). Thus, these variables can be considered crucial determinants of Airbnb demand.
Pertaining to the four output variables, annual revenue is used as a monetary success measure, whereas occupancy rate (defined as the ratio of reservation days to reservation plus available days while excluding blocked days; see https://cdn.airdna.co/sample/AirdnaPropertyPerformanceDataSample.xlsx), number of bookings, and overall rating are employed as real-term success measures; where both occupancy rate and number of bookings can be interpreted as different measures for Airbnb demand (Gunter and Önder, 2018). While blocked days may refer either to days an Airbnb listing is not offered at all or to days it is offered on another (P2P) platform, this does not matter for any of the Airbnb-related input or output variables. As mentioned earlier, the chosen input variables possess a high explanatory power of Airbnb demand irrespective of how it was measured, thus, corroborating the validity of the employed regression specification.
Besides the statistical justifications behind the choice of the aforementioned input and output variables, there is also a theoretical reason: All resource or input variables represent nonprice-related characteristics of Airbnb supply in a given city. Since there is no unique prevailing market price (measured in terms of average daily rate (ADR)) within or across any of the 29 cities under scrutiny, these nonprice-related supply characteristics, which encompass the differences between individual Airbnb listings, are supposed to have a crucial impact on Airbnb demand (Gunter and Önder, 2018). Consequently, the structure of the Airbnb market is considered as being monopolistically competitive (Chamberlin, 1933; Edwards, 1933; Robinson, 1933), whereby the preference for differentiated Airbnb listings on the part of consumers is based on their the so-called “love of variety” for differentiated products and services (Ardelean, 2006; Dixit and Stiglitz, 1977; Krugman, 1979, 1980). Thus, all modeled variables have a statistical and/or a theoretical justification.
Furthermore, as is discussed in the “Findings” section, an interactivity note is introduced in the analysis. Thus, a number of alterations are made to the base model with respect to inputs (e.g. using number of bedrooms instead of maximum number of guests as an alternative proxy for listing size; response rate instead of number of photos as an entirely different resource variable and as a measure for hosts’ responsiveness) and outputs (using ADR instead of, and in addition to, annual revenue as an alternative monetary success measure). No changes are made with respect to the number of units to preserve the sample size. The purpose of the interactivity note is twofold: (1) to include as many different aspects/resources that may influence the efficiency of Airbnb properties as possible and, more importantly, (2) to corroborate/check for discrepancies the efficient/inefficient classification across different models, and thus, to verify the stability of findings. This rather novel approach is also a way to overcome the aforementioned methodological pitfalls of DEA modeling.
The data for eleven variables that were employed across different models were sourced from AirDNA (https://www.airdna.co/). Only active Airbnb listings were considered (i.e. those that had a non-zero number of bookings between July 2015 and June 2016). AirDNA collects data that are publicly available on the Airbnb website (see https://www.airdna.co/methodology). All variables (except number of properties) are averages of all active Airbnb listings per city between July 2015 and June 2016, which is the most plausible approach to performance analysis of the overall sector of various European cities. For this reason, DMU is equated to an average (i.e. representative) Airbnb listing of the respective city. Without averages of comparable, relatively homogeneous sets of units (Airbnb listings) regarding the types of resources/inputs and objectives/outputs they have, a sectoral analysis across cities would not have been feasible. The output-oriented BCC (Banker, Charnes, Cooper) radial model was deemed the most fitting to use in the present study as the goal was maximization of the output variables, whilst keeping the inputs constant (Scheel, 2000). With the respect to software, Efficiency Measurement System (EMS) version 1.3 was employed for all computations related to the DEA efficiency scores and identification of benchmarking partners.
Findings
Basic descriptive statistics on the input/output variables of the base model, including maximum, minimum, mean, and standard deviation values, are represented in Table 1. Heterogeneity is evident and was to be expected due to different sizes of the DMUs in the sample. However, this is not seen as problematic due to the fact that this study is not a destination benchmarking but rather an organization/sector (Airbnb listings) benchmarking study.
Descriptive statistics—variables used in the base DEA model.
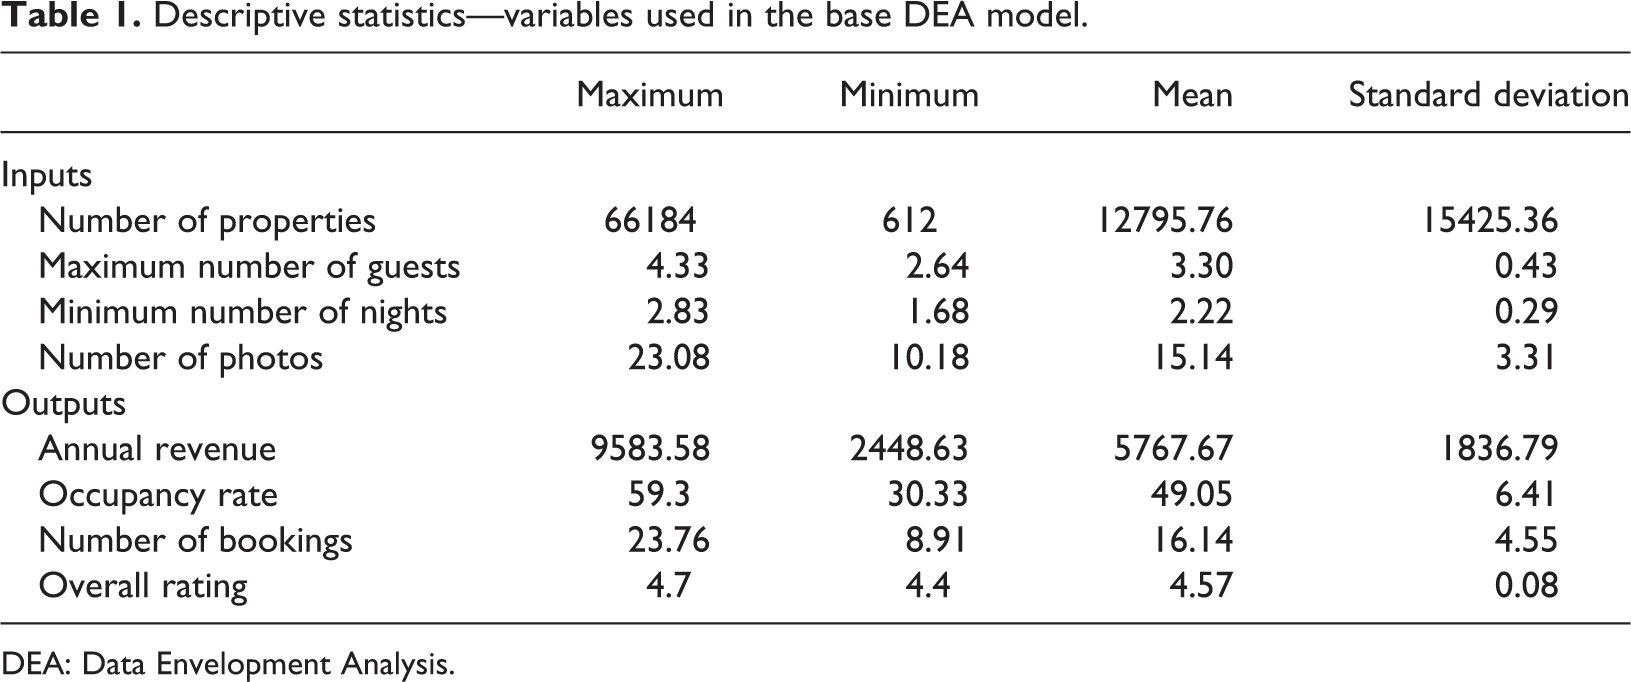
DEA: Data Envelopment Analysis.
Moreover, DEA results can be found in Table 2, in which the second column lists the DMUs that were analyzed. As already mentioned, the name of the city is used as the proxy for its listings (e.g. Vienna = Airbnb listings of Vienna). Output-oriented efficiency scores are presented in column 3, by which the table is sorted. Column 4 is used alternatively to list the top benchmarking partners and their respective weightings (in brackets) for the inefficient DMUs, or for the efficient DMUs, to note the number of times that unit appears as a benchmark. In line with the DEA radial distance “superefficiency” calculations, scores which are below 100% indicate DMUs that are efficient given the input/output combination, whilst the ones above 100% indicate inefficient DMUs in the output-oriented BCC modeling.
DEA results—the base model.
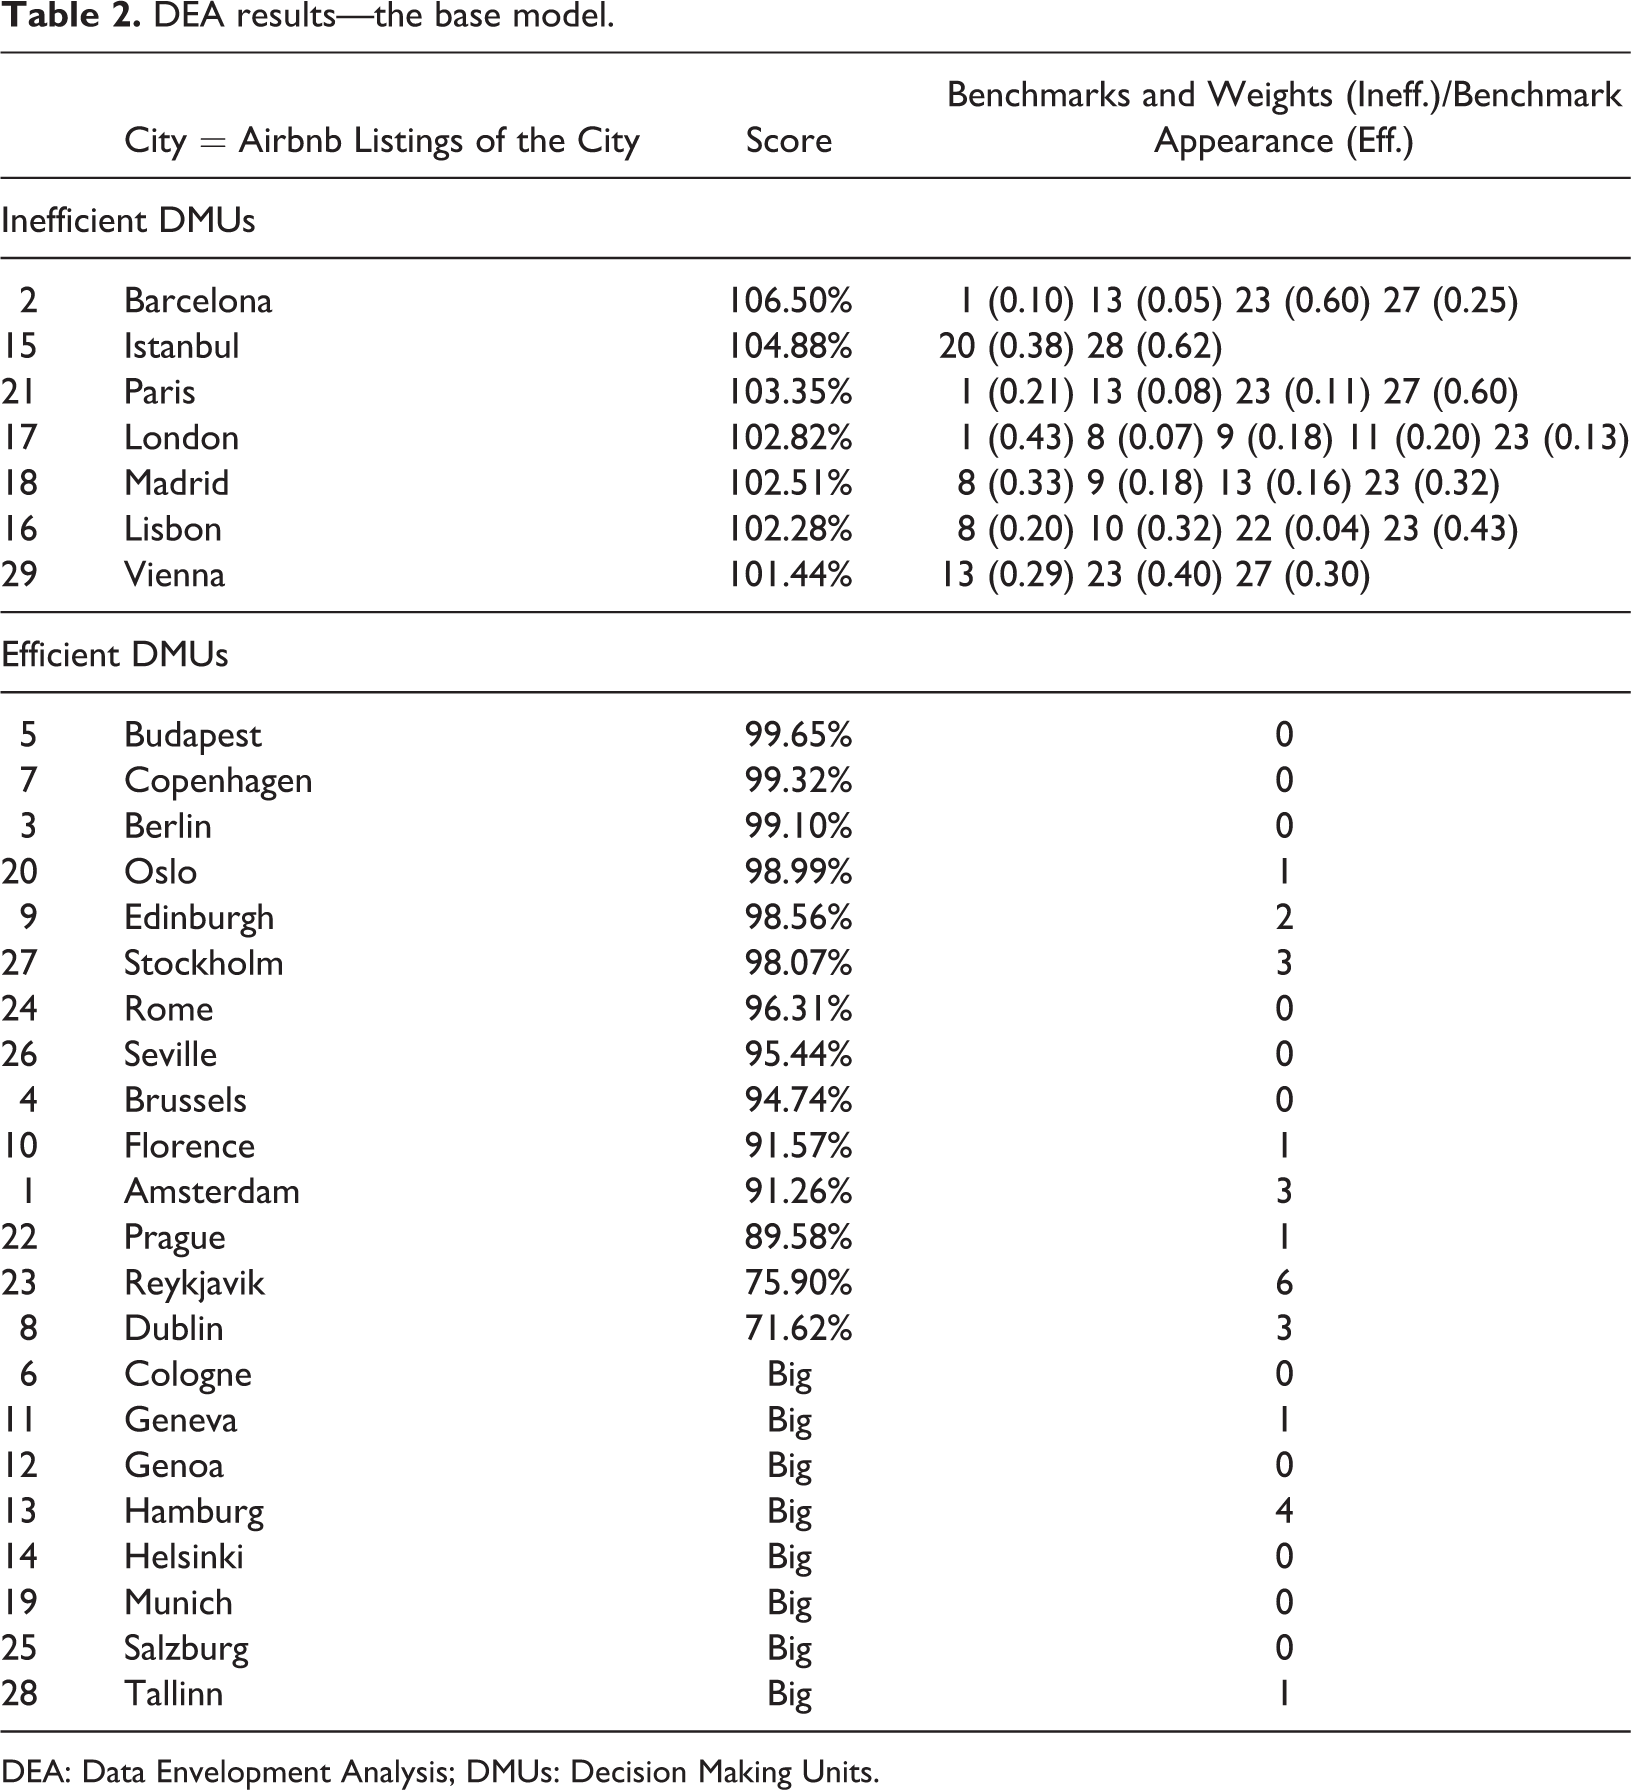
DEA: Data Envelopment Analysis; DMUs: Decision Making Units.
DEA results show that the efficiency scores range from 71.62% to 106.50%. Interestingly, the Airbnb listings of only seven cities are inefficient in terms of the chosen indicators; whilst of the remaining 22 are efficient. Airbnb listings of Barcelona are the most inefficient DMU in the sample with a score of 106.50%, which implies an inefficiency of merely 6.5%. The interpretation here is straightforward: at least one of the city listings’ outputs could be increased by the aforementioned percentage, whilst keeping the current inputs constant. Four benchmarking partners have been identified for this DMU: the listings of Amsterdam, Hamburg, Reykjavik, and Stockholm. However, on inspection of the weightings assigned to each, the most relevant benchmarking partner for Barcelona listings is clearly the Airbnb accommodations of Reykjavik with a weight of 0.60.
Furthermore, the scores for Istanbul and Paris closely follow Barcelona, at 4.88% and 3.35% inefficient, respectively. Two benchmarking partners are proposed for the listings of Istanbul, with the listings of Tallinn (0.62) being the most important, and four are proposed for the Parisian ones, with Stockholm-based Airbnb accommodations with a weight of 0.60 being identified as the most distinct benchmark. The least inefficient unit in the sample based on the current input/output combination is Viennese Airbnb accommodations (1.44%). Although this is a clear case of marginal inefficiency, three benchmarking partners are nevertheless proposed for this DMU; the most important again being Reykjavik-based listings (0.40).
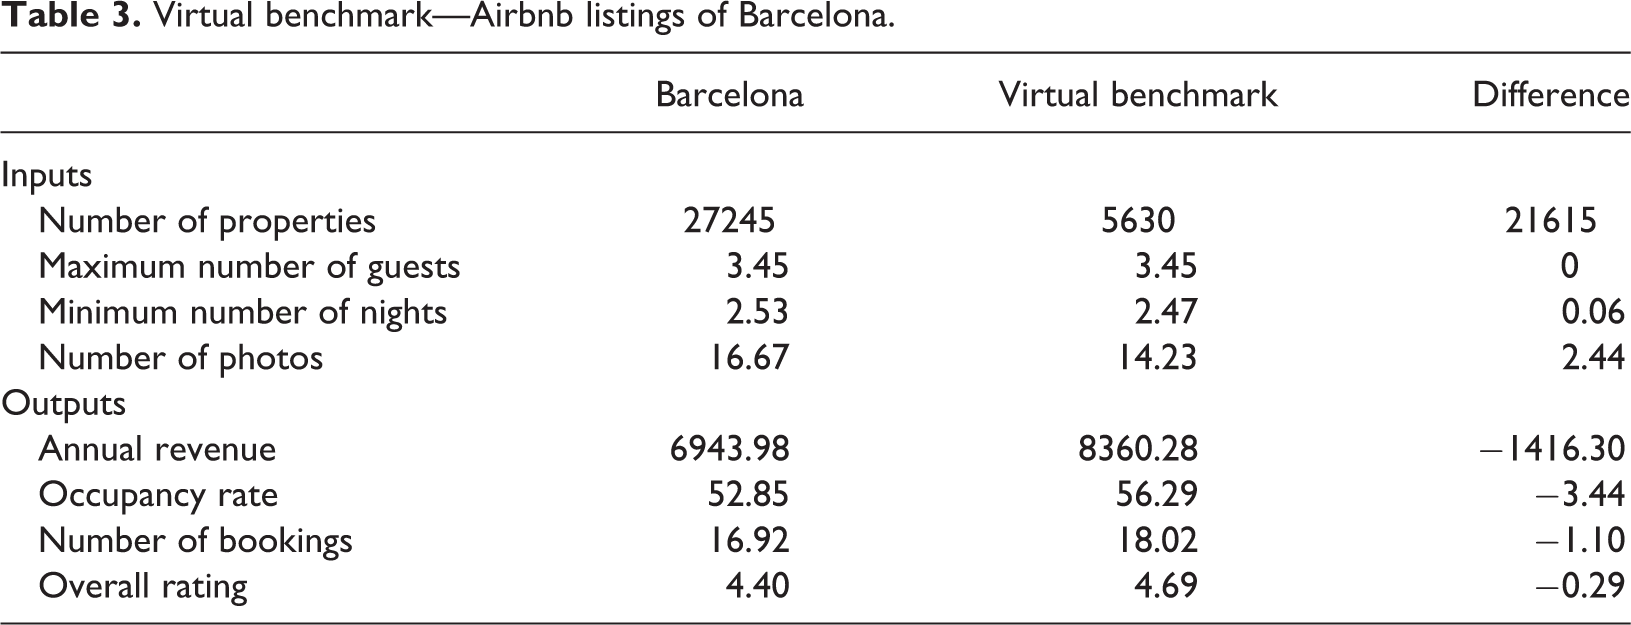
Inefficient units may not only look for guidance to the individual benchmarking partners, as their characteristics may not fully match (Wöber, 2002). Instead, they can opt for identifying “hypothetical composite” units of their suggested benchmarking partners or virtual benchmarks—in other words, the composite score that inefficient DMUs would have had if they were efficient (Johns et al., 1997). Önder et al. (2017) describe the calculation of the virtual benchmark as a way of overcoming the incomparability of units, thus, as one of the ways to account for heterogeneity. In this study, the virtual benchmark was calculated for the most inefficient unit in the sample (Barcelona listings) by taking into a linear combination all variables of its proposed best practices (listings of Amsterdam, Hamburg, Reykjavik, and Stockholm) and their allocated weights (0.10, 0.05, 0.60, and 0.25, respectively). To obtain figures for the virtual benchmark which are as precise as possible, individual weight values with eight decimal places were used in computations. This result can be found in Table 3.
What is apparent from the above characteristics of the virtual benchmark is that almost all Barcelona listings’ inputs are higher than the virtual benchmark’s inputs (particularly regarding number of properties). Only in the case of maximum number of guests the values did not differ. At the same time, the opposite holds in regards to outputs, indicating that Barcelona listings are underperforming. Among the deficiencies which could be identified, the DMU’s annual revenue is particularly striking at only 83.06% of the virtual benchmark’s value. These results point toward the fact that Barcelona listings are underutilizing their current inputs. According to DEA, they have the potential to improve annual revenue by 20.4%, occupancy rate by 6.51%, number of bookings by 6.5%, and lastly, overall rating by 6.59%, hence, reaching the values suggested by the virtual benchmark (Table 3)—but only if they are to deploy the resources more efficiently and consequently, optimize the overall performance.
Virtual benchmark—Airbnb listings of Barcelona.
The remaining DMUs are efficient. More specifically, listings of eight cities (Cologne, Geneva, Genoa, Hamburg, Helsinki, Munich, Salzburg, and Tallinn) obtained “big” as their score, which points toward infeasible solutions caused by extremely high efficiency scores (Boljuncic, as cited in Wöber and Fesenmaier, 2004). Of the efficient DMUs with numerical scores, the Airbnb accommodations of Dublin head the list, followed by those of Reykjavik and Prague. While the listings of Budapest are also considered efficient based on the eight modeled indicators, those in Dublin outperform the listings in Budapest by 28.03%.
The situation with the benchmark appearances is also rather interesting, as the listings of eleven cities had zero appearances. This shows that being efficient does not necessarily translate into being a best practice example for other DMUs. The absolute leader in this respect is Reykjavik-based Airbnb accommodations (optimal benchmark for listings of six other cities), followed by listings in Hamburg (four appearances), Stockholm, Amsterdam, and Dublin (three appearances each). Still, it can be argued that a universal best practice for all inefficient DMUs does not exist.
An additional layer of analyses has been added to the base model by introducing the interactivity note to it. More specifically, the idea behind the interactive DEA environment was to inspect the extent to which the overall efficiency classification changes if the base model (Figure 1) is modified and, thus, to move away from static analyses in order to verify the stability of findings. This was also done to include as many different resources that may influence the success of Airbnb listings as possible. As such, the present study makes an attempt to overcome the methodological limitations of DEA modeling.
A number of alterations were made to the base model, both with respect to inputs (e.g. using number of bedrooms instead of maximum number of guests as an alternative listing size proxy; using response rate instead of number of photos as a different resource variable) and outputs (using ADR instead of, and in addition to, annual revenue in separate models). Eight indicators (four inputs + four outputs) as well as nine indicators (four inputs + five outputs, with both ADR and annual revenue) were modeled and the impact on the efficiency scores was monitored. The sample of 29 DMUs remained the same throughout the analyses to have as many cities represented as possible. Detailed results of these analyses are not provided in this article due to space constraints and as the results of the interactive DEA modeling are very similar to those of the base model, but they are available from the authors upon request. Yet, insight into different alterations/models, range of efficiency scores, along with the efficient/inefficient classification across all models for each city can be found in the Online Appendix of this article, in Tables A1 and A2, respectively.
In summary, six to eight DMUs are categorized as inefficient across different models, with scores ranging between 100.05% (London-based listings) and 106.76% (Barcelona listings, which remained the most inefficient unit in all DEA models). What is rather interesting to observe is that listings of five cities (Barcelona, Istanbul, Lisbon, Madrid, and Vienna) remained inefficient irrespective of the indicators modeled, thus, for these DMUs there is no doubt about the underutilization of their resources and the room that each has for improvement. Their proposed benchmarking partners did differ slightly from one model to another, which is understandable given the change in variables. Furthermore, the listings of four cities (London, Paris, Rome, and Hamburg) shifted between the inefficient and efficient groups depending on the variables employed. This can be interpreted as an early warning sign and serve as a call for action for the DMUs to look closely toward the practices of their most important peers in order to achieve a maximum of output and consequently optimize their own performance. With respect to the efficient units, numerical scores (i.e. excluding the ones with “big” scores) ranged from 71.62% (Dublin-based listings) to 99.87% (Hamburg-based listings). It was corroborated that being efficient does not equate to being a benchmarking practice (as there were up to 13 DMUs with zero appearances as benchmark partners). Moreover, it can be argued that a single DMU is certainly not the best practice case for all inefficient ones; however, Reykjavik-based listings did remain the absolute leader in this regard, irrespective of the modeling.
Discussion and conclusive remarks
Airbnb is arguably the world’s most popular accommodation sharing platform. Its impact on demand and supply within the tourism and hospitality industry is nowadays unquestionable. Airbnb also affects destinations as a whole and their competitiveness. Thus, analyzing the efficiency of Airbnb listings in European cities also shows their competitiveness in this sector, which is growing fast and even supports the lack of traditional accommodation supply in countries such as Georgia, Iceland, and Israel (Adamiak, 2018). With this goal in mind, the present study has delved into inspecting the efficiency of Airbnb listings of European cities, as in spite of the success of Airbnb as a whole, it cannot be presupposed that all listings are equally successful. Hence, the utility of this exercise was to investigate whether the sector of a city (represented by its average Airbnb listing) was efficient or not, how it fared in comparison to the same sector of other European cities, and to identify optimal benchmarking partners.
For this reason, DEA was accordingly employed in an elaborate benchmarking study. Moreover, the methodological strength of the article lies in the application of interactive DEA modeling—a rather novel approach that is grounded in altering the base model in terms of indicators with the purpose of monitoring the impact on the efficiency scores, benchmark appearances, and allocation of benchmarking partners. Irrespective of the modeling employed, the results show similar city listings as inefficient and the listings they should learn from to improve their performance. In addition, the weights allocated to the proposed best practice peers point toward their importance for the individual inefficient DMUs. Ultimately, this is the core idea behind DEA methodology, but also behind any benchmarking endeavor.
The unit that stands out among the inefficient ones is Barcelona-based listings, indicating significant potential to further optimize their performance. Clearly defined targets that this DMU could achieve are shown through the computation of the virtual benchmark, which demonstrates a clear performance gap. Interestingly though, in spite of the model alterations, the most relevant best practice for Barcelona listings was repeatedly Reykjavik-based ones. This provides a clear indication of the importance of this particular benchmarking partner for the Airbnb listings of Barcelona when it comes to the current input/output combination. Reykjavik-based listings, in spite of being efficient, were not the best performer in the sample; however, DEA calculations revealed that they were the winner in terms of benchmark appearances, so their knowledge of resource utilization could be transferred to others. As a side note, the raw figures of Reykjavik listings also revealed that all of the input and output variables of the base model were above the sample mean, with the exception of number of properties. Further lessons learned include: (1) being efficient does not necessarily translate into being the benchmark example for others and (2) there is no universal best practice for all inefficient units.
Several remarks are in order here. Results presented in this benchmarking exercise are based on specific input/output combination. Although effort was invested to alter the base model and verify the stability of findings across a number of analyses, one cannot go as far as to claim that all inefficient/efficient units would result as such irrespective of the variables and DMUs modeled; it should not be forgotten that it is relative efficiency that is calculated and that this was done at one moment in time. As already mentioned, this study benchmarks Airbnb listings of the cities, and not the cities per se, thus, it should not be taken as the destination benchmarking study. In other words, the focus was placed on the micro level (one particular sector: Airbnb listings) in contrast to the macro level (destinations), and the performance of these tourism businesses of one city was evaluated against the businesses of other cities with the purpose of getting an insight into the sector’s competitive standing. This is also clearly evident in terms of selected variables, all of which were Airbnb-related. Thus, stating that Barcelona-based listings are inefficient does not equate to Barcelona as a destination being inefficient. This is even more apparent when one considers that the figures of Airbnb accommodations are not regarded in the official tourism statistics upon which the success of individual city destinations is measured and reported. One could also question using the average Airbnb listing as the city sector’s representative; however, the bottom line is that individual listings have the same types of resources/inputs and objectives/outputs, which makes them comparable and thus, the sector benchmarking analysis possible. Such analysis gives a clear insight into the overall competitive standing of this still informal, yet very important sector across European cities—something that no other study has attempted so far.
Furthermore, the reality is that Airbnb accommodations are most likely here to stay and that the tourism and hospitality industry as a whole, and cities’ DMOs in particular, must come to terms with them and identify ways to work with each other in order to create a win-win situation. The regulatory environment concerning Airbnb, which is the topic of many discussions in the industry and the literature (e.g. Ranchordás, 2015), was beyond the scope of this study due to data availability at the time it was conducted. In any case, it should be kept in mind that the success of micro tourism businesses such as Airbnb accommodations may impact the destination in the long run, both in terms of demand and supply. In spite of the difficulties of deriving specific recommendations when it comes to sector benchmarking as raised by Wöber (2002), one could argue that in the absence of formal sectoral body, the cities’ DMOs are at the center of potential knowledge transfer. They could take a more active role here and act as intermediaries between their own Airbnb listings and the proposed benchmarks, thus, easing the transfer of knowledge between the micro businesses, who are indeed important destination stakeholders. Given the nature of sector benchmarking, initiating such dialogues would be a major policy implication and a starting point for the overall improvement regarding resource utilization.
Taking the above into account, an outlook concerning future research should be considered. The first suggestion would be to include uncontrollable variables (especially those that relate to traditional forms of accommodation establishments, such as number of hotel rooms per city, ADR of hotel rooms per city) in modeling, not only to further account for heterogeneity, but more importantly, to inspect their impact on the efficiency scores of Airbnb listings. Moreover, identifying and modeling the variables that describe the legal environment would be a very welcome addition. Another avenue for exploration would be altering the model in terms of DMUs; in other words, including non-European cities in the sample in order to investigate whether there are any regional differences when it comes to the competitiveness of the Airbnb listings. Putting a study into a longitudinal context may also yield more lessons learned for each unit. On a conclusive note, it can be said that the present study has made a knowledge contribution by not only being the first to initiate the benchmarking discussion within the Airbnb domain but also by adding the interactivity note to it, which is a rather solid basis for future studies to build upon.
Supplemental material
Supplemental Material, TABLES_FOR_APPENDIX - Benchmarking of Airbnb listings: How competitive is the sharing economy sector of European cities?
Supplemental Material, TABLES_FOR_APPENDIX for Benchmarking of Airbnb listings: How competitive is the sharing economy sector of European cities? by Bozana Zekan, Irem Önder and Ulrich Gunter in Tourism Economics
Footnotes
Acknowledgements
The authors would like to thank the editors and the anonymous reviewers of this journal, the participants of the 6th International Conference of IATE in Rimini, as well as Karl Wöber and David Leonard for helpful comments and suggestions for improvement.
Declaration of conflicting interests
The author(s) declared no potential conflicts of interest with respect to the research, authorship, and/or publication of this article.
Funding
The author(s) disclosed receipt of the following financial support for the research, authorship, and/or publication of this article: The authors would like to express their special gratitude to the Vienna Chamber of Commerce and Industry, which generously funded the present study. Moreover, the authors thank the consortium consisting of Michaeler & Partner, PKF hotelexperts, and the Vienna Tourist Board that kindly funded the purchase of the data.
Supplemental material
Supplemental material for this article is available online.
References
Supplementary Material
Please find the following supplemental material available below.
For Open Access articles published under a Creative Commons License, all supplemental material carries the same license as the article it is associated with.
For non-Open Access articles published, all supplemental material carries a non-exclusive license, and permission requests for re-use of supplemental material or any part of supplemental material shall be sent directly to the copyright owner as specified in the copyright notice associated with the article.