
Abstract
Our aim is to evaluate the efficiency of tourist destinations at a global scale, considering 140 countries and drawing on World Economic Forum 2019 data. The approach follows three stages. First, we try to solve the problem of sample heterogeneity through cluster analysis to obtain homogeneous groups of countries. Second, we apply data envelopment analysis to evaluate countries’ efficiency as tourist destinations, considering a territorially based virtual production function which optimizes the flow of revenue from international tourism grounded on a set of inputs such as accommodation capacity, employment of tourist sector and volume of tourist arrivals. Finally, we identify which external factors might determine tourism efficiency by using bootstrap truncated regression analysis. We obtain two groups of countries which evidence differential levels of competitiveness. Rather than natural resources, cultural heritage in a broad sense seems to act as factor that enhances tourism efficiency.
Keywords
Introduction
The tourist sector is felt to be one of the industries that has contributed most to world economic development in the latter decades of the 20th century and in the early part of the 21st century (Gwenhune and Odhiambo, 2017). According to the World Tourism Organization (WTO) (2019), the tourist sector generated 1451 billon US dollars worldwide in 2018, while the World Travel & Tourism Council (2019) estimated that the sector’s global GDP stood at 10.4% in 2018. 1 As a result, the tourist sector has been considered a strategic area in contemporary economies, parallel to the weight of the services sector in production structures.
The tourist industry’s importance has aroused the interest of many researchers who have approached the issue of the sector’s efficiency from a number of different perspectives. According to the bibliometric analysis conducted by Sainaghi et al. (2017), the most frequently addressed topics in research into tourism economy are currently those related to performance indicators, balanced scorecard applications, evaluating tourism productivity and tourism competitiveness indicators. This latter area is precisely where our work is focused, since the main purpose is to measure tourism efficiency and competitiveness at a global scale, taking countries as representative units of tourist destinations, with the aim of evaluating their performance in attracting international tourism. This is a line of research where there are as yet few studies (Assaf and Tsionas, 2019). Our study seeks to contribute in an innovative manner from a threefold methodological perspective: first, a large sample of countries is considered and classified into homogeneous groups taking into account variables related to countries’ economic and tourist potential; second, efficiency ratios are calculated with country level disaggregation, driving a managerial production function which seeks to optimize the economic impact of foreign tourism flow, considering arrivals and tourist industry resources; and, thirdly, the effect on competitiveness of external factors related mainly to natural and cultural resources, infrastructures and countries’ degree of openness and economic development. We take a sample of 140 countries with data from the World Economic Forum (WEF) in 2019 and, respectively, consider for the three analytical branches, cluster analysis for grouping countries, frontier techniques such as data envelopment analysis (DEA) for measuring efficiency and Simar–Wilson truncated regression for evaluating the effect of environmental variables. Such studies are particularly important, since they allow a country’s power to attract tourists at an international level to be charted. They also improve current knowledge of the drivers of competitiveness in appealing to tourism as well as the impact of international tourism, thereby giving rise to relevant policy implications in both the public and the private sphere (Altin et al., 2018). Following this introduction, the remainder of the article is structured as follows. First, we review the main references within the field. We next present the method used and, subsequently, the case study together with our database. We then discuss the results to emerge and, finally, sum up the main conclusions.
Literature review
Efficiency analysis of tourism may be approached from a number of different operational perspectives which, on the one hand, concern the kind of decision-making unit taken into account when conducting an evaluation and, on the other, the techniques (parametric or non-parametric) applied to estimate efficiency indicators. As a result, it is important to classify the studies that make up our theoretical framework in terms of these features.
First, some studies focus on the tourist industry through private agents. Particularly abundant are applications of the non-parametric DEA method, such as Köksal and Aksu (2007), who analyse 24 Turkish tour agencies, comparing the results depending on the type of agency (chains or independent); or the work of Fuentes (2011), who explores the efficiency of tourist agencies in Alicante (Spain) considering the effect of external variables. Aside from these analyses of intermediary agents, the most frequently evaluated analysis units in the tourist industry domain are hotels. This line of enquiry has been pursued by Barros (2004, 2005) through parametric models for the case of Portugal or Bernini and Guizzardi (2010) and Arbelo et al. (2016) who examine a sample of hotels in Italy and Spain, respectively. Parallel to these studies, we find specific applications of the DEA model, such as the work of Sigala (2004), who applies the DEA-stepwise model to hotels in the United Kingdom, while Pulina et al. (2010) employ the windows-DEA method to analyse efficiency trends in Italian hotels. Barros and Almeida (2006), Perrigot et al. (2009) and Assaf and Cvelbar (2010) carried out a technical efficiency study applying similar characteristics for the hotel sectors in Portugal, France and Slovenia, respectively. New works have recently emerged (Lado-Sestayo and Fernández-Castro, 2019; Sellers-Rubio and Casado-Díaz, 2018) which also study the efficiency of the Spanish hotel industry from a regional perspective. For Asia, a number of studies have emerged over the last decade adopting this kind of approach, prominent among which is the application of Honma and Hu (2012), who perform a double efficiency analysis, comparing results from the stochastic frontier model and DEA on a sample of hotels in Japan; and Oukil et al. (2016) who posit a conditioned efficiency model analysing a sample of hotels in Oman. More recently, Joun (2019) worked with Malmquist indices in the tourist industry in Korea. Finally, although at a global scale, Mendieta-Peñalver et al. (2018) analysed international hotel chains.
Second, over the last few years, a fresh line of research has established itself, and which also focuses on evaluating tourism performance, but which centres on examining tourist destinations; in other words, territorial units that are able to attract tourist flows based on certain resources. Said approach is grounded on the notion of territorial competitiveness put forward by Crouch and Ritchie (1999). 2 The idea involves designing a virtual production function which considers that tourist destinations display the capacity to operate on their tourism resources (in terms of both employment and capital) to maximize their tourism output (tourism impact). Based on this, and as pointed out by Soysal-Kurt (2017), it is possible to see a tourist destination as a commercial business or as a territorial industry (Cracolici et al., 2008) in accordance with a classical efficiency model; in other words, positing a problem of resource optimization.
Studies which perform this kind of territorial analysis differ mainly in terms of the scale of the analysis unit, and a summary of the main references can be seen in Table 1. They most frequently take the regional scale, such as Botti et al. (2009) and Barros et al. (2011), both of whom employ the DEA model within the French tourism context, or the work conducted by Cuccia et al. (2016) for regions in Italy. Adopting a similar approach, Benito et al. (2014) and Nurmatov et al. (2020) examine the tourism efficiency of regions in Spain, and Figueroa et al. (2018) in Chile. Maintaining the same regional scale, Niavis (2020) analyse a homogenous and multi-country area; the coastal Mediterranean area made up of 37 regions covering from Spain to Greece and Cyprus. Using a complex production function that embraces a wider range of inputs in the tourism production process, Cracolici et al. (2008) and Suzuki et al. (2011) explore tourism efficiency in regions in Italy, while Herrero-Prieto and Gómez-Vega (2017) do so for regions in Spain. One recent prominent work for the area of Asia is that by Song and Li (2019), who apply a bootstrap model to measure the efficiency of regions in China. Adopting a similar scale, Chaabouni (2019) develops a model of conditioned efficiency.
Measuring efficiency of tourist destinations using DEA: A survey.
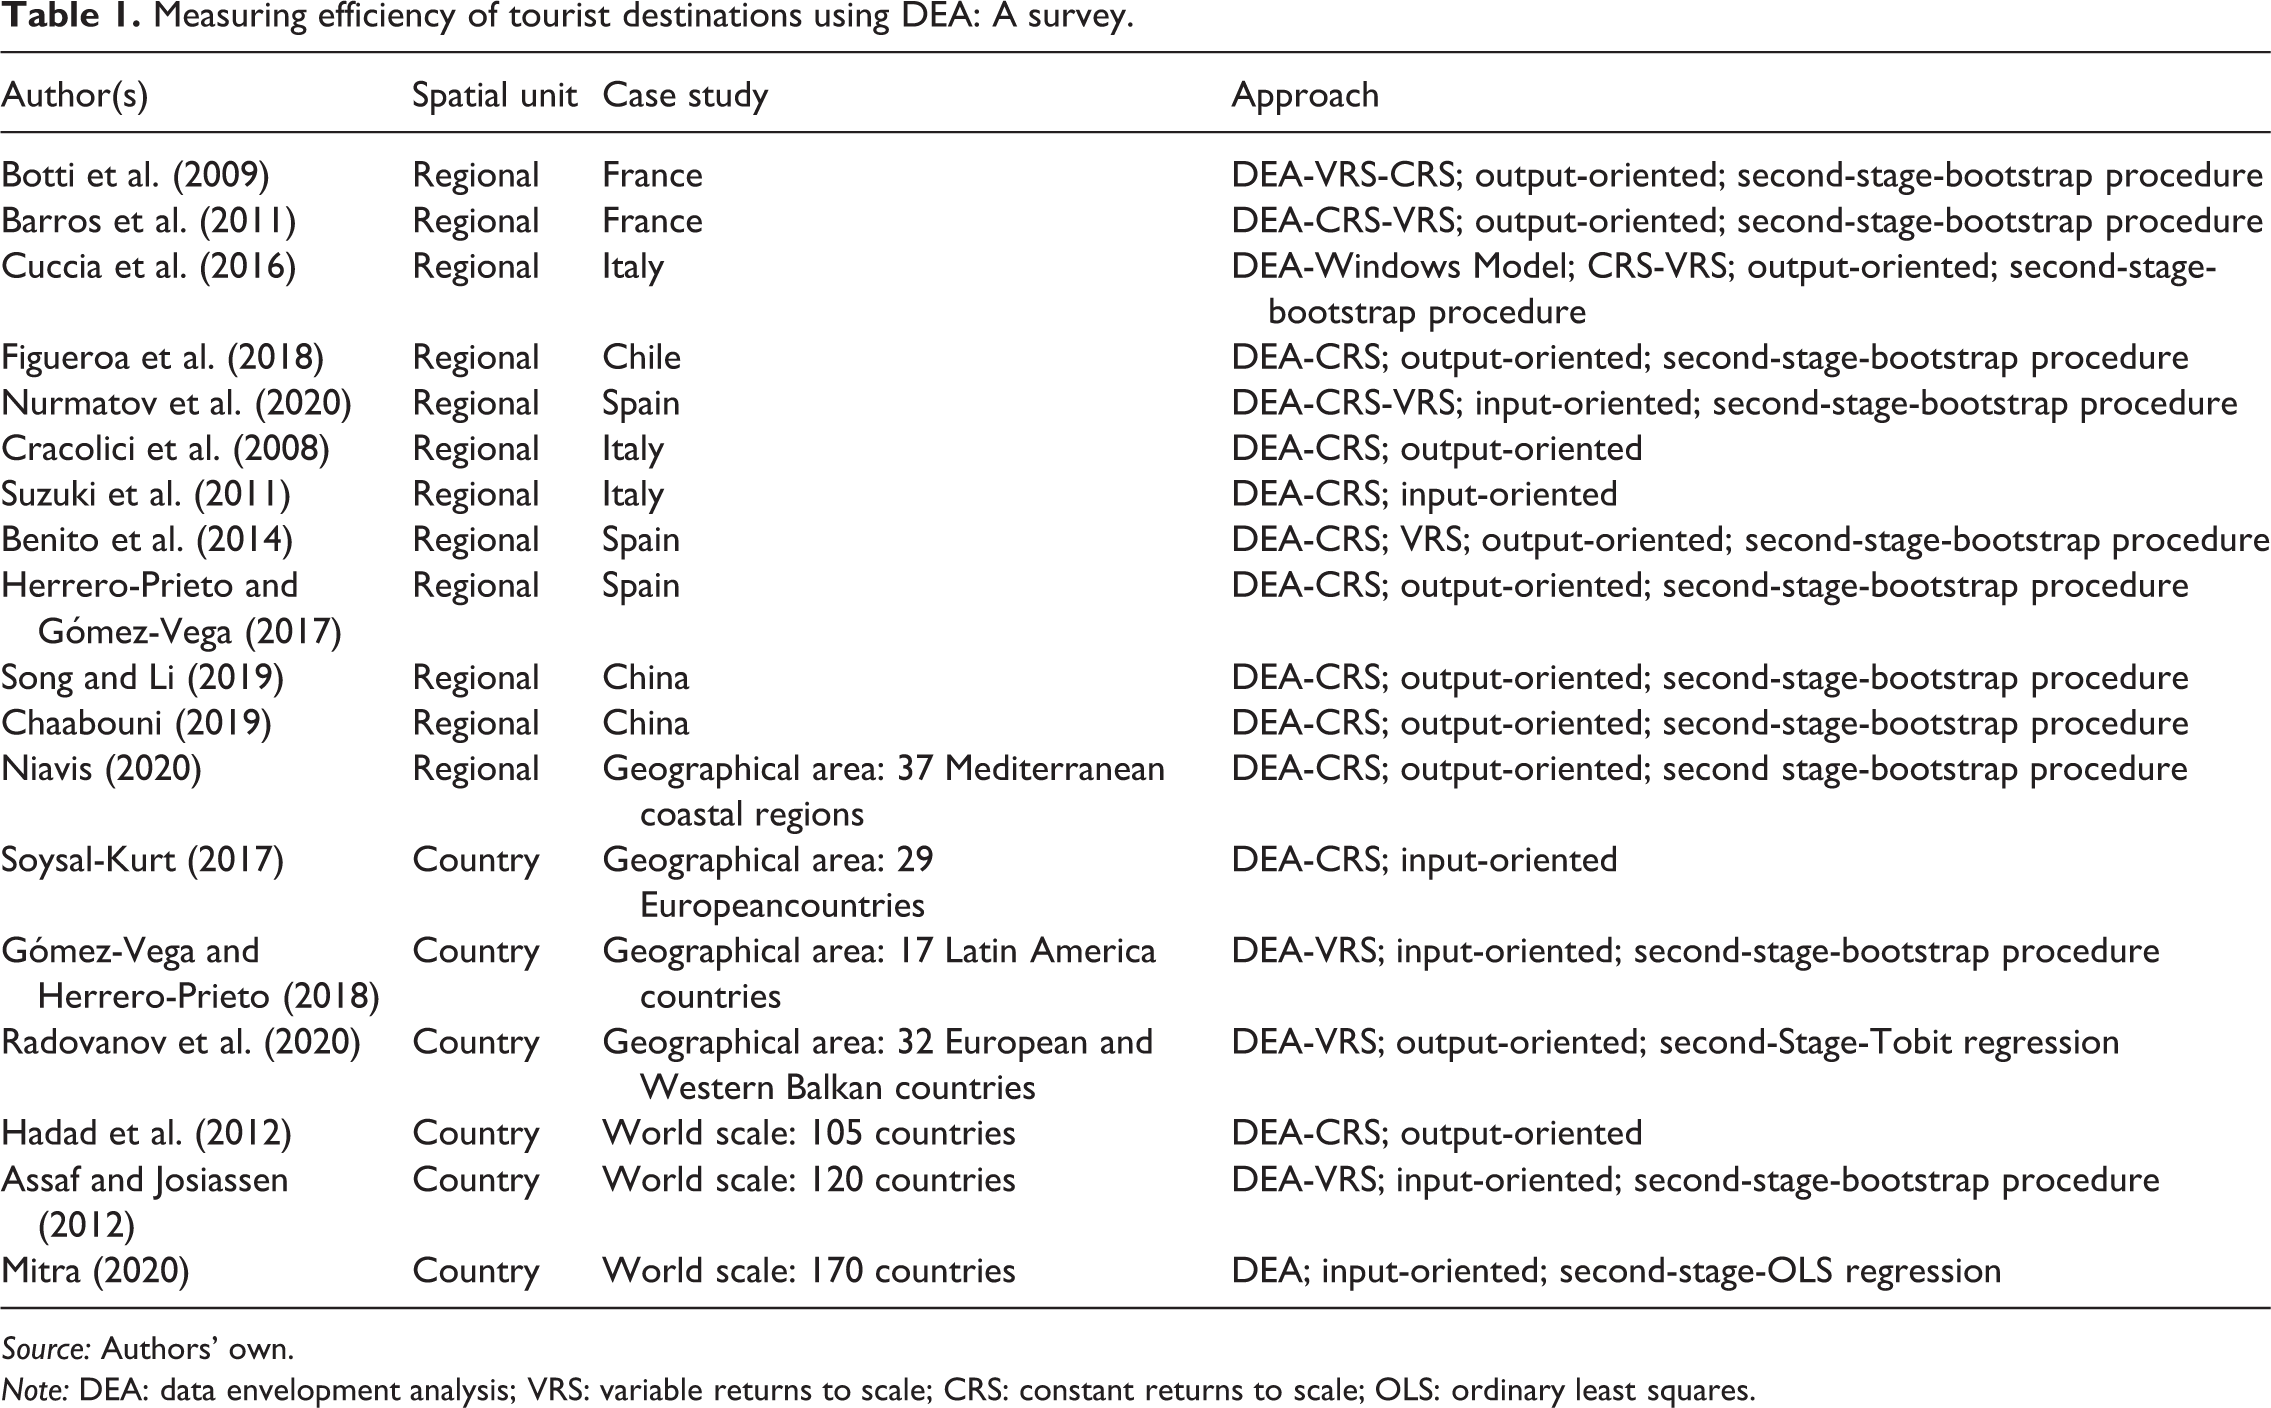
Source: Authors’ own.
Note: DEA: data envelopment analysis; VRS: variable returns to scale; CRS: constant returns to scale; OLS: ordinary least squares.
Another series of works extend the scale of analysis to the country level, albeit contextualized within a single continent, thereby favouring sample homogeneity. Prominent in this regard are the applications of Soysal-Kurt (2017) and Radovanov et al. (2020) focused on Europe, and Gómez-Vega and Herrero-Prieto (2018), who apply a two-stage conditioned efficiency model to the tourist sector in 17 countries in Latin America and report the determining effect of cultural resources.
When it comes to samples of countries at an intercontinental scale, the number of works is far scarcer. Carrying out a tourism efficiency study at a global scale is therefore extremely relevant, particularly if we consider that this is a highly internationalized sector. The lack of a significant number of studies on this scale may to a large extent be due to the sample heterogeneity caused when comparing countries whose individual cases differ enormously and which might significantly shape the outcomes because of differences in the size of their tourist industry or even their level of economic development, demographic size and so on. To the best of our knowledge, there are only three works which comprehensively address the task of measuring tourism efficiency at a global scale: Assaf and Josiassen (2012), who use a DEA model to gauge the tourism efficiency of 120 countries, comparing all of the units at the same time, Mitra (2020), who also uses DEA for a single and larger sample of 170 countries and Hadad et al. (2012), who examine the tourism efficiency of 105 countries and offset sample heterogeneity by splitting the group into two blocks in accordance with the human development index (HDI) scale and not considering any complementary variable.
It is on this field of study, competitiveness at a global scale, that our work focuses and in which we propose our methodological combination grounded on a threefold approach: solving the problem of the heterogeneity of the sample countries, estimating the efficiency on economic impact derived from foreign tourism and analysing how certain external variables related to several endowments might affect competitiveness. It should be clarified that tourism competitiveness is understood as being synonymous with efficiency vis-à-vis maximizing the impact of attracting foreign tourism, since it is assumed that countries which perform best in this regard enjoy broad and deeper comparative advantages. We do not use nominal competitiveness indicators, such as the exchange rate or prices, but mainly real variables concerning technical efficiency. Nor do we construct composite indicators of tourism competitiveness (see Gómez-Vega and Picazo-Tadeo, 2019), which would respond to another methodological approach wherein the ability to collect variables and manage weighting criteria prevail. Our work falls in the line of studying tourist destination efficiency, since the main purpose is to analyse countries’ degree of performance in a virtual production function of a managerial type that seeks to maximize the economic impact of foreign tourism and to evaluate the effect of key external variables.
Methodological application
The present research seeks to provide a model to measure tourism efficiency by countries at a global scale. As we said, we aim to offset the problems related to sample heterogeneity which result from working with a large number of countries that display vastly differing specific features, to which DEA is particularly sensitive, and that might impact the robustness of the outcomes. As a result, we employ a threefold approach, merging cluster analysis to achieve groups of homogeneous countries and, subsequently, the two-stage efficiency model wherein we obtain the tourism efficiency ratios through DEA, before performing regression analysis with external factors that might determine competitiveness. Figure 1 aims to sum up these three consecutive perspectives, which we now examine in detail.
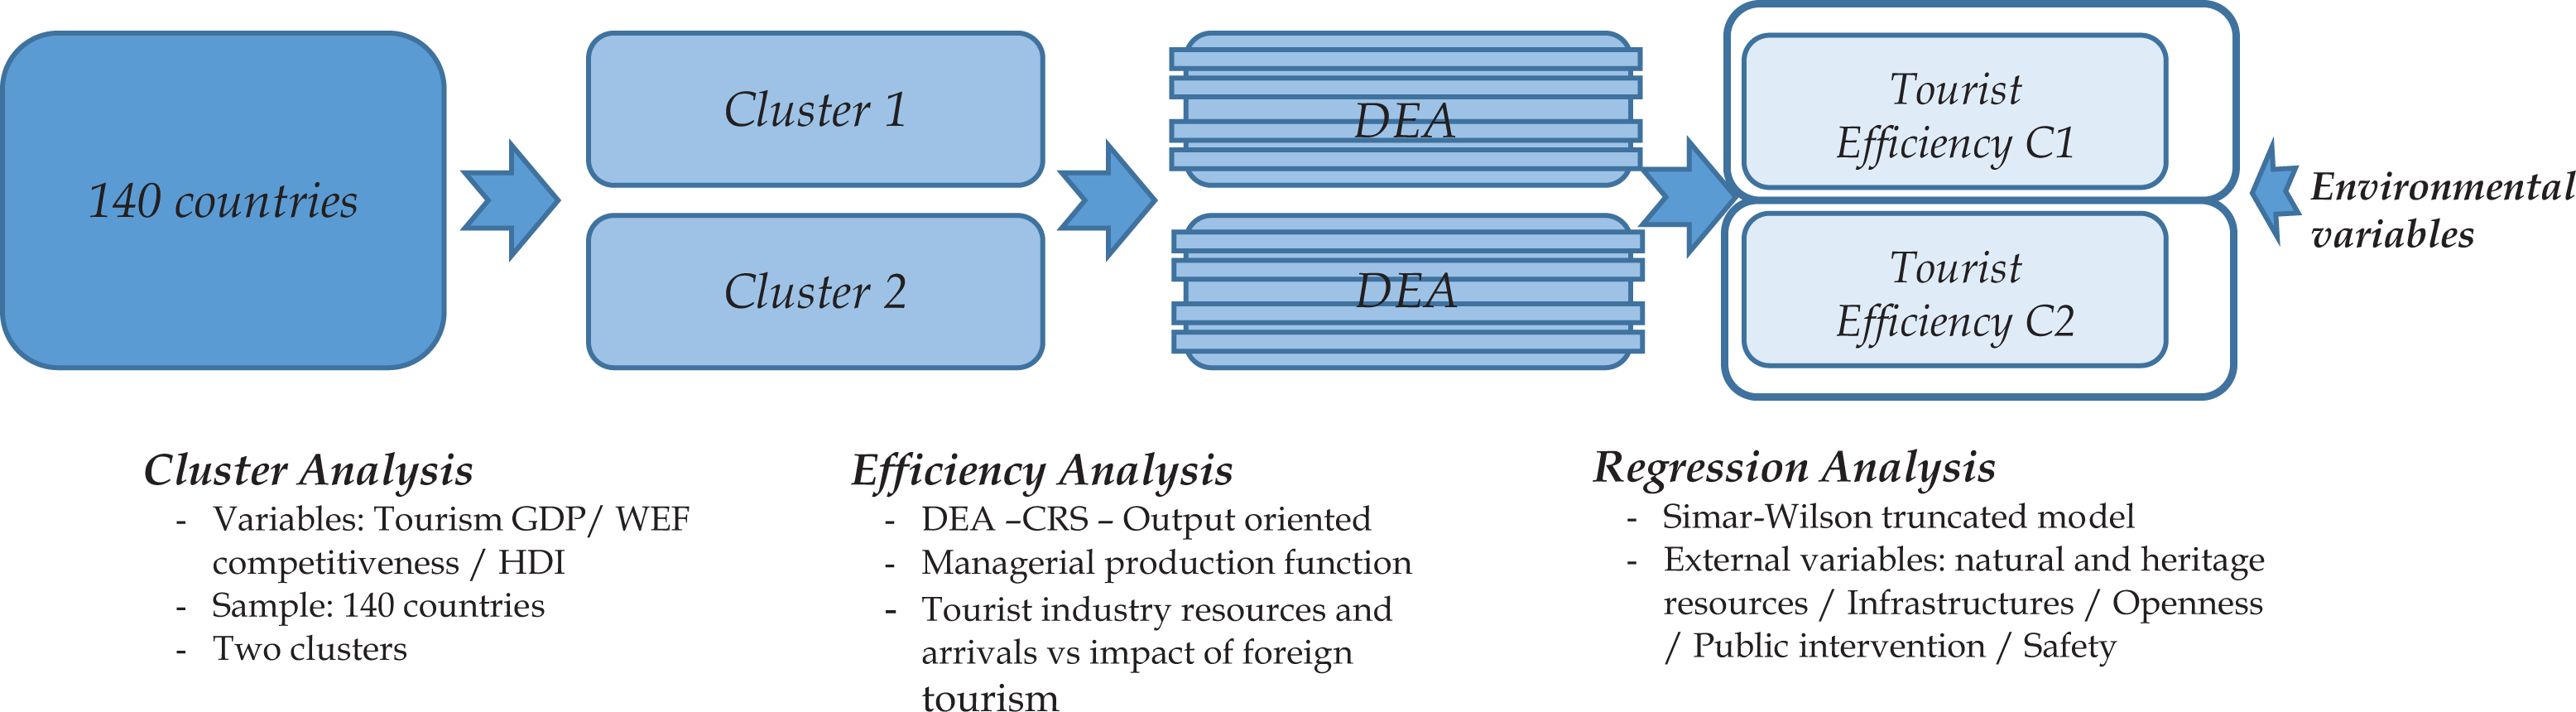
Summary of the methodological approach by steps.
As regards cluster analysis, the model used is the non-hierarchical k-means method based on the centroid approach. The variables to be discriminated into homogeneous groups are related to the level of economic development and the importance of the tourist industry, and we consider mainly three variables: the HDI, the GDP generated by the tourist industry in each country and, finally, the result of the WEF tourism competitiveness indicator, which sums up the main tourist attractions. Through this, we enrich the characterization variables compared to other previous related works which only consider economic development indicators. We can therefore obtain groups which merge countries that have enormous tourist power even though their level of economic development is lower. 3
Having obtained the groups of countries that are most alike, we implement the efficiency analysis, in accordance with the two-stage conditioned efficiency model. The first stage is applied through the model most commonly used to gauge performance, namely the non-parametric DEA method developed by Charnes et al. (1978), based on the precepts established by Farrell (1957). DEA is a non-parametric frontier method used to assess the production efficiency of a group of units by calculating an envelope with the units which evidence the best practices and their linear combinations. Units located below the frontier are considered to be inefficient. Their relative efficiency may be quantified by the distance separating them from the optimal frontier. 4 The principal advantage of DEA is that there is no need to establish the functional form of the production function a priori, since it can be deduced with the data incorporated, as a solution to the problem of optimization between resources and results (Raju and Kumar, 2006). Nevertheless, this method does evidence certain limitations that should be taken into account (see Dyson et al., 2001; Gómez-Vega, 2019). One of the most serious involves the need for a relatively homogeneous sample of units, within diversity, that allows conclusions to be extracted and bias to be minimized; hence, the appropriateness of using cluster analysis as a previous grouping technique.
As for the technical issues, DEA is grounded on designing a production function, in our case for territorial entities, and embracing the resources or inputs which, when combined, generate a series of outputs. From a hypothetical standpoint, this implies that in our study countries can manage their tourism resources (arrivals of international tourists, hotel accommodation rooms and employment in the tourist sector) to maximize an outcome (revenue generated by international tourists). The output used may be considered a complex variable, since it refers to the impact of international tourism in a broad sense, given that its value implies, in addition to the economic flow generated, the number of overnight stays by international tourists, their level of rent and so on. We therefore assume that we are evaluating a managerial type of production function, where what we are aiming to maximize is the economic impact of foreign tourist flow, based on the management of tourist industry labour and capital resources together with the given volume of tourist arrivals. This follows the line of the works of (Sánchez-Rivero and Pulido-Fernández, 2020) which have found that the number of tourist arrivals is not the best measure of competitiveness and tourism success. Rather, it is the volume of income generated from these tourists that should be considered, particularly when assessing tourism’s contribution to economic growth.
The DEA efficiency evaluation model entails a number of assumptions. In our case, we posit an orientation towards maximizing output; in other words, maximizing revenue based on given tourism resources, which adapts better to our production function and which follows other works that adopt a similar approach (Assaf and Agbola, 2011; Assaf and Cvelbar, 2010). Moreover, we maintain a technological hypothesis of constant returns to scale, given that we are aiming to measure pure technical efficiency. Since we start with more homogeneous samples, it is not necessary to consider significant differences in scale, as would be the case with the variable returns to scale model.
We consider n countries or units to be evaluated. The output-oriented DEA calculates a result θi for each of the units, giving a solution to the linear program i = 1,…, n, under the assumption of constant returns to scale
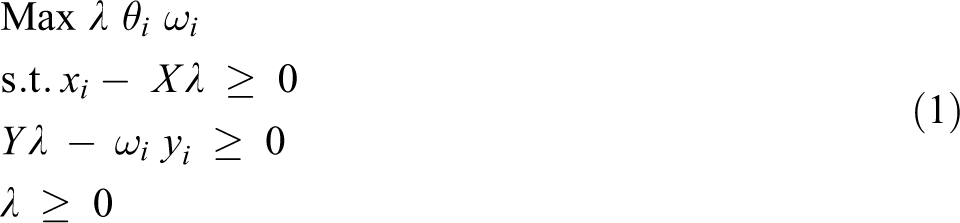
where xi and yi are, respectively, the input and output of i countries; X is the input matrix, while Y is the output matrix, and λ is a vector of n × 1 variables. 5
As regards the regression analysis, we assume that the tourism efficiency of the countries analysed, in other words the maximization of the impact of international tourism, is affected by contextual variables that shape their production process, without directly forming part of it. This analysis helps to explain any inefficient results that might not be due to bad practices but to the effect of contextual variables. In our case, these mainly include socio-economic factors as well as the cultural and natural resources that prove significant to a country (Croes and Semrad, 2013). This provides us with an insight into which variables shape tourism management performance at a global scale and also indicates whether the effect helps to create an environment that is conducive to efficiency or whether by contrast it triggers adverse conditions. The method used for this is algorithm 1 by Simar and Wilson (2007), which is considered the most appropriate when combined with DEA, since it eliminates the usual biases attributed to truncated regression models, such as the correlation stemming from the fact that the efficiency calculation of a unit incorporates information from other observations in the sample. 6 Essentially, it requires simulating a sensible data-generating process from which to create artificial bootstrap samples and then constructing standard errors and confidence intervals for the parameters of interest through bootstrapping.
Based on the above, we posit a regression analysis in which the efficiency ratios generated during the first stage are included as a dependent variable, and the so-called contextual variables or external factors are included as explanatory variables, in accordance with the following

where
Case study
Our analysis of tourism efficiency evaluation embraces 140 countries at a global scale. 7 It is a heterogeneous sample, since it involves extremely diverse countries, both socio-economically speaking and as regards cultural idiosyncrasy as well as in purely tourism terms. Nevertheless, the globalized nature of today’s tourist industry justifies the interest in seeking a model that can measure the efficiency of destinations at a world scale. The information used is taken from the WEF, 8 which publishes a tourism competitiveness indicator that sums up the main tourist attractions of destinations for 2019.
In our production process, we distinguish three inputs: arrivals of international tourists, as a general flow; the number workers in the tourist sector, as a labour factor; and the number of hotel rooms, as the tourist accommodation capacity. On the other side, we have a single output, the revenue generated from tourism, which measures the destination’s tourism impact in monetary terms. It should be noted that we are not considering the flow of domestic tourism, given the lack of homogeneous data, such that we confine the study to the impact of international tourism, which might entail some problems vis-à-vis identifying excess hotel capacity in the efficiency analysis for certain countries. In addition, tourism revenue taken as output reflects a wide concept of the impact of tourism, since it embraces the number of overnight stays and the type of tourism. As a result, the production function adopts a managerial design which expresses our desire to measure the efficiency of destinations as maximizing the profitability of the international tourist sector based on the available resources (arrivals, employment and hotel capacity).
As regards the two-stage efficiency analysis, we seek to sum up the main external factors which help to foster it or, in contrast, which prevent countries from implementing good practices. We therefore include cultural and natural heritage endowment variables, which reflects a destination’s greater reputation in terms of its appeal. As for destinations’ accessibility, we consider a variable related to the flow of air traffic, in terms of the number of domestic airline company departures. In addition, we include a variable which measures inhabitants’ perception of government support for the tourist industry, quantified on a scale of (1–7) and an indicator of a country’s international openness expressed through the degree of visa requirements for tourist entry. Finally, there are two factors related to the degree of economic development; per capita GDP, from the perspective of the country’s relative wealth, and an indicator of technological development, which is proxied through the percentage of Internet users. 9
Empirical analysis
This section presents the results to emerge from the empirical application, in accordance with each of the three methodological stages undertaken: cluster analysis, efficiency evaluation and regression model, conducting a critical study and interpretation of the results at each stage. 10
Results of cluster analysis
As mentioned earlier, our main objective is to measure tourism efficiency at a global scale, seeking to avoid sample heterogeneity in the 140 countries that make up our study, and which might affect the estimation and interpretation of the results. Consequently, as a first stage of the empirical application, we use the k-means multivariate cluster analysis technique. To describe the model, we drew on a number of clusters previously defined as two. 11 The variables considered to divide the sample are intended to sum up the importance of each country’s tourist sector, through tourism GDP, 12 as well as in terms of competitiveness through the WEF competitiveness index. We include a third variable reflecting the level of economic development, used by Hadad et al. (2012), the HDI. The resulting groupings can be seen in Table 2. As mentioned, there are two clusters: the first, which comprises 63 countries, includes destinations that display a medium/high level of development, with strong tourism competitiveness, coupled with above-average tourism GDP; the second cluster is made up of 77 countries whose HDI is medium/low, who exhibit a low level of tourism competitiveness and who evidence below-average tourism GDP.
Cluster analysis results.
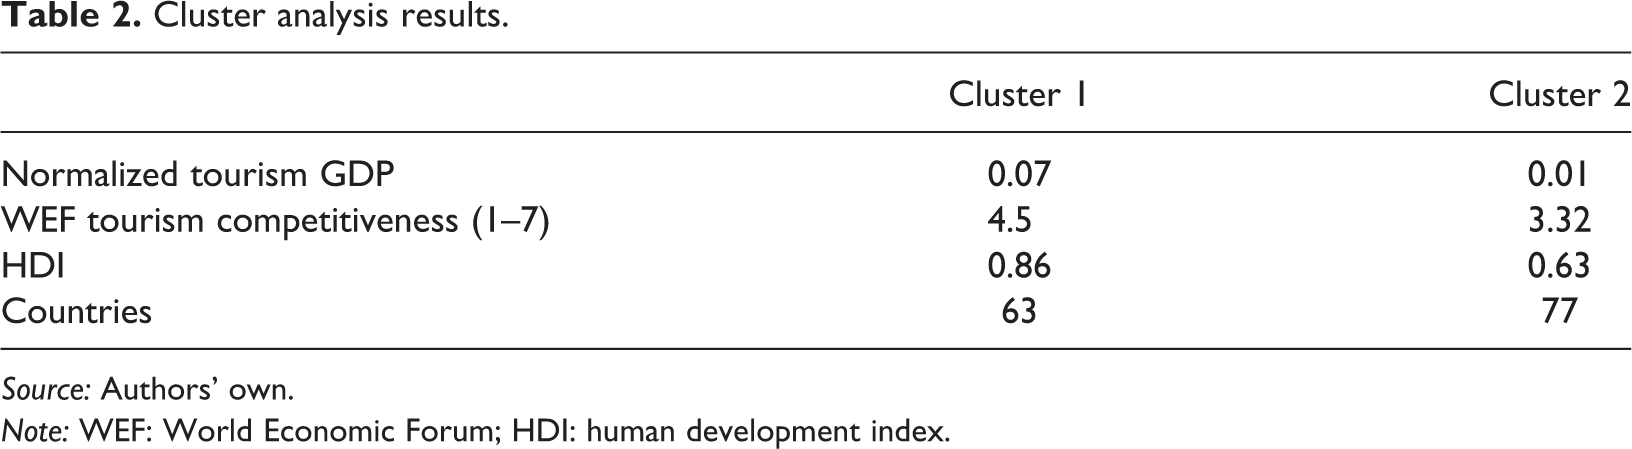
Source: Authors’ own.
Note: WEF: World Economic Forum; HDI: human development index.
In conclusion, the sample is divided into two blocks that display greater homogeneity, although not only in terms of their level of development but also taking into account tourism factors, since there are countries that are not very developed but which are competitive in terms of tourism, such as various central American or Asian countries. There may be a certain scale effect in evidence in the clusters, in the sense that the first group contains larger countries, whereas the second contains countries that are generally smaller. 13 Group 1 contains some countries that have a medium HDI, such as Peru, India or Indonesia, but which display medium/high tourism competitiveness results together with a relatively high tourism GDP. This leads us assume that in terms of tourism efficiency they may be evidencing good practices. As a result, it would seem more appropriate to compare them to countries with a high HDI and competitiveness. On the other hand, group 2 contains countries such as Iran, Saudi Arabia or Uruguay, with an above-average HDI, but whose tourism competitiveness is still low and who are therefore included in this cluster.
Efficiency analysis results
Having standardized the sample, we apply DEA efficiency analysis to each of the groups. We thus believe that the results are comparable independently in the countries within each cluster, although the efficiency ratios between groups may not be directly compared, since they do not have the same reference points in the calculation process. Table 3 provides the descriptive statistics of the variables that make up the production process for each cluster.
Descriptive statistics of variables used in the empirical application by cluster.
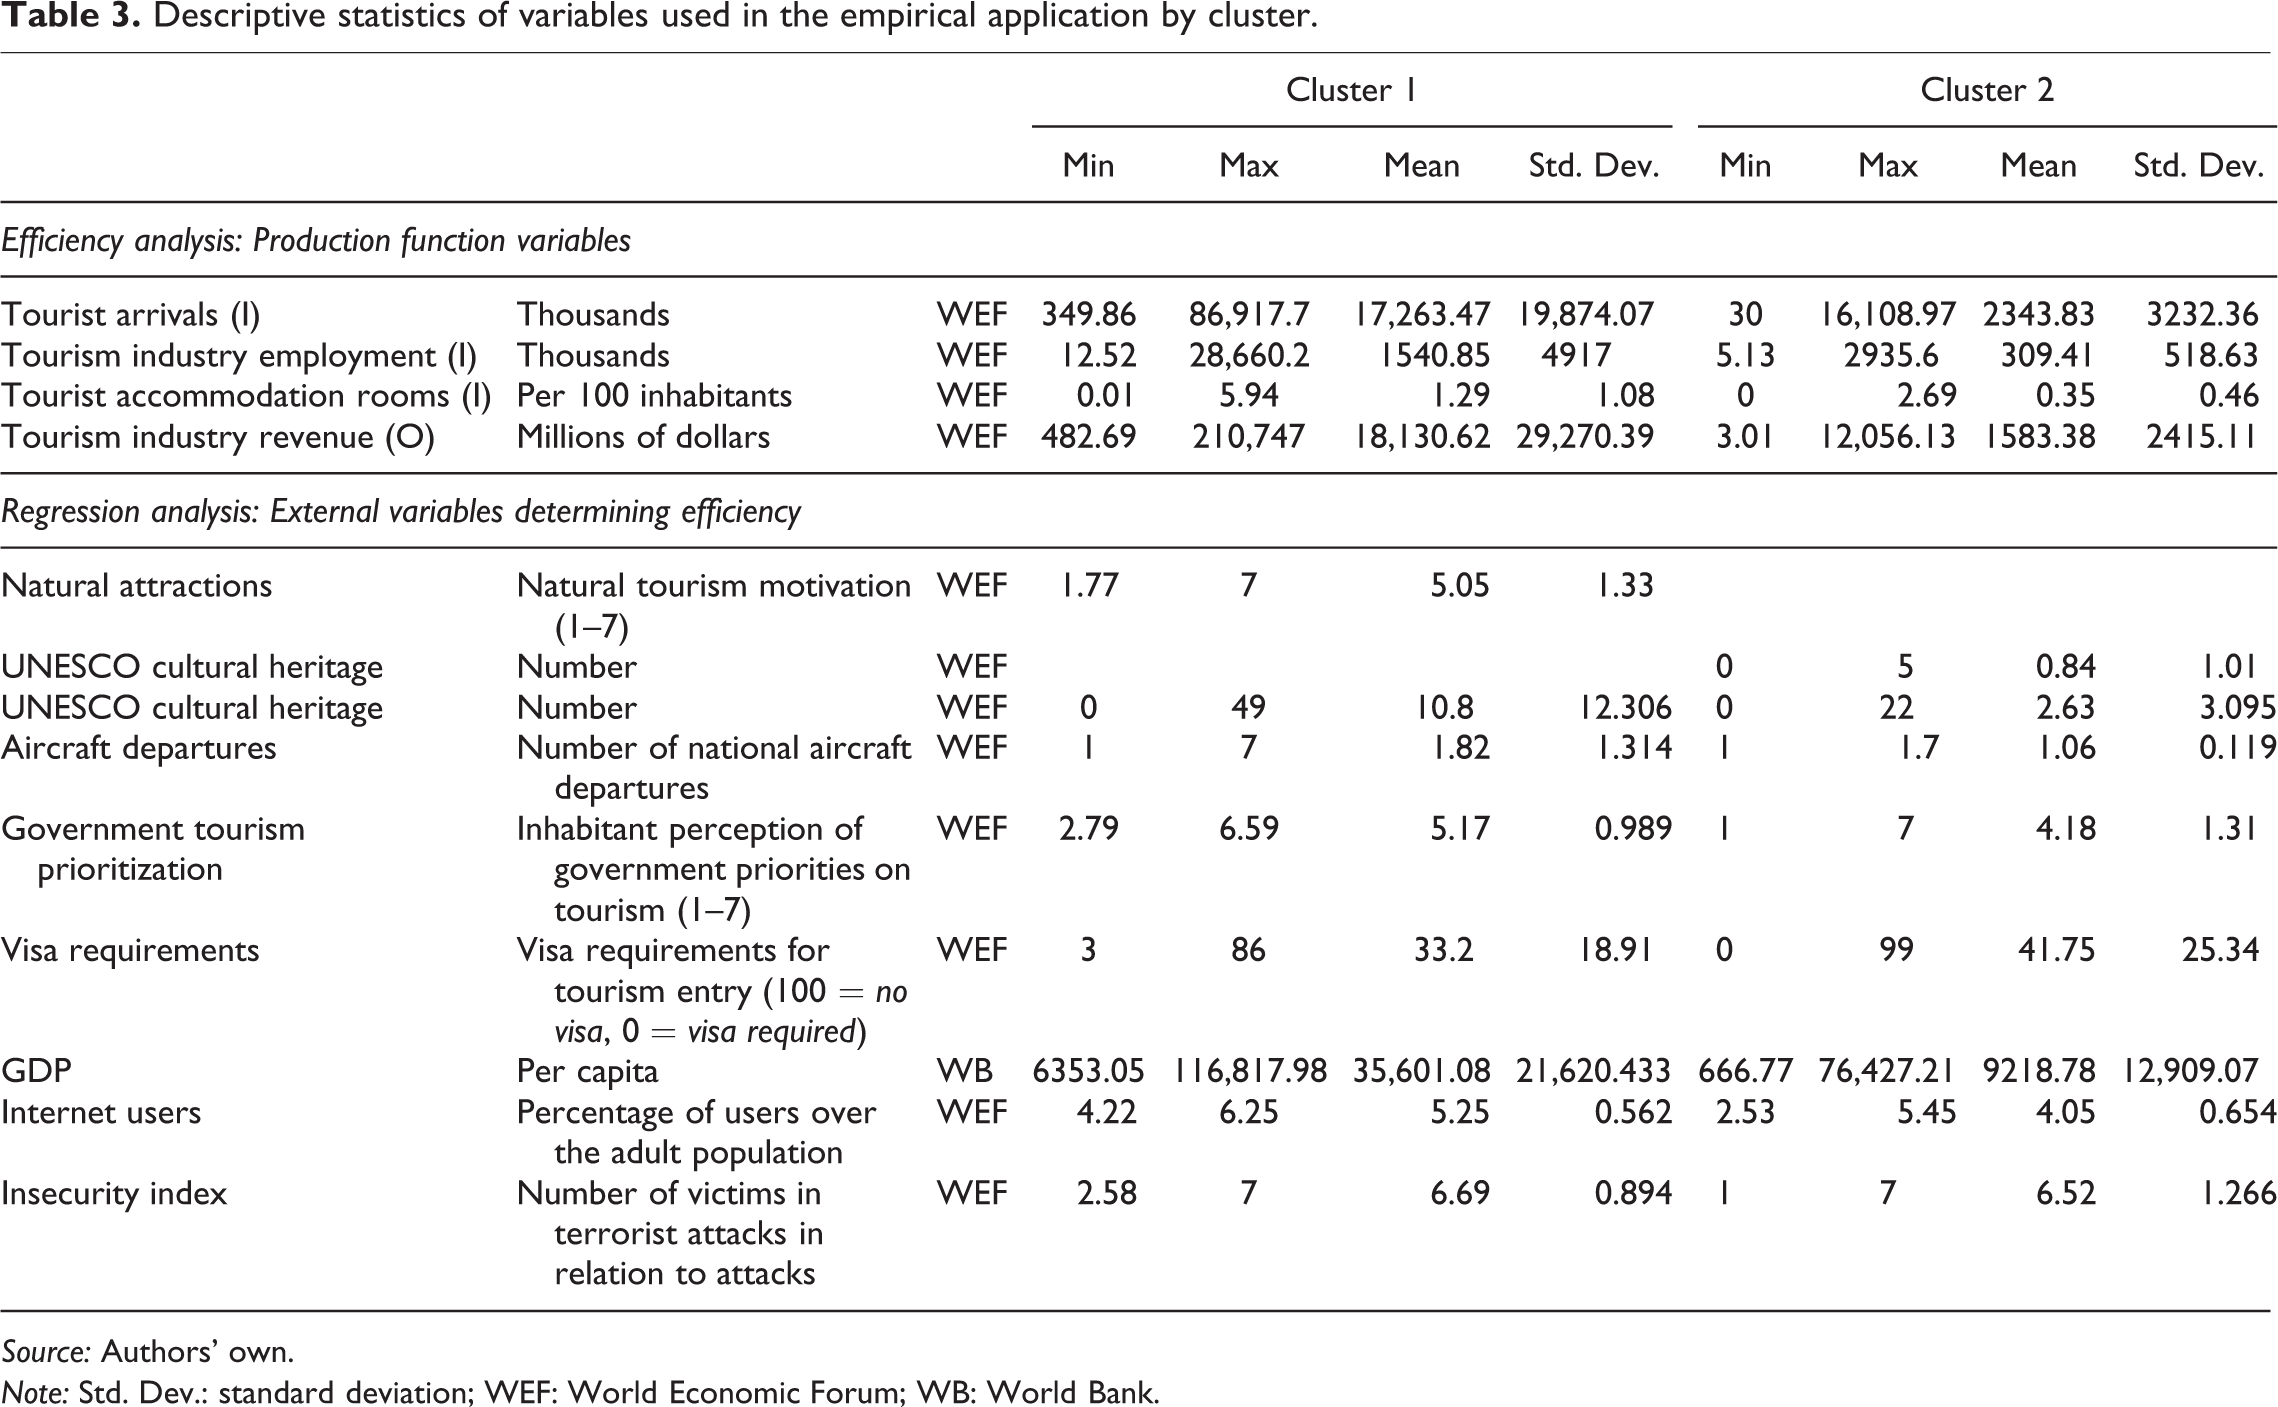
Source: Authors’ own.
Note: Std. Dev.: standard deviation; WEF: World Economic Forum; WB: World Bank.
Following the approach for the model set out in the ‘Methodological application’ section, we calculated the efficiency indicator independently for each cluster. The results can be seen in Table 4, which shows the indices for the 15 most and least efficient countries in each group. 14 We see how for the countries in cluster 1, those with the higher HDI, competitiveness and tourism GDP, that the most efficient at maximizing international tourism impact are Australia, Hong Kong, India, Luxemburg and the United States. All of these countries lie at the efficient case frontier. These are followed by tourism superpowers like France, Spain, China and a group of small countries (Israel, Belgium, etc.). At the other end of the scale are countries such as Oman, Peru, Rumania, Argentina and Chile, all of whom exhibit efficiency ratios below 20%; in other words, with a margin of improvement of over 80%. Cluster 2, which contains countries that have a medium/low HDI, competitiveness and tourism GDP, shows Angola, Bangladesh, Egypt, Iran or Jordan on the efficiency frontier, while in the lower range, we mainly find African countries such as Lesotho, the Congo, Tajikistan, Malawi or Burundi, who evidence extremely low efficiency results below 2%.
Efficiency analysis results by cluster: Top and last 15.
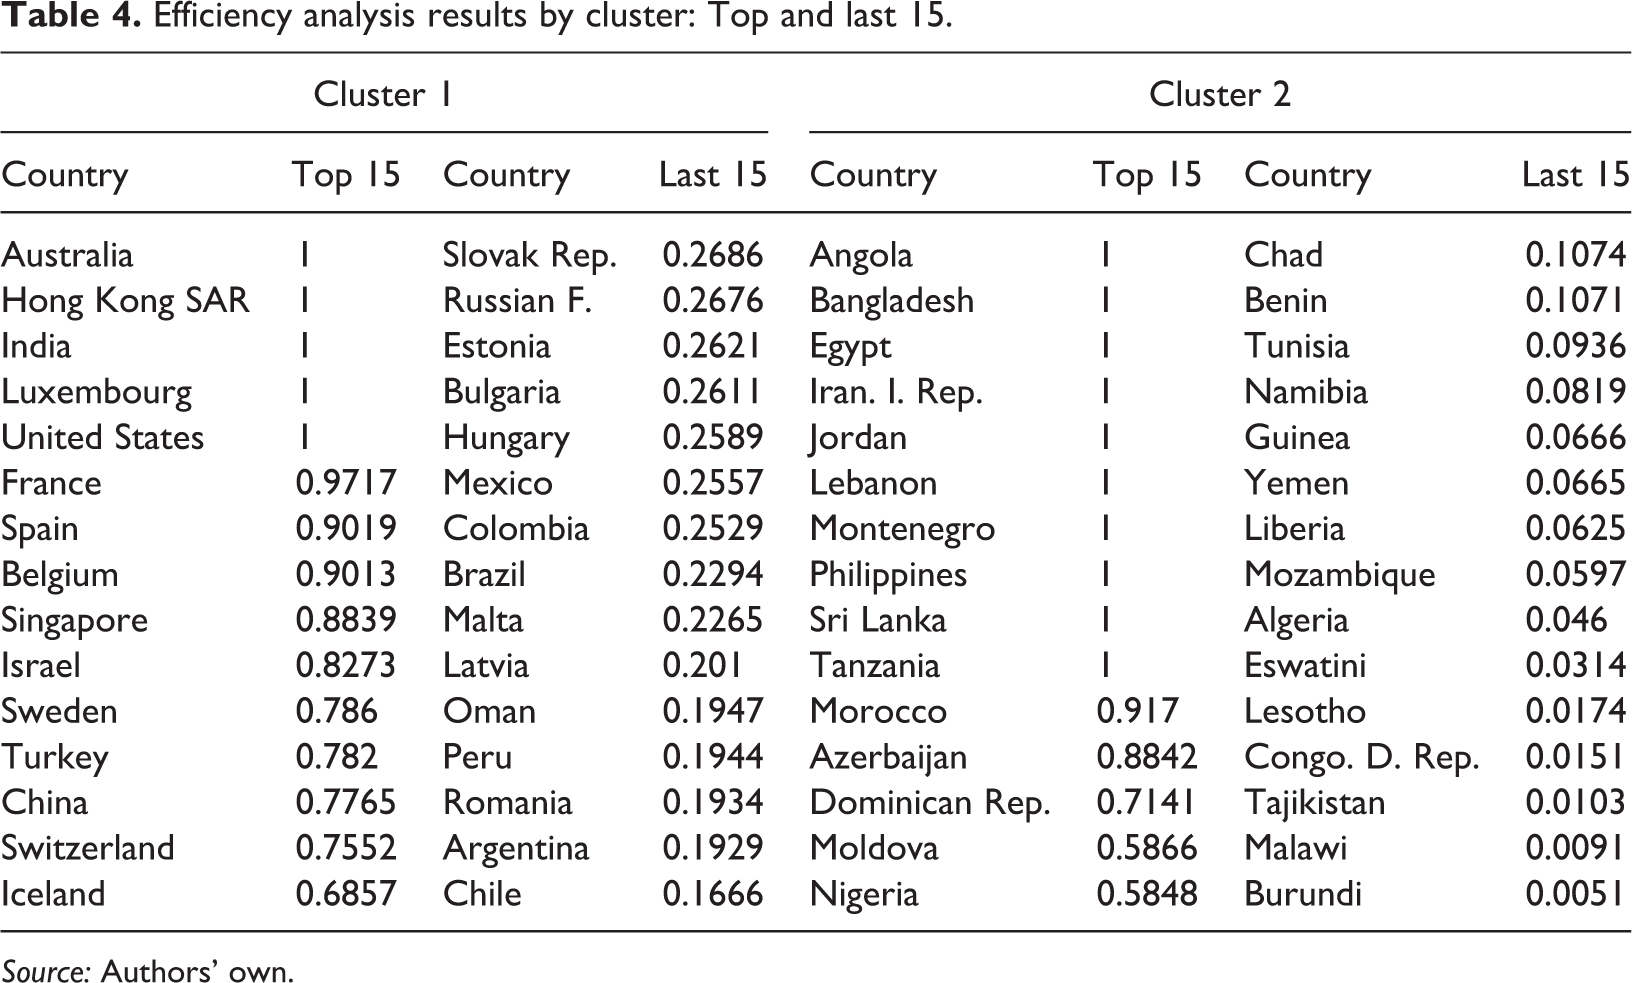
Source: Authors’ own.
It is worth mentioning the mean efficiency of each cluster, which presents a noticeably higher result in cluster 1, with a figure of 50.04%, which is to be expected, since it contains the most competitive countries in tourism terms. For its part, cluster 2 achieves a mean efficiency of 38.40%. In both instances, efficiency exhibits clear room for improvement, such that it is particularly significant to note the impact of external factors vis-à-vis providing explanatory information for the levels of inefficiency recorded. At this juncture, it should be pointed out that taking into account domestic tourism might explain part of the oversizing evident on the supply side of accommodation in certain countries. However, as stated earlier, this could not be verified due to the lack of homogeneous data. Nevertheless, the usefulness of the results lies in the fact that they do provide a global efficiency ranking in terms of attracting international tourism.
Figure 2 shows the results of a Kernel dispersion analysis, 15 which provides us with a picture of the efficiency distribution for each cluster. Broadly speaking, both distributions display a very similar profile, with moderate dispersion. The red line (cluster 2) evidences a clear mode around the value 0.3. For its part, in the blue line (cluster 1), we see how the distribution gradually shifts to the right; in other words, towards a greater efficiency range, with a mode of around 0.4. Both distributions evidence a long tail which extends to the right, with a noticeable new efficiency concentration of around 0.9.
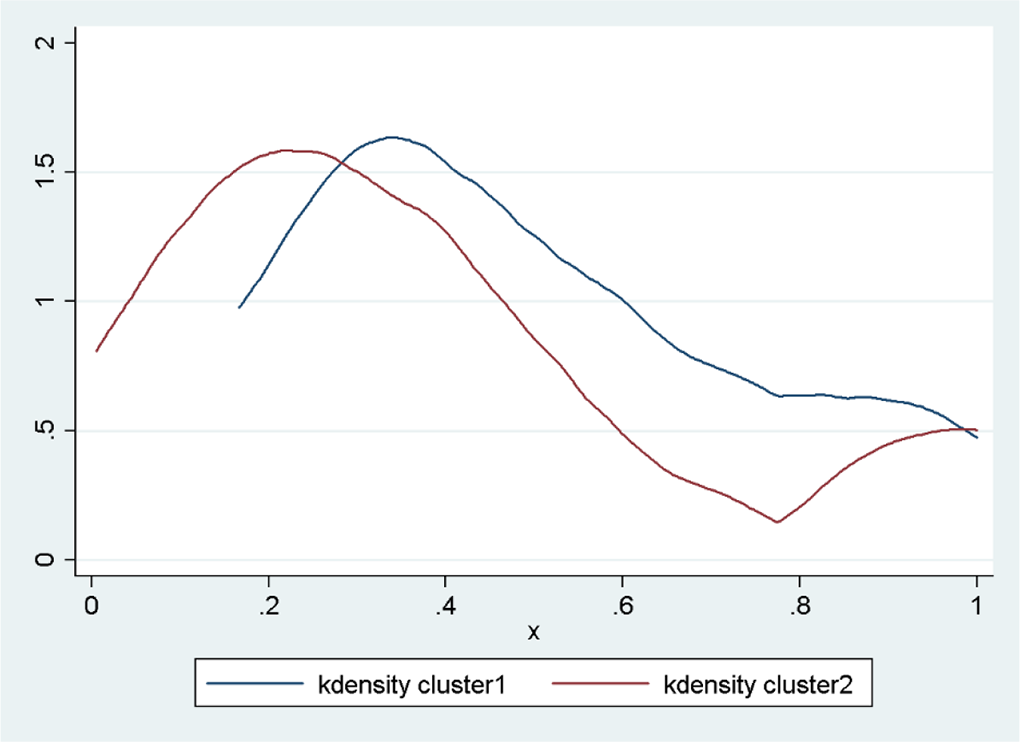
Kernel density analysis of efficiency by cluster. Source: authors’ own.
Results of the regression analysis of external factors
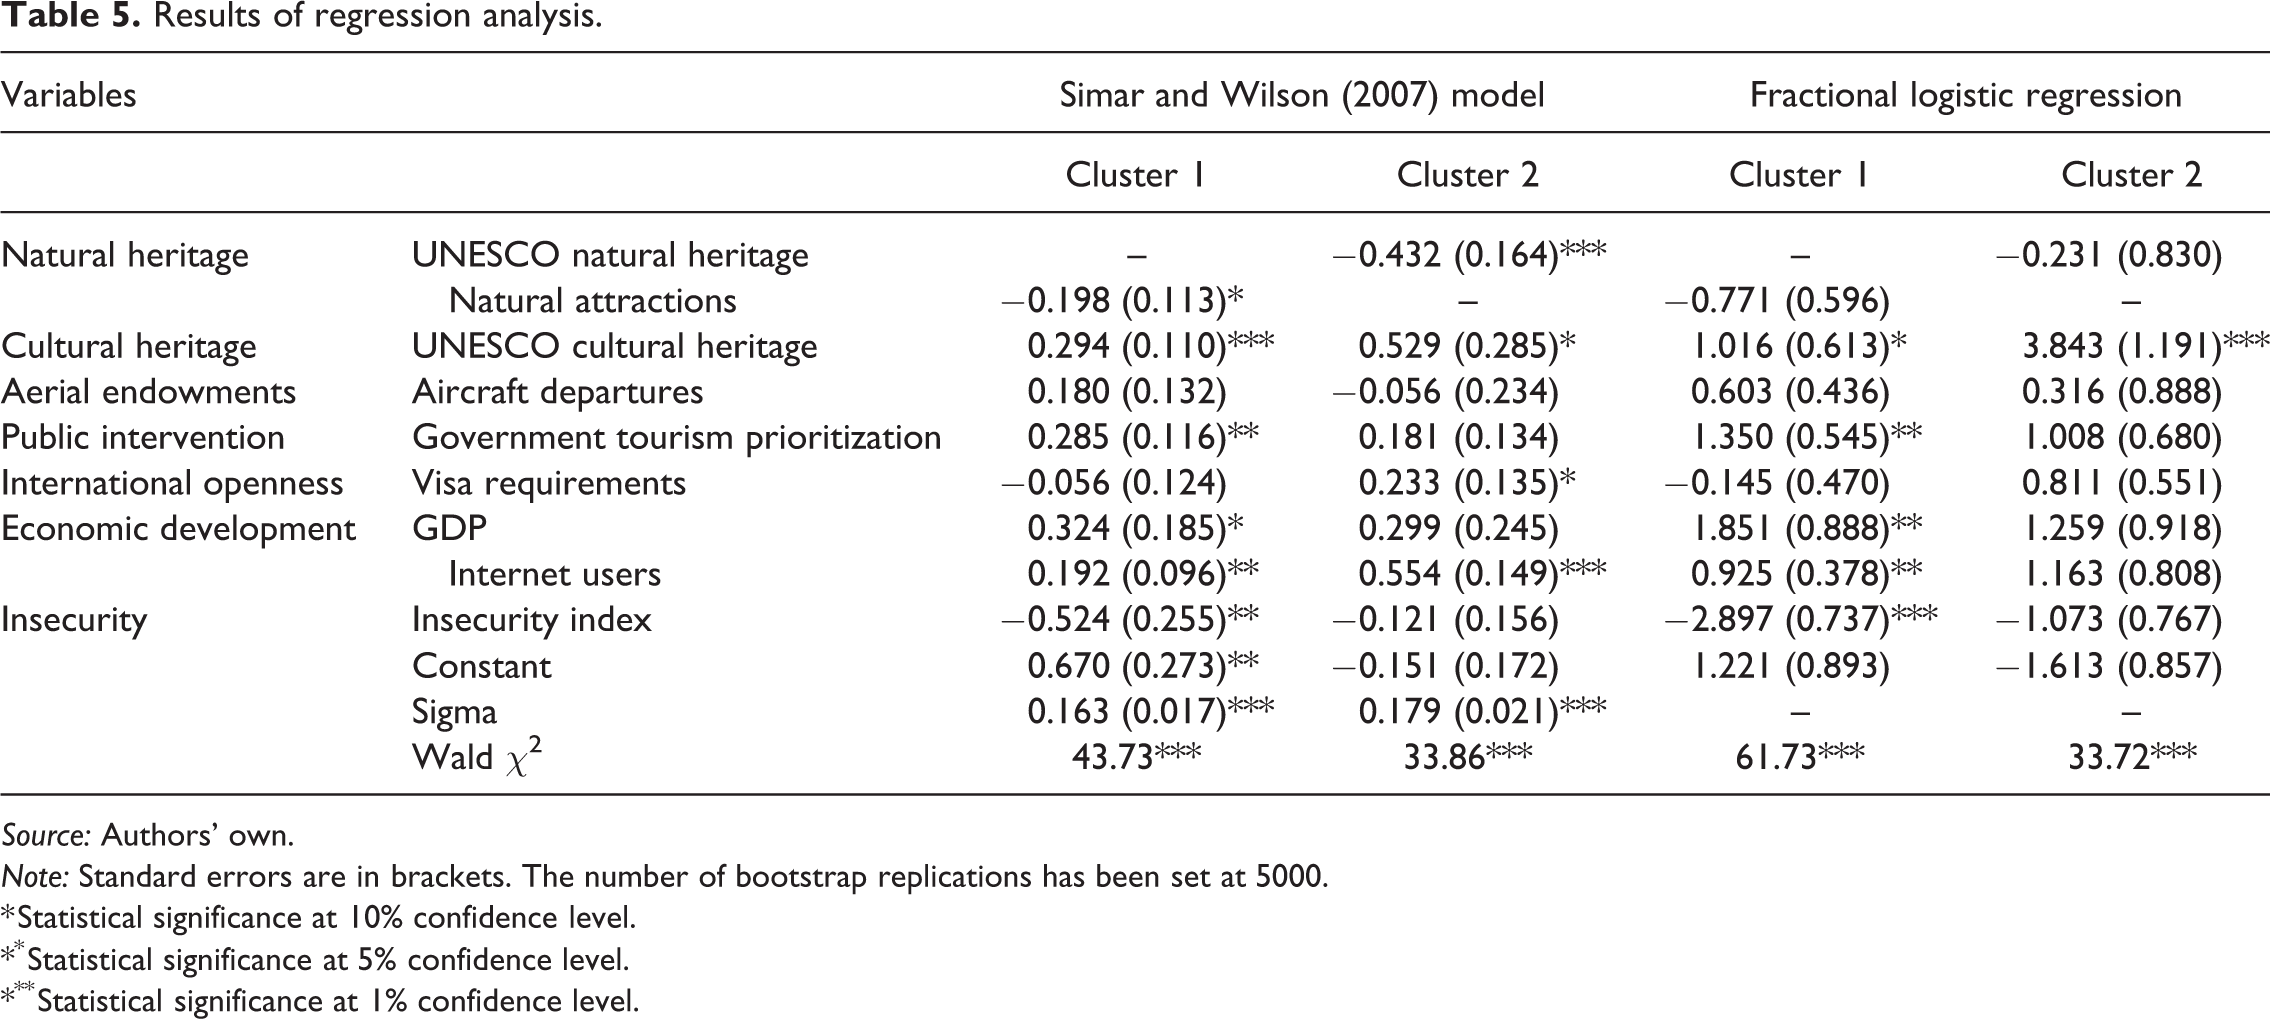
In this section, we apply the regression analysis following the model proposed by Simar and Wilson (2007). This stage aims to ascertain which external factors are driving the suboptimal results in tourism efficiency analysis. As set out earlier, the variables considered seek to sum up which features related to the accumulation of cultural and natural heritage might impact the degree of tourist appeal; aircraft departures that are an accessibility factor, public intervention in the tourist sector, as a measure of government effort in this regard; visa requirements as an indicator of countries’ international openness and, finally, variables related to the level of economic development (such as GDP and Internet users) and lack of security. Table 3 also gives the main descriptive statistics of the variables in the second stage. The model is estimated following Simar and Wilson’s algorithm 1 (2007), including the DEA result as a dependent variable, with a bootstrap of 5000 replications to extract the coefficients, at a 95% confidence interval. This process eliminates possible bias in the estimations (Jebali et al., 2017). Nevertheless, to extend the robustness analysis of the results, we applied a double-check regression with a fractional logistic model, which is also appropriate when studying efficiency ratios bounded between 0 and 1. Given that the efficiency ratios have been calculated independently for each cluster, the two regression models have also been duplicated for clusters 1 and 2. It should also be pointed out that the set of external variables is identical for the two clusters, except for natural resources which, in the case of cluster 1, required a suitable substitute comparable to the UNESCO listings, given the scant number of nominations recorded by these countries in this line. Since the calculations are independent for each cluster, the comparison is acceptable.
In addition, the variables vary slightly in the two models owing to the specific features of the subsamples, although they do refer to the same analytical concepts.
The results of the regression analysis are given in Table 5. The analysis in groups allows conclusions to be drawn concerning which factors determine each group of countries. Firstly, with regard to natural heritage factors, we see how the variable used for each cluster proves significant, but with a negative effect; in other words, natural resources do not seem to improve countries’ efficiency when it comes to attracting international tourism. This result is in line with the findings reported by Gómez-Vega and Herrero-Prieto (2018), specifically for Latin America. Additionally, this result may be related to the negative effect that oversizing the tourist industry might have had on the sustainability of natural resources, particularly in highly developed countries in cluster 1 (Buckley, 2012).
Results of regression analysis.
Source: Authors’ own.
Note: Standard errors are in brackets. The number of bootstrap replications has been set at 5000.
* Statistical significance at 10% confidence level.
** Statistical significance at 5% confidence level.
*** Statistical significance at 1% confidence level.
In the case of the variable reflecting UNESCO cultural heritage declarations, we see how its accumulation has a positive impact on tourism efficiency, as also reported by Figueroa et al. (2018) in Chile, and Herrero-Prieto and Gómez-Vega (2017) in Spain. When looking at the coefficients, we see how said effect is greater in cluster 2; in other words, countries that are less developed and less competitive find in the most renowned cultural resources a factor which maximizes the profitability of international tourism flows. Cultural tourism is becoming increasingly important at a global scale and UNESCO declarations help to project destinations and, therefore, attract a greater number of tourists, which in turn triggers a greater economic impact. Based on these results, and from a management point of view, policies dealing with conservation and increasing the visibility of cultural heritage may prove key when attempting to maximize tourist destination efficiency.
Aerial endowments measured as aircraft departures are not significant as regards the effects on efficiency in either of the groups. As regards the degree of public support for tourism as perceived by inhabitants, it is only significant for cluster 1, with a positive relation. We then find that countries which attach greater importance to policies boosting the tourist sector are able to generate the right context for achieving greater tourism efficiency. This also reinforces the importance of public efforts in terms of enhancing the tourist sector and coordinating the stakeholders involved, and as regards how productive national marketing campaigns and promoting national branding might be. The less competitive destinations might see this result as a driver to be worked on in future. As for the degree of international openness, the correlation is only significant in cluster 2, with a positive sign. Considering that this variable’s degree of disparity is narrow in cluster 1, the result can be interpreted as meaning that the lower the visa requirements for tourist entry, the greater the efficiency measured in terms of attraction and impact of foreign tourism. However, this is not merely a question of easier entry requirements for tourists but is related to a wider concept of openness, which is also usually linked to higher levels of political stability and social strength (World Travel & Tourism Council, 2019).
Within the variables related to developing destinations, GDP emerges as a significant variable in the first cluster, yet is not significant in the second. Due to the composition of the groups, we find countries in the first whose degree of economic development differs substantially but who form part of the same cluster because of the importance of their tourist sector. The coefficient of this variable indicates that within this diversity, countries who display a higher level of economic development also prove to be more efficient in terms of tourism. As highlighted in the results to emerge from the cluster analysis, a scale effect is apparent. The most efficient countries are those that are greater in size, which is linked to a higher GDP, although this effect is nuanced by the use of per capita GDP. In the second cluster, this variable is not significant. The percentage of Internet users, which proxies technological development, exerts a significant effect in both clusters. Put differently, a higher level of technological development enhances tourism efficiency.
Finally, the level of insecurity has a significant effect in the first group; in other words, it restricts the capacity of destinations in cluster 1 to be efficient in terms of maximizing economic impact, whereas in the second it is not significant. We interpret this as meaning that the level of safety might prove to be a barrier that discourages tourists from visiting less developed countries, although once they do decide to visit the destination it has no impact on the level of efficiency.
Finally, and with regard to the double-check regression scrutiny to reinforce the robustness analysis of the results, a fractional logistic model was applied, which is also adequate for ratios bounded between 0 and 1. Regression is also statistically consistent and we obtained virtually the same estimations, with correlation coefficients with the same sign direction for those which are significant. Results are slightly stricter, since some correlations become not significant, especially in cluster 2, whereas cluster 1 they maintain the same interpretation.
Conclusions
The present work posits an analysis of how efficient tourist destinations worldwide are at attracting international tourism in terms of economic impact. The study thus helps to overcome problems of sample heterogeneity inherent when working with countries that have tourist sectors and socioeconomic conditions which are very diverse. This is why we put forward a three-stage model, merging cluster analysis, to create homogeneous groups, DEA to obtain the efficiency indicator in each cluster, and finally regression analysis, revealing which external factors account for inefficient behaviour.
As regards the results, it should be pointed out that we obtain two clusters which, on the one hand, identify larger countries, namely those displaying a medium/high HDI as well as high levels of tourism competitiveness, coupled with an above-average tourism GDP (cluster 1); and on the other hand, countries that are generally smaller, that have medium/low levels of development and a weaker tourist industry, in terms of competitiveness and GDP (cluster 2). Based on these results, we conducted an efficiency analysis, perceived as an opportunity to maximize the profitability derived from international tourism, given the resources to emerge from the flow of arrivals, accommodation capacity and the importance attached to the tourist industry. Located on the optimal frontier in the first cluster are Australia, Hong Kong, India, Luxemburg and the United States, whereas in the lowest positions are mainly to be found countries in South America, Central America and Eastern Europe. In cluster 2, the most competitive positions are occupied by Angola, Egypt and countries in the Middle East as well as Asia such as Iran, Jordan, Lebanon, the Philippines or Sri Lanka, whereas the least efficient are mainly countries in North Africa, such as Tunisia and Algeria together with Sub-Saharan Africa, and Yemen. In addition, we observe that mean efficiency is over 10 points higher in the case of cluster 1, even though the mean of this group scarcely rises above 50%. As there are no similar studies, it is difficult to relativize this result. Nevertheless, we can state that, broadly speaking, the countries in our sample display margins for improvement when it comes to attracting international tourism, given the resources they possess.
The deterministic nature of DEA prevents us from attributing possible inefficiencies to external factors, such that applying the second-stage model proves particularly interesting. Through this, we identify different variables that shape countries’ efficiency. According to our model, renowned tourism resources, in terms of UNESCO declarations, exert a major effect, particularly for the less developed countries, and help to make them more visible. However, the variable related to natural resources has a negative effect. This indicates that tourists driven by a natural motivation, despite representing a significant flow at an international scale, do not contribute towards enhancing efficiency in terms of our study; in other words, in terms of the profitability of foreign tourism. The results of the variables related to public intervention help to underline the importance of the policy of promoting tourism and openness when it comes to developing efficient practices within the sector. With regard to economic development variables, we see how the GDP variable proves significant for cluster 1, since countries in said group display differing levels of development, although they do exhibit a more uniform and high level of competitiveness. To a certain extent, this result strengthens our hypothesis concerning the need to divide the sample not only in terms of development but also with regard to considering tourism factors. For its part, the positive effect of the Internet users variable indicates that those which show greater technological development tend to evidence better tourism practices. The results obtained with the insecurity variable imply that said variable is significant in the more competitive countries, whereas in the less competitive countries, and which have a lower HDI, it might prove to be a barrier, although it does not emerge as significant once the tourist has taken the decision to visit the country.
Finally, as for the utilities to be derived from research such as this, it is important to highlight that the discussion triggered may give rise to useful tools for tourism management in the context of the WTO, since the study could provide policymakers and tourist firm managers with sound information about the strengths and weaknesses of a sector which, as pointed out earlier, proves vital to economic growth today. In this sense, the main practical contribution involves gaining a deeper understanding of the variables that determine tourist destinations’ capacity to attract foreign tourism flows, an issue they should focus their efforts on to improve their position vis-à-vis rival destinations. We show that the accumulation of cultural resources has a crucial effect when boosting international tourism efficiency, as does the level of innovation and, to a certain extent, the country’s economic development. From a methodological perspective, by way of a principal innovation, this work puts forward a model to measure global tourism efficiency, and one which overcomes problems stemming from sample heterogeneity and that is applicable and reproducible based on other methodologies or production processes.
With regard to possible improvements and future lines of research connected with this work, we first have to say that it would be worth considering the flow of domestic tourism, whether in the production process or when providing the explanatory factors, because some of the inefficient results might be affected by the importance of this flow in some countries, giving rise to an excess of capacity for some tourist facilities. Furthermore, it would be interesting to expand the production function, specifically considering a greater number of relevant inputs from the tourist attraction resources. In this case, it may be pertinent to use network DEA models, which implies that the efficiency analysis is performed by dividing the production function in two stages: one first stage dealing with the relationship between tourist capital resources and labour to generate arrivals flow as main intermediate output, and a second stage, including the number of overnights to maximize the amount of revenue or profitability impact of tourism. Applying meta-frontier models to distinguish countries’ different tourist competence or even using dynamic Malmquist indices to estimate tourist productivity over time might also prove valuable. Finally, it would also be advisable to consider a greater number of characterization variables that can determine efficiency and competitiveness, such as pollution and environmental sustainability, issues related to social openness as well as the quality of democracy and the effect of globalization. Most of these issues have not been possible in this research, given the difficulties involved in compiling reliable indicators for the whole sample of countries without losing robust results. Increasing the time period analysed and using panel data might also be a good alternative for the future.
Supplemental material
Supplemental Material, sj-pdf-1-teu-10.1177_13548166211007598 - Clustering and country destination performance at a global scale: Determining factors of tourism competitiveness
Supplemental Material, sj-pdf-1-teu-10.1177_13548166211007598 for Clustering and country destination performance at a global scale: Determining factors of tourism competitiveness by Mafalda Gómez-Vega, Luis César Herrero-Prieto and Marcos Valdivia López in Tourism Economics
Footnotes
Acknowledgements
The authors would like to thank the support from the Regional Ministry of Education at the Regional Government of Castile and Leon (Spain) (project no. VA012G19), which allowed the present study to be carried out. The author Mafalda Gómez-Vega would also like to thank the support of the UNAM Postdoctoral Fellowship Program, since she has been a Fellow of the Regional Center for Multidisciplinary Research, advised by Dr Marcos Valdivia-López. The authors finally much appreciate the comments and discussion on a preliminary version of the article made by the participants at the 2nd Iberoamerican Workshop on Applied Cultural Economics, Valdivia, Chile (2019).
Declaration of conflicting interests
The authors declared no potential conflicts of interest with respect to the research, authorship, and/or publication of this article.
Funding
The author(s) received no financial support for the research, authorship, and/or publication of this article.
Supplemental material
Supplemental material for this article is available online.
Notes
References
Supplementary Material
Please find the following supplemental material available below.
For Open Access articles published under a Creative Commons License, all supplemental material carries the same license as the article it is associated with.
For non-Open Access articles published, all supplemental material carries a non-exclusive license, and permission requests for re-use of supplemental material or any part of supplemental material shall be sent directly to the copyright owner as specified in the copyright notice associated with the article.