
Abstract
Hotels often stay close to each other to exploit the agglomeration benefit. However, geographical proximity also parallels competition. This study used annual longitudinal hotel data from the 2016–2019 Indonesian Accommodation Survey to examine the relationship between competitive strategy and hotel performance. We constructed a capacity and quality distance index to capture hotel strategies and used the panel fixed effect method to address possible sorting behavior. Our estimates broadly suggest that conformity corresponds to a higher total revenue per available room. We attribute the result to labor pooling and lower consumer searching cost mechanisms. The results show that hotels that implement a conformity strategy in capacity or quality with neighboring hotels tend to have a higher total revenue per available room. It implies that a hotel’s conformity strategy can be a reference for investors and hoteliers in planning a profitable hotel business and creating sustainable and quality tourism.
Introduction
Hotels often stay close to each other to exploit the agglomeration benefit, including knowledge spillover, proximity to consumers, efficient infrastructure allocation, and better matching of job opportunities and skills between firms and workers (Gan and Hernandez, 2013). However, that proximity is also in parallel with competition, which may diminish the benefit (Baum and Haveman, 1997; Kalnins and Chung, 2004). Hotels will experience gains or losses, depending on the strategy taken. Mazzeo (2002) stated that the effectiveness of a particular strategy might relate to the other firms’ strategies in the same market. It is also important to determine how similar hotel products should be to their competitors (Baum and Haveman, 1997; Kim et al., 2020).
Previous studies have examined the relationship between competitive strategy and hotel performance. Hotels could choose to implement a conformity or differentiation strategy. Several studies support hotels choosing a differentiation strategy to reduce the effect of price competition or gain a competitive advantage (Becerra et al., 2013; Firoz S. et al., 2019; S. K. Lee, 2015; S. K. Lee et al., 2017; Porter, 1990). Chung and Kalnins (2001) also found that hotels in Texas benefitted when differentiating capacity from competitors. In contrast, Song L. et al. (2005) and Kim et al. (2020) support hotels adopting a conformity strategy to enjoy lower learning costs and gain higher performance.
Although there was some previous research on the impact of hotel strategy on performance, very little has been discussed about the mechanisms. Chung and Kalnins (2001) discussed the mechanism for increasing hotel performance through one of the benefits of agglomeration: lower customer search costs. They found chain affiliation effectively reduced search costs for customers in rural markets. Our study extends the literature by adding other potential mechanisms that could describe how competitive strategy impacts hotel performance. We suspect that the similarity of hotel characteristics will lead to labor pooling and lower customer search costs.
We use Indonesia, one of the top five countries that dominate the supply of hotel rooms in the Asia Pacific region (HVS, 2019), as a case study. The country is experiencing a surge in the number of hotels in line with the increase in the number of visiting tourists. Therefore, it is interesting to study the hotel’s strategy in competing with surrounding hotels. We focus on studying the characteristics of nearby hotels, so that hotels can determine strategies that improve their performance even though new hotel construction is still happening in Indonesia.
The relationship between the hotel’s competitive strategy and performance might be due to self-selection. To increase performance, firms purposefully choose their strategies (Hamilton and Nickerson, 2003). A hotel would not randomly select to conform to or differentiate from competitors in the capacity and quality dimensions, but instead self-select based on their expectations of how their strategic decision might influence future performance. Likewise, the random selection of hotel locations can affect strategic business planning and hotel profitability. Hence, the study utilized a panel fixed effect method to purge the bias from time-invariant unobservable related to the self-selection process. Island-specific year-fixed effects were also introduced to capture different results at the island level that may correlate with hotel strategy.
Our study has broadly shown that conformity is associated with higher total revenue per available room. Assuming that hotels with the same capacity also have the same worker requirements, research shows that conformity in a worker is associated with an increase in per-worker revenue. From the demand side, the study’s results stated that the more similar the quality of the hotel, the higher the number of guests per available room.
The paper fills three research gaps in this field. First, most empirical studies focus on strategies: namely, the benefits of being similar or being different (Baum and Haveman, 1997; Kim et al., 2020). However, these studies have not provided evidence of potential mechanisms of how competitive strategies affect hotel performance. We suspect that the effect of competitive strategy on hotel performance is related to the agglomeration theory. Canina et al. (2005) stated that agglomeration benefits from increasing production and enhanced demand. Likewise, Marshall (1920) stated that the benefits of agglomeration include labor pooling and reduced consumer search costs. Therefore, we enriched the existing literature by examining the potential mechanisms by which competitive strategies affect hotel performance through labor pooling and lower consumer search costs.
Second, a recent study showed that the effects of conformity strategies were heterogeneous across hotel locations. Previous research has shown a positive relationship between hotels located in urban areas and airports with hotel performance (Kim et al., 2020). However, no studies explain the effects of conformity strategies for hotels in tourist areas, business centers, and other areas. This paper shows the effects of strategic competitive heterogeneity across these three regions.
Third, most empirical studies in determining the characteristic distance of hotels do not use the distance between hotels as a weight (Baum and Haveman, 1997; Kim et al., 2020). Tobler (2004) stated that everything is related to everything else, but things that are nearer are more related than those that are further away. Our study includes distance between hotels as a weight in calculating the distance of the hotel characteristics to demonstrate the distance decay effect better.
The remaining sections of the essay are structured as follows. The second section is a literature review while the third section provides a context: hotel sector development in Indonesia. The fourth section explains the method, including the estimation approach and data to answer the main research question. The fifth section briefly analyzes the empirical results obtained from the previous section, while the sixth section offers conclusions.
Literature Review
Hotels are usually located adjacent to other hotels to benefit from agglomeration (Yang et al., 2014). Some works demonstrate a positive relationship between hotel concentration and performance (Canina et al., 2005; Chung and Kalnins, 2001). However, higher density among similar hotels can also lead to higher competition to acquire guests or input factors (McCann and Folta, 2008). The advantage or disadvantage of location proximity between firms depends on the relative strength of the effects of agglomeration and competition (Yang et al., 2014).
Literature provides two competing hypotheses on the hotel strategy of facing competition. Competitive strategies theory suggests that geographical competition differentiates hotels from neighboring hotels to maximize profit (Porter, 1990). Hotels differentiate to reduce the effect of price competition or gain a competitive advantage (Firoz S. et al., 2019; S. K. Lee, 2015; Porter, 1990). On the contrary, Marshall–Arrow–Romer’s (MAR) theory suggests that firms may opt to be characteristically indifferent to neighboring hotels to enjoy a lower learning cost and thus offer similar or comparable products (Song L. et al., 2005). Empirical studies find that hotels that have similarities with their closest competitors will gain greater profits. Urtasun and Gutiérrez (2006) stated that hotels that are agglomerated with other hotels of the same size and service would have a greater advantage. Kim et al. (2020) also show that hotels with the same capacity and quality as nearby hotels can produce a higher performance. However, the literature discussing potential mechanisms regarding the relationship between hotel strategy and performance is still limited.
Canina et al. (2005) and Chung and Kalnins (2001) further discuss proximity to competitors, which may be beneficial. They refer to Marshall (1920) that describes two types of gains: production enhancements and heightened demand. One of the benefits of agglomeration obtained from the production side is through labor market pooling. Labor market pooling makes it easier for job seekers to find work quickly, and companies can find workers with specific skills relevant to the industry (Andini et al., 2013). Labor pooling facilitates the job-matching process, so that it might reduce labor turnover and then boost labor productivity. Regarding demand advantages, agglomeration reduces the consumers' cost of searching (Marshall, 1920). Physical collocation might increase the likelihood of visitation and then heighten demand (Chung and Kalnins, 2001).
Furthermore, Canina et al. (2005) state that the agglomeration effect is only seen in luxury and economy hotels. Kim et al. (2020) distinguish the effect on the airport, urban, and conference hotels. In another study, Cró and Martins (2017) stated that there is a historical tendency for hotels to cluster in certain locations, such as the Central Business District (CBD) and tourist centers, due to the ease of accessibility. Visitors to the two regions tend to have different characteristics. Tourists visit tourist areas to enjoy the beauty of tourist attractions. They expect a hotel with several criteria, such as a clean, safe, comfortable hotel with friendly staff (Bowie and Buttle, 2004). Meanwhile, tourists who visit the business center invariably choose a location that provides various services. They are willing to pay more for easy access to the city center, where the hotel area is centrally located, between the CBD and the commercial zone (Yokeno, 1968).
Context: hotel sector development in Indonesia
Tourism is one of the most important sectors in Indonesia. This sector has developed into one of the fastest-growing sectors and contributed almost 5% to the Indonesian GDP in 2019. Indonesia has welcomed more than 10 million international visitors since 2015 and achieved 16.11 million in 2019 (Statistics Indonesia, 2020b). From the domestic side, the number of domestic visitors experienced an increasing trend until reaching a peak in 2019 of 722.16 million visits (Statistics Indonesia, 2021b).
The positive trend of Indonesian tourism attracts investors to establish new hotels in Indonesia. As a result, the number of star hotels jumped from 2387 hotels providing 233,007 hotel rooms in 2016, to 3516 hotels with 363,749 rooms in 2019 (Statistics Indonesia, 2016, 2020a). Various types of accommodation, such as non-star hotels, youth inns, tourist lodges, villas, bungalows, cottages, and others, also thrive in Indonesia. There were more than 25,000 of these types of accommodations, providing 412,276 rooms in 2019 (Statistics Indonesia et al., 2020a). The rapid growth of hotels makes Indonesia one of the five countries that dominate the supply of hotel rooms in the Asia Pacific region (HVS, 2019). As a result, it is interesting to study the hotel’s strategy in competing with surrounding hotels.
Method
Estimation approach
We first formed a unique competition set for each observation to determine the impact of competition strategy on hotel performance. Following Baum and Haveman (1997) and Kim et al. (2020), this study defines the 10 closest geographic neighbors of the focus hotel as its competitors. This paper utilizes geocoded information for each hotel to measure the proximity between hotels using the Euclidean distance formula. We also established several competitive sets: five, 11, 12, 13, 14, and 15 nearest neighbor hotels for the robustness test. Then, we determined the competitive strategy from each observation: whether the hotel tends to choose a conformity or differentiation strategy. The paper used Capacity Distance (CD) as the first measurement of competitive strategy. Estimating CD develops a study by Kim et al. (2020) by adding location distance as a weight. So, we calculated the CD by averaging the difference in the number of guest rooms available between the focal hotels with 10 nearby competitors by using location distance as a weight. The formula is

Our second measurement of competitive strategy is Quality Distance (QD). The procedure to calculate QD is similar to the CD, except that we now use the type of hotels to replace the number of rooms. This formula uses the six types of hotel quality (class): non-star, one-star, two-star, three-star, four-star, and five-star hotels. The formula is

Consequently, capacity/QD measures the degree of capacity/quality differentiation from a focal hotel to its 10 nearest competitors. A lower value of CD or QD indicates a firm has similar characteristics with its nearest neighboring hotels as its competitor, implying a conformity strategy.
Modeling the impact of competitive strategy on hotel performance is subject to endogeneity problems because the decision of a hotel’s location and strategy is not random. Hotel owners purposively have certain considerations when deciding on a hotel’s location and strategy. It involves observable factors and unobservable covariates, which may still lead to selection bias (McKenzie et al., 2010). Unobservable covariates that must be isolated include geographic and individual characteristics (for example, hotel owner’s vision and leadership characteristics). Therefore, this study implemented a panel fixed effect model to overcome these problems to achieve an unbiased and efficient inference. To reduce endogeneity issues, we included control variables at the hotel and region levels. The model also introduced individual fixed effects to account for unobserved heterogeneity at the hotel level. The model is

This paper also describes the potential mechanism of the relationship between competitive strategy and hotel performance. First, we regressed the variable worker distance and total revenue per worker based on equation (3). The method of calculating worker distance is also similar to the previous distance measures. We use the number of the workers in the formula

Then, to test the second potential mechanism, the research regressed the relationship between QD and the number of guests per available room.
The paper also tests the consistency of our baseline results by conducting several robustness checks on our model. First, the study applies different hotels’ competitive sets. We estimate the model in competitive sets that consist of the five, 11, 12, 13, 14, and 15 closest neighboring hotels. Second, we use the revenue per available room as the dependent variable to measure the hotel’s performance. Revenue per available room only calculates the revenue from the sales of hotel rooms. Appendix 1 presents a complete definition of all variables in this study.
Data
The research used data from the Annual Accommodation Survey by Statistics Indonesia. The survey collected information on the business characteristics of accommodation services, including star hotels, non-star hotels, tourist lodges, and other short-term accommodation provisions. We obtained data on hotel characteristics from the accommodation survey, such as the location, hotel quality, number of rooms sold, number of available rooms, room prices, chain management, availability of hotel facilities, and annual hotel revenue. The accommodation survey also provides precise information about the hotel’s location in the form of latitude and longitude. This information allows us to measure location distances between hotels, so that each hotel will have a unique competitive set. The research also utilized location distance information to make better measurements of capacity and QDs between hotels. The recent study sample is limited to the star and non-star hotels that had a series for 4 years (2016–2019) according to the limitations of accurate location data (geotagging) and minimizing bias due to the impact of COVID-19. Our panel data set was 28,024 firm-year observations from 7006 hotels. Figure 1 shows the distribution of hotels. There is a spatial tendency for hotels to be concentrated on the Java and Bali islands. Hotel distribution in Indonesia, 2016–2019. Source: The Annual Accommodation Survey by Statistics Indonesia.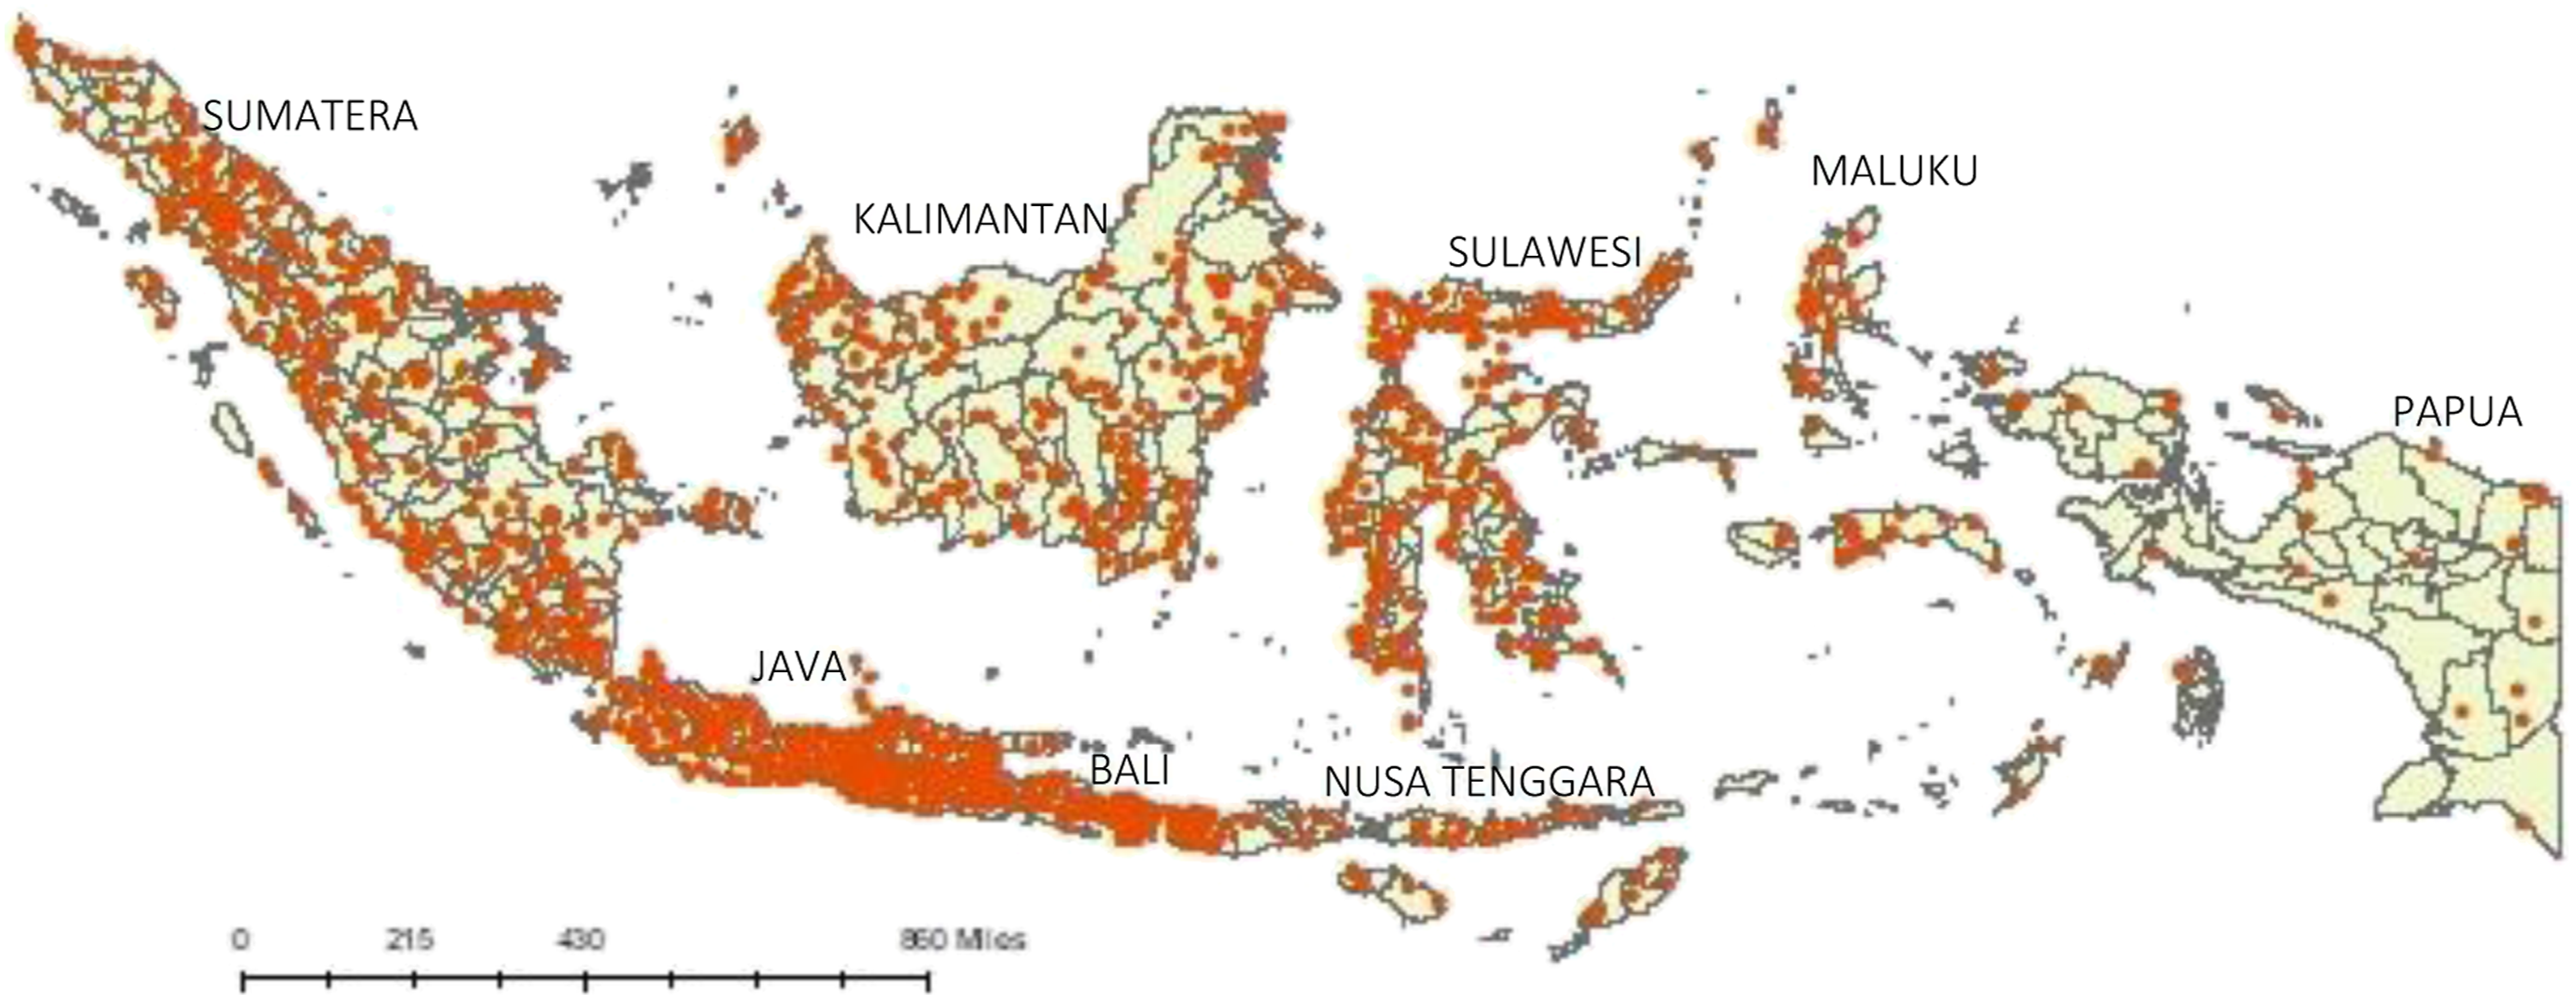
Before proceeding to the econometric results, we present descriptive statistics in Appendix 2. We divided CD and QD values into two groups using the median as the central tendency to simplify the tabulation. A negative relationship exists between total revenue per available room with CD and QD. The value of total revenue per available room tends to be higher for hotels that have a CD or QD below the median.
Results and analysis
Effects of competitive strategies on the total revenue per available room
The relationship between competitive strategies and total revenue per available room, baseline estimate.
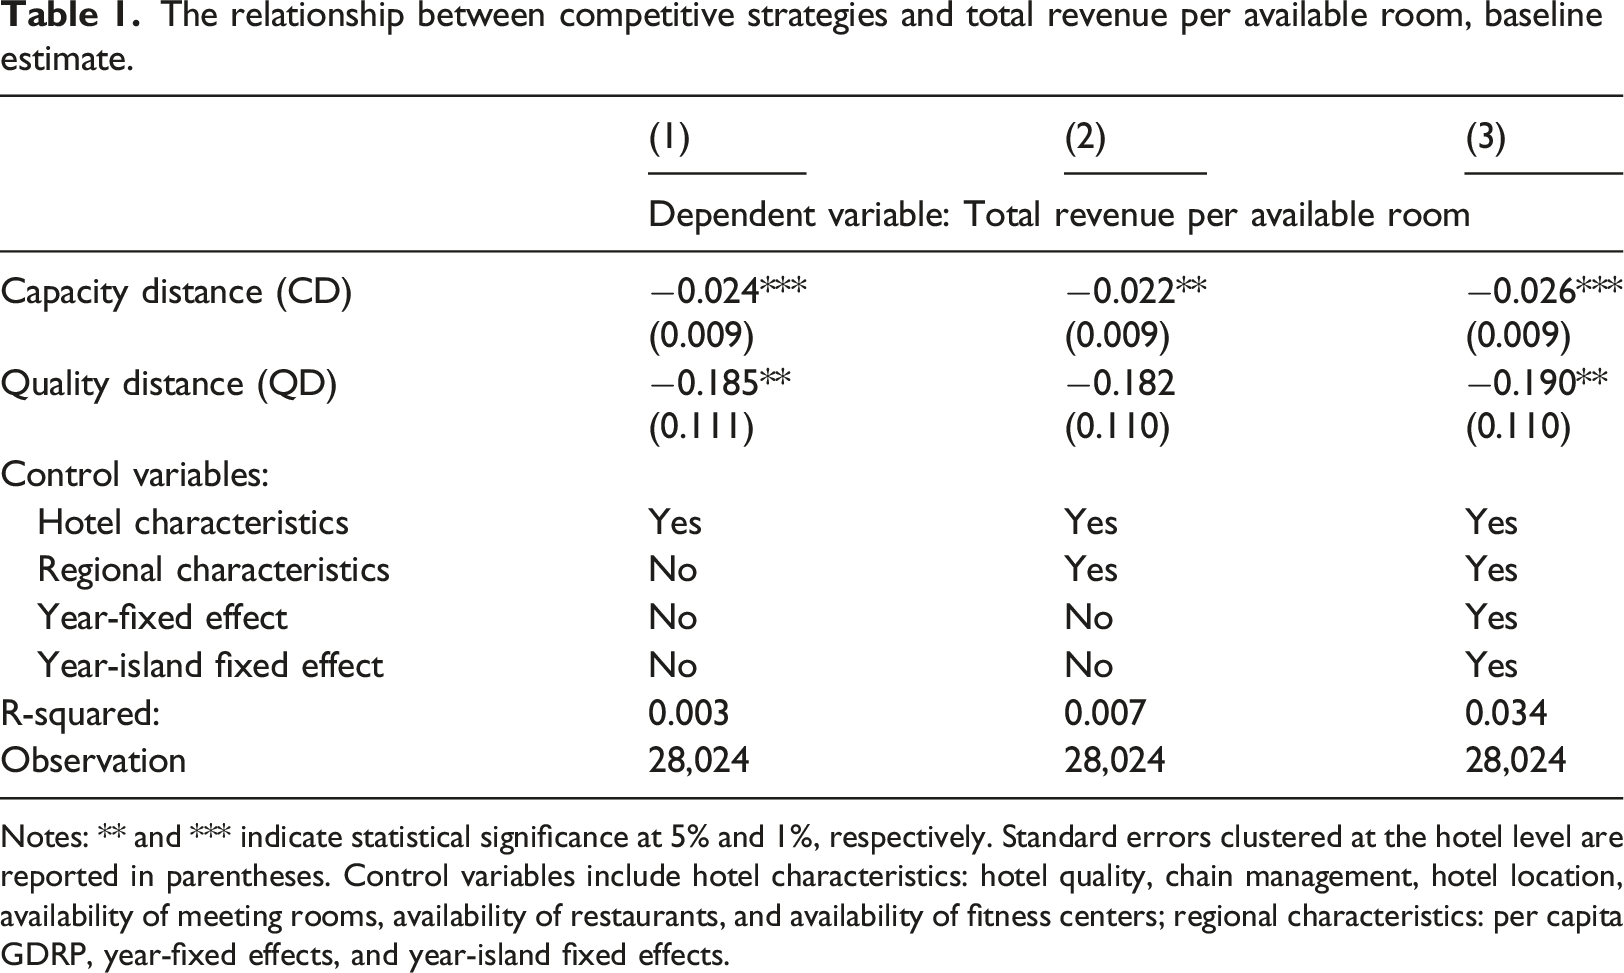
Notes: ** and *** indicate statistical significance at 5% and 1%, respectively. Standard errors clustered at the hotel level are reported in parentheses. Control variables include hotel characteristics: hotel quality, chain management, hotel location, availability of meeting rooms, availability of restaurants, and availability of fitness centers; regional characteristics: per capita GDRP, year-fixed effects, and year-island fixed effects.
We gradually introduced baseline controls in columns (1)–(3) based on equation (3) to determine the effect of competitive strategy on total revenue per available room. We begin the analysis using hotel characteristics as the control for individual characteristics in column (1). Column (2) includes regional characteristic as control variables. Column (3) adds the remaining island-year fixed effect to control for the unobserved effect of the island-year policy orientation. We grouped standard errors at the individual (hotel) level to address for potential heteroscedasticity and autocorrelation between hotels.
The coefficient on CDs in all columns is highly significant and remarkably stable. This coefficient only varies between 0.022 and 0.026 in negative signs. In column (1), it is equal to 0.024, which only includes the hotel’s characteristics as a control variable. Additionally, it equals 0.022 in column (2), which adds a regional characteristic, and 0.026 in column (3), which is a full specification. The coefficient on QDs ranges from 0.182 to 0.190 in negative signs. Although the coefficients tend to be stable, the coefficient in column (2) is insignificant.
The results in column (1) show a negative relationship between CD and total revenue per available room at a significance level of 1%. When the CD increases by 1%, it will cause the total revenue per available room to decrease by 0.02%. Our results also show a negative relationship between QD and total revenue per available room. It shows that every 1% increase in QD will decrease the total revenue per available room by 0.19%. The coefficient of QD is statistically significant at the 5% level. The conclusion drawn from column (1) is that when a hotel chooses to differentiate in capacity and quality, it will reduce its total revenue per available room.
The coefficient of CD in column (2) shows negative values and is significant at 5%. However, the coefficients of QD are negative and insignificant. It means insufficient evidence suggests a relationship between QD and total revenue per available room after controlling for the hotel and regional characteristics.
The result in column (3) shows a negative and significant coefficient of CD and QD of 0.03 and 0.19, respectively. It indicates that the total revenue per available room decreases by 0.03% and 0.19%, respectively, when the CD and QD increase by 1%. In other words, choosing different capacities or qualities from the 10 nearest competitors might decrease the total revenue per available room. The results are consistent with the Marshall–Arrow–Romer’s (MAR) theory, which states that companies will not benefit from innovating in a competitive environment. Companies will therefore achieve a higher performance by conformity with other hotels.
Potential mechanisms
The main result of this study is that having conformity in capacity and quality with the nearest hotel can increase the total hotel revenue per available room. We use Marshall’s theory of agglomeration to explain the potential mechanism that might occur in this relationship. Marshall (1920) stated that the benefits of agglomeration could occur through production enhancements and heightened demand.
The first mechanism to explain how competitive strategy affects hotel performance is through the benefits of agglomeration from the production side: labor pooling. Labor pooling increases the job-matching between firms and workers (Combes and Duranton, 2006). It could reduce labor turnover and increase labor productivity.
The paper assumes that hotels with similar capacities will have similar numbers of workers because the firm’s capacity is related to the number of workers. In equation (4), we calculate the labor distance between the focal hotel and its competitors as a variable representing labor pooling. Then we use the hotel’s total revenue per worker as a variable representing worker productivity.
Potential Mechanism: agglomeration yielding production enhancement and heightened demand.
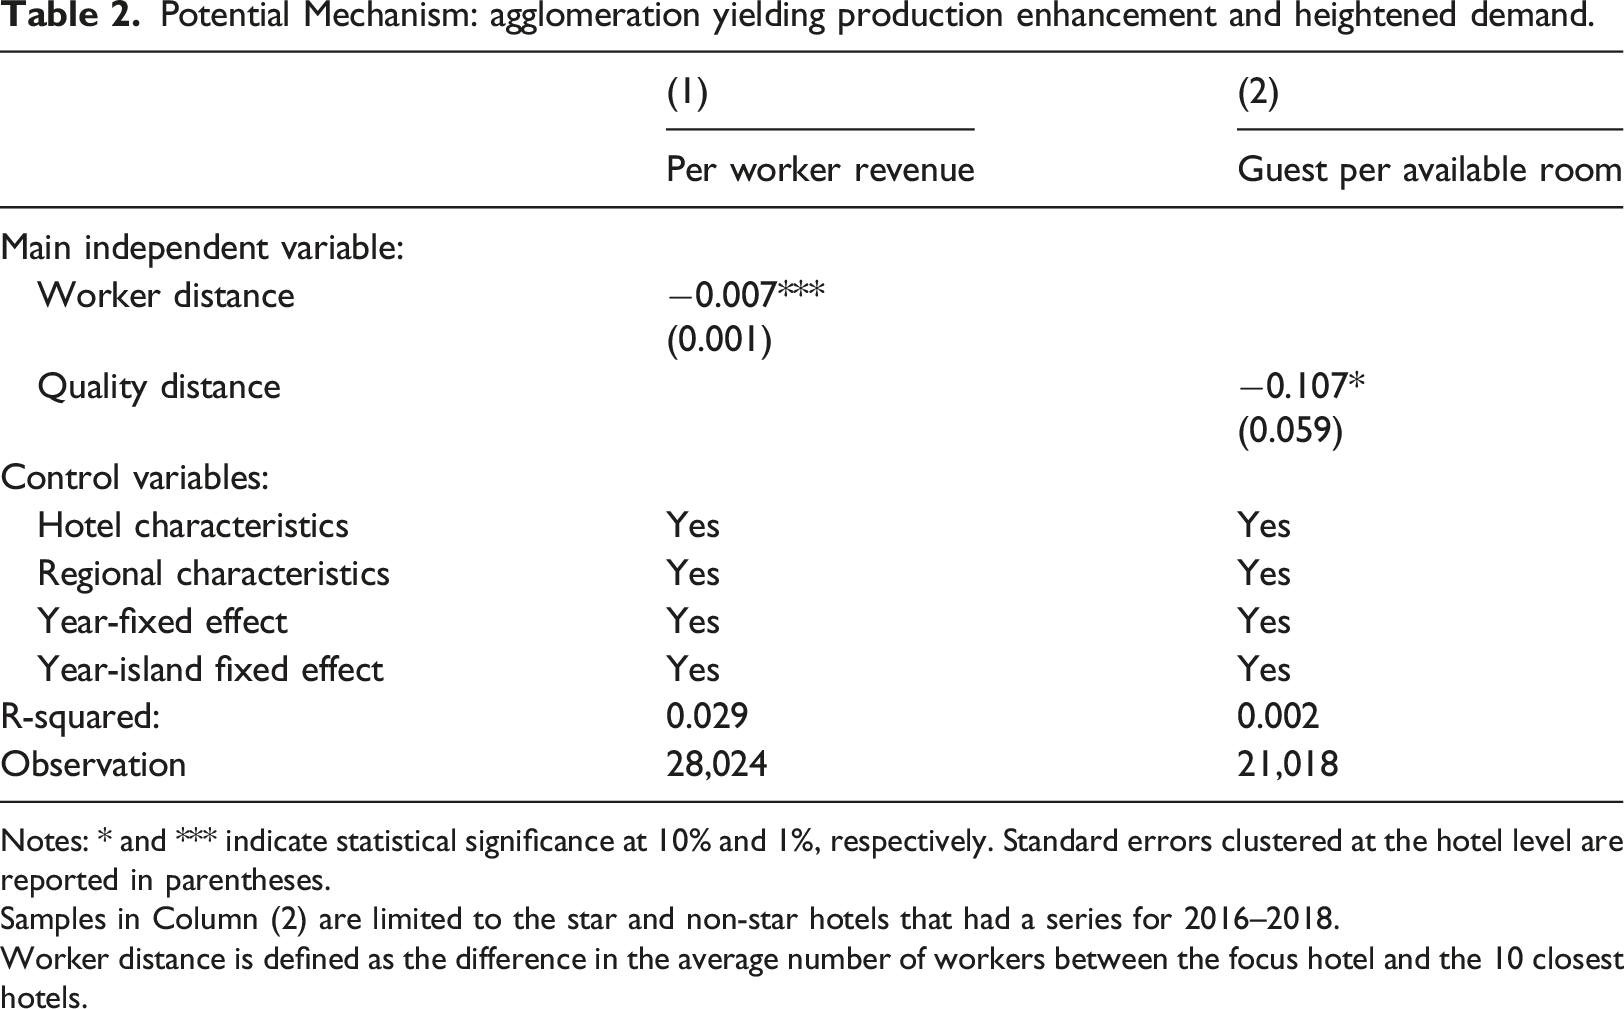
Notes: * and *** indicate statistical significance at 10% and 1%, respectively. Standard errors clustered at the hotel level are reported in parentheses.
Samples in Column (2) are limited to the star and non-star hotels that had a series for 2016–2018.
Worker distance is defined as the difference in the average number of workers between the focus hotel and the 10 closest hotels.
The second mechanism stems from the notion that co-location allows consumers to evaluate a variety of offerings without leaving an area (Chung and Kalnins, 2001). They can easily compare all the nearby hotels. They will look for a hotel that they think fits their preferences. If customers find their initial hotel is fully booked, they tend to look for the closest hotel with the same quality as the reference hotel. To support this argument, we empirically tested the effect of QD on the number of guests per available room based on equation (3). We suspect that the more similar the quality of the hotel to its closest competitors, the more guests per available room. Thus, when the number of guests staying increases, the total revenue per available room will likewise rise.
Column (2) of Table 2 shows that the QD coefficient is negative and significant, so there is a negative relationship between QD and the number of guests per available hotel room. This result is in line with the main finding. The hotels that are of a comparable quality to their neighbors will gain more guests, which will then increase the hotel’s total revenue.
Heterogeneity analysis
Our models suggest that competitive strategies are negatively associated with total revenue per available room. However, the results might be heterogeneous between sub-samples. We checked some sub-samples: hotel age, location, island, and hotels’ membership association.
The impact of competitive strategies on total revenue per available room by hotels’ age and location.
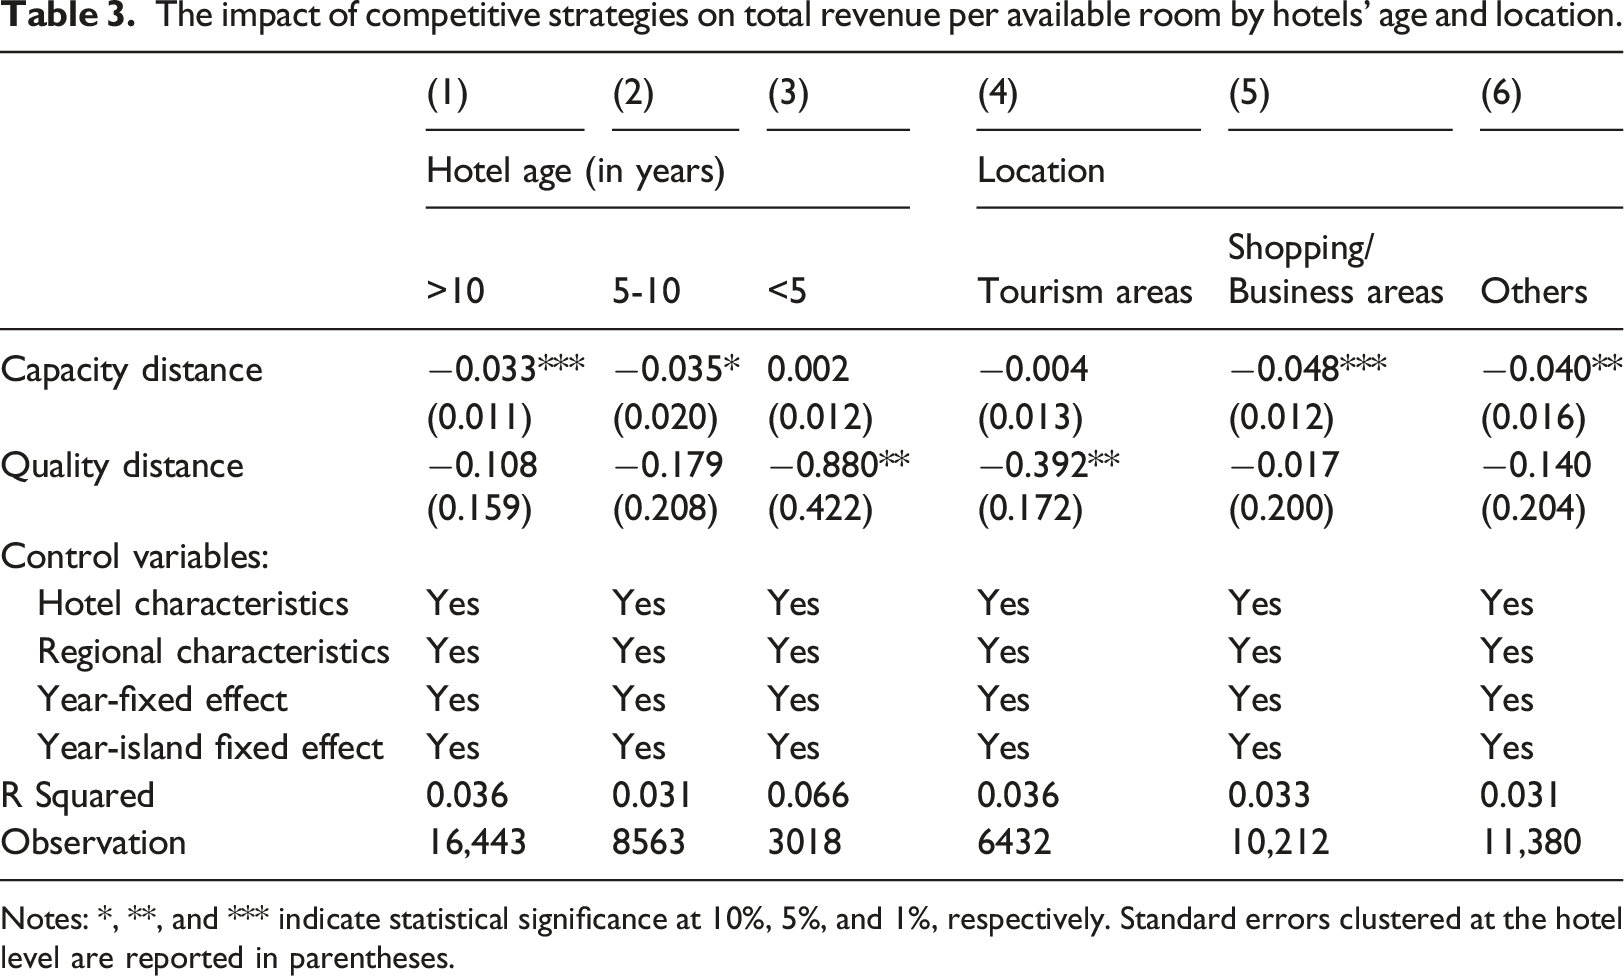
Notes: *, **, and *** indicate statistical significance at 10%, 5%, and 1%, respectively. Standard errors clustered at the hotel level are reported in parentheses.
We further estimate equation (3), which evaluates the impact of competitive strategy on hotel performance based on the hotel location to account for a certain degree of heterogeneity. We divide hotel locations into shopping/business, tourism, and others. Table 3, Columns (4)–(6) show that all CD coefficients are negative, but only significant for hotels located in shopping/business areas and others. In contrast, the QD coefficient is only significant for hotels in tourism areas. This difference in results may be due to differences in the characteristics of tourists visiting these locations.
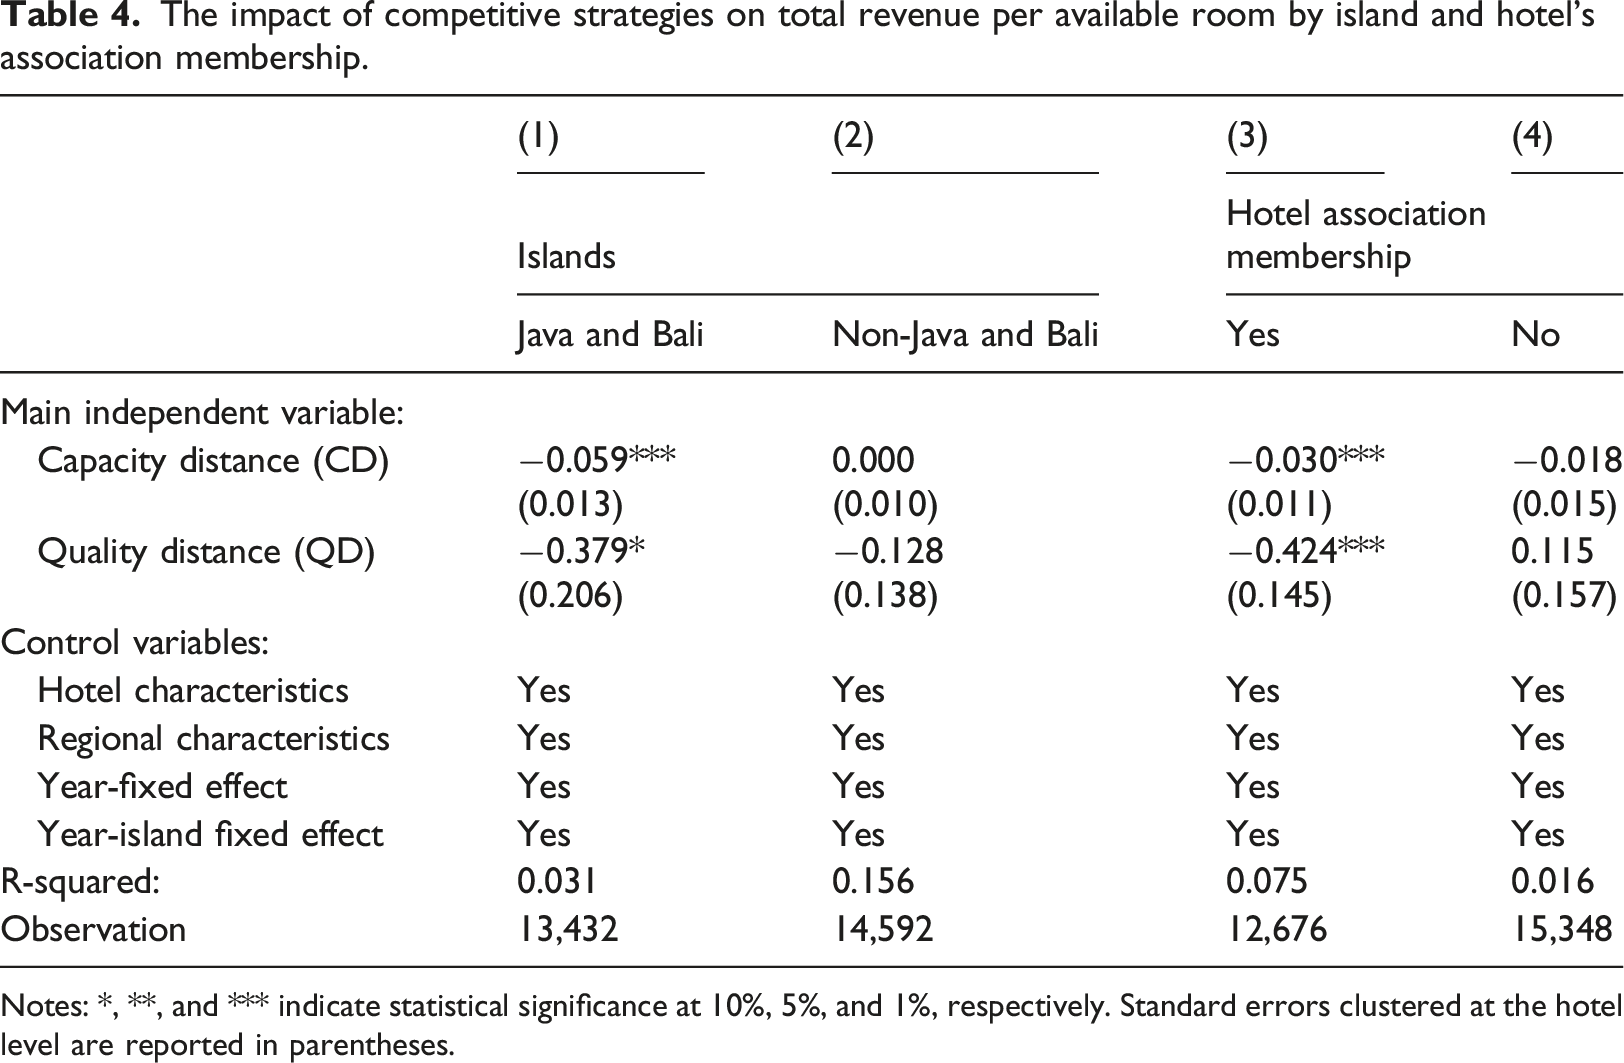
The impact of competitive strategies on total revenue per available room by island and hotel’s association membership.
Notes: *, **, and *** indicate statistical significance at 10%, 5%, and 1%, respectively. Standard errors clustered at the hotel level are reported in parentheses.
Possible explanations for these results are that in Java and Bali, the hotel is more accessible, and the availability of labor is greater than in other islands. Java and Bali are home to around 65% of Indonesia’s hotel employees (Statistics Indonesia, 2021a). As previously explained, a similar hotel capacity will require almost the same workforce. Ease of access and unification of the workforce facilitates knowledge spillover between hotels and encourages increased hotel productivity for hotels on the islands of Java and Bali.
This study checks the possibility of heterogeneity due to hotel association membership status. The Indonesian Hotel and Restaurant Association (IHRA) is a forum for businesspeople in the tourism sector. The common interest of this association is to create a business climate and maintain dignity and respect among business owners who focus on hospitality, restaurants, tours and travel, and hospitality education institutions in Indonesia.
The estimation results in Table 4 Columns (3) and (4) show that the competitive strategy is only significant for hotel group members of the IHRA. IHRA always coordinates with private business entities and the government to protect its members, so that hotel room occupancy rates remain controlled.
Robustness analysis: different competitive sets, hotel performance indicator alternative
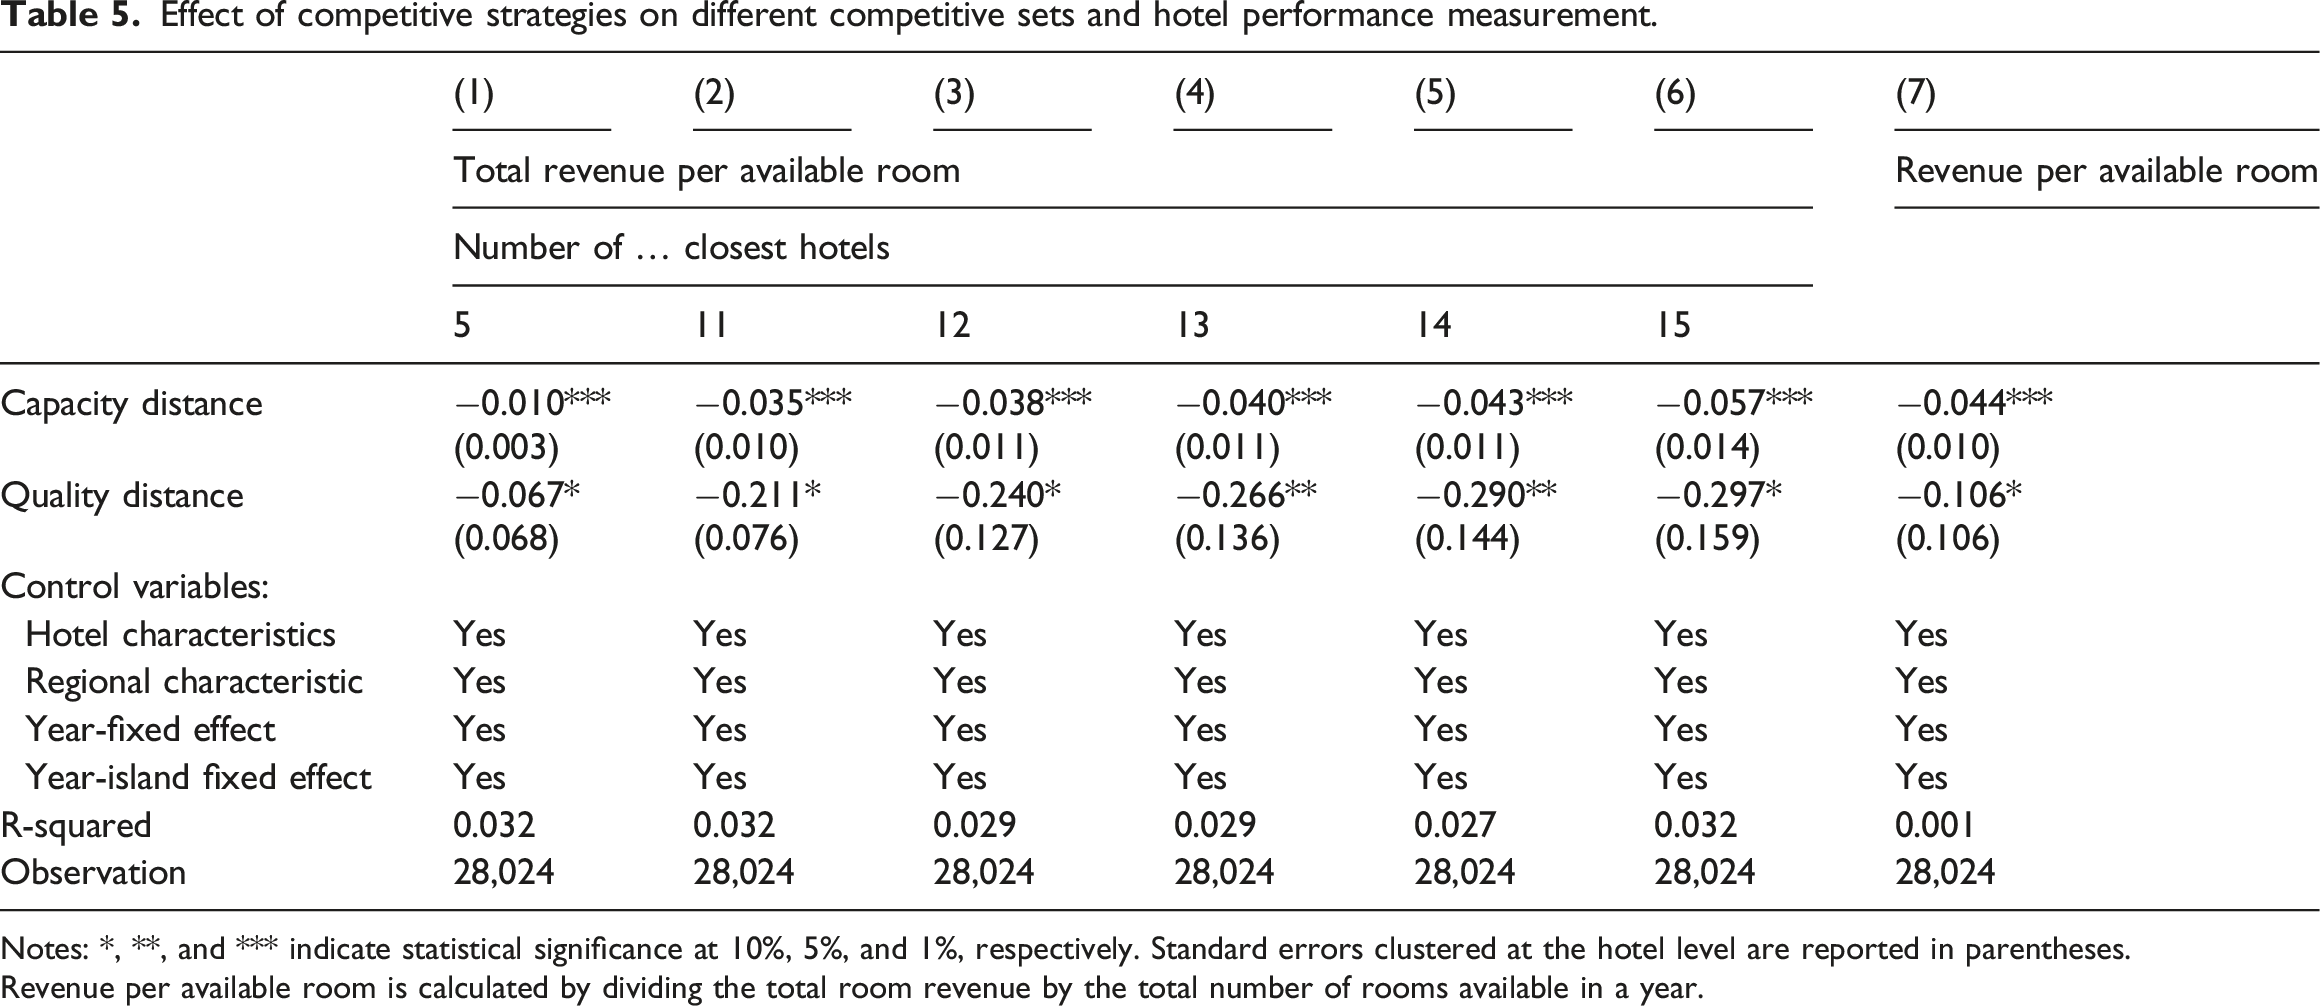
Effect of competitive strategies on different competitive sets and hotel performance measurement.
Notes: *, **, and *** indicate statistical significance at 10%, 5%, and 1%, respectively. Standard errors clustered at the hotel level are reported in parentheses.
Revenue per available room is calculated by dividing the total room revenue by the total number of rooms available in a year.
The coefficients of CD ranged from −0.010 to −0.057, which are significant at the 1% level. Meanwhile, the coefficient of QD ranged from −0.067 to −0.297 at 5% and 10% significance levels. The results broadly suggest that capacity and QDs negatively affect the total revenue per available room.
A recent study also tests our estimation using a different outcome in the model, that is, revenue per available room (Canina et al., 2005; Kim et al., 2020). Revenue per available room only calculates the revenue from the sales of hotel rooms. Column (7) of Table 5 suggests that the estimates remain consistent with the baseline results. The capacity and QD have negative and significant coefficients.
This paper also presents the results of additional robustness tests in Table 7. Column (1) shows the results of using CD and QD with the squared LD denominator. The QD variable is insignificant even though it has the same direction as the baseline result. We also conducted a robustness check using the hotel performance measure: profit per available room in Column (2). We obtain insignificant results even though they have the same direction as the coefficients with the baseline results. Column (3) provides a robustness test of the relationship between competitive strategy and total revenue per available room by excluding the 10% of hotels with the farthest average distance from other hotels. Tests show that our estimates are relatively strong.
Conclusions
Several studies identify empirical evidence on how hotel strategy relates to hotel performance (Becerra et al., 2013; Chung and Kalnins, 2001; S. K. Lee & Jang, 2017). However, research exploring the impact of how hotel strategy influences its performance is rare, especially in Indonesia, one of the top five countries that dominate the supply of hotel rooms in the Asia Pacific region. This study elaborates on previous research by examining potential mechanisms by which competitive strategy influences hotel performance.
A recent study used annual longitudinal hotel data from the 2016–2019 Indonesian accommodation survey to examine the relationship between competitive strategy and hotel performance. We apply the fixed effects method to accommodate unobservable time-invariant factors. The results show that hotels implementing a capacity or quality conformity strategy with neighboring hotels tend to have a higher total revenue per available room. The results are consistent with previous research, which found that differentiated hotels tend to have a lower performance (Kim et al., 2020). In addition, our research provides empirical evidence that there is a relationship between hotel strategy and hotel performance through agglomeration benefits: lower consumer search costs and labor pooling. This study also shows that the effect of conformity strategy is heterogeneous across hotel locations.
Our findings have policy implications. A new hotel must consider having a similar quality and capacity to neighboring hotels. The strategy’s effectiveness also depends on the location due to differences in market segmentation. Tourists visiting tourist attractions prioritize comfort and quality, while visitors to business centers prioritize hotel capacity. Regarding human resources, hoteliers can take advantage of labor pooling due to the proximity between hotels. Labor pooling will make it easier for hotels to find workers according to their needs, reducing employee search costs. When setting up a hotel-based economic zone, this study recommends that policymakers prioritize hotel agglomerations with similar characteristics. Policymakers can maintain a competitive environment between hotels, so each hotel can take advantage of the spillover effect and increase its productivity. The government should encourage hotels to join the IHRA to facilitate coordination between hotels and the government or the private sector. IHRA can monitor market trends and share information on emerging spillover opportunities with hotels. IHRA’s role in creating a positive climate and mutual respect causes spillover effects between hotels to run smoothly. Finally, improving the infrastructure and labor availability is necessary to improve the performance of hotels outside Java and Bali.
The following are the limitations of this study and suggestions for further research. First, the data we use does not include other types of accommodation, such as new accommodation, accommodation that stopped operating between study periods, hotel apartments, shared accommodation, and other small seasonal accommodations. Therefore, to improve the accuracy of the findings, future research can develop a dynamic model that includes all types of accommodation, including occasionally open and closed hotels. Second, the short research time, only 4 years, is due to the limitation of accurate location data (geotagging) and minimizing bias due to the impact of COVID-19. Further research can use monthly data to estimate longer timelines and capture seasonal effects. Third, we use the dimension of hotel quality based on stars, although there may be non-star hotels with comparable facilities to star hotels. Therefore, future research could change the quality measure based on the availability of facilities at the hotel.
Supplemental Material
Supplemental Material - Conformity or differentiation? The effect of competitive strategy on hotel performance
Supplemental Material for Conformity or differentiation? The effect of competitive strategy on hotel performance by Beta Septi Iryani, Muhammad Halley Yudhistira, Khoirunurrofik Khoirunurrofik, Djoni Hartono in Tourism Economics
Footnotes
Acknowledgements
Iryani acknowledges the Statistics Indonesia for providing financial support for this study. The authors are also grateful for the support of the PUTI Grant NKB-060/2022 of Universitas Indonesia. The funders had no role in the study design, data collection, data analysis, data interpretation or preparation of the manuscript.
Author contributions
Beta Septi Iryani: conceptualization and design, methodology, analysis and interpretation, writing-original draft.
Muhammad Halley Yudhistira: conceptualization and design, methodology, analysis and interpretation, writing-original draft.
Khoirunurrofik: conceptualization and design, methodology, analysis and interpretation.
Djoni Hartono: conceptualization and design, methodology, analysis and interpretation.
Declaration of conflicting interests
The author(s) declared no potential conflicts of interest with respect to the research, authorship, and/or publication of this article.
Funding
The author(s) disclosed receipt of the following financial support for the research, authorship, and/or publication of this article: This work was supported by the Universitas Indonesia (PUTI Grant NKB-060/2022 of University of Indonesia); (state budget scholarship BPS-Statistics Indonesia).
Supplemental Material
Supplemental material for this article is available online.
Author biographies
References
Supplementary Material
Please find the following supplemental material available below.
For Open Access articles published under a Creative Commons License, all supplemental material carries the same license as the article it is associated with.
For non-Open Access articles published, all supplemental material carries a non-exclusive license, and permission requests for re-use of supplemental material or any part of supplemental material shall be sent directly to the copyright owner as specified in the copyright notice associated with the article.